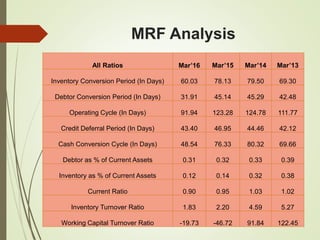
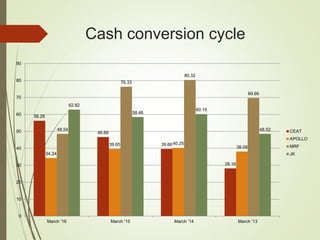
SlideShare a Scribd company logo
Financial Management Project
On
Working Capital Management
Prateek Chaubey-24021
Rahul Tanwar-24025
Saif Abbas-24029
Contents
 Introduction
 Financial Ratios
I. MRF
II. Apollo
III. Ceat
IV. JK
 Industry Analysis
 Conclusion
Introduction
 The industries considered are all part of
the Automotive Tyre Manufacturing
Sector.
 The Working Capital Analysis for the 4
companies has been carried out.
MRF Analysis
All Ratios Mar’16 Mar’15 Mar’14 Mar’13
Inventory Conversion Period (In Days) 60.03 78.13 79.50 69.30
Debtor Conversion Period (In Days) 31.91 45.14 45.29 42.48
Operating Cycle (In Days) 91.94 123.28 124.78 111.77
Credit Deferral Period (In Days) 43.40 46.95 44.46 42.12
Cash Conversion Cycle (In Days) 48.54 76.33 80.32 69.66
Debtor as % of Current Assets 0.31 0.32 0.33 0.39
Inventory as % of Current Assets 0.12 0.14 0.32 0.38
Current Ratio 0.90 0.95 1.03 1.02
Inventory Turnover Ratio 1.83 2.20 4.59 5.27
Working Capital Turnover Ratio -19.73 -46.72 91.84 122.45
Apollo Analysis
All Ratios Mar’16 Mar’15 Mar’14 Mar'13
Inventory Conversion Period (In Days) 80.72 79.05 74.90 66.63
Debtor Conversion Period (In days) 12.85 11.45 10.76 13.67
Operating Cycle (In Days) 93.57 90.50 85.66 80.30
Credit Deferral Period (In Days) 59.33 50.85 45.41 42.21
Cash Conversion Cycle(In Days) 34.24 39.65 40.25 38.09
Debtor as % of Current Assets 0.12 0.16 0.12 0.16
Inventory as % of Current Assets 0.44 0.59 0.63 0.65
Current Ratio 1.07 0.97 0.90 0.97
Inventory Turnover Ratio 4.52 4.62 4.87 5.48
Working Capital Turnover Ratio 58.15 -125.83 -38.38 -146.73
CEAT Analysis
Year/CCD Mar'16 Mar'15 Mar'14 Mar’13
Inventory Conversion Period (In Days) 74.51 72.28 65.78 60.03
Debtor Conversion Period (In Days) 41.35 45.13 46.06 46.67
Operating Cycle (In Days) 115.86 117.41 111.84 106.70
Credit Deferral Period (In Days) 59.60 70.74 72.19 78.54
Cash Conversion Cycle (In Days) 56.26 46.66 39.66 28.16
Debtor as % of Current Assets 0.40 0.34 0.43 0.46
Inventory as % of Current Assets 0.43 0.32 0.43 0.39
Current Ratio 1.21 1.29 0.90 0.76
Inventory Turnover Ratio 6.17 5.05 5.55 6.08
Working Capital Turnover Ratio 21.62 12.74 -27.62 -11.35
JK Analysis
All Ratios Mar’16 Mar’15 Mar’14 Mar’13
Inventory Conversion Period (In Days) 80.49 69.65 71.23 69.52
Debtor Conversion Period (In Days) 76.55 72.78 64.49 59.95
Operating Cycle (In Days) 157.04 142.42 135.73 129.47
Credit Deferral Period (In Days) 94.22 83.96 75.53 80.96
Cash Conversion Cycle (In Days) 62.82 58.46 60.19 48.52
Debtor as % of Current Assets 0.47 0.51 0.51 0.43
Inventory as % of Current Assets 0.29 0.30 0.32 0.38
Current Ratio 0.96 0.91 0.95 0.91
Inventory Turnover Ratio 4.53 5.24 5.12 5.25
Working Capital Turnover Ratio -54.66 -25.97 -49.52 -27.02
Cost of Rubber
(most produced product)
Product Name Value
% of RM cost
to Total Cost
MRF 5,708.62 51.14
Apollo Tyres 2,433.61 52.43
JK Tyre 1,753.07 52.96
Ceat 1,451.97 49.16
in Rs. Cr.
Competitors
Company
Name
Last Price Market Cap.
Sales
Turnover
Net Profit
Total
Assets
MRF 47,270.50 20,048.10 20,243.94 2,327.72 8,767.84
Apollo 180.85 9,205.71 8,701.64 844.86 4,582.72
JK 118.4 2,685.47 5,880.43 400.96 3,794.64
Ceat 1,161.05 4,696.46 5,494.15 452.52 2,603.13
Inventory conversion period
74.51
72.28
65.78
60.03
80.72
79.05
74.9
66.63
60.03
78.13
79.5
69.3
80.49
69.65
71.23
69.52
0
10
20
30
40
50
60
70
80
90
March '16 March '15 March '14 March '13
CEAT
APOLLO
MRF
JK
Debtor conversion period
41.35
45.13 46.06 46.67
12.85
11.45 10.76
13.67
31.91
45.14 45.29
42.48
76.55
72.78
64.49
59.95
0
10
20
30
40
50
60
70
80
90
March '16 March '15 March '14 March '13
CEAT
APOLLO
MRF
JK
Operating cycle
115.86 117.41
111.84
106.7
93.57
90.5
85.66
80.3
91.94
123.28 124.78
111.77
157.04
142.42
135.73
129.47
0
20
40
60
80
100
120
140
160
180
March '16 March '15 March '14 March '13
CEAT
APOLLO
MRF
JK
Credit deferral period
59.6
70.74
72.19
78.54
59.33
50.85
45.41
42.2143.4
46.95
44.46
42.12
94.22
83.96
75.53
80.96
0
10
20
30
40
50
60
70
80
90
100
March '16 March '15 March '14 March '13
CEAT
APOLLO
MRF
JK
Cash conversion cycle
56.26
46.66
39.66
28.16
34.24
39.65 40.25
38.09
48.54
76.33
80.32
69.66
62.82
58.46
60.19
48.52
0
10
20
30
40
50
60
70
80
90
March '16 March '15 March '14 March '13
CEAT
APOLLO
MRF
JK
Debtors as % of Current Assets
0.4
0.34
0.43
0.46
0.12
0.16
0.12
0.16
0.31
0.32
0.33
0.39
0.47
0.51
0.5
0.43
0
0.1
0.2
0.3
0.4
0.5
0.6
March '16 March '15 March '14 March '13
CEAT
APOLLO
MRF
JK
Inventory as % of Current Assets
0.43
0.32
0.43
0.39
0.44
0.59
0.63
0.65
0.12
0.14
0.32
0.38
0.29
0.3
0.32
0.38
0
0.1
0.2
0.3
0.4
0.5
0.6
0.7
March '16 March '15 March '14 March '13
CEAT
APOLLO
MRF
JK
Current Ratio
1.21
1.29
0.9
0.76
1.07
0.97
0.9
0.97
0.9
0.95
1.03 1.02
0.96
0.91
0.95
0.91
0
0.2
0.4
0.6
0.8
1
1.2
1.4
March '16 March '15 March '14 March '13
CEAT
APOLLO
MRF
JK
Inventory Turnover Ratio
6.17
5.05
5.55
6.08
4.52
4.62
4.87
5.48
1.83
2.2
4.59
5.27
4.53
5.24
5.12
5.25
0
1
2
3
4
5
6
7
March '16 March '15 March '14 March '13
CEAT
APOLLO
MRF
JK
Working capital turnover ratio
21.62
12.74
-27.62
-11.35
58.15
-125.83
-38.38
-146.73
-19.73
-46.72
91.84
122.45
-54.66
-25.97
-49.52
-27.02
-200
-150
-100
-50
0
50
100
150
March '16 March '15 March '14 March '13
CEAT
APOLLO
MRF
JK
COMPARISION OF FINANCIAL POSITION
COMPANY MRF Apollo Tyres Ceat JK Tyre & Ind
Year Mar '16 Mar '16 Mar '16 Mar '16
Sources Of Funds
Total Share Capital 4.24 50.9 40.45 45.36
Equity Share Capital 4.24 50.9 40.45 45.36
Share Application Money 0 0 0 0
Preference Share Capital 0 0 0 0
Reserves 6,790.09 3,942.38 1,950.81 1,371.31
Revaluation Reserves 0 3.12 0 0
Networth 6,794.33 3,996.40 1,991.26 1,416.67
Secured Loans 1,056.64 244.79 556.45 2,229.51
Unsecured Loans 916.87 341.51 55.43 148.46
Total Debt 1,973.51 586.3 611.88 2,377.97
Total Liabilities 8,767.84 4,582.70 2,603.14 3,794.64
Gross Block 8,125.62 5,153.74 2,832.25 5,216.38
Less: Accum. Depreciation 3,531.82 2,052.43 869.7 1,888.98
Net Block 4,593.80 3,101.31 1,962.55 3,327.40
Capital Work in Progress 1,058.40 386.87 213.45 88.92
Investments 2,789.31 793.75 267.9 91.59
Inventories 1,879.74 1,022.90 619.25 739.68
Sundry Debtors 1,831.72 292.76 577.94 1,210.48
Cash and Bank Balance 80.45 289.38 24.16 62.44
Total Current Assets 3,791.91 1,605.04 1,221.35 2,012.60
Loans and Advances 575.69 987.02 292.49 832.93
Fixed Deposits 0 0 0 0
Total CA, Loans & Advances 4,367.60 2,592.06 1,513.84 2,845.53
Deffered Credit 0 0 0 0
Current Liabilities 3,682.10 1,748.26 1,246.74 2,181.68
Provisions 359.17 543.01 107.87 377.12
Total CL & Provisions 4,041.27 2,291.27 1,354.61 2,558.80
Net Current Assets 326.33 300.79 159.23 286.73
Miscellaneous Expenses 0 0 0 0
Total Assets 8,767.84 4,582.72 2,603.13 3,794.64
Contingent Liabilities 1,062.61 563.18 548.9 100.68
Book Value (Rs) 16,020.04 78.45 492.28 62.46
Application Of Funds
Thank You

More Related Content

Similar to Working capital management - FM

Working capital management of wcl
Working capital management of wclWorking capital management of wcl
Working capital management of wcl
koach1787
 
Findings analysis & conclusion
Findings analysis & conclusionFindings analysis & conclusion
Findings analysis & conclusion
Ashish Aggarwal
 
10 yrs competitive analysis of lg balakrishnan
10 yrs competitive analysis of lg balakrishnan10 yrs competitive analysis of lg balakrishnan
10 yrs competitive analysis of lg balakrishnan
Karmveer Singh
 
Valuation Of ASHOK LEYLAND
Valuation Of ASHOK LEYLANDValuation Of ASHOK LEYLAND
Valuation Of ASHOK LEYLAND
Aakash Singh
 

Similar to Working capital management - FM (20)

Working capital management of wcl
Working capital management of wclWorking capital management of wcl
Working capital management of wcl
 
Findings analysis & conclusion
Findings analysis & conclusionFindings analysis & conclusion
Findings analysis & conclusion
 
TIL Limited. Financial Analysis Crane Manufacturing Company in India
TIL Limited. Financial Analysis Crane Manufacturing Company in IndiaTIL Limited. Financial Analysis Crane Manufacturing Company in India
TIL Limited. Financial Analysis Crane Manufacturing Company in India
 
Valuation of Indian hospitality industry
Valuation of Indian hospitality industryValuation of Indian hospitality industry
Valuation of Indian hospitality industry
 
Pantaloon 2008 2009
Pantaloon 2008 2009Pantaloon 2008 2009
Pantaloon 2008 2009
 
Yes bank balance sheet
Yes bank balance sheetYes bank balance sheet
Yes bank balance sheet
 
Excel Model for Valuation of Natural Gas Firm
Excel Model for Valuation of Natural Gas FirmExcel Model for Valuation of Natural Gas Firm
Excel Model for Valuation of Natural Gas Firm
 
ATS Company Reports: Accelya kale
ATS Company Reports: Accelya kaleATS Company Reports: Accelya kale
ATS Company Reports: Accelya kale
 
Bdm presentation template girbban
Bdm presentation template   girbbanBdm presentation template   girbban
Bdm presentation template girbban
 
ATS Company Reports: Eclerx
ATS Company Reports: EclerxATS Company Reports: Eclerx
ATS Company Reports: Eclerx
 
Destinations 20 year calendar performance
Destinations 20 year calendar performanceDestinations 20 year calendar performance
Destinations 20 year calendar performance
 
SAIL Ltd Fundamental Analysis
SAIL Ltd Fundamental AnalysisSAIL Ltd Fundamental Analysis
SAIL Ltd Fundamental Analysis
 
Tej vardhan sail_valuation
Tej vardhan sail_valuationTej vardhan sail_valuation
Tej vardhan sail_valuation
 
10 yrs competitive analysis of lg balakrishnan
10 yrs competitive analysis of lg balakrishnan10 yrs competitive analysis of lg balakrishnan
10 yrs competitive analysis of lg balakrishnan
 
Valuation Of ASHOK LEYLAND
Valuation Of ASHOK LEYLANDValuation Of ASHOK LEYLAND
Valuation Of ASHOK LEYLAND
 
Financial analysis of tata motors
Financial analysis of tata motorsFinancial analysis of tata motors
Financial analysis of tata motors
 
ASSIGNMENT OF SECURITY ANALYSIS AND PORTFOLIO MANAGEMENT.pdf
ASSIGNMENT OF SECURITY ANALYSIS AND PORTFOLIO MANAGEMENT.pdfASSIGNMENT OF SECURITY ANALYSIS AND PORTFOLIO MANAGEMENT.pdf
ASSIGNMENT OF SECURITY ANALYSIS AND PORTFOLIO MANAGEMENT.pdf
 
Monthly Review April-2023.pptx
Monthly Review April-2023.pptxMonthly Review April-2023.pptx
Monthly Review April-2023.pptx
 
Basic Hotel's Accounting Principles #12 Forecasting by Dino Leonandri
Basic Hotel's Accounting Principles  #12 Forecasting by Dino LeonandriBasic Hotel's Accounting Principles  #12 Forecasting by Dino Leonandri
Basic Hotel's Accounting Principles #12 Forecasting by Dino Leonandri
 
Hotel's Basic Accounting Principles #13 by Dino Leonandri
Hotel's Basic Accounting Principles  #13 by Dino LeonandriHotel's Basic Accounting Principles  #13 by Dino Leonandri
Hotel's Basic Accounting Principles #13 by Dino Leonandri
 

More from Rahul Tanwar

More from Rahul Tanwar (17)

Sales Learning Curve - Sales Management
Sales Learning Curve - Sales ManagementSales Learning Curve - Sales Management
Sales Learning Curve - Sales Management
 
Sales Force Automation - Sales Management Approach
Sales Force Automation - Sales Management ApproachSales Force Automation - Sales Management Approach
Sales Force Automation - Sales Management Approach
 
Integrated Marketing communication - Lowe Lintas
Integrated Marketing communication - Lowe LintasIntegrated Marketing communication - Lowe Lintas
Integrated Marketing communication - Lowe Lintas
 
E bidding and e-tendering
E bidding and e-tenderingE bidding and e-tendering
E bidding and e-tendering
 
Brand Track - DLF
Brand Track - DLFBrand Track - DLF
Brand Track - DLF
 
Research questionnaire
Research questionnaireResearch questionnaire
Research questionnaire
 
Industry visit - operation management
Industry visit - operation managementIndustry visit - operation management
Industry visit - operation management
 
Solar panel
Solar panelSolar panel
Solar panel
 
Marketing audit - nestle
Marketing audit - nestleMarketing audit - nestle
Marketing audit - nestle
 
Networking & tele communication
Networking & tele communicationNetworking & tele communication
Networking & tele communication
 
Credit manager job profile
Credit manager   job profileCredit manager   job profile
Credit manager job profile
 
International business
International businessInternational business
International business
 
Organisation citizenship behaviour (ocb)
Organisation citizenship behaviour (ocb)Organisation citizenship behaviour (ocb)
Organisation citizenship behaviour (ocb)
 
Business ethics world vision india (ngo)
Business ethics   world vision india (ngo)Business ethics   world vision india (ngo)
Business ethics world vision india (ngo)
 
Appointment of directors ca,2013
Appointment of directors   ca,2013Appointment of directors   ca,2013
Appointment of directors ca,2013
 
Bc graphology (handwriting)
Bc   graphology (handwriting)Bc   graphology (handwriting)
Bc graphology (handwriting)
 
Global warming
Global warmingGlobal warming
Global warming
 

Recently uploaded

一比一原版Adelaide毕业证阿德莱德大学毕业证成绩单如何办理
一比一原版Adelaide毕业证阿德莱德大学毕业证成绩单如何办理一比一原版Adelaide毕业证阿德莱德大学毕业证成绩单如何办理
一比一原版Adelaide毕业证阿德莱德大学毕业证成绩单如何办理
zsewypy
 
一比一原版UO毕业证渥太华大学毕业证成绩单如何办理
一比一原版UO毕业证渥太华大学毕业证成绩单如何办理一比一原版UO毕业证渥太华大学毕业证成绩单如何办理
一比一原版UO毕业证渥太华大学毕业证成绩单如何办理
yonemuk
 
Monthly Economic Monitoring of Ukraine No. 232, May 2024
Monthly Economic Monitoring of Ukraine No. 232, May 2024Monthly Economic Monitoring of Ukraine No. 232, May 2024
PD ARRAY THEORY FOR INTERMEDIATE (1).pdf
PD ARRAY THEORY FOR INTERMEDIATE (1).pdfPD ARRAY THEORY FOR INTERMEDIATE (1).pdf
PD ARRAY THEORY FOR INTERMEDIATE (1).pdf
JerrySMaliki
 
NO1 Uk Divorce problem uk all amil baba in karachi,lahore,pakistan talaq ka m...
NO1 Uk Divorce problem uk all amil baba in karachi,lahore,pakistan talaq ka m...NO1 Uk Divorce problem uk all amil baba in karachi,lahore,pakistan talaq ka m...
NO1 Uk Divorce problem uk all amil baba in karachi,lahore,pakistan talaq ka m...
Amil Baba Dawood bangali
 
一比一原版BCU毕业证伯明翰城市大学毕业证成绩单如何办理
一比一原版BCU毕业证伯明翰城市大学毕业证成绩单如何办理一比一原版BCU毕业证伯明翰城市大学毕业证成绩单如何办理
一比一原版BCU毕业证伯明翰城市大学毕业证成绩单如何办理
ydubwyt
 
Introduction to Economics II Chapter 28 Unemployment (1).pdf
Introduction to Economics II Chapter 28 Unemployment (1).pdfIntroduction to Economics II Chapter 28 Unemployment (1).pdf
Introduction to Economics II Chapter 28 Unemployment (1).pdf
Safa444074
 

Recently uploaded (20)

The new type of smart, sustainable entrepreneurship and the next day | Europe...
The new type of smart, sustainable entrepreneurship and the next day | Europe...The new type of smart, sustainable entrepreneurship and the next day | Europe...
The new type of smart, sustainable entrepreneurship and the next day | Europe...
 
一比一原版Adelaide毕业证阿德莱德大学毕业证成绩单如何办理
一比一原版Adelaide毕业证阿德莱德大学毕业证成绩单如何办理一比一原版Adelaide毕业证阿德莱德大学毕业证成绩单如何办理
一比一原版Adelaide毕业证阿德莱德大学毕业证成绩单如何办理
 
how can i trade pi coins for Bitcoin easily.
how can i trade pi coins for Bitcoin easily.how can i trade pi coins for Bitcoin easily.
how can i trade pi coins for Bitcoin easily.
 
一比一原版UO毕业证渥太华大学毕业证成绩单如何办理
一比一原版UO毕业证渥太华大学毕业证成绩单如何办理一比一原版UO毕业证渥太华大学毕业证成绩单如何办理
一比一原版UO毕业证渥太华大学毕业证成绩单如何办理
 
Monthly Economic Monitoring of Ukraine No. 232, May 2024
Monthly Economic Monitoring of Ukraine No. 232, May 2024Monthly Economic Monitoring of Ukraine No. 232, May 2024
Monthly Economic Monitoring of Ukraine No. 232, May 2024
 
how do I get a legit pi buyer in the internet (2024)
how do I get a legit pi buyer in the internet (2024)how do I get a legit pi buyer in the internet (2024)
how do I get a legit pi buyer in the internet (2024)
 
where can I sell pi coins at the best rate (Market Price)
where can I sell pi coins at the best rate (Market Price)where can I sell pi coins at the best rate (Market Price)
where can I sell pi coins at the best rate (Market Price)
 
PD ARRAY THEORY FOR INTERMEDIATE (1).pdf
PD ARRAY THEORY FOR INTERMEDIATE (1).pdfPD ARRAY THEORY FOR INTERMEDIATE (1).pdf
PD ARRAY THEORY FOR INTERMEDIATE (1).pdf
 
how can I sell/buy bulk pi coins securely
how can I sell/buy bulk pi coins securelyhow can I sell/buy bulk pi coins securely
how can I sell/buy bulk pi coins securely
 
how to sell pi coins in Canada, Uk and Australia
how to sell pi coins in Canada, Uk and Australiahow to sell pi coins in Canada, Uk and Australia
how to sell pi coins in Canada, Uk and Australia
 
how to sell pi coins at high rate quickly.
how to sell pi coins at high rate quickly.how to sell pi coins at high rate quickly.
how to sell pi coins at high rate quickly.
 
NO1 Uk Divorce problem uk all amil baba in karachi,lahore,pakistan talaq ka m...
NO1 Uk Divorce problem uk all amil baba in karachi,lahore,pakistan talaq ka m...NO1 Uk Divorce problem uk all amil baba in karachi,lahore,pakistan talaq ka m...
NO1 Uk Divorce problem uk all amil baba in karachi,lahore,pakistan talaq ka m...
 
Falcon Invoice Discounting: Optimizing Returns with Minimal Risk
Falcon Invoice Discounting: Optimizing Returns with Minimal RiskFalcon Invoice Discounting: Optimizing Returns with Minimal Risk
Falcon Invoice Discounting: Optimizing Returns with Minimal Risk
 
一比一原版BCU毕业证伯明翰城市大学毕业证成绩单如何办理
一比一原版BCU毕业证伯明翰城市大学毕业证成绩单如何办理一比一原版BCU毕业证伯明翰城市大学毕业证成绩单如何办理
一比一原版BCU毕业证伯明翰城市大学毕业证成绩单如何办理
 
Proposer Builder Separation Problem in Ethereum
Proposer Builder Separation Problem in EthereumProposer Builder Separation Problem in Ethereum
Proposer Builder Separation Problem in Ethereum
 
how can I sell my locked pi coins safety.
how can I sell my locked pi coins safety.how can I sell my locked pi coins safety.
how can I sell my locked pi coins safety.
 
Indirect tax .pptx Supply under GST, Charges of GST
Indirect tax .pptx  Supply under GST, Charges of GSTIndirect tax .pptx  Supply under GST, Charges of GST
Indirect tax .pptx Supply under GST, Charges of GST
 
Introduction to Economics II Chapter 28 Unemployment (1).pdf
Introduction to Economics II Chapter 28 Unemployment (1).pdfIntroduction to Economics II Chapter 28 Unemployment (1).pdf
Introduction to Economics II Chapter 28 Unemployment (1).pdf
 
Introduction to Economics II Chapter 25 Production and Growth.pdf
Introduction to Economics II Chapter 25 Production and Growth.pdfIntroduction to Economics II Chapter 25 Production and Growth.pdf
Introduction to Economics II Chapter 25 Production and Growth.pdf
 
when officially can i withdraw my pi Network coins.
when officially can i withdraw my pi Network coins.when officially can i withdraw my pi Network coins.
when officially can i withdraw my pi Network coins.
 

Working capital management - FM

  • 1. Financial Management Project On Working Capital Management Prateek Chaubey-24021 Rahul Tanwar-24025 Saif Abbas-24029
  • 2. Contents  Introduction  Financial Ratios I. MRF II. Apollo III. Ceat IV. JK  Industry Analysis  Conclusion
  • 3. Introduction  The industries considered are all part of the Automotive Tyre Manufacturing Sector.  The Working Capital Analysis for the 4 companies has been carried out.
  • 4. MRF Analysis All Ratios Mar’16 Mar’15 Mar’14 Mar’13 Inventory Conversion Period (In Days) 60.03 78.13 79.50 69.30 Debtor Conversion Period (In Days) 31.91 45.14 45.29 42.48 Operating Cycle (In Days) 91.94 123.28 124.78 111.77 Credit Deferral Period (In Days) 43.40 46.95 44.46 42.12 Cash Conversion Cycle (In Days) 48.54 76.33 80.32 69.66 Debtor as % of Current Assets 0.31 0.32 0.33 0.39 Inventory as % of Current Assets 0.12 0.14 0.32 0.38 Current Ratio 0.90 0.95 1.03 1.02 Inventory Turnover Ratio 1.83 2.20 4.59 5.27 Working Capital Turnover Ratio -19.73 -46.72 91.84 122.45
  • 5. Apollo Analysis All Ratios Mar’16 Mar’15 Mar’14 Mar'13 Inventory Conversion Period (In Days) 80.72 79.05 74.90 66.63 Debtor Conversion Period (In days) 12.85 11.45 10.76 13.67 Operating Cycle (In Days) 93.57 90.50 85.66 80.30 Credit Deferral Period (In Days) 59.33 50.85 45.41 42.21 Cash Conversion Cycle(In Days) 34.24 39.65 40.25 38.09 Debtor as % of Current Assets 0.12 0.16 0.12 0.16 Inventory as % of Current Assets 0.44 0.59 0.63 0.65 Current Ratio 1.07 0.97 0.90 0.97 Inventory Turnover Ratio 4.52 4.62 4.87 5.48 Working Capital Turnover Ratio 58.15 -125.83 -38.38 -146.73
  • 6. CEAT Analysis Year/CCD Mar'16 Mar'15 Mar'14 Mar’13 Inventory Conversion Period (In Days) 74.51 72.28 65.78 60.03 Debtor Conversion Period (In Days) 41.35 45.13 46.06 46.67 Operating Cycle (In Days) 115.86 117.41 111.84 106.70 Credit Deferral Period (In Days) 59.60 70.74 72.19 78.54 Cash Conversion Cycle (In Days) 56.26 46.66 39.66 28.16 Debtor as % of Current Assets 0.40 0.34 0.43 0.46 Inventory as % of Current Assets 0.43 0.32 0.43 0.39 Current Ratio 1.21 1.29 0.90 0.76 Inventory Turnover Ratio 6.17 5.05 5.55 6.08 Working Capital Turnover Ratio 21.62 12.74 -27.62 -11.35
  • 7. JK Analysis All Ratios Mar’16 Mar’15 Mar’14 Mar’13 Inventory Conversion Period (In Days) 80.49 69.65 71.23 69.52 Debtor Conversion Period (In Days) 76.55 72.78 64.49 59.95 Operating Cycle (In Days) 157.04 142.42 135.73 129.47 Credit Deferral Period (In Days) 94.22 83.96 75.53 80.96 Cash Conversion Cycle (In Days) 62.82 58.46 60.19 48.52 Debtor as % of Current Assets 0.47 0.51 0.51 0.43 Inventory as % of Current Assets 0.29 0.30 0.32 0.38 Current Ratio 0.96 0.91 0.95 0.91 Inventory Turnover Ratio 4.53 5.24 5.12 5.25 Working Capital Turnover Ratio -54.66 -25.97 -49.52 -27.02
  • 8. Cost of Rubber (most produced product) Product Name Value % of RM cost to Total Cost MRF 5,708.62 51.14 Apollo Tyres 2,433.61 52.43 JK Tyre 1,753.07 52.96 Ceat 1,451.97 49.16 in Rs. Cr.
  • 9. Competitors Company Name Last Price Market Cap. Sales Turnover Net Profit Total Assets MRF 47,270.50 20,048.10 20,243.94 2,327.72 8,767.84 Apollo 180.85 9,205.71 8,701.64 844.86 4,582.72 JK 118.4 2,685.47 5,880.43 400.96 3,794.64 Ceat 1,161.05 4,696.46 5,494.15 452.52 2,603.13
  • 11. Debtor conversion period 41.35 45.13 46.06 46.67 12.85 11.45 10.76 13.67 31.91 45.14 45.29 42.48 76.55 72.78 64.49 59.95 0 10 20 30 40 50 60 70 80 90 March '16 March '15 March '14 March '13 CEAT APOLLO MRF JK
  • 12. Operating cycle 115.86 117.41 111.84 106.7 93.57 90.5 85.66 80.3 91.94 123.28 124.78 111.77 157.04 142.42 135.73 129.47 0 20 40 60 80 100 120 140 160 180 March '16 March '15 March '14 March '13 CEAT APOLLO MRF JK
  • 14. Cash conversion cycle 56.26 46.66 39.66 28.16 34.24 39.65 40.25 38.09 48.54 76.33 80.32 69.66 62.82 58.46 60.19 48.52 0 10 20 30 40 50 60 70 80 90 March '16 March '15 March '14 March '13 CEAT APOLLO MRF JK
  • 15. Debtors as % of Current Assets 0.4 0.34 0.43 0.46 0.12 0.16 0.12 0.16 0.31 0.32 0.33 0.39 0.47 0.51 0.5 0.43 0 0.1 0.2 0.3 0.4 0.5 0.6 March '16 March '15 March '14 March '13 CEAT APOLLO MRF JK
  • 16. Inventory as % of Current Assets 0.43 0.32 0.43 0.39 0.44 0.59 0.63 0.65 0.12 0.14 0.32 0.38 0.29 0.3 0.32 0.38 0 0.1 0.2 0.3 0.4 0.5 0.6 0.7 March '16 March '15 March '14 March '13 CEAT APOLLO MRF JK
  • 19. Working capital turnover ratio 21.62 12.74 -27.62 -11.35 58.15 -125.83 -38.38 -146.73 -19.73 -46.72 91.84 122.45 -54.66 -25.97 -49.52 -27.02 -200 -150 -100 -50 0 50 100 150 March '16 March '15 March '14 March '13 CEAT APOLLO MRF JK
  • 20.
  • 21. COMPARISION OF FINANCIAL POSITION COMPANY MRF Apollo Tyres Ceat JK Tyre & Ind Year Mar '16 Mar '16 Mar '16 Mar '16 Sources Of Funds Total Share Capital 4.24 50.9 40.45 45.36 Equity Share Capital 4.24 50.9 40.45 45.36 Share Application Money 0 0 0 0 Preference Share Capital 0 0 0 0 Reserves 6,790.09 3,942.38 1,950.81 1,371.31 Revaluation Reserves 0 3.12 0 0 Networth 6,794.33 3,996.40 1,991.26 1,416.67 Secured Loans 1,056.64 244.79 556.45 2,229.51 Unsecured Loans 916.87 341.51 55.43 148.46 Total Debt 1,973.51 586.3 611.88 2,377.97 Total Liabilities 8,767.84 4,582.70 2,603.14 3,794.64 Gross Block 8,125.62 5,153.74 2,832.25 5,216.38 Less: Accum. Depreciation 3,531.82 2,052.43 869.7 1,888.98 Net Block 4,593.80 3,101.31 1,962.55 3,327.40 Capital Work in Progress 1,058.40 386.87 213.45 88.92 Investments 2,789.31 793.75 267.9 91.59 Inventories 1,879.74 1,022.90 619.25 739.68 Sundry Debtors 1,831.72 292.76 577.94 1,210.48 Cash and Bank Balance 80.45 289.38 24.16 62.44 Total Current Assets 3,791.91 1,605.04 1,221.35 2,012.60 Loans and Advances 575.69 987.02 292.49 832.93 Fixed Deposits 0 0 0 0 Total CA, Loans & Advances 4,367.60 2,592.06 1,513.84 2,845.53 Deffered Credit 0 0 0 0 Current Liabilities 3,682.10 1,748.26 1,246.74 2,181.68 Provisions 359.17 543.01 107.87 377.12 Total CL & Provisions 4,041.27 2,291.27 1,354.61 2,558.80 Net Current Assets 326.33 300.79 159.23 286.73 Miscellaneous Expenses 0 0 0 0 Total Assets 8,767.84 4,582.72 2,603.13 3,794.64 Contingent Liabilities 1,062.61 563.18 548.9 100.68 Book Value (Rs) 16,020.04 78.45 492.28 62.46 Application Of Funds