Download to read offline


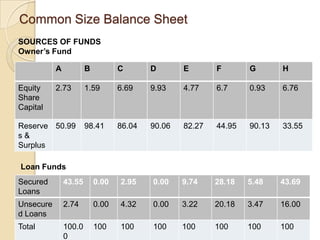
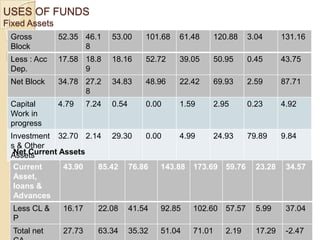
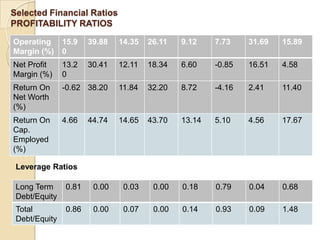
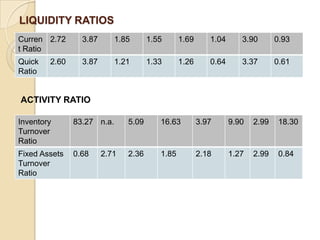


This document provides a common size balance sheet and selected financial ratios for companies A through H. It then analyzes each company based on their balance sheet and ratio figures. Some key highlights include: Company A (Indian Hotels) has high reserves, secured loans, fixed assets, and current assets. Company B (Infosys) has huge cash reserves and surplus with negligible inventory. Company C (Ranbaxy) has high reserves for R&D and fixed assets for production. Company D (P&G) has large reserves, gross block of assets, and current assets/liabilities. Company F (Tata) relies on external funding and has high interest expenses. Company G (Zee TV) is a service sector with


