SlideShare a Scribd company logo
1 of 32
Download to read offline
• 390 N Broadway, Jericho, NY, 11753 • (516) 882-4100 1
International Company Overviews
1H 2017
Company Comparison……………………………………………………….…………………………………..…Page 2
Acciona, S.A.….…………………………………………….………………………………….…………………….Page 3-6
Grupo ACS (ACS)……..……................................................................................................................…Page 7-10
Ferrovial……..…….....................................................................................................................................Page 11-14
OHL…..……..............................................................................................................................................…Page 15-18
Sacyr Vallehermoso, S.A. (Sacyr)………………..…………….................................................……Page 19-22
Skanska………………………………...…………………………..…………………………………………...…Page 23-26
Vinci……………………………………...…………………………..…………………………………………...…Page 27-30
Services Overview – Star America………………………………………………………..…………….…..Page 31
WWW.STARAMERICAP.COM
Strict Focus on Infrastructure
• Management has years of
experience advising clients in the
Infrastructure Industry
• Unique experience as a partner
and advisor to many of the largest
U.S. Based and International
clients
Corporate Advisory Services
• Buy Side M&A Services
• Sell Side M&A Services
• Strategic Consulting
• Financial Analysis &
Restructuring
• Executive Placement
Project Advisory Services
• DBF Advisory Services
• Project Finance Advisory
• Project team development
services
• Outsourced Business
Development
• Subcontractor vetting & analysis
services
About Star America
• 390 N Broadway, Jericho, NY, 11753 • (516) 882-4100 2
€ Millions € Millions € Millions € Millions € Millions SEK Millions € Millions
Operating Metrics*
LTM Revenue 6,520 33,670 12,128 4,512 3,072 148,744 39,583
Operating Income Margin 6.0% 4.0% 9.7% 3.6% 7.4% 4.0% 10.8%
EBITDA Margin 19.1% 6.4% 13.6% 7.9% 12.5% 5.3% 16.0%
Construction Backlog 17,677 65,199 31,611 70,823 30,164 202,200 30,700
Construction Backlog Months 32.5x 23.2x 31.3x 188.4x 117.8x 16.3x 9.3x
Construction Book-To-Bill 1.2x 1.1x 0.6x (0.8x) 2.2x 1.2x 1.0x
Enterprise Value 10,280 14,985 19,141 6,119 4,560 82,961 62,342
Market Cap. 4,245 10,302 13,757 1,050 1,160 75,627 45,613
Trading Metrics**
Enterprise Value-To-Revenue 1.6x 0.4x 1.6x 1.4x 1.5x 0.6x 1.6x
Enterprise Value-To-EBITDA 8.2x 6.8x 11.7x 17.2x 11.8x 10.3x 9.9x
Price-To-Book 1.1x 2.0x 2.0x 0.2x 0.6x 2.6x 2.7x
Company Comparison
* Operating Metrics based on 6/30/17
** Trading Metrics based on 30 day average as of 8/23/17
WWW.STARAMERICAP.COM
0.0%
5.0%
10.0%
15.0%
20.0%
25.0%
Acciona ACS Ferrovial OHL Sacyr Skanska Vinci
Operating Income Margin EBITDA Margin
• 390 N Broadway, Jericho, NY, 11753 • (516) 882-4100 3
Company Snapshot - Acciona
Price/ Volume
Valuation Multiples
30-Day Avg. Share Price (as of 9/8/17) 72.40
52-Week High 82.84
52-Week Low 60.61
Market Cap 4,145,324
Total Debt 6,991,000
Minority Interest 248,000
Total Cash 1,204,000
Enterprise Value 10,180,324
Book Value 3,922,000
Goodwill & Intangibles 536,105
Tangible Book Value 3,385,895
(In € Millions) 2012 2013 2014 2015 2016
Total Revenue 7,015 6,607 6,498 6,543 5,977
Income Overview
2014 2015 2016 2Q2017
Backlog (€ Millions) 15,051 10,258 18,609 17,677
Backlog Months 27.8x 18.8x 37.4x 32.5x
Book-To-Bill 0.9x 0.3x 2.4x 1.2x
Enterprise Value / Revenue 1.5x 1.5x 1.6x 1.6x
Enterprise Value / EBITDA 9.0x 8.3x 8.2x 8.2x
Enterprise Value / EBIT 17.2x 15.6x 9.9x 26.1x
Price / Earnings 19.1x 16.7x 11.2x N/A
Price / Book Value 1.1x 1.0x 1.0x 1.1x
Price / Tangible Book Value 1.2x 1.3x 1.2x 1.2x
Valuation ( € '000s, except per share data )
FX Rate as of 9/8/17: USD to Euro 0.83491
-40.0%
-20.0%
0.0%
20.0%
40.0%
-2,000,000
-1,000,000
0
1,000,000
2,000,000
2012 2013 2014 2015 2016
Operating Income EBITDA Operating Margin (RHS)` EBITDA Margin (RHS)
63.03
71.62
0
100
200
300
400
500
600
700
0 €
10 €
20 €
30 €
40 €
50 €
60 €
70 €
80 €
90 €
100 €
12-Sep-16
26-Sep-16
10-Oct-16
24-Oct-16
7-Nov-16
21-Nov-16
5-Dec-16
19-Dec-16
2-Jan-17
16-Jan-17
30-Jan-17
13-Feb-17
27-Feb-17
13-Mar-17
27-Mar-17
10-Apr-17
24-Apr-17
8-May-17
22-May-17
5-Jun-17
19-Jun-17
3-Jul-17
17-Jul-17
31-Jul-17
14-Aug-17
28-Aug-17
Daily Volume, '000s (RHS) Share Price Vol., 30-Day Avg., '000s (RHS)
• 390 N Broadway, Jericho, NY, 11753 • (516) 882-4100 4
Balance Sheet
Balance Sheet
(In € ‘000s) 2014 2015 2016 2Q 2017
Assets:
Cash 1,326,812 1,460,173 1,428,319 1,204,000
Other Trade Receivables 1,940,034 1,612,418 1,723,658 1,869,000
Assets Held for Sale 412,137 431,061 327,161 649,000
Other Current Assets 1,692,776 1,389,019 1,244,222 1,402,000
Total Current Assets 5,371,759 4,892,671 4,723,360 5,124,000
Property, Plant & Equipment 8,012,540 7,664,187 7,965,873 9,469,000
Goodwill & Intangibles 212,965 692,917 536,105 536,105
Other Assets 2,155,766 2,118,728 3,021,605 2,278,895
Total Assets 16,143,180 15,777,617 17,407,764 17,408,000
Liabilities:
Total Current Borrowings 1,071,817 1,137,141 1,168,506 1,575,000
Accounts Payable 2,558,228 2,024,533 2,297,429 2,206,000
Liabilities Held for Sale 321,419 420,066 186,150 280,000
Other Current Liabilities 659,623 538,531 818,992 410,000
Total Current Liabilities 4,611,087 4,120,271 4,471,077 4,471,000
Total Long-Term Borrowings 5,917,932 5,895,023 5,602,261 5,416,000
Other Liabilities 2,000,674 2,008,178 3,237,080 3,599,000
Total Liabilities 12,529,693 12,023,472 13,310,418 13,486,000
Total Shareholders' Equity: 3,613,487 3,754,145 4,097,346 3,922,000
Total Liabilities & Shareholders' Equity 16,143,180 15,777,617 17,407,764 17,408,000
Total Debt 6,989,749 7,032,164 6,770,767 6,991,000
Net Debt 5,662,937 5,571,991 5,342,448 5,787,000
Backlog 15,051,000 10,258,000 18,609,000 17,677,000
Construction Backlog 5,693,000 6,722,000 8,140,000 7,285,000
Water Backlog 9,358,000 3,536,000 10,469,000 10,392,000
• 390 N Broadway, Jericho, NY, 11753 • (516) 882-4100 5
Income Statement
Acciona Group Operations
Historical Income Statement
LTM Half-Year Results
(In € '000s) 2014 2015 2016 1H 2017 1H 2016 1H 2017
Revenues 6,498,501 6,543,524 5,977,419 6,520,419 3,083,000 3,626,000
Operating Income (Loss) 571,964 626,919 988,177 390,177 868,000 270,000
Margin (%) 8.8% 9.6% 16.5% 6.0% 28.2% 7.4%
EBITDA (Adjusted) 1,098,871 1,174,000 1,192,000 1,246,000 525,000 579,000
Margin (%) 16.9% 17.9% 19.9% 19.1% 17.0% 16.0%
Net Income (Loss) 207,192 235,759 373,855 (123,145) 605,000 108,000
Margin (%) 3.2% 3.6% 6.3% (1.9%) 19.6% 3.0%
Acciona Construction Operations
Historical Income Statement
LTM Half Year Results
(In € '000s) 2014 2015 2016 1H 2017 1H 2016 1H 2017
Total Revenue 2,625,940 2,169,666 2,266,967 2,956,967 925,000 1,615,000
Operating Income (Loss) 35,845 40,611 83,759 9,759 15,000 28,000
Margin (%) 1.4% 1.9% 3.7% 3.3% 1.6% 1.7%
EBITDA (Adjusted) 118,147 101,813 173,615 232,615 51,000 110,000
Margin (%) 4.5% 4.7% 7.7% 7.9% 5.5% 6.8%
• 390 N Broadway, Jericho, NY, 11753 • (516) 882-4100 6
Recent News
 May 18, 2017: Acciona’s Chairman, José Manuel Entrecanales said that the next
phase of the company’s growth will be based on selective bidding for projects that
guarantee margins and returns, coupled with a move into new markets that offer
opportunities in its two business areas, renewable energy and infrastructure.
 May 9, 2017: Acciona Agua, in an equal partnership with Brazilian company GEL, has
won a €28.6MM design-build-assist contract for operating a waste water treatment
system in Santa Cruz do Capibaribe, Brazil. Acciona will build a waste water
treatment plant capable of processing 400 liters per second, potentially catering for a
population of up to 197,000.
 May 3, 2017: Acciona has been awarded two DBFOM contracts worth €300MM for
two potable water plants in Colón, Panama. The two plants will produce over 250,000
m3 and contribute to enhancing the supply of drinking water to the country’s urban
dwellers, which is one of the main goals of the “Water for All” National Water Security
Plan.
 April 27, 2017: Acciona Energy, inaugurated the 93-MW San Roman Wind Farm in
Texas. Sam Roman will produce enough energy to power more than 30,000 homes
in Southeast Texas.
• 390 N Broadway, Jericho, NY, 11753 • (516) 882-4100 7
Company Snapshot - ACS
Price/ Volume
Valuation Multiples
30-Day Avg. Share Price (as of 9/8/17) 31.99
52-Week High 36.49
52-Week Low 24.34
Market Cap 10,065,452
Total Debt 8,624,000
Minority Interests 1,352,000
Total Cash 5,293,000
Enterprise Value 14,748,452
Book Value 5,018,000
Goodwill & Intangibles 3,691,448
Tangible Book Value 1,326,552
(In € Millions) 2012 2013 2014 2015 2016
Total Revenue 38,396 38,372 34,880 33,291 31,975
Income Overview
2014 2015 2016 2Q2017
Backlog (€ Millions) 63,871 58,942 66,526 65,199
Backlog Months 22.0x 21.2x 25.0x 23.2x
Book-To-Bill 1.0x 0.9x 1.2x 1.1x
Enterprise Value / Revenue 0.6x 0.4x 0.4x 0.4x
Enterprise Value / EBITDA 10.8x 6.5x 6.9x 6.8x
Enterprise Value / EBIT 20.1x 12.8x 11.3x 11.0x
Price / Earnings 8.3x 6.9x 9.2x 9.3x
Price / Book Value 2.1x 1.4x 1.9x 2.0x
Price / Tangible Book Value 15.0x 6.2x 6.7x 7.6x
0.0%
5.0%
10.0%
0
1,000,000
2,000,000
3,000,000
4,000,000
2012 2013 2014 2015 2016
Operating Income EBITDA Operating Income Margin (RHS)` EBITDA Margin (RHS)
Valuation ( € '000s, except per share data )
24.96
31.82
0
5,000
10,000
15,000
20,000
25,000
0 €
5 €
10 €
15 €
20 €
25 €
30 €
35 €
40 €
9-Sep-16
23-Sep-16
7-Oct-16
21-Oct-16
4-Nov-16
18-Nov-16
2-Dec-16
16-Dec-16
30-Dec-16
13-Jan-17
27-Jan-17
10-Feb-17
24-Feb-17
10-Mar-17
24-Mar-17
7-Apr-17
21-Apr-17
5-May-17
19-May-17
2-Jun-17
16-Jun-17
30-Jun-17
14-Jul-17
28-Jul-17
11-Aug-17
25-Aug-17
8-Sep-17
Daily Volume, '000s (RHS) Share Price Vol., 30-Day Rolling Avg., '000s (RHS)
FX Rate as of 9/8/17: USD to Euro 0.83491
• 390 N Broadway, Jericho, NY, 11753 • (516) 882-4100 8
Balance Sheet
Balance Sheet
(In € ‘000s) 2014 2015 2016 2Q 2017
Assets:
Cash & Equivalents 5,167,139 5,803,708 5,654,778 5,293,000
Accounts Receivables 12,719,329 10,915,856 10,987,876 10,985,000
Other Current Assets 7,433,391 4,780,996 4,091,129 3,683,000
Total Current Assets 25,319,859 21,500,560 20,733,783 19,961,000
Property, Plant & Equipment 2,499,928 2,320,355 1,760,014 1,718,000
Goodwill & Intangibles 4,208,767 4,034,482 3,577,316 3,691,448
Concessions 1,164,499 1,116,147 674,552 674,552
Investments in Associates 1,231,256 1,906,898 1,532,300 1,460,000
Other Assets 4,896,426 4,401,386 5,095,301 4,554,000
Total Assets 39,320,735 35,279,828 33,373,266 32,059,000
Liabilities:
Concession Borrowings 6,203,509 3,362,744 3,885,591 3,527,000
Other Payables 13,962,196 13,922,567 14,823,117 14,291,000
Concession Provisions 1,011,664 1,011,664 1,019,045 950,000
Other Current Liabilities 3,710,525 1,096,160 729,241 357,000
Total Current Liabilities 24,887,894 19,393,135 20,456,994 19,125,000
Total Long-Term Borrowings 6,090,901 7,382,116 4,906,844 5,097,000
Other Liabilities 3,444,052 3,307,308 3,027,491 2,819,000
Total Liabilities 34,422,847 30,082,559 28,391,329 27,041,000
Total Shareholders' Equity: 4,897,888 5,197,269 4,981,937 5,018,000
Total Liabilities & Shareholders' Equity 39,320,735 35,279,828 33,373,266 32,059,000
Working Capital Ratio 1.02 1.11 1.01 1.04
Total Debt 12,294,410 10,744,860 8,792,435 8,624,000
Net Debt 7,127,271 4,941,152 3,137,657 3,331,000
Backlog 63,871,044 58,942,000 66,526,000 65,199,000
• 390 N Broadway, Jericho, NY, 11753 • (516) 882-4100 9
ACS Group Income Statement
ACS Group Operations
LTM Half-Year Results
(In € ‘000s) 2014 2015 2016 1H 2017 1H 2016 1H 2017
Revenues 34,880,860 33,291,309 31,975,212 33,670,212 15,836,000 17,531,000
Operating Income (Loss) 959,641 1,089,133 1,237,430 1,337,430 718,000 818,000
Margin (%) 2.8% 3.3% 3.9% 4.0% 4.5% 4.7%
EBITDA 1,783,646 2,141,000 2,023,000 2,156,000 1,091,000 1,224,000
Margin (%) 5.1% 6.4% 6.3% 6.4% 6.9% 7.0%
Net Income (Loss) 1,247,000 1,054,247 1,016,910 1,083,910 473,000 540,000
Margin (%) 3.6% 3.2% 3.2% 3.2% 3.0% 3.1%
ACS Construction Operations
Hochtief Historical Income Statement
LTM Half-Year Results
(In € ‘000s) 2014 2015 2016 1H 2017 1H 2016 1H 2017
Revenues 22,099,000 21,097,000 19,908,000 21,560,000 9,366,000 11,018,000
Operating Income (Loss) 456,000 689,000 774,000 809,000 423,000 458,000
Margin (%) 2.1% 3.3% 3.9% 3.8% 4.5% 4.2%
EBITDA 906,000 1,143,000 1,104,000 1,221,000 548,000 665,000
Margin (%) 4.1% 5.4% 5.5% 5.7% 5.9% 6.0%
Dragados Historical Income Statement
LTM Half-Year Results
(In € ‘000s) 2014 2015 2016 1H 2017 1H 2016 1H 2017
Revenues 3,643,000 4,152,000 4,236,000 4,332,000 1,949,000 2,045,000
Operating Income (Loss) 257,000 230,000 218,000 224,000 122,000 128,000
Margin (%) 7.1% 5.5% 5.1% 5.2% 6.3% 6.3%
EBITDA 295,000 292,000 296,000 305,000 156,000 165,000
Margin (%) 8.1% 7.0% 7.0% 7.0% 8.0% 8.1%
• 390 N Broadway, Jericho, NY, 11753 • (516) 882-4100 10
Recent News
 Aug. 11, 2017: ACS’s subsidiary, CPB Contractors, has been selected by ōtākaro
limited to design and construct the Christchurch Convention and Exhibit Centre in
New Zealand. The contract will generate revenues of approximately NZ$240MM.
Once completed, the Centre is expected to host up to 2,000 delegates and
construction works include delivery of a 1,400 delegate auditorium, 3,600 Sq. Meter
exhibition hall and 1,600 Sq. Meters in meetings rooms, as well as associated food
and beverage and retail amenities. Construction is scheduled to commence in
October 2017 and completed by earl y 2020.
 Aug. 10, 2017: Hochtief, an ACS subsidiary, has refinanced a long-term syndicated
credit facility in the amount of €1.7B. With an international banking syndicate, the
Group agreed to a facility with a tenor of five years and extension options of up to two
more years. Of the total amount, €1.2B are guaranteed facilities and €0.5B cash
facilities at significantly improved terms. The early refinancing of the loan, which
expired in 2019, was well received on the international banking market and the
interest rate was helped along by both the continuously good market environment and
the investment grade rating Hochtief received in May 2017 (BBB by S&P).
 May 16, 2017: ACS’s subsidiary, CPB Contractors, will deliver the second and final
phase of the NZ Transport Agency project, State Highway 2 Baypark upgrade in
Tauranga, New Zealand. The design and construct contract will generate ~€50MM
and work will include the building of two flyovers and is scheduled to commence
immediately and conclude in 2020.
• 390 N Broadway, Jericho, NY, 11753 • (516) 882-4100 11
Company Snapshot - Ferrovial
Price/ Volume
Valuation Multiples
30-Day Avg. Share Price (as of 9/8/17) 18.67
52-Week High 20.75
52-Week Low 16.04
Market Cap 13,880,414
Total Debt 8,371,000
Minority Interest 733,000
Cash 3,720,000
Enterprise Value 19,264,414
Book Value 7,084,000
Goodwill & Intangibles 2,605,000
Tangible Book Value 4,479,000
(In € Millions) 2012 2013 2014 2015 2016
Total Revenue 7,647 8,176 8,810 9,709 10,765
Income Overview
2014 2015 2016 2Q2017
Backlog (€ Millions) 30,460 31,531 33,519 33,611
Backlog Months 41.5x 39.0x 37.4x 31.3x
Book-To-Bill 1.5x 1.1x 1.2x 0.6x
Enterprise Value / Revenue 2.0x 2.0x 1.6x 1.6x
Enterprise Value / EBITDA 18.0x 15.4x 10.6x 11.7x
Enterprise Value / EBIT 24.0x 22.1x 18.3x 16.4x
Price / Earnings 31.8x 23.9x 32.3x 45.0x
Price / Book Value 1.6x 2.0x 1.7x 2.0x
Price / Tangible Book Value 2.3x 2.7x 2.6x 3.1x
0.0%
5.0%
10.0%
15.0%
0
500
1,000
1,500
2,000
2012 2013 2014 2015 2016
Gross Profit EBITDA Gross Profit Margin (RHS)` EBITDA Margin (RHS)
Valuation ( € '000s, except per share data )
17.72
19.25
0
2,000
4,000
6,000
8,000
10,000
12,000
0 €
5 €
10 €
15 €
20 €
25 €
12-Sep-16
26-Sep-16
10-Oct-16
24-Oct-16
7-Nov-16
21-Nov-16
5-Dec-16
19-Dec-16
2-Jan-17
16-Jan-17
30-Jan-17
13-Feb-17
27-Feb-17
13-Mar-17
27-Mar-17
10-Apr-17
24-Apr-17
8-May-17
22-May-17
5-Jun-17
19-Jun-17
3-Jul-17
17-Jul-17
31-Jul-17
14-Aug-17
28-Aug-17
Daily Volume, '000s (RHS) Share Price Vol., 30-Day Rolling Avg., '000s (RHS)
FX Rate as of 9/8/17: USD to Euro 0.83491
• 390 N Broadway, Jericho, NY, 11753 • (516) 882-4100 12
Balance Sheet
Balance Sheet
(In € Millions) 2014 2015 2016 2Q 2017
Assets:
Unrestricted Cash 3,043 2,973 3,516 3,720
Restricted & Other Infrastructure Cash 396 306 62 53
Trade and Other Receivables 2,170 2,320 2,822 2,888
Other Current Assets 437 546 721 827
Assets Held for Sale 2 2,418 624 258
Total Current Assets 6,048 8,563 7,745 7,746
Investments in Infrastructure Projects 10,757 8,544 7,145 6,970
Infrastructure Investments Under Equity Method (Note 3) 3,251 3,121 2,874 2,784
Goodwill & Intangibles 2,205 2,119 2,699 2,605
Restricted Cash Related to Infrastructure 405 261 249 258
Other Assets 2,807 2,776 2,711 2,543
Total Assets 25,473 25,384 23,423 22,906
Liabilities:
Total Current Borrowings 1,368 1,385 302 319
Related to Infrastructure Projects 1,276 1,297 200 200
Non-Infrastructure Related 92 88 102 119
Other Trade Payables 2,665 2,665 2,299 2,346
Operating Provisions 503 622 715 767
Other Current Liabilities 899 1,080 1,814 1,752
Liabilities Classified as held for sale - 2,690 440 188
Total Current Liabilities 5,435 8,442 5,570 5,372
Total Long-Term Borrowings 8,706 6,696 7,874 8,052
Related to Infrastructure Projects 7,331 5,320 5,310 5,193
Non-Infrastructure Project 1,375 1,376 2,564 2,859
Infrastructure Related Provisions 1,378 838 757 747
Other Liabilities 2,946 1,779 1,790 1,651
Total Liabilities 18,465 17,755 15,991 15,822
Total Shareholders' Equity: 7,008 7,629 7,432 7,084
Total Liabilities & Shareholders' Equity 25,473 25,384 23,423 22,906
Working Capital Ratio 1.11 1.01 1.39 1.44
Total Debt 10,074 8,081 8,176 8,371
Net Debt 6,230 4,541 4,349 4,340
Backlog 30,460 31,531 34,682 31,611
Services 22,369 22,800 25,195 22,211
Construction 8,091 8,731 9,487 9,400
• 390 N Broadway, Jericho, NY, 11753 • (516) 882-4100 13
Income Statement
Ferrovial Group Operations
Ferrovial Group Historical Income Statement
LTM Half-Year Results
(In € '000s) 2014 2015 2016 1H 2017 1H 2016 1H 2017
Revenues 8,810 9,709 10,765 12,128 4,699 6,062
Operating Income (Loss) 743 901 926 1,178 305 557
Margin (%) 8.4% 9.3% 8.6% 9.7% 6.5% 9.2%
EBITDA (Adjusted) 992 1,288 1,598 1,646 421 469
Margin (%) 11.3% 13.3% 7.9% 7.9% 9.0% 7.7%
Net Income (Loss) 402 720 376 427 189 240
Margin (%) 4.6% 7.4% 3.5% 3.5% 4.0% 4.0%
Ferrovial Construction Operations
Webber Construction Historical Income Statement
LTM Half Year Results
(In € '000s) 2014 2015 2016 1H 2017 1H 2016 1H 2017
Total Revenue 673 643 708 751 334 377
Operating Income (Loss) 59 89 44 33 28 17
Margin (%) 8.8% 13.8% 6.2% 4.4% 8.4% 4.5%
EBIT 52 81 36 24 24 12
Margin (%) 7.7% 12.6% 5.1% 3.2% 7.2% 3.2%
• 390 N Broadway, Jericho, NY, 11753 • (516) 882-4100 14
Recent Global News
 Aug. 25, 2017: Ferrovial Airports has signed the contract for remodelling and
commercial operations of the Jeppesen Terminal at Denver International Airport. The
34-Year concession represents an investment of $650MM. The other members of the
group are Saunders Construction and JLC. Ferrovial Agroman will participate in the
construction work. Scope of work includes upgrading 70,000 Sq. meters of floor
space, including creating new shopping and foodservice areas, relocating and
expanding TSA screening areas, improving building access and passenger flow and
other related works.
 Jun. 6, 2017: Ferrovial, through subsidiary FBSerwis, has closed the acquisition of
100% of waste management company Trans-Formers Group from Hossanova for
~€37MM. This move strengthens FBSerwis’ presence in urban services.
 March 30, 2017: Ferrovial has partnered with the Greater London Authority, in
addition to University College London and Future Cities Catapult, to launch
“Londoner’s Lab”, a citizen engagement program aimed at transforming the way
public services are delivered in the capital.
 March 29, 2017: A consortium led by Ferrovial Agroman with Webber and Granite
Construction, has been chosen by the Texas Department of Transportation to design
and build segments H&I of the State Highway 99 ring road for $855MM. The project
comprises the construction of a 52.5 mile stretch of highway.
• 390 N Broadway, Jericho, NY, 11753 • (516) 882-4100 15
Company Snapshot - OHL
Price/ Volume
Valuation Multiples
30-Day Avg. Share Price (as of 9/8/17) 3.5
52-Week High 4.82
52-Week Low 2.44
Market Cap 1,044,461
Total Debt 4,028,700
Total Cash 1,832,200
Non-Controlling Interests 792,300
Enterprise Value 6,113,061
Book Value 4,480,300
Goodwill & Intangibles 263,100
Tangible Book Value 4,217,200
(In € Millions) 2012 2013 2014 2015 2016
Total Revenue 4,029,588 3,684,170 4,536,063 5,218,343 4,638,803
Income Overview
2014 2015 2016 2Q2017
Backlog (€ Millions) 66,766 64,970 82,349 70,823
Backlog Months 176.6x 149.4x 213.0x 188.4x
Book-To-Bill 3.0x 0.7x 4.7x (0.8x)
Enterprise Value / Revenue 2.1x 1.5x 1.4x 1.4x
Enterprise Value / EBITDA 9.0x 8.1x 23.5x 17.2x
Enterprise Value / EBIT 15.2x 11.4x 295.1x 37.5x
Price / Earnings 10.9x 6.6x N/A N/A
Price / Book Value 0.6x 0.4x 0.3x 0.2x
Price / Tangible Book Value 0.6x 0.4x 0.3x 0.2x
0.0%
20.0%
40.0%
60.0%
0
500,000
1,000,000
1,500,000
2,000,000
2012 2013 2014 2015 2016
Gross Profit EBITDA Gross Profit Margin (RHS)` EBITDA Margin (RHS)
Valuation ( € '000s, except per share data )
3.34 €
3.56 €
0
2,000
4,000
6,000
8,000
10,000
12,000
14,000
0 €
1 €
2 €
3 €
4 €
5 €
6 €
12-Sep-16
26-Sep-16
10-Oct-16
24-Oct-16
7-Nov-16
21-Nov-16
5-Dec-16
19-Dec-16
2-Jan-17
16-Jan-17
30-Jan-17
13-Feb-17
27-Feb-17
13-Mar-17
27-Mar-17
10-Apr-17
24-Apr-17
8-May-17
22-May-17
5-Jun-17
19-Jun-17
3-Jul-17
17-Jul-17
31-Jul-17
14-Aug-17
28-Aug-17
Daily Volume, '000s (RHS) Share Price Vol., 30-Day Rolling Avg., '000s (RHS)
FX Rate as of 9/8/17: USD to Euro 0.83491
• 390 N Broadway, Jericho, NY, 11753 • (516) 882-4100 16
Balance Sheet
Balance Sheet
(In € 000s) 2014 2015 2016 2Q 2017
Cash & Cash Equivalents 787,909 1,097,870 817,872 792,300
Trade and Other Receivables 2,299,896 2,437,800 2,080,218 2,185,600
Assets Held for Sale - 833,272 491,963 -
Other Current Assets 632,635 686,302 941,226 626,600
Total Current Assets 3,720,440 5,055,244 4,331,279 3,604,500
Property, Plant & Equipment, Net 593,548 636,029 257,011 237,200
Concession Infrastructure 7,154,037 6,515,565 6,439,634 6,774,900
Goodwill & Intangibles 320,687 316,366 287,029 263,100
Investment in Affiliates & Joint Ventures 1,556,981 1,668,246 513,611 607,800
Other Noncurrent Assets 884,449 1,097,476 1,091,782 1,283,100
Total Assets 14,230,142 15,288,926 12,920,346 12,770,600
Total Current Borrowings 1,457,623 716,312 615,201 627,700
Trade Payables 1,699,168 1,813,110 1,886,063 1,801,400
Liabilities Classified as held for sale - 567,245 220,008 -
Other Current Liabilities 532,189 797,131 702,275 634,600
Total Current Liabilities 3,688,980 3,893,798 3,423,547 3,063,700
Total Long-Term Borrowings 5,256,369 4,723,169 3,777,065 3,401,000
Infrastructure Related Provisions 120,586 130,893 121,495 172,400
Other Liabilities 1,671,826 1,729,392 1,676,841 1,825,600
Total Liabilities 10,737,761 10,477,252 8,877,453 8,290,300
Total Shareholders' Equity: 3,492,381 4,811,674 4,042,893 4,480,300
Total Liabilities & Shareholders' Equity 14,230,142 15,288,926 12,920,346 12,770,600
Working Capital Ratio 1.01 1.30 1.27 1.18
Total Debt 6,713,992 5,439,481 4,392,266 4,028,700
Net Debt 5,926,083 4,341,611 3,574,394 3,236,400
Backlog 66,766,001 64,970,206 82,349,646 70,823,400
Concessions 58,445,851 57,509,813 75,449,354 63,510,900
Construction 7,615,351 6,895,311 6,106,305 6,516,300
Other 704,799 565,082 793,987 796,200
• 390 N Broadway, Jericho, NY, 11753 • (516) 882-4100 17
OHL Group Income Statement
OHL Group Operations
OHL Group Historical Income Statement
LTM Half-Year Results
(In € '000s) 2014 2015 2016 1H 2017 1H 2016 1H 2017
Revenues 4,536,063 5,218,343 4,638,803 4,511,903 2,393,700 2,266,800
Operating Income (Loss) 614,092 684,756 21,939 162,839 270,300 411,200
Margin (%) 13.5% 13.1% 0.5% 3.6% 11.3% 18.1%
EBITDA (Adjusted) 1,040,182 967,034 275,835 356,435 385,400 466,000
Margin (%) 22.9% 18.5% 5.9% 7.9% 16.1% 20.6%
Net Income (Loss) 185,361 258,553 (235,316) (208,116) 83,500 110,700
Margin (%) 4.1% 5.0% (5.1%) (4.6%) 3.5% 4.9%
OHL Construction Operations
OHL Construction Historical Income Statement
LTM Half Year Results
(In € '000s) 2014 2015 2016 1H 2017 1H 2016 1H 2017
Total Revenue 2,787,981 3,248,200 2,773,600 2,524,900 1,555,400 1,306,700
Operating Income (Loss) (159,929) (55,400) (618,100) (573,600) (42,500) 2,000
Margin (%) (5.7%) (1.7%) (22.3%) (22.7%) (2.7%) 0.2%
EBITDA 206,259 150,000 (519,900) (530,300) 44,900 34,500
Margin (%) 7.4% 4.6% (18.7%) (21.0%) 2.9% 2.6%
• 390 N Broadway, Jericho, NY, 11753 • (516) 882-4100 18
Recent News
 July 31, 2017: OHL Group, through subsidiary Judlau Contracting, is set to
rehabilitate and improve the capacity of the Canarsie Tunnel in New York, at a cost of
€447MM. The project has been awarded by New York’s Metropolitan Transportation
Authority to the Joint Venture led by Judlau (70%) and TC Electric (30%). This
project includes the rehabilitation of the tunnel following the devastation of hurricane
Sandy together with the upgrade of the capacity of the First Avenue and Bedford
Avenue subway stations and the construction of a new Avenue B substation.
 May 18, 2017: OHL Group, through subsidiary Judlau Contracting, has been awarded
two contracts by the New York Metropolitan Transportation Authority in New York for
$125MM. The larger project, worth $64MM, is to provide design-build services for
flood mitigation at the Hugh L. Carey Tunnel and Queens Midtown Tunnel. The
second contract, for over $61MM, is for the second phase of a design-build project to
improve critical infrastructure along Metro-North’s Hudson Line.
 May 18, 2017: OHL Group, through subsidiary OHL USA, has been awarded two
contracts by the Texas Department of Transportation for more than $70MM. The IH-
35 East Oltorf Street project includes operational improvements, construction of new
shoulders and auxiliary lanes. The IH-35 East Denton County project includes
paving, grading, structures, bridges and frontage roads.
• 390 N Broadway, Jericho, NY, 11753 • (516) 882-4100 19
Company Snapshot - Sacyr
Price/ Volume
Valuation Multiples
30-Day Avg. Share Price (as of 9/8/17) 2.25
52-Week High 2.75
52-Week Low 1.68
Market Cap 1,154,785
Total Debt 3,719,269
Minority Interests 316,478
Total Cash 635,480
Enterprise Value 4,555,052
Book Value 1,934,368
Goodwill & Intangibles 199,046
Tangible Book Value 1,735,322
(In SEK Millions) 2012 2013 2014 2015 2016
Total Revenue 3,827 2,782 2,809 3,063 2,963
Income Overview
2014 2015 2016 2Q2017
Backlog (SEK Millions) 24,832 26,845 25,956 30,164
Backlog Months 106.1x 105.2x 105.1x 117.8x
Book-To-Bill 1.1x 1.7x 0.7x 2.2x
Enterprise Value / Revenue 3.1x 1.8x 2.1x 1.5x
Enterprise Value / EBITDA 31.6x 17.1x 17.1x 11.8x
Enterprise Value / EBIT 44.5x 36.8x 29.6x 20.0x
Price / Earnings 60.6x 2.3x 15.2x 8.5x
Price / Book Value 1.5x 0.5x 1.0x 0.6x
Price / Tangible Book Value 1.7x 0.5x 1.1x 0.7x
Valuation ( € '000s,) except per share data)
FX Rate as of 9/8/17: USD to Euro 0.83491
0.0%
5.0%
10.0%
15.0%
0
50,000
100,000
150,000
200,000
250,000
2012 2013 2014 2015 2016
Operating Income EBITDA Operating Margin EBITDA Margin (RHS)
1.76
2.29
0
5,000
10,000
15,000
20,000
25,000
30,000
35,000
0 €
1 €
2 €
3 €
4 €
12-Sep-16
26-Sep-16
10-Oct-16
24-Oct-16
7-Nov-16
21-Nov-16
5-Dec-16
19-Dec-16
2-Jan-17
16-Jan-17
30-Jan-17
13-Feb-17
27-Feb-17
13-Mar-17
27-Mar-17
10-Apr-17
24-Apr-17
8-May-17
22-May-17
5-Jun-17
19-Jun-17
3-Jul-17
17-Jul-17
31-Jul-17
14-Aug-17
28-Aug-17
Daily Volume, '000s (RHS) Share Price Vol., 30-Day Rolling Avg., '000s (RHS)
• 390 N Broadway, Jericho, NY, 11753 • (516) 882-4100 20
Balance Sheet
Balance Sheet
(In € 000s) 2014 2015 2016 2Q 2017
Assets:
Cash 358,475 602,822 621,308 635,480
Receivables 1,888,173 1,996,615 2,065,683 2,172,098
Assets Held for Sale 302,623 527,535 475,406 466,558
Other Current Assets 599,547 552,417 502,784 500,708
Total Current Assets 3,148,818 3,679,389 3,665,181 3,774,844
Goodwill & Intangible Assets 125,224 201,394 198,544 199,046
Concessions Investments 1,213,675 1,643,853 1,402,267 1,381,610
Other Assets 7,116,576 4,932,838 5,422,953 5,303,666
Total Assets 11,604,293 10,457,474 10,688,945 10,659,166
Liabilities:
Financial Debt 3,445,304 850,612 829,062 867,951
Trade & Other Payables 1,914,690 1,946,695 1,550,211 1,487,348
Operating Provisions 315,908 246,248 220,778 219,862
Liabilities Held for Sale 219,771 224,186 203,042 194,188
Other Current Liabilities 237,698 225,823 533,825 628,408
Total Current Liabilities 6,133,371 3,493,564 3,336,918 3,397,757
Financial Debt 3,411,860 4,072,303 3,605,678 2,851,318
Provisions 279,248 361,804 370,428 375,486
Other Liabilities 453,740 618,213 1,295,582 2,100,237
Total Liabilities 10,278,219 8,545,884 8,608,606 8,724,798
Total Shareholders' Equity: 1,326,074 1,911,590 2,080,339 1,934,368
Total Liabilities & Shareholders' Equity 11,604,293 10,457,474 10,688,945 10,659,166
Working Capital Ratio 0.51 1.05 1.10 1.11
Total Debt 6,857,164 4,922,915 4,434,740 3,719,269
Net Debt 6,498,689 4,320,093 3,813,432 3,083,789
Backlog 25,067,121 26,845,418 25,956,000 30,164,000
Construction 4,988,000 5,062,000 4,131,000 4,501,000
Concessions 11,402,000 13,339,000 12,926,000 17,126,000
Services 6,034,000 6,031,000 6,447,000 6,038,000
Industrial 2,408,000 2,413,000 2,452,000 2,499,000
• 390 N Broadway, Jericho, NY, 11753 • (516) 882-4100 21
Income Statement
Sacyr Group Operations
Historical Income Statement
LTM Half-Year Results
(In € 000s) 2014 2015 2016 1H 2017 1H 2016 1H 2017
Revenues 2,809,669 3,063,394 2,963,652 2,963,652 1,413,916 1,522,573
Operating Income (Loss) 193,776 147,821 208,081 208,081 116,466 135,834
Margin (%) 6.9% 4.8% 7.0% 7.0% 8.2% 8.9%
EBITDA 272,467 318,000 359,561 359,561 164,902 190,828
Margin (%) 9.7% 10.4% 12.1% 12.1% 11.7% 12.5%
Net Income 33,000 383,658 135,252 135,252 70,821 71,501
Margin (%) 1.2% 12.5% 4.6% 4.6% 5.0% 4.7%
• 390 N Broadway, Jericho, NY, 11753 • (516) 882-4100 22
Recent Global News
 July 7, 2017: The General Directorate of Road Maintenance in Mexico has awarded
SACYR Concessiones its first Public Private Partnership project in the country:
renovation, maintenance and conservation of a 91.5-km road worth ~€190MM. The
10-year term project consists of renovation, maintenance and conservation of two
road sections in the states of Mexico and Hidalgo. The scope of the project includes
asphalting reinforcement of slopes, drainage and horizontal and vertical signage.
 Feb. 16, 2017: (Chile) The Ministry of Public Works has awarded the construction of
the future Biprovinchal Hospital Quillota-Petorca to the consortium formed by Sacyr
Chile and Somague, both Sacyr subsidiaries, for USD $114MM. The built-up surface
area of the project will be 73,204 square meters. Sacyr has been in Chile for 20
years, having become the country’s most important private investor in infrastructure
with USD $6.5B invested in concession and infrastructure construction projects.
 Oct. 25, 2016: (Spain) The General Water Directorate has awarded a Sacyr
Construction and Sadyt the contract to draft and execute the works pertaining to the
Wastewater Treatment Plant of Ibiza for €24.6MM. The project is expected to take 33
months.
• 390 N Broadway, Jericho, NY, 11753 • (516) 882-4100 23
Company Snapshot - Skanska
Price/ Volume
Valuation Multiples
30-Day Avg. Share Price (as of 9/8/17) 181.90
52-Week High 226.60
52-Week Low 178.00
Market Cap (SEK MM) 74,538
Total Debt 11,432
Total Cash 4,253
Non-Controlling Interests 155
Enterprise Value 81,872
Book Value 29,021
Goodwill & Intangibles 6,185
Tangible Book Value 33,810
(In SEK Millions) 2012 2013 2014 2015 2016
Total Revenue 129,350 136,589 143,325 153,049 145,365
Income Overview
2014 2015 2016 2Q2017
Backlog (SEK Millions) 170,498 158,248 196,254 202,200
Backlog Months 14.3x 12.4x 16.2x 16.3x
Book-To-Bill 1.3x 0.9x 1.3x 1.2x
Enterprise Value / Revenue 0.6x 0.5x 0.6x 0.6x
Enterprise Value / EBITDA 11.6x 8.8x 10.2x 10.3x
Enterprise Value / EBIT 15.6x 11.2x 13.0x 13.8x
Price / Earnings 21.4x 15.0x 15.5x 10.8x
Price / Book Value 3.8x 3.0x 3.2x 2.6x
Price / Tangible Book Value 3.0x 2.4x 2.6x 2.2x
Valuation (SEK Millions, except per share data)
FX Rate as of 9/8/17: USD to SEK 7.95014
0.0%
5.0%
10.0%
15.0%
0
5,000
10,000
15,000
2012 2013 2014 2015 2016
Gross Profit EBITDA Gross Profit Margin (RHS)` EBITDA Margin (RHS)
183.60
182.00
0
1,000
2,000
3,000
4,000
5,000
6,000
7,000
8,000
SEK 0
SEK 50
SEK 100
SEK 150
SEK 200
SEK 250
23-Aug-16
6-Sep-16
20-Sep-16
4-Oct-16
18-Oct-16
1-Nov-16
15-Nov-16
29-Nov-16
13-Dec-16
27-Dec-16
10-Jan-17
24-Jan-17
7-Feb-17
21-Feb-17
7-Mar-17
21-Mar-17
4-Apr-17
18-Apr-17
2-May-17
16-May-17
30-May-17
13-Jun-17
27-Jun-17
11-Jul-17
25-Jul-17
8-Aug-17
22-Aug-17
5-Sep-17
Daily Volume, '000s (RHS) Share Price Vol., 30-Day Rolling Avg., '000s (RHS)
• 390 N Broadway, Jericho, NY, 11753 • (516) 882-4100 24
Balance Sheet
Balance Sheet
(In SEK Millions) 2014 2015 2016 2Q 2017
Corporate Level Cash 9,107 11,840 5,430 4,253
Total Accounts Receivable 26,288 25,877 29,759 27,626
Other Current Assets 39,372 41,843 51,350 54,661
Total Current Assets 74,767 79,560 86,539 86,540
Property, Plant & Equipment 7,122 6,504 6,837 6,963
Goodwill & Intangibles 5,740 6,010 6,304 6,185
Investments in JVs and Affiliates 2,618 2,852 4,160 3,773
Other Non-Current Assets 2,527 2,741 2,665 2,657
Total Assets 92,774 97,667 106,505 106,118
Total Current Debt 4,086 6,555 6,681 8,015
Accounts Payable 31,540 31,771 34,963 36,221
Other Current Liabilities 23,010 26,006 27,306 26,427
Total Current Liabilities 58,636 64,332 68,950 70,663
Total Long Term Debt 7,112 3,874 3,656 3,417
Other Long Term Liabilities 5,621 5,255 6,393 7,590
Total Liabilities 71,369 73,461 78,999 81,670
Total Shareholders' Equity: 21,405 24,206 27,506 24,448
Total Liabilities & Shareholders' Equity 92,774 97,667 106,505 106,118
Working Capital Ratio 1.3x 1.2x 1.3x 1.2x
Total Debt 11,198 10,429 10,337 11,432
Net Debt 2,091 (1,411) 4,907 7,179
Backlog 170,498 158,248 196,254 202,200
• 390 N Broadway, Jericho, NY, 11753 • (516) 882-4100 25
Income Statement
Skanska Group Operations
Skanska Group Historical Income Statement
LTM Half-Year Results
(In € '000s) 2014 2015 2016 1H 2017 1H 2016 1H 2017
Revenues 143,325 153,049 145,365 148,744 70,328 73,707
Gross Profit 13,110 13,889 14,246 12,344 7,483 5,581
Margin (%) 9.1% 9.1% 9.8% 8.3% 10.6% 7.6%
Operating Income (Loss) 5,409 6,290 7,220 5,938 3,336 2,054
Margin (%) 3.8% 4.1% 5.0% 4.0% 4.7% 2.8%
EBITDA (Adjusted) 7,282 7,971 9,193 7,937 4,041 2,785
Margin (%) 5.1% 5.2% 6.3% 5.3% 5.7% 3.8%
Skanska Construction Operations
Skanska Construction Historical Income Statement
LTM Half Year Results
(In € '000s) 2014 2015 2016 1H 2017 1H 2016 1H 2017
Total Revenue 128,700 140,648 138,001 144,564 64,205 70,768
Gross Profit 10,039 10,080 9,376 4,565 3,861
Margin (%) 7.1% 7.3% 6.5% 7.1% 5.5%
Operating Income (Loss) 4,508 3,874 3,546 2,714 1,340 508
Margin (%) 3.5% 2.8% 2.6% 1.9% 2.1% 0.7%
EBITDA 5,956 5,241 4,894 4,085 1,964 1,155
Margin (%) 4.6% 3.7% 3.5% 2.8% 3.1% 1.6%
• 390 N Broadway, Jericho, NY, 11753 • (516) 882-4100 26
Recent Global News
 Aug. 29, 2017: Skanska has signed a contract with the Meridian Group and the
Rockefeller Group to build a new office building and movie theater in Tysons Corner
in Virginia. The contract is worth $167MM. Skanska will build the new 20-story,
42,500 Sq. Meter Class A office building and a more than 10,000 Sq. Meter movie
theater. Construction is ongoing, and the project is expected to be completed in
October 2018.
 July 7, 2017: Skanska has signed a contract with the University of South Florida to
build the Morsani College of Medicine and Heart Institute tower in Tampa, FL, USA.
The contract is worth $41MM. The new education and research tower will be
located in an urban setting of the downtown area of the city. With about 409,000 Sq.
Feet, the building will consist of an anticipated 14 levels. Construction began in Aug.
2017 and the project is expected to be complete in December 2019.
 June 22, 2017: Skanska has signed a contract with New York City Transit for the
improvements at four subway stations along the Astoria Line in the Borough of
Queens in New York City. The contract is for $150MM. The project, which includes
design and construction, consists of the rehabilitation of four elevated transit stations
and the work includes new stairs, guard rails, automated fare collection areas and
electrical upgrades as well as rehabilitating and strengthening structural concrete
and steel. Construction began in April 2017 with an estimated completion in the first
quarter of 2019.
• 390 N Broadway, Jericho, NY, 11753 • (516) 882-4100 27
Company Snapshot - Vinci
Price/ Volume
Valuation Multiples
30-Day Avg. Share Price 76.91
52-Week High 79.91
52-Week Low 58.80
Market Cap 45,613,379
Total Debt 20,982,000
Minority Interest 531,000
Total Cash 4,784,000
Enterprise Value 62,342,379
Book Value 17,006,000
Goodwill & Intangibles 8,606,000
Tangible Book Value 8,400,000
(In € Millions) 2012 2013 2014 2015 2016
Total Revenue 15,327 16,775 15,419 14,491 13,681
Income Overview
2014 2015 2016 2Q2017
Backlog (€ Millions) 27,900 28,700 29,200 30,700
Backlog Months 8.6x 8.8x 9.1x 9.3x
Book-To-Bill 1.0x 1.0x 1.0x 1.0x
Enterprise Value / Revenue 1.2x 1.3x 1.5x 1.6x
Enterprise Value / EBITDA 7.0x 8.8x 9.2x 9.9x
Enterprise Value / EBIT 10.8x 13.6x 13.6x 14.6x
Price / Earnings 16.3x 17.7x 16.0x 17.1x
Price / Book Value 2.1x 2.4x 2.4x 2.7x
Price / Tangible Book Value 4.2x 4.9x 4.8x 5.4x
Valuation ( € '000s, except per share data )
FX Rate as of 9/8/17: USD to Euro 0.83491
0.0%
5.0%
10.0%
15.0%
0
500
1,000
1,500
2,000
2012 2013 2014 2015 2016
Gross Profit EBITDA Gross Profit Margin (RHS)` EBITDA Margin (RHS)
66.98
79.04
0
1,000
2,000
3,000
4,000
5,000
6,000
7,000
€ 0
€ 10
€ 20
€ 30
€ 40
€ 50
€ 60
€ 70
€ 80
€ 90
9-Sep-16
23-Sep-16
7-Oct-16
21-Oct-16
4-Nov-16
18-Nov-16
2-Dec-16
16-Dec-16
30-Dec-16
13-Jan-17
27-Jan-17
10-Feb-17
24-Feb-17
10-Mar-17
24-Mar-17
7-Apr-17
21-Apr-17
5-May-17
19-May-17
2-Jun-17
16-Jun-17
30-Jun-17
14-Jul-17
28-Jul-17
11-Aug-17
25-Aug-17
8-Sep-17
Daily Volume, '000s (RHS) Share Price Vol., 30-Day Rolling Avg., '000s (RHS)
• 390 N Broadway, Jericho, NY, 11753 • (516) 882-4100 28
Balance Sheet
Balance Sheet
(In € Millions) 2014 2015 2016 2Q 2017
Assets:
Cash and Cash Equivalents 6,411 5,632 6,678 4,784
Inventories and Work in Progress 932 964 935 946
Trade and Other Receivables 10,960 10,696 11,422 11,638
Other Current Operating Assets 4,568 4,635 5,099 4,823
Other Current Assets 905 953 781 763
Total Current Assets 23,776 22,880 24,915 22,954
Concession Intangible Assets 24,141 23,915 26,691 26,463
Goodwill & Intangibles 7,407 7,683 8,522 8,606
Other Assets 7,706 7,669 7,803 7,947
Total Assets 63,030 62,147 67,931 65,925
Liabilities:
Current Borrowings 4,061 3,986 5,229 4,897
Current Provisions 3,844 4,053 4,172 4,065
Trade Payables 7,620 7,590 7,740 7,345
Other Current Operating Liabilities 10,769 10,884 11,838 11,014
Other Current Liabilities 454 904 836 785
Total Current Liabilities 26,748 27,417 29,815 28,106
Total Long-Term Borrowings 17,134 15,001 16,265 16,085
Other Liabilities 4,280 4,473 4,845 4,728
Total Liabilities 48,162 46,891 50,925 48,919
Total Shareholders' Equity: 14,868 15,256 17,006 17,006
Total Liabilities & Shareholders' Equity 63,030 62,147 67,931 65,925
Working Capital Ratio 0.89 0.83 0.84 0.82
Total Debt 21,195 18,987 21,494 20,982
Net Debt 14,784 13,355 14,816 16,198
Backlog 27,900 28,700 29,200 30,700
Cash Flow From Operations 3,633 4,521 4,346 4,390
• 390 N Broadway, Jericho, NY, 11753 • (516) 882-4100 29
VINCI Group Income Statement
Vinci Group Operations
Vinci Group Historical Income Statement
LTM Half-Year Results
(In € '000s) 2014 2015 2016 1H 2017 1H 2016 1H 2017
Revenues 39,043 39,161 38,547 39,583 17,802 18,838
Gross Profit 4,243 3,715 4,118 4,258 1,706 1,846
Margin (%) 10.9% 9.5% 10.7% 10.8% 9.6% 9.8%
Operating Income (Loss) 6,590 5,748 6,121 6,321 2,606 2,806
Margin (%) 16.9% 14.7% 15.9% 16.0% 14.6% 14.9%
EBITDA (Adjusted) 1,906 2,079 2,545 2,660 940 1,055
Margin (%) 4.9% 5.3% 6.6% 6.7% 5.3% 5.6%
Vinci Construction Operations
Vinci Construction Historical Income Statement
LTM Half Year Results
(In € '000s) 2014 2015 2016 1H 2017 1H 2016 1H 2017
Total Revenue 15,419 14,491 13,681 13,778 6,453 6,550
Operating Income (Loss) 380 299 330 328 92 90
Margin (%) 2.5% 2.1% 2.4% 2.4% 1.4% 1.4%
EBITDA 625 536 539 506 211 178
Margin (%) 4.1% 3.7% 3.9% 3.7% 3.3% 2.7%
• 390 N Broadway, Jericho, NY, 11753 • (516) 882-4100 30
Recent News
 Dec. 19, 2016 – Inauguration of Vinci’s first PPP Motorway in United States. 35-Year
Concession for East End Crossing project connecting Indiana & Kentucky, which was
valued at ~$1B. Vinci built 12 km of new infrastructure connecting Indiana and
Kentucky; a cable-stayed bridge, a dual-tube tunnel and 19 engineering structures.
 Dec. 15, 2016 – Eurovia (Vinci’s Sub) wins contract to renovate and widen the I-85
Motorway in Spartanburg and Cherokee Counties, South Carolina. Design-Build
Contract to renovate and widen a 32 km section of I-85 Motorway between Charlotte
and Greenville. Joint Venture lead by Blythe (60%) and Eurovia’s U.S. Sub, Zachry
Construction (40%). Work will begin Spring of 2018 and is expected to take four
years to complete. Project worth $435MM
 Sept. 14, 2016 –Vinci acquires Phoenix, Arizona based TollPlus, a leading company
focused on development, implementation and maintenance of dematerialized
solutions for Electronic Toll Collection operations and customer management. With
this stake, Vinci is strengthening its position in the ETC market, set to grow sharply in
the USA, Latin America, Europe and Asia.
 Jun. 17, 2016 – Reinforced Earth Company (Subsidiary of Vinci Construction) is hired
to supply some 290,000 sq. meters of Reinforced Earth Wall, the Company’s largest
contract ever, to Interstate 4 in Florida.
 Feb. 3, 2016 – Eurovia has finalized the acquisition of Canadian rail works contractor,
Rail Cantech, for an undisclosed amount. Cantech generated about €21M revenue in
2015 and the acquisition adds to Eurovia’s range of services in North America and
increases its industrial capacity in a region where rail activity is growing rapidly.
• 390 N Broadway, Jericho, NY, 11753 • (516) 882-4100 31
Services Overview
Why We Are Different Connecting Global Players to the Local Market
Focused Strictly on Infrastructure
• Management has years of experience in the Infrastructure Industry
• Solely focused on advising public and private clients in the
Infrastructure/Construction sector
Broad Range of Advisory Services
• M&A, Project Financing, Strategic Consulting, Restructuring, Executive
Placement, and Financial Analysis
• All Industry Sub-Sectors
Experience in All Major Infrastructure Markets
• Star America has worked in all infrastructure markets, including Civil
Construction, Vertical Building, Public-Private Partnerships, Industrial
Service Offerings
Business Development
Mergers & Acquisitions PPP Financial Advisory Management Consulting
Capital RaisingStrategic & Financial Analysis
Star is well qualified to assist clients in developing their
business plans in the U.S. Given the depth of
experience of its partners and operating professionals,
the company offers access to thought leadership of C-
Level executives.
We have a strong track record in both domestic and
cross-border M&A advisory roles. We operate both
negotiated processes and auctions, assist in deal
structuring, and provide impartial advice about the merits
of transactions in our industry of focus.
Star provides financial advisory services to companies
and consortia seeking to participate in alternative
procurement processes. We advise on debt capital
raising in the bank and bond markets, and help structure
competitive bids for our clients.
We work with clients to formulate and pursue strategic
and tactical goals. Star provides true business solutions,
including identifying potential management hires,
developing and implementing marketing plans, and
increasing operational efficiencies.
We maintain contacts at banks, hedge funds, equipment
finance companies, and other financial firms. These are
sources of capital for clients desiring funds for
expansionary capital expenditures or general operating
cash flow needs.
Industry analytics form the core of a successful financing
or business development strategy. With our significant
industry knowledge, we assess companies’ current and
projected financial and competitive positions to provide
actionable recommendations. We have the capacity to
provide comprehensive financial analysis allowing
contractors to properly vet lower tiers and improve overall
capital strength.
WWW.STARAMERICAP.COM
• 390 N Broadway, Jericho, NY, 11753 • (516) 882-4100 32
Disclaimer
This presentation regarding Star America Capital Advisors LLC (the “Company”) has been prepared for the exclusive use of the recipient (the “Recipient”). The information contained
herein contains forward-looking statements and includes information provided by the Company and its affiliates (“Star”) and other publicly available information. Star has not
independently verified the publicly available information contained herein, nor does Star make any representation or warranty, either express or implied, as to the accuracy,
completeness or reliability of the publicly available or other information contained in this presentation. The forward-looking statements speak only as of the date of this presentation.
Any estimates or projections as to events that may occur in the future contained in such forward-looking statements are based upon the information available to Star as of the date of
this presentation. There is no guarantee that any of these estimates or projections will be achieved. Actual results may vary from these estimates and projections and such variations
may be material. Star undertakes no obligation to update the forward-looking statements. Star makes no representations or warranties with respect to the information contained in this
overview and Star expressly disclaims any and all liability relating or resulting from the Recipient’s use of this presentation.
This presentation has been prepared solely for discussion purposes. This presentation shall not constitute an offer to sell or the solicitation of an offer to buy any securities, nor shall
there be any offer, solicitation or sale of securities in any jurisdictions in which such offer, solicitation or sale would be unlawful prior to registration or qualification under the securities
laws of any such jurisdiction. The Recipient should not construe the contents of this presentation as legal, tax, accounting or investment advice or a recommendation. The Recipient
should consult its own counsel, tax and financial advisors as to legal and related matters concerning any transaction described herein. This presentation does not purport to be all
inclusive or to contain all of the information which the Recipient may require. No investment, divestment or other financial decisions or actions should be based on the information in
this presentation. If in the future Star offers securities, Star intends to provide the Recipient with a confidential offering memorandum; the Recipient should not rely on the information
contained in this presentation; and the Recipient should read the confidential offering memorandum and all exhibits thereto prior to making any investment decision with respect to the
securities offered thereby.
This presentation has been prepared on a confidential basis solely for the benefit of the Recipient and constitutes confidential information of Star. The Recipient may not copy or
reproduce, distribute, forward to others or otherwise disclose, or use this overview or the information contained herein without the prior written consent of Star.
WWW.STARAMERICAP.COM

More Related Content

What's hot

Wipro – Ratio Analysis
Wipro – Ratio AnalysisWipro – Ratio Analysis
Wipro – Ratio AnalysisJitendra
 
Williams sonoma model
Williams sonoma model Williams sonoma model
Williams sonoma model Trishala Rasya
 
Final presentation-ver-4
Final presentation-ver-4Final presentation-ver-4
Final presentation-ver-4Lê Anh
 
Horniman Horticulture, FIL 349 ( Advanced Financial Theory and Problems)
Horniman Horticulture, FIL 349 ( Advanced Financial Theory and Problems)Horniman Horticulture, FIL 349 ( Advanced Financial Theory and Problems)
Horniman Horticulture, FIL 349 ( Advanced Financial Theory and Problems)CameronMcintosh8
 
Public Construction Company Overviews
Public Construction Company OverviewsPublic Construction Company Overviews
Public Construction Company OverviewsJonathan Hunt
 
Investment Audit PowerPoint Presentation Slides
Investment Audit PowerPoint Presentation SlidesInvestment Audit PowerPoint Presentation Slides
Investment Audit PowerPoint Presentation SlidesSlideTeam
 
GuessBox Financial Model 2017
GuessBox Financial Model 2017GuessBox Financial Model 2017
GuessBox Financial Model 2017GuessBox
 
balance sheet of wipro
balance sheet of wiprobalance sheet of wipro
balance sheet of wiproNaresh Vetti
 
Cfa research presentation university at buffalo
Cfa research presentation university at buffalo Cfa research presentation university at buffalo
Cfa research presentation university at buffalo Ke Guo
 
ration analysis of wipro
ration analysis of wiproration analysis of wipro
ration analysis of wiproMayank Singhal
 
Financial Analysis HCC
Financial Analysis HCCFinancial Analysis HCC
Financial Analysis HCCJaspal Bhatia
 
The Coca-Cola Company - Financial Analysis and Projections
The Coca-Cola Company - Financial Analysis and ProjectionsThe Coca-Cola Company - Financial Analysis and Projections
The Coca-Cola Company - Financial Analysis and ProjectionsRaeann Bailey
 

What's hot (20)

Finance Dashboard Template in Excel
Finance Dashboard Template in ExcelFinance Dashboard Template in Excel
Finance Dashboard Template in Excel
 
Wipro – Ratio Analysis
Wipro – Ratio AnalysisWipro – Ratio Analysis
Wipro – Ratio Analysis
 
Williams sonoma model
Williams sonoma model Williams sonoma model
Williams sonoma model
 
120981064 new-doll
120981064 new-doll120981064 new-doll
120981064 new-doll
 
Final presentation-ver-4
Final presentation-ver-4Final presentation-ver-4
Final presentation-ver-4
 
Horniman Horticulture, FIL 349 ( Advanced Financial Theory and Problems)
Horniman Horticulture, FIL 349 ( Advanced Financial Theory and Problems)Horniman Horticulture, FIL 349 ( Advanced Financial Theory and Problems)
Horniman Horticulture, FIL 349 ( Advanced Financial Theory and Problems)
 
Public Construction Company Overviews
Public Construction Company OverviewsPublic Construction Company Overviews
Public Construction Company Overviews
 
Investment Audit PowerPoint Presentation Slides
Investment Audit PowerPoint Presentation SlidesInvestment Audit PowerPoint Presentation Slides
Investment Audit PowerPoint Presentation Slides
 
Rahul Mehrotra Presentation on Reliance Financial Ratio
Rahul Mehrotra Presentation on Reliance Financial RatioRahul Mehrotra Presentation on Reliance Financial Ratio
Rahul Mehrotra Presentation on Reliance Financial Ratio
 
GuessBox Financial Model 2017
GuessBox Financial Model 2017GuessBox Financial Model 2017
GuessBox Financial Model 2017
 
Ppt ideko spx_team
Ppt ideko spx_teamPpt ideko spx_team
Ppt ideko spx_team
 
02. lbo of micron technologies (deb sahoo)
02. lbo of micron technologies (deb sahoo)02. lbo of micron technologies (deb sahoo)
02. lbo of micron technologies (deb sahoo)
 
balance sheet of wipro
balance sheet of wiprobalance sheet of wipro
balance sheet of wipro
 
Cfa research presentation university at buffalo
Cfa research presentation university at buffalo Cfa research presentation university at buffalo
Cfa research presentation university at buffalo
 
ration analysis of wipro
ration analysis of wiproration analysis of wipro
ration analysis of wipro
 
Financial Analysis HCC
Financial Analysis HCCFinancial Analysis HCC
Financial Analysis HCC
 
Example print out-efm-de
Example print out-efm-deExample print out-efm-de
Example print out-efm-de
 
Larsen & toubro.ppt_25
Larsen & toubro.ppt_25Larsen & toubro.ppt_25
Larsen & toubro.ppt_25
 
Credit Analysis Of HCC
Credit Analysis Of HCCCredit Analysis Of HCC
Credit Analysis Of HCC
 
The Coca-Cola Company - Financial Analysis and Projections
The Coca-Cola Company - Financial Analysis and ProjectionsThe Coca-Cola Company - Financial Analysis and Projections
The Coca-Cola Company - Financial Analysis and Projections
 

Similar to International Contractor Overviews Q2 2017

International Contractor Overviews Q3 2017
International Contractor Overviews Q3 2017International Contractor Overviews Q3 2017
International Contractor Overviews Q3 2017Jonathan Hunt
 
International Contractor Overviews Vol. 1
International Contractor Overviews Vol. 1International Contractor Overviews Vol. 1
International Contractor Overviews Vol. 1Jonathan Hunt
 
Public Construction Company Overviews 1H 2017
Public Construction Company Overviews 1H 2017Public Construction Company Overviews 1H 2017
Public Construction Company Overviews 1H 2017Jonathan Hunt
 
Public Construction Company Overviews
Public Construction Company OverviewsPublic Construction Company Overviews
Public Construction Company OverviewsJonathan Hunt
 
Investment In Business Assets PowerPoint Presentation Slides
Investment In Business Assets PowerPoint Presentation SlidesInvestment In Business Assets PowerPoint Presentation Slides
Investment In Business Assets PowerPoint Presentation SlidesSlideTeam
 
Fixed Capital Analysis PowerPoint Presentation Slides
Fixed Capital Analysis PowerPoint Presentation SlidesFixed Capital Analysis PowerPoint Presentation Slides
Fixed Capital Analysis PowerPoint Presentation SlidesSlideTeam
 
Fixed Capital Evaluation PowerPoint Presentation Slides
Fixed Capital Evaluation PowerPoint Presentation SlidesFixed Capital Evaluation PowerPoint Presentation Slides
Fixed Capital Evaluation PowerPoint Presentation SlidesSlideTeam
 
Fixed investment Evaluation PowerPoint Presentation Slides
Fixed investment Evaluation PowerPoint Presentation SlidesFixed investment Evaluation PowerPoint Presentation Slides
Fixed investment Evaluation PowerPoint Presentation SlidesSlideTeam
 
Fixed investment Assessment PowerPoint Presentation Slides
Fixed investment Assessment PowerPoint Presentation SlidesFixed investment Assessment PowerPoint Presentation Slides
Fixed investment Assessment PowerPoint Presentation SlidesSlideTeam
 
Fixed Capital Assessment PowerPoint Presentation Slides
Fixed Capital Assessment PowerPoint Presentation Slides Fixed Capital Assessment PowerPoint Presentation Slides
Fixed Capital Assessment PowerPoint Presentation Slides SlideTeam
 
Fixed Investment Analysis PowerPoint Presentation Slides
Fixed Investment Analysis PowerPoint Presentation SlidesFixed Investment Analysis PowerPoint Presentation Slides
Fixed Investment Analysis PowerPoint Presentation SlidesSlideTeam
 
Public Construction Company Overviews Q3 2017
Public Construction Company Overviews Q3 2017Public Construction Company Overviews Q3 2017
Public Construction Company Overviews Q3 2017Jonathan Hunt
 
JLL Cleveland Industrial Outlook: Q1 2017
JLL Cleveland Industrial Outlook: Q1 2017JLL Cleveland Industrial Outlook: Q1 2017
JLL Cleveland Industrial Outlook: Q1 2017Andrew Batson
 
Spdr debunking-5-common-gold-misconceptions
Spdr debunking-5-common-gold-misconceptionsSpdr debunking-5-common-gold-misconceptions
Spdr debunking-5-common-gold-misconceptionsZewoMaluk
 
Market Report Comprehensive Q4-Year End
Market Report Comprehensive Q4-Year EndMarket Report Comprehensive Q4-Year End
Market Report Comprehensive Q4-Year EndAllison Seeley
 
Fixed Assets Turnover PowerPoint Presentation Slides
Fixed Assets Turnover PowerPoint Presentation SlidesFixed Assets Turnover PowerPoint Presentation Slides
Fixed Assets Turnover PowerPoint Presentation SlidesSlideTeam
 
Consumption Of Fixed Capital PowerPoint Presentation Slides
Consumption Of Fixed Capital PowerPoint Presentation Slides Consumption Of Fixed Capital PowerPoint Presentation Slides
Consumption Of Fixed Capital PowerPoint Presentation Slides SlideTeam
 
Final work improved 6_revised (1)
Final work improved 6_revised (1)Final work improved 6_revised (1)
Final work improved 6_revised (1)Qasim Ali Pracha
 
CFA Presentation UVU 2014
CFA Presentation UVU 2014CFA Presentation UVU 2014
CFA Presentation UVU 2014Brian Fischer
 

Similar to International Contractor Overviews Q2 2017 (20)

International Contractor Overviews Q3 2017
International Contractor Overviews Q3 2017International Contractor Overviews Q3 2017
International Contractor Overviews Q3 2017
 
International Contractor Overviews Vol. 1
International Contractor Overviews Vol. 1International Contractor Overviews Vol. 1
International Contractor Overviews Vol. 1
 
Public Construction Company Overviews 1H 2017
Public Construction Company Overviews 1H 2017Public Construction Company Overviews 1H 2017
Public Construction Company Overviews 1H 2017
 
Public Construction Company Overviews
Public Construction Company OverviewsPublic Construction Company Overviews
Public Construction Company Overviews
 
Investment In Business Assets PowerPoint Presentation Slides
Investment In Business Assets PowerPoint Presentation SlidesInvestment In Business Assets PowerPoint Presentation Slides
Investment In Business Assets PowerPoint Presentation Slides
 
Fixed Capital Analysis PowerPoint Presentation Slides
Fixed Capital Analysis PowerPoint Presentation SlidesFixed Capital Analysis PowerPoint Presentation Slides
Fixed Capital Analysis PowerPoint Presentation Slides
 
Fixed Capital Evaluation PowerPoint Presentation Slides
Fixed Capital Evaluation PowerPoint Presentation SlidesFixed Capital Evaluation PowerPoint Presentation Slides
Fixed Capital Evaluation PowerPoint Presentation Slides
 
Fixed investment Evaluation PowerPoint Presentation Slides
Fixed investment Evaluation PowerPoint Presentation SlidesFixed investment Evaluation PowerPoint Presentation Slides
Fixed investment Evaluation PowerPoint Presentation Slides
 
Fixed investment Assessment PowerPoint Presentation Slides
Fixed investment Assessment PowerPoint Presentation SlidesFixed investment Assessment PowerPoint Presentation Slides
Fixed investment Assessment PowerPoint Presentation Slides
 
Fixed Capital Assessment PowerPoint Presentation Slides
Fixed Capital Assessment PowerPoint Presentation Slides Fixed Capital Assessment PowerPoint Presentation Slides
Fixed Capital Assessment PowerPoint Presentation Slides
 
Fixed Investment Analysis PowerPoint Presentation Slides
Fixed Investment Analysis PowerPoint Presentation SlidesFixed Investment Analysis PowerPoint Presentation Slides
Fixed Investment Analysis PowerPoint Presentation Slides
 
Public Construction Company Overviews Q3 2017
Public Construction Company Overviews Q3 2017Public Construction Company Overviews Q3 2017
Public Construction Company Overviews Q3 2017
 
JLL Cleveland Industrial Outlook: Q1 2017
JLL Cleveland Industrial Outlook: Q1 2017JLL Cleveland Industrial Outlook: Q1 2017
JLL Cleveland Industrial Outlook: Q1 2017
 
Spdr debunking-5-common-gold-misconceptions
Spdr debunking-5-common-gold-misconceptionsSpdr debunking-5-common-gold-misconceptions
Spdr debunking-5-common-gold-misconceptions
 
Cash Flow Dashboard in Excel
Cash Flow Dashboard in ExcelCash Flow Dashboard in Excel
Cash Flow Dashboard in Excel
 
Market Report Comprehensive Q4-Year End
Market Report Comprehensive Q4-Year EndMarket Report Comprehensive Q4-Year End
Market Report Comprehensive Q4-Year End
 
Fixed Assets Turnover PowerPoint Presentation Slides
Fixed Assets Turnover PowerPoint Presentation SlidesFixed Assets Turnover PowerPoint Presentation Slides
Fixed Assets Turnover PowerPoint Presentation Slides
 
Consumption Of Fixed Capital PowerPoint Presentation Slides
Consumption Of Fixed Capital PowerPoint Presentation Slides Consumption Of Fixed Capital PowerPoint Presentation Slides
Consumption Of Fixed Capital PowerPoint Presentation Slides
 
Final work improved 6_revised (1)
Final work improved 6_revised (1)Final work improved 6_revised (1)
Final work improved 6_revised (1)
 
CFA Presentation UVU 2014
CFA Presentation UVU 2014CFA Presentation UVU 2014
CFA Presentation UVU 2014
 

More from Jonathan Hunt

Kentucky Transportation Report
Kentucky Transportation ReportKentucky Transportation Report
Kentucky Transportation ReportJonathan Hunt
 
Missouri Transporation Report
Missouri Transporation ReportMissouri Transporation Report
Missouri Transporation ReportJonathan Hunt
 
Oregon Transportation Report
Oregon Transportation ReportOregon Transportation Report
Oregon Transportation ReportJonathan Hunt
 
Oklahoma Transportation Report
Oklahoma Transportation ReportOklahoma Transportation Report
Oklahoma Transportation ReportJonathan Hunt
 
Public Construction Overviews - 2Q 2018
Public Construction Overviews - 2Q 2018Public Construction Overviews - 2Q 2018
Public Construction Overviews - 2Q 2018Jonathan Hunt
 
Illinois Transportation Report
Illinois Transportation ReportIllinois Transportation Report
Illinois Transportation ReportJonathan Hunt
 
Public Private Partnerships - State of the Market and the Future of P3's
Public Private Partnerships - State of the Market and the Future of P3'sPublic Private Partnerships - State of the Market and the Future of P3's
Public Private Partnerships - State of the Market and the Future of P3'sJonathan Hunt
 
Virginia Transportation Report
Virginia Transportation ReportVirginia Transportation Report
Virginia Transportation ReportJonathan Hunt
 
Maryland Transportation Report
Maryland Transportation ReportMaryland Transportation Report
Maryland Transportation ReportJonathan Hunt
 

More from Jonathan Hunt (9)

Kentucky Transportation Report
Kentucky Transportation ReportKentucky Transportation Report
Kentucky Transportation Report
 
Missouri Transporation Report
Missouri Transporation ReportMissouri Transporation Report
Missouri Transporation Report
 
Oregon Transportation Report
Oregon Transportation ReportOregon Transportation Report
Oregon Transportation Report
 
Oklahoma Transportation Report
Oklahoma Transportation ReportOklahoma Transportation Report
Oklahoma Transportation Report
 
Public Construction Overviews - 2Q 2018
Public Construction Overviews - 2Q 2018Public Construction Overviews - 2Q 2018
Public Construction Overviews - 2Q 2018
 
Illinois Transportation Report
Illinois Transportation ReportIllinois Transportation Report
Illinois Transportation Report
 
Public Private Partnerships - State of the Market and the Future of P3's
Public Private Partnerships - State of the Market and the Future of P3'sPublic Private Partnerships - State of the Market and the Future of P3's
Public Private Partnerships - State of the Market and the Future of P3's
 
Virginia Transportation Report
Virginia Transportation ReportVirginia Transportation Report
Virginia Transportation Report
 
Maryland Transportation Report
Maryland Transportation ReportMaryland Transportation Report
Maryland Transportation Report
 

Recently uploaded

College Call Girls Nashik Nehal 7001305949 Independent Escort Service Nashik
College Call Girls Nashik Nehal 7001305949 Independent Escort Service NashikCollege Call Girls Nashik Nehal 7001305949 Independent Escort Service Nashik
College Call Girls Nashik Nehal 7001305949 Independent Escort Service NashikCall Girls in Nagpur High Profile
 
(TARA) Talegaon Dabhade Call Girls Just Call 7001035870 [ Cash on Delivery ] ...
(TARA) Talegaon Dabhade Call Girls Just Call 7001035870 [ Cash on Delivery ] ...(TARA) Talegaon Dabhade Call Girls Just Call 7001035870 [ Cash on Delivery ] ...
(TARA) Talegaon Dabhade Call Girls Just Call 7001035870 [ Cash on Delivery ] ...ranjana rawat
 
Call for Papers - African Journal of Biological Sciences, E-ISSN: 2663-2187, ...
Call for Papers - African Journal of Biological Sciences, E-ISSN: 2663-2187, ...Call for Papers - African Journal of Biological Sciences, E-ISSN: 2663-2187, ...
Call for Papers - African Journal of Biological Sciences, E-ISSN: 2663-2187, ...Christo Ananth
 
the ladakh protest in leh ladakh 2024 sonam wangchuk.pptx
the ladakh protest in leh ladakh 2024 sonam wangchuk.pptxthe ladakh protest in leh ladakh 2024 sonam wangchuk.pptx
the ladakh protest in leh ladakh 2024 sonam wangchuk.pptxhumanexperienceaaa
 
(ANVI) Koregaon Park Call Girls Just Call 7001035870 [ Cash on Delivery ] Pun...
(ANVI) Koregaon Park Call Girls Just Call 7001035870 [ Cash on Delivery ] Pun...(ANVI) Koregaon Park Call Girls Just Call 7001035870 [ Cash on Delivery ] Pun...
(ANVI) Koregaon Park Call Girls Just Call 7001035870 [ Cash on Delivery ] Pun...ranjana rawat
 
(PRIYA) Rajgurunagar Call Girls Just Call 7001035870 [ Cash on Delivery ] Pun...
(PRIYA) Rajgurunagar Call Girls Just Call 7001035870 [ Cash on Delivery ] Pun...(PRIYA) Rajgurunagar Call Girls Just Call 7001035870 [ Cash on Delivery ] Pun...
(PRIYA) Rajgurunagar Call Girls Just Call 7001035870 [ Cash on Delivery ] Pun...ranjana rawat
 
The Most Attractive Pune Call Girls Budhwar Peth 8250192130 Will You Miss Thi...
The Most Attractive Pune Call Girls Budhwar Peth 8250192130 Will You Miss Thi...The Most Attractive Pune Call Girls Budhwar Peth 8250192130 Will You Miss Thi...
The Most Attractive Pune Call Girls Budhwar Peth 8250192130 Will You Miss Thi...ranjana rawat
 
Booking open Available Pune Call Girls Koregaon Park 6297143586 Call Hot Ind...
Booking open Available Pune Call Girls Koregaon Park  6297143586 Call Hot Ind...Booking open Available Pune Call Girls Koregaon Park  6297143586 Call Hot Ind...
Booking open Available Pune Call Girls Koregaon Park 6297143586 Call Hot Ind...Call Girls in Nagpur High Profile
 
IMPLICATIONS OF THE ABOVE HOLISTIC UNDERSTANDING OF HARMONY ON PROFESSIONAL E...
IMPLICATIONS OF THE ABOVE HOLISTIC UNDERSTANDING OF HARMONY ON PROFESSIONAL E...IMPLICATIONS OF THE ABOVE HOLISTIC UNDERSTANDING OF HARMONY ON PROFESSIONAL E...
IMPLICATIONS OF THE ABOVE HOLISTIC UNDERSTANDING OF HARMONY ON PROFESSIONAL E...RajaP95
 
(MEERA) Dapodi Call Girls Just Call 7001035870 [ Cash on Delivery ] Pune Escorts
(MEERA) Dapodi Call Girls Just Call 7001035870 [ Cash on Delivery ] Pune Escorts(MEERA) Dapodi Call Girls Just Call 7001035870 [ Cash on Delivery ] Pune Escorts
(MEERA) Dapodi Call Girls Just Call 7001035870 [ Cash on Delivery ] Pune Escortsranjana rawat
 
Extrusion Processes and Their Limitations
Extrusion Processes and Their LimitationsExtrusion Processes and Their Limitations
Extrusion Processes and Their Limitations120cr0395
 
(SHREYA) Chakan Call Girls Just Call 7001035870 [ Cash on Delivery ] Pune Esc...
(SHREYA) Chakan Call Girls Just Call 7001035870 [ Cash on Delivery ] Pune Esc...(SHREYA) Chakan Call Girls Just Call 7001035870 [ Cash on Delivery ] Pune Esc...
(SHREYA) Chakan Call Girls Just Call 7001035870 [ Cash on Delivery ] Pune Esc...ranjana rawat
 
(ANJALI) Dange Chowk Call Girls Just Call 7001035870 [ Cash on Delivery ] Pun...
(ANJALI) Dange Chowk Call Girls Just Call 7001035870 [ Cash on Delivery ] Pun...(ANJALI) Dange Chowk Call Girls Just Call 7001035870 [ Cash on Delivery ] Pun...
(ANJALI) Dange Chowk Call Girls Just Call 7001035870 [ Cash on Delivery ] Pun...ranjana rawat
 
Call Girls Service Nagpur Tanvi Call 7001035870 Meet With Nagpur Escorts
Call Girls Service Nagpur Tanvi Call 7001035870 Meet With Nagpur EscortsCall Girls Service Nagpur Tanvi Call 7001035870 Meet With Nagpur Escorts
Call Girls Service Nagpur Tanvi Call 7001035870 Meet With Nagpur EscortsCall Girls in Nagpur High Profile
 
Structural Analysis and Design of Foundations: A Comprehensive Handbook for S...
Structural Analysis and Design of Foundations: A Comprehensive Handbook for S...Structural Analysis and Design of Foundations: A Comprehensive Handbook for S...
Structural Analysis and Design of Foundations: A Comprehensive Handbook for S...Dr.Costas Sachpazis
 
UNIT-III FMM. DIMENSIONAL ANALYSIS
UNIT-III FMM.        DIMENSIONAL ANALYSISUNIT-III FMM.        DIMENSIONAL ANALYSIS
UNIT-III FMM. DIMENSIONAL ANALYSISrknatarajan
 
Call Girls in Nagpur Suman Call 7001035870 Meet With Nagpur Escorts
Call Girls in Nagpur Suman Call 7001035870 Meet With Nagpur EscortsCall Girls in Nagpur Suman Call 7001035870 Meet With Nagpur Escorts
Call Girls in Nagpur Suman Call 7001035870 Meet With Nagpur EscortsCall Girls in Nagpur High Profile
 
Processing & Properties of Floor and Wall Tiles.pptx
Processing & Properties of Floor and Wall Tiles.pptxProcessing & Properties of Floor and Wall Tiles.pptx
Processing & Properties of Floor and Wall Tiles.pptxpranjaldaimarysona
 

Recently uploaded (20)

College Call Girls Nashik Nehal 7001305949 Independent Escort Service Nashik
College Call Girls Nashik Nehal 7001305949 Independent Escort Service NashikCollege Call Girls Nashik Nehal 7001305949 Independent Escort Service Nashik
College Call Girls Nashik Nehal 7001305949 Independent Escort Service Nashik
 
★ CALL US 9953330565 ( HOT Young Call Girls In Badarpur delhi NCR
★ CALL US 9953330565 ( HOT Young Call Girls In Badarpur delhi NCR★ CALL US 9953330565 ( HOT Young Call Girls In Badarpur delhi NCR
★ CALL US 9953330565 ( HOT Young Call Girls In Badarpur delhi NCR
 
(TARA) Talegaon Dabhade Call Girls Just Call 7001035870 [ Cash on Delivery ] ...
(TARA) Talegaon Dabhade Call Girls Just Call 7001035870 [ Cash on Delivery ] ...(TARA) Talegaon Dabhade Call Girls Just Call 7001035870 [ Cash on Delivery ] ...
(TARA) Talegaon Dabhade Call Girls Just Call 7001035870 [ Cash on Delivery ] ...
 
Call for Papers - African Journal of Biological Sciences, E-ISSN: 2663-2187, ...
Call for Papers - African Journal of Biological Sciences, E-ISSN: 2663-2187, ...Call for Papers - African Journal of Biological Sciences, E-ISSN: 2663-2187, ...
Call for Papers - African Journal of Biological Sciences, E-ISSN: 2663-2187, ...
 
the ladakh protest in leh ladakh 2024 sonam wangchuk.pptx
the ladakh protest in leh ladakh 2024 sonam wangchuk.pptxthe ladakh protest in leh ladakh 2024 sonam wangchuk.pptx
the ladakh protest in leh ladakh 2024 sonam wangchuk.pptx
 
(ANVI) Koregaon Park Call Girls Just Call 7001035870 [ Cash on Delivery ] Pun...
(ANVI) Koregaon Park Call Girls Just Call 7001035870 [ Cash on Delivery ] Pun...(ANVI) Koregaon Park Call Girls Just Call 7001035870 [ Cash on Delivery ] Pun...
(ANVI) Koregaon Park Call Girls Just Call 7001035870 [ Cash on Delivery ] Pun...
 
(PRIYA) Rajgurunagar Call Girls Just Call 7001035870 [ Cash on Delivery ] Pun...
(PRIYA) Rajgurunagar Call Girls Just Call 7001035870 [ Cash on Delivery ] Pun...(PRIYA) Rajgurunagar Call Girls Just Call 7001035870 [ Cash on Delivery ] Pun...
(PRIYA) Rajgurunagar Call Girls Just Call 7001035870 [ Cash on Delivery ] Pun...
 
The Most Attractive Pune Call Girls Budhwar Peth 8250192130 Will You Miss Thi...
The Most Attractive Pune Call Girls Budhwar Peth 8250192130 Will You Miss Thi...The Most Attractive Pune Call Girls Budhwar Peth 8250192130 Will You Miss Thi...
The Most Attractive Pune Call Girls Budhwar Peth 8250192130 Will You Miss Thi...
 
Booking open Available Pune Call Girls Koregaon Park 6297143586 Call Hot Ind...
Booking open Available Pune Call Girls Koregaon Park  6297143586 Call Hot Ind...Booking open Available Pune Call Girls Koregaon Park  6297143586 Call Hot Ind...
Booking open Available Pune Call Girls Koregaon Park 6297143586 Call Hot Ind...
 
IMPLICATIONS OF THE ABOVE HOLISTIC UNDERSTANDING OF HARMONY ON PROFESSIONAL E...
IMPLICATIONS OF THE ABOVE HOLISTIC UNDERSTANDING OF HARMONY ON PROFESSIONAL E...IMPLICATIONS OF THE ABOVE HOLISTIC UNDERSTANDING OF HARMONY ON PROFESSIONAL E...
IMPLICATIONS OF THE ABOVE HOLISTIC UNDERSTANDING OF HARMONY ON PROFESSIONAL E...
 
(MEERA) Dapodi Call Girls Just Call 7001035870 [ Cash on Delivery ] Pune Escorts
(MEERA) Dapodi Call Girls Just Call 7001035870 [ Cash on Delivery ] Pune Escorts(MEERA) Dapodi Call Girls Just Call 7001035870 [ Cash on Delivery ] Pune Escorts
(MEERA) Dapodi Call Girls Just Call 7001035870 [ Cash on Delivery ] Pune Escorts
 
Extrusion Processes and Their Limitations
Extrusion Processes and Their LimitationsExtrusion Processes and Their Limitations
Extrusion Processes and Their Limitations
 
(SHREYA) Chakan Call Girls Just Call 7001035870 [ Cash on Delivery ] Pune Esc...
(SHREYA) Chakan Call Girls Just Call 7001035870 [ Cash on Delivery ] Pune Esc...(SHREYA) Chakan Call Girls Just Call 7001035870 [ Cash on Delivery ] Pune Esc...
(SHREYA) Chakan Call Girls Just Call 7001035870 [ Cash on Delivery ] Pune Esc...
 
(ANJALI) Dange Chowk Call Girls Just Call 7001035870 [ Cash on Delivery ] Pun...
(ANJALI) Dange Chowk Call Girls Just Call 7001035870 [ Cash on Delivery ] Pun...(ANJALI) Dange Chowk Call Girls Just Call 7001035870 [ Cash on Delivery ] Pun...
(ANJALI) Dange Chowk Call Girls Just Call 7001035870 [ Cash on Delivery ] Pun...
 
Call Girls Service Nagpur Tanvi Call 7001035870 Meet With Nagpur Escorts
Call Girls Service Nagpur Tanvi Call 7001035870 Meet With Nagpur EscortsCall Girls Service Nagpur Tanvi Call 7001035870 Meet With Nagpur Escorts
Call Girls Service Nagpur Tanvi Call 7001035870 Meet With Nagpur Escorts
 
DJARUM4D - SLOT GACOR ONLINE | SLOT DEMO ONLINE
DJARUM4D - SLOT GACOR ONLINE | SLOT DEMO ONLINEDJARUM4D - SLOT GACOR ONLINE | SLOT DEMO ONLINE
DJARUM4D - SLOT GACOR ONLINE | SLOT DEMO ONLINE
 
Structural Analysis and Design of Foundations: A Comprehensive Handbook for S...
Structural Analysis and Design of Foundations: A Comprehensive Handbook for S...Structural Analysis and Design of Foundations: A Comprehensive Handbook for S...
Structural Analysis and Design of Foundations: A Comprehensive Handbook for S...
 
UNIT-III FMM. DIMENSIONAL ANALYSIS
UNIT-III FMM.        DIMENSIONAL ANALYSISUNIT-III FMM.        DIMENSIONAL ANALYSIS
UNIT-III FMM. DIMENSIONAL ANALYSIS
 
Call Girls in Nagpur Suman Call 7001035870 Meet With Nagpur Escorts
Call Girls in Nagpur Suman Call 7001035870 Meet With Nagpur EscortsCall Girls in Nagpur Suman Call 7001035870 Meet With Nagpur Escorts
Call Girls in Nagpur Suman Call 7001035870 Meet With Nagpur Escorts
 
Processing & Properties of Floor and Wall Tiles.pptx
Processing & Properties of Floor and Wall Tiles.pptxProcessing & Properties of Floor and Wall Tiles.pptx
Processing & Properties of Floor and Wall Tiles.pptx
 

International Contractor Overviews Q2 2017

  • 1. • 390 N Broadway, Jericho, NY, 11753 • (516) 882-4100 1 International Company Overviews 1H 2017 Company Comparison……………………………………………………….…………………………………..…Page 2 Acciona, S.A.….…………………………………………….………………………………….…………………….Page 3-6 Grupo ACS (ACS)……..……................................................................................................................…Page 7-10 Ferrovial……..…….....................................................................................................................................Page 11-14 OHL…..……..............................................................................................................................................…Page 15-18 Sacyr Vallehermoso, S.A. (Sacyr)………………..…………….................................................……Page 19-22 Skanska………………………………...…………………………..…………………………………………...…Page 23-26 Vinci……………………………………...…………………………..…………………………………………...…Page 27-30 Services Overview – Star America………………………………………………………..…………….…..Page 31 WWW.STARAMERICAP.COM Strict Focus on Infrastructure • Management has years of experience advising clients in the Infrastructure Industry • Unique experience as a partner and advisor to many of the largest U.S. Based and International clients Corporate Advisory Services • Buy Side M&A Services • Sell Side M&A Services • Strategic Consulting • Financial Analysis & Restructuring • Executive Placement Project Advisory Services • DBF Advisory Services • Project Finance Advisory • Project team development services • Outsourced Business Development • Subcontractor vetting & analysis services About Star America
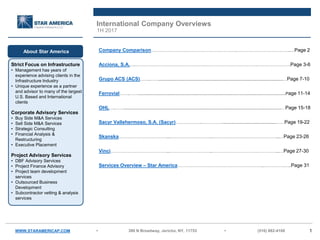
  • 2. • 390 N Broadway, Jericho, NY, 11753 • (516) 882-4100 2 € Millions € Millions € Millions € Millions € Millions SEK Millions € Millions Operating Metrics* LTM Revenue 6,520 33,670 12,128 4,512 3,072 148,744 39,583 Operating Income Margin 6.0% 4.0% 9.7% 3.6% 7.4% 4.0% 10.8% EBITDA Margin 19.1% 6.4% 13.6% 7.9% 12.5% 5.3% 16.0% Construction Backlog 17,677 65,199 31,611 70,823 30,164 202,200 30,700 Construction Backlog Months 32.5x 23.2x 31.3x 188.4x 117.8x 16.3x 9.3x Construction Book-To-Bill 1.2x 1.1x 0.6x (0.8x) 2.2x 1.2x 1.0x Enterprise Value 10,280 14,985 19,141 6,119 4,560 82,961 62,342 Market Cap. 4,245 10,302 13,757 1,050 1,160 75,627 45,613 Trading Metrics** Enterprise Value-To-Revenue 1.6x 0.4x 1.6x 1.4x 1.5x 0.6x 1.6x Enterprise Value-To-EBITDA 8.2x 6.8x 11.7x 17.2x 11.8x 10.3x 9.9x Price-To-Book 1.1x 2.0x 2.0x 0.2x 0.6x 2.6x 2.7x Company Comparison * Operating Metrics based on 6/30/17 ** Trading Metrics based on 30 day average as of 8/23/17 WWW.STARAMERICAP.COM 0.0% 5.0% 10.0% 15.0% 20.0% 25.0% Acciona ACS Ferrovial OHL Sacyr Skanska Vinci Operating Income Margin EBITDA Margin
  • 3. • 390 N Broadway, Jericho, NY, 11753 • (516) 882-4100 3 Company Snapshot - Acciona Price/ Volume Valuation Multiples 30-Day Avg. Share Price (as of 9/8/17) 72.40 52-Week High 82.84 52-Week Low 60.61 Market Cap 4,145,324 Total Debt 6,991,000 Minority Interest 248,000 Total Cash 1,204,000 Enterprise Value 10,180,324 Book Value 3,922,000 Goodwill & Intangibles 536,105 Tangible Book Value 3,385,895 (In € Millions) 2012 2013 2014 2015 2016 Total Revenue 7,015 6,607 6,498 6,543 5,977 Income Overview 2014 2015 2016 2Q2017 Backlog (€ Millions) 15,051 10,258 18,609 17,677 Backlog Months 27.8x 18.8x 37.4x 32.5x Book-To-Bill 0.9x 0.3x 2.4x 1.2x Enterprise Value / Revenue 1.5x 1.5x 1.6x 1.6x Enterprise Value / EBITDA 9.0x 8.3x 8.2x 8.2x Enterprise Value / EBIT 17.2x 15.6x 9.9x 26.1x Price / Earnings 19.1x 16.7x 11.2x N/A Price / Book Value 1.1x 1.0x 1.0x 1.1x Price / Tangible Book Value 1.2x 1.3x 1.2x 1.2x Valuation ( € '000s, except per share data ) FX Rate as of 9/8/17: USD to Euro 0.83491 -40.0% -20.0% 0.0% 20.0% 40.0% -2,000,000 -1,000,000 0 1,000,000 2,000,000 2012 2013 2014 2015 2016 Operating Income EBITDA Operating Margin (RHS)` EBITDA Margin (RHS) 63.03 71.62 0 100 200 300 400 500 600 700 0 € 10 € 20 € 30 € 40 € 50 € 60 € 70 € 80 € 90 € 100 € 12-Sep-16 26-Sep-16 10-Oct-16 24-Oct-16 7-Nov-16 21-Nov-16 5-Dec-16 19-Dec-16 2-Jan-17 16-Jan-17 30-Jan-17 13-Feb-17 27-Feb-17 13-Mar-17 27-Mar-17 10-Apr-17 24-Apr-17 8-May-17 22-May-17 5-Jun-17 19-Jun-17 3-Jul-17 17-Jul-17 31-Jul-17 14-Aug-17 28-Aug-17 Daily Volume, '000s (RHS) Share Price Vol., 30-Day Avg., '000s (RHS)
  • 4. • 390 N Broadway, Jericho, NY, 11753 • (516) 882-4100 4 Balance Sheet Balance Sheet (In € ‘000s) 2014 2015 2016 2Q 2017 Assets: Cash 1,326,812 1,460,173 1,428,319 1,204,000 Other Trade Receivables 1,940,034 1,612,418 1,723,658 1,869,000 Assets Held for Sale 412,137 431,061 327,161 649,000 Other Current Assets 1,692,776 1,389,019 1,244,222 1,402,000 Total Current Assets 5,371,759 4,892,671 4,723,360 5,124,000 Property, Plant & Equipment 8,012,540 7,664,187 7,965,873 9,469,000 Goodwill & Intangibles 212,965 692,917 536,105 536,105 Other Assets 2,155,766 2,118,728 3,021,605 2,278,895 Total Assets 16,143,180 15,777,617 17,407,764 17,408,000 Liabilities: Total Current Borrowings 1,071,817 1,137,141 1,168,506 1,575,000 Accounts Payable 2,558,228 2,024,533 2,297,429 2,206,000 Liabilities Held for Sale 321,419 420,066 186,150 280,000 Other Current Liabilities 659,623 538,531 818,992 410,000 Total Current Liabilities 4,611,087 4,120,271 4,471,077 4,471,000 Total Long-Term Borrowings 5,917,932 5,895,023 5,602,261 5,416,000 Other Liabilities 2,000,674 2,008,178 3,237,080 3,599,000 Total Liabilities 12,529,693 12,023,472 13,310,418 13,486,000 Total Shareholders' Equity: 3,613,487 3,754,145 4,097,346 3,922,000 Total Liabilities & Shareholders' Equity 16,143,180 15,777,617 17,407,764 17,408,000 Total Debt 6,989,749 7,032,164 6,770,767 6,991,000 Net Debt 5,662,937 5,571,991 5,342,448 5,787,000 Backlog 15,051,000 10,258,000 18,609,000 17,677,000 Construction Backlog 5,693,000 6,722,000 8,140,000 7,285,000 Water Backlog 9,358,000 3,536,000 10,469,000 10,392,000
  • 5. • 390 N Broadway, Jericho, NY, 11753 • (516) 882-4100 5 Income Statement Acciona Group Operations Historical Income Statement LTM Half-Year Results (In € '000s) 2014 2015 2016 1H 2017 1H 2016 1H 2017 Revenues 6,498,501 6,543,524 5,977,419 6,520,419 3,083,000 3,626,000 Operating Income (Loss) 571,964 626,919 988,177 390,177 868,000 270,000 Margin (%) 8.8% 9.6% 16.5% 6.0% 28.2% 7.4% EBITDA (Adjusted) 1,098,871 1,174,000 1,192,000 1,246,000 525,000 579,000 Margin (%) 16.9% 17.9% 19.9% 19.1% 17.0% 16.0% Net Income (Loss) 207,192 235,759 373,855 (123,145) 605,000 108,000 Margin (%) 3.2% 3.6% 6.3% (1.9%) 19.6% 3.0% Acciona Construction Operations Historical Income Statement LTM Half Year Results (In € '000s) 2014 2015 2016 1H 2017 1H 2016 1H 2017 Total Revenue 2,625,940 2,169,666 2,266,967 2,956,967 925,000 1,615,000 Operating Income (Loss) 35,845 40,611 83,759 9,759 15,000 28,000 Margin (%) 1.4% 1.9% 3.7% 3.3% 1.6% 1.7% EBITDA (Adjusted) 118,147 101,813 173,615 232,615 51,000 110,000 Margin (%) 4.5% 4.7% 7.7% 7.9% 5.5% 6.8%
  • 6. • 390 N Broadway, Jericho, NY, 11753 • (516) 882-4100 6 Recent News  May 18, 2017: Acciona’s Chairman, José Manuel Entrecanales said that the next phase of the company’s growth will be based on selective bidding for projects that guarantee margins and returns, coupled with a move into new markets that offer opportunities in its two business areas, renewable energy and infrastructure.  May 9, 2017: Acciona Agua, in an equal partnership with Brazilian company GEL, has won a €28.6MM design-build-assist contract for operating a waste water treatment system in Santa Cruz do Capibaribe, Brazil. Acciona will build a waste water treatment plant capable of processing 400 liters per second, potentially catering for a population of up to 197,000.  May 3, 2017: Acciona has been awarded two DBFOM contracts worth €300MM for two potable water plants in Colón, Panama. The two plants will produce over 250,000 m3 and contribute to enhancing the supply of drinking water to the country’s urban dwellers, which is one of the main goals of the “Water for All” National Water Security Plan.  April 27, 2017: Acciona Energy, inaugurated the 93-MW San Roman Wind Farm in Texas. Sam Roman will produce enough energy to power more than 30,000 homes in Southeast Texas.
  • 7. • 390 N Broadway, Jericho, NY, 11753 • (516) 882-4100 7 Company Snapshot - ACS Price/ Volume Valuation Multiples 30-Day Avg. Share Price (as of 9/8/17) 31.99 52-Week High 36.49 52-Week Low 24.34 Market Cap 10,065,452 Total Debt 8,624,000 Minority Interests 1,352,000 Total Cash 5,293,000 Enterprise Value 14,748,452 Book Value 5,018,000 Goodwill & Intangibles 3,691,448 Tangible Book Value 1,326,552 (In € Millions) 2012 2013 2014 2015 2016 Total Revenue 38,396 38,372 34,880 33,291 31,975 Income Overview 2014 2015 2016 2Q2017 Backlog (€ Millions) 63,871 58,942 66,526 65,199 Backlog Months 22.0x 21.2x 25.0x 23.2x Book-To-Bill 1.0x 0.9x 1.2x 1.1x Enterprise Value / Revenue 0.6x 0.4x 0.4x 0.4x Enterprise Value / EBITDA 10.8x 6.5x 6.9x 6.8x Enterprise Value / EBIT 20.1x 12.8x 11.3x 11.0x Price / Earnings 8.3x 6.9x 9.2x 9.3x Price / Book Value 2.1x 1.4x 1.9x 2.0x Price / Tangible Book Value 15.0x 6.2x 6.7x 7.6x 0.0% 5.0% 10.0% 0 1,000,000 2,000,000 3,000,000 4,000,000 2012 2013 2014 2015 2016 Operating Income EBITDA Operating Income Margin (RHS)` EBITDA Margin (RHS) Valuation ( € '000s, except per share data ) 24.96 31.82 0 5,000 10,000 15,000 20,000 25,000 0 € 5 € 10 € 15 € 20 € 25 € 30 € 35 € 40 € 9-Sep-16 23-Sep-16 7-Oct-16 21-Oct-16 4-Nov-16 18-Nov-16 2-Dec-16 16-Dec-16 30-Dec-16 13-Jan-17 27-Jan-17 10-Feb-17 24-Feb-17 10-Mar-17 24-Mar-17 7-Apr-17 21-Apr-17 5-May-17 19-May-17 2-Jun-17 16-Jun-17 30-Jun-17 14-Jul-17 28-Jul-17 11-Aug-17 25-Aug-17 8-Sep-17 Daily Volume, '000s (RHS) Share Price Vol., 30-Day Rolling Avg., '000s (RHS) FX Rate as of 9/8/17: USD to Euro 0.83491
  • 8. • 390 N Broadway, Jericho, NY, 11753 • (516) 882-4100 8 Balance Sheet Balance Sheet (In € ‘000s) 2014 2015 2016 2Q 2017 Assets: Cash & Equivalents 5,167,139 5,803,708 5,654,778 5,293,000 Accounts Receivables 12,719,329 10,915,856 10,987,876 10,985,000 Other Current Assets 7,433,391 4,780,996 4,091,129 3,683,000 Total Current Assets 25,319,859 21,500,560 20,733,783 19,961,000 Property, Plant & Equipment 2,499,928 2,320,355 1,760,014 1,718,000 Goodwill & Intangibles 4,208,767 4,034,482 3,577,316 3,691,448 Concessions 1,164,499 1,116,147 674,552 674,552 Investments in Associates 1,231,256 1,906,898 1,532,300 1,460,000 Other Assets 4,896,426 4,401,386 5,095,301 4,554,000 Total Assets 39,320,735 35,279,828 33,373,266 32,059,000 Liabilities: Concession Borrowings 6,203,509 3,362,744 3,885,591 3,527,000 Other Payables 13,962,196 13,922,567 14,823,117 14,291,000 Concession Provisions 1,011,664 1,011,664 1,019,045 950,000 Other Current Liabilities 3,710,525 1,096,160 729,241 357,000 Total Current Liabilities 24,887,894 19,393,135 20,456,994 19,125,000 Total Long-Term Borrowings 6,090,901 7,382,116 4,906,844 5,097,000 Other Liabilities 3,444,052 3,307,308 3,027,491 2,819,000 Total Liabilities 34,422,847 30,082,559 28,391,329 27,041,000 Total Shareholders' Equity: 4,897,888 5,197,269 4,981,937 5,018,000 Total Liabilities & Shareholders' Equity 39,320,735 35,279,828 33,373,266 32,059,000 Working Capital Ratio 1.02 1.11 1.01 1.04 Total Debt 12,294,410 10,744,860 8,792,435 8,624,000 Net Debt 7,127,271 4,941,152 3,137,657 3,331,000 Backlog 63,871,044 58,942,000 66,526,000 65,199,000
  • 9. • 390 N Broadway, Jericho, NY, 11753 • (516) 882-4100 9 ACS Group Income Statement ACS Group Operations LTM Half-Year Results (In € ‘000s) 2014 2015 2016 1H 2017 1H 2016 1H 2017 Revenues 34,880,860 33,291,309 31,975,212 33,670,212 15,836,000 17,531,000 Operating Income (Loss) 959,641 1,089,133 1,237,430 1,337,430 718,000 818,000 Margin (%) 2.8% 3.3% 3.9% 4.0% 4.5% 4.7% EBITDA 1,783,646 2,141,000 2,023,000 2,156,000 1,091,000 1,224,000 Margin (%) 5.1% 6.4% 6.3% 6.4% 6.9% 7.0% Net Income (Loss) 1,247,000 1,054,247 1,016,910 1,083,910 473,000 540,000 Margin (%) 3.6% 3.2% 3.2% 3.2% 3.0% 3.1% ACS Construction Operations Hochtief Historical Income Statement LTM Half-Year Results (In € ‘000s) 2014 2015 2016 1H 2017 1H 2016 1H 2017 Revenues 22,099,000 21,097,000 19,908,000 21,560,000 9,366,000 11,018,000 Operating Income (Loss) 456,000 689,000 774,000 809,000 423,000 458,000 Margin (%) 2.1% 3.3% 3.9% 3.8% 4.5% 4.2% EBITDA 906,000 1,143,000 1,104,000 1,221,000 548,000 665,000 Margin (%) 4.1% 5.4% 5.5% 5.7% 5.9% 6.0% Dragados Historical Income Statement LTM Half-Year Results (In € ‘000s) 2014 2015 2016 1H 2017 1H 2016 1H 2017 Revenues 3,643,000 4,152,000 4,236,000 4,332,000 1,949,000 2,045,000 Operating Income (Loss) 257,000 230,000 218,000 224,000 122,000 128,000 Margin (%) 7.1% 5.5% 5.1% 5.2% 6.3% 6.3% EBITDA 295,000 292,000 296,000 305,000 156,000 165,000 Margin (%) 8.1% 7.0% 7.0% 7.0% 8.0% 8.1%
  • 10. • 390 N Broadway, Jericho, NY, 11753 • (516) 882-4100 10 Recent News  Aug. 11, 2017: ACS’s subsidiary, CPB Contractors, has been selected by ōtākaro limited to design and construct the Christchurch Convention and Exhibit Centre in New Zealand. The contract will generate revenues of approximately NZ$240MM. Once completed, the Centre is expected to host up to 2,000 delegates and construction works include delivery of a 1,400 delegate auditorium, 3,600 Sq. Meter exhibition hall and 1,600 Sq. Meters in meetings rooms, as well as associated food and beverage and retail amenities. Construction is scheduled to commence in October 2017 and completed by earl y 2020.  Aug. 10, 2017: Hochtief, an ACS subsidiary, has refinanced a long-term syndicated credit facility in the amount of €1.7B. With an international banking syndicate, the Group agreed to a facility with a tenor of five years and extension options of up to two more years. Of the total amount, €1.2B are guaranteed facilities and €0.5B cash facilities at significantly improved terms. The early refinancing of the loan, which expired in 2019, was well received on the international banking market and the interest rate was helped along by both the continuously good market environment and the investment grade rating Hochtief received in May 2017 (BBB by S&P).  May 16, 2017: ACS’s subsidiary, CPB Contractors, will deliver the second and final phase of the NZ Transport Agency project, State Highway 2 Baypark upgrade in Tauranga, New Zealand. The design and construct contract will generate ~€50MM and work will include the building of two flyovers and is scheduled to commence immediately and conclude in 2020.
  • 11. • 390 N Broadway, Jericho, NY, 11753 • (516) 882-4100 11 Company Snapshot - Ferrovial Price/ Volume Valuation Multiples 30-Day Avg. Share Price (as of 9/8/17) 18.67 52-Week High 20.75 52-Week Low 16.04 Market Cap 13,880,414 Total Debt 8,371,000 Minority Interest 733,000 Cash 3,720,000 Enterprise Value 19,264,414 Book Value 7,084,000 Goodwill & Intangibles 2,605,000 Tangible Book Value 4,479,000 (In € Millions) 2012 2013 2014 2015 2016 Total Revenue 7,647 8,176 8,810 9,709 10,765 Income Overview 2014 2015 2016 2Q2017 Backlog (€ Millions) 30,460 31,531 33,519 33,611 Backlog Months 41.5x 39.0x 37.4x 31.3x Book-To-Bill 1.5x 1.1x 1.2x 0.6x Enterprise Value / Revenue 2.0x 2.0x 1.6x 1.6x Enterprise Value / EBITDA 18.0x 15.4x 10.6x 11.7x Enterprise Value / EBIT 24.0x 22.1x 18.3x 16.4x Price / Earnings 31.8x 23.9x 32.3x 45.0x Price / Book Value 1.6x 2.0x 1.7x 2.0x Price / Tangible Book Value 2.3x 2.7x 2.6x 3.1x 0.0% 5.0% 10.0% 15.0% 0 500 1,000 1,500 2,000 2012 2013 2014 2015 2016 Gross Profit EBITDA Gross Profit Margin (RHS)` EBITDA Margin (RHS) Valuation ( € '000s, except per share data ) 17.72 19.25 0 2,000 4,000 6,000 8,000 10,000 12,000 0 € 5 € 10 € 15 € 20 € 25 € 12-Sep-16 26-Sep-16 10-Oct-16 24-Oct-16 7-Nov-16 21-Nov-16 5-Dec-16 19-Dec-16 2-Jan-17 16-Jan-17 30-Jan-17 13-Feb-17 27-Feb-17 13-Mar-17 27-Mar-17 10-Apr-17 24-Apr-17 8-May-17 22-May-17 5-Jun-17 19-Jun-17 3-Jul-17 17-Jul-17 31-Jul-17 14-Aug-17 28-Aug-17 Daily Volume, '000s (RHS) Share Price Vol., 30-Day Rolling Avg., '000s (RHS) FX Rate as of 9/8/17: USD to Euro 0.83491
  • 12. • 390 N Broadway, Jericho, NY, 11753 • (516) 882-4100 12 Balance Sheet Balance Sheet (In € Millions) 2014 2015 2016 2Q 2017 Assets: Unrestricted Cash 3,043 2,973 3,516 3,720 Restricted & Other Infrastructure Cash 396 306 62 53 Trade and Other Receivables 2,170 2,320 2,822 2,888 Other Current Assets 437 546 721 827 Assets Held for Sale 2 2,418 624 258 Total Current Assets 6,048 8,563 7,745 7,746 Investments in Infrastructure Projects 10,757 8,544 7,145 6,970 Infrastructure Investments Under Equity Method (Note 3) 3,251 3,121 2,874 2,784 Goodwill & Intangibles 2,205 2,119 2,699 2,605 Restricted Cash Related to Infrastructure 405 261 249 258 Other Assets 2,807 2,776 2,711 2,543 Total Assets 25,473 25,384 23,423 22,906 Liabilities: Total Current Borrowings 1,368 1,385 302 319 Related to Infrastructure Projects 1,276 1,297 200 200 Non-Infrastructure Related 92 88 102 119 Other Trade Payables 2,665 2,665 2,299 2,346 Operating Provisions 503 622 715 767 Other Current Liabilities 899 1,080 1,814 1,752 Liabilities Classified as held for sale - 2,690 440 188 Total Current Liabilities 5,435 8,442 5,570 5,372 Total Long-Term Borrowings 8,706 6,696 7,874 8,052 Related to Infrastructure Projects 7,331 5,320 5,310 5,193 Non-Infrastructure Project 1,375 1,376 2,564 2,859 Infrastructure Related Provisions 1,378 838 757 747 Other Liabilities 2,946 1,779 1,790 1,651 Total Liabilities 18,465 17,755 15,991 15,822 Total Shareholders' Equity: 7,008 7,629 7,432 7,084 Total Liabilities & Shareholders' Equity 25,473 25,384 23,423 22,906 Working Capital Ratio 1.11 1.01 1.39 1.44 Total Debt 10,074 8,081 8,176 8,371 Net Debt 6,230 4,541 4,349 4,340 Backlog 30,460 31,531 34,682 31,611 Services 22,369 22,800 25,195 22,211 Construction 8,091 8,731 9,487 9,400
  • 13. • 390 N Broadway, Jericho, NY, 11753 • (516) 882-4100 13 Income Statement Ferrovial Group Operations Ferrovial Group Historical Income Statement LTM Half-Year Results (In € '000s) 2014 2015 2016 1H 2017 1H 2016 1H 2017 Revenues 8,810 9,709 10,765 12,128 4,699 6,062 Operating Income (Loss) 743 901 926 1,178 305 557 Margin (%) 8.4% 9.3% 8.6% 9.7% 6.5% 9.2% EBITDA (Adjusted) 992 1,288 1,598 1,646 421 469 Margin (%) 11.3% 13.3% 7.9% 7.9% 9.0% 7.7% Net Income (Loss) 402 720 376 427 189 240 Margin (%) 4.6% 7.4% 3.5% 3.5% 4.0% 4.0% Ferrovial Construction Operations Webber Construction Historical Income Statement LTM Half Year Results (In € '000s) 2014 2015 2016 1H 2017 1H 2016 1H 2017 Total Revenue 673 643 708 751 334 377 Operating Income (Loss) 59 89 44 33 28 17 Margin (%) 8.8% 13.8% 6.2% 4.4% 8.4% 4.5% EBIT 52 81 36 24 24 12 Margin (%) 7.7% 12.6% 5.1% 3.2% 7.2% 3.2%
  • 14. • 390 N Broadway, Jericho, NY, 11753 • (516) 882-4100 14 Recent Global News  Aug. 25, 2017: Ferrovial Airports has signed the contract for remodelling and commercial operations of the Jeppesen Terminal at Denver International Airport. The 34-Year concession represents an investment of $650MM. The other members of the group are Saunders Construction and JLC. Ferrovial Agroman will participate in the construction work. Scope of work includes upgrading 70,000 Sq. meters of floor space, including creating new shopping and foodservice areas, relocating and expanding TSA screening areas, improving building access and passenger flow and other related works.  Jun. 6, 2017: Ferrovial, through subsidiary FBSerwis, has closed the acquisition of 100% of waste management company Trans-Formers Group from Hossanova for ~€37MM. This move strengthens FBSerwis’ presence in urban services.  March 30, 2017: Ferrovial has partnered with the Greater London Authority, in addition to University College London and Future Cities Catapult, to launch “Londoner’s Lab”, a citizen engagement program aimed at transforming the way public services are delivered in the capital.  March 29, 2017: A consortium led by Ferrovial Agroman with Webber and Granite Construction, has been chosen by the Texas Department of Transportation to design and build segments H&I of the State Highway 99 ring road for $855MM. The project comprises the construction of a 52.5 mile stretch of highway.
  • 15. • 390 N Broadway, Jericho, NY, 11753 • (516) 882-4100 15 Company Snapshot - OHL Price/ Volume Valuation Multiples 30-Day Avg. Share Price (as of 9/8/17) 3.5 52-Week High 4.82 52-Week Low 2.44 Market Cap 1,044,461 Total Debt 4,028,700 Total Cash 1,832,200 Non-Controlling Interests 792,300 Enterprise Value 6,113,061 Book Value 4,480,300 Goodwill & Intangibles 263,100 Tangible Book Value 4,217,200 (In € Millions) 2012 2013 2014 2015 2016 Total Revenue 4,029,588 3,684,170 4,536,063 5,218,343 4,638,803 Income Overview 2014 2015 2016 2Q2017 Backlog (€ Millions) 66,766 64,970 82,349 70,823 Backlog Months 176.6x 149.4x 213.0x 188.4x Book-To-Bill 3.0x 0.7x 4.7x (0.8x) Enterprise Value / Revenue 2.1x 1.5x 1.4x 1.4x Enterprise Value / EBITDA 9.0x 8.1x 23.5x 17.2x Enterprise Value / EBIT 15.2x 11.4x 295.1x 37.5x Price / Earnings 10.9x 6.6x N/A N/A Price / Book Value 0.6x 0.4x 0.3x 0.2x Price / Tangible Book Value 0.6x 0.4x 0.3x 0.2x 0.0% 20.0% 40.0% 60.0% 0 500,000 1,000,000 1,500,000 2,000,000 2012 2013 2014 2015 2016 Gross Profit EBITDA Gross Profit Margin (RHS)` EBITDA Margin (RHS) Valuation ( € '000s, except per share data ) 3.34 € 3.56 € 0 2,000 4,000 6,000 8,000 10,000 12,000 14,000 0 € 1 € 2 € 3 € 4 € 5 € 6 € 12-Sep-16 26-Sep-16 10-Oct-16 24-Oct-16 7-Nov-16 21-Nov-16 5-Dec-16 19-Dec-16 2-Jan-17 16-Jan-17 30-Jan-17 13-Feb-17 27-Feb-17 13-Mar-17 27-Mar-17 10-Apr-17 24-Apr-17 8-May-17 22-May-17 5-Jun-17 19-Jun-17 3-Jul-17 17-Jul-17 31-Jul-17 14-Aug-17 28-Aug-17 Daily Volume, '000s (RHS) Share Price Vol., 30-Day Rolling Avg., '000s (RHS) FX Rate as of 9/8/17: USD to Euro 0.83491
  • 16. • 390 N Broadway, Jericho, NY, 11753 • (516) 882-4100 16 Balance Sheet Balance Sheet (In € 000s) 2014 2015 2016 2Q 2017 Cash & Cash Equivalents 787,909 1,097,870 817,872 792,300 Trade and Other Receivables 2,299,896 2,437,800 2,080,218 2,185,600 Assets Held for Sale - 833,272 491,963 - Other Current Assets 632,635 686,302 941,226 626,600 Total Current Assets 3,720,440 5,055,244 4,331,279 3,604,500 Property, Plant & Equipment, Net 593,548 636,029 257,011 237,200 Concession Infrastructure 7,154,037 6,515,565 6,439,634 6,774,900 Goodwill & Intangibles 320,687 316,366 287,029 263,100 Investment in Affiliates & Joint Ventures 1,556,981 1,668,246 513,611 607,800 Other Noncurrent Assets 884,449 1,097,476 1,091,782 1,283,100 Total Assets 14,230,142 15,288,926 12,920,346 12,770,600 Total Current Borrowings 1,457,623 716,312 615,201 627,700 Trade Payables 1,699,168 1,813,110 1,886,063 1,801,400 Liabilities Classified as held for sale - 567,245 220,008 - Other Current Liabilities 532,189 797,131 702,275 634,600 Total Current Liabilities 3,688,980 3,893,798 3,423,547 3,063,700 Total Long-Term Borrowings 5,256,369 4,723,169 3,777,065 3,401,000 Infrastructure Related Provisions 120,586 130,893 121,495 172,400 Other Liabilities 1,671,826 1,729,392 1,676,841 1,825,600 Total Liabilities 10,737,761 10,477,252 8,877,453 8,290,300 Total Shareholders' Equity: 3,492,381 4,811,674 4,042,893 4,480,300 Total Liabilities & Shareholders' Equity 14,230,142 15,288,926 12,920,346 12,770,600 Working Capital Ratio 1.01 1.30 1.27 1.18 Total Debt 6,713,992 5,439,481 4,392,266 4,028,700 Net Debt 5,926,083 4,341,611 3,574,394 3,236,400 Backlog 66,766,001 64,970,206 82,349,646 70,823,400 Concessions 58,445,851 57,509,813 75,449,354 63,510,900 Construction 7,615,351 6,895,311 6,106,305 6,516,300 Other 704,799 565,082 793,987 796,200
  • 17. • 390 N Broadway, Jericho, NY, 11753 • (516) 882-4100 17 OHL Group Income Statement OHL Group Operations OHL Group Historical Income Statement LTM Half-Year Results (In € '000s) 2014 2015 2016 1H 2017 1H 2016 1H 2017 Revenues 4,536,063 5,218,343 4,638,803 4,511,903 2,393,700 2,266,800 Operating Income (Loss) 614,092 684,756 21,939 162,839 270,300 411,200 Margin (%) 13.5% 13.1% 0.5% 3.6% 11.3% 18.1% EBITDA (Adjusted) 1,040,182 967,034 275,835 356,435 385,400 466,000 Margin (%) 22.9% 18.5% 5.9% 7.9% 16.1% 20.6% Net Income (Loss) 185,361 258,553 (235,316) (208,116) 83,500 110,700 Margin (%) 4.1% 5.0% (5.1%) (4.6%) 3.5% 4.9% OHL Construction Operations OHL Construction Historical Income Statement LTM Half Year Results (In € '000s) 2014 2015 2016 1H 2017 1H 2016 1H 2017 Total Revenue 2,787,981 3,248,200 2,773,600 2,524,900 1,555,400 1,306,700 Operating Income (Loss) (159,929) (55,400) (618,100) (573,600) (42,500) 2,000 Margin (%) (5.7%) (1.7%) (22.3%) (22.7%) (2.7%) 0.2% EBITDA 206,259 150,000 (519,900) (530,300) 44,900 34,500 Margin (%) 7.4% 4.6% (18.7%) (21.0%) 2.9% 2.6%
  • 18. • 390 N Broadway, Jericho, NY, 11753 • (516) 882-4100 18 Recent News  July 31, 2017: OHL Group, through subsidiary Judlau Contracting, is set to rehabilitate and improve the capacity of the Canarsie Tunnel in New York, at a cost of €447MM. The project has been awarded by New York’s Metropolitan Transportation Authority to the Joint Venture led by Judlau (70%) and TC Electric (30%). This project includes the rehabilitation of the tunnel following the devastation of hurricane Sandy together with the upgrade of the capacity of the First Avenue and Bedford Avenue subway stations and the construction of a new Avenue B substation.  May 18, 2017: OHL Group, through subsidiary Judlau Contracting, has been awarded two contracts by the New York Metropolitan Transportation Authority in New York for $125MM. The larger project, worth $64MM, is to provide design-build services for flood mitigation at the Hugh L. Carey Tunnel and Queens Midtown Tunnel. The second contract, for over $61MM, is for the second phase of a design-build project to improve critical infrastructure along Metro-North’s Hudson Line.  May 18, 2017: OHL Group, through subsidiary OHL USA, has been awarded two contracts by the Texas Department of Transportation for more than $70MM. The IH- 35 East Oltorf Street project includes operational improvements, construction of new shoulders and auxiliary lanes. The IH-35 East Denton County project includes paving, grading, structures, bridges and frontage roads.
  • 19. • 390 N Broadway, Jericho, NY, 11753 • (516) 882-4100 19 Company Snapshot - Sacyr Price/ Volume Valuation Multiples 30-Day Avg. Share Price (as of 9/8/17) 2.25 52-Week High 2.75 52-Week Low 1.68 Market Cap 1,154,785 Total Debt 3,719,269 Minority Interests 316,478 Total Cash 635,480 Enterprise Value 4,555,052 Book Value 1,934,368 Goodwill & Intangibles 199,046 Tangible Book Value 1,735,322 (In SEK Millions) 2012 2013 2014 2015 2016 Total Revenue 3,827 2,782 2,809 3,063 2,963 Income Overview 2014 2015 2016 2Q2017 Backlog (SEK Millions) 24,832 26,845 25,956 30,164 Backlog Months 106.1x 105.2x 105.1x 117.8x Book-To-Bill 1.1x 1.7x 0.7x 2.2x Enterprise Value / Revenue 3.1x 1.8x 2.1x 1.5x Enterprise Value / EBITDA 31.6x 17.1x 17.1x 11.8x Enterprise Value / EBIT 44.5x 36.8x 29.6x 20.0x Price / Earnings 60.6x 2.3x 15.2x 8.5x Price / Book Value 1.5x 0.5x 1.0x 0.6x Price / Tangible Book Value 1.7x 0.5x 1.1x 0.7x Valuation ( € '000s,) except per share data) FX Rate as of 9/8/17: USD to Euro 0.83491 0.0% 5.0% 10.0% 15.0% 0 50,000 100,000 150,000 200,000 250,000 2012 2013 2014 2015 2016 Operating Income EBITDA Operating Margin EBITDA Margin (RHS) 1.76 2.29 0 5,000 10,000 15,000 20,000 25,000 30,000 35,000 0 € 1 € 2 € 3 € 4 € 12-Sep-16 26-Sep-16 10-Oct-16 24-Oct-16 7-Nov-16 21-Nov-16 5-Dec-16 19-Dec-16 2-Jan-17 16-Jan-17 30-Jan-17 13-Feb-17 27-Feb-17 13-Mar-17 27-Mar-17 10-Apr-17 24-Apr-17 8-May-17 22-May-17 5-Jun-17 19-Jun-17 3-Jul-17 17-Jul-17 31-Jul-17 14-Aug-17 28-Aug-17 Daily Volume, '000s (RHS) Share Price Vol., 30-Day Rolling Avg., '000s (RHS)
  • 20. • 390 N Broadway, Jericho, NY, 11753 • (516) 882-4100 20 Balance Sheet Balance Sheet (In € 000s) 2014 2015 2016 2Q 2017 Assets: Cash 358,475 602,822 621,308 635,480 Receivables 1,888,173 1,996,615 2,065,683 2,172,098 Assets Held for Sale 302,623 527,535 475,406 466,558 Other Current Assets 599,547 552,417 502,784 500,708 Total Current Assets 3,148,818 3,679,389 3,665,181 3,774,844 Goodwill & Intangible Assets 125,224 201,394 198,544 199,046 Concessions Investments 1,213,675 1,643,853 1,402,267 1,381,610 Other Assets 7,116,576 4,932,838 5,422,953 5,303,666 Total Assets 11,604,293 10,457,474 10,688,945 10,659,166 Liabilities: Financial Debt 3,445,304 850,612 829,062 867,951 Trade & Other Payables 1,914,690 1,946,695 1,550,211 1,487,348 Operating Provisions 315,908 246,248 220,778 219,862 Liabilities Held for Sale 219,771 224,186 203,042 194,188 Other Current Liabilities 237,698 225,823 533,825 628,408 Total Current Liabilities 6,133,371 3,493,564 3,336,918 3,397,757 Financial Debt 3,411,860 4,072,303 3,605,678 2,851,318 Provisions 279,248 361,804 370,428 375,486 Other Liabilities 453,740 618,213 1,295,582 2,100,237 Total Liabilities 10,278,219 8,545,884 8,608,606 8,724,798 Total Shareholders' Equity: 1,326,074 1,911,590 2,080,339 1,934,368 Total Liabilities & Shareholders' Equity 11,604,293 10,457,474 10,688,945 10,659,166 Working Capital Ratio 0.51 1.05 1.10 1.11 Total Debt 6,857,164 4,922,915 4,434,740 3,719,269 Net Debt 6,498,689 4,320,093 3,813,432 3,083,789 Backlog 25,067,121 26,845,418 25,956,000 30,164,000 Construction 4,988,000 5,062,000 4,131,000 4,501,000 Concessions 11,402,000 13,339,000 12,926,000 17,126,000 Services 6,034,000 6,031,000 6,447,000 6,038,000 Industrial 2,408,000 2,413,000 2,452,000 2,499,000
  • 21. • 390 N Broadway, Jericho, NY, 11753 • (516) 882-4100 21 Income Statement Sacyr Group Operations Historical Income Statement LTM Half-Year Results (In € 000s) 2014 2015 2016 1H 2017 1H 2016 1H 2017 Revenues 2,809,669 3,063,394 2,963,652 2,963,652 1,413,916 1,522,573 Operating Income (Loss) 193,776 147,821 208,081 208,081 116,466 135,834 Margin (%) 6.9% 4.8% 7.0% 7.0% 8.2% 8.9% EBITDA 272,467 318,000 359,561 359,561 164,902 190,828 Margin (%) 9.7% 10.4% 12.1% 12.1% 11.7% 12.5% Net Income 33,000 383,658 135,252 135,252 70,821 71,501 Margin (%) 1.2% 12.5% 4.6% 4.6% 5.0% 4.7%
  • 22. • 390 N Broadway, Jericho, NY, 11753 • (516) 882-4100 22 Recent Global News  July 7, 2017: The General Directorate of Road Maintenance in Mexico has awarded SACYR Concessiones its first Public Private Partnership project in the country: renovation, maintenance and conservation of a 91.5-km road worth ~€190MM. The 10-year term project consists of renovation, maintenance and conservation of two road sections in the states of Mexico and Hidalgo. The scope of the project includes asphalting reinforcement of slopes, drainage and horizontal and vertical signage.  Feb. 16, 2017: (Chile) The Ministry of Public Works has awarded the construction of the future Biprovinchal Hospital Quillota-Petorca to the consortium formed by Sacyr Chile and Somague, both Sacyr subsidiaries, for USD $114MM. The built-up surface area of the project will be 73,204 square meters. Sacyr has been in Chile for 20 years, having become the country’s most important private investor in infrastructure with USD $6.5B invested in concession and infrastructure construction projects.  Oct. 25, 2016: (Spain) The General Water Directorate has awarded a Sacyr Construction and Sadyt the contract to draft and execute the works pertaining to the Wastewater Treatment Plant of Ibiza for €24.6MM. The project is expected to take 33 months.
  • 23. • 390 N Broadway, Jericho, NY, 11753 • (516) 882-4100 23 Company Snapshot - Skanska Price/ Volume Valuation Multiples 30-Day Avg. Share Price (as of 9/8/17) 181.90 52-Week High 226.60 52-Week Low 178.00 Market Cap (SEK MM) 74,538 Total Debt 11,432 Total Cash 4,253 Non-Controlling Interests 155 Enterprise Value 81,872 Book Value 29,021 Goodwill & Intangibles 6,185 Tangible Book Value 33,810 (In SEK Millions) 2012 2013 2014 2015 2016 Total Revenue 129,350 136,589 143,325 153,049 145,365 Income Overview 2014 2015 2016 2Q2017 Backlog (SEK Millions) 170,498 158,248 196,254 202,200 Backlog Months 14.3x 12.4x 16.2x 16.3x Book-To-Bill 1.3x 0.9x 1.3x 1.2x Enterprise Value / Revenue 0.6x 0.5x 0.6x 0.6x Enterprise Value / EBITDA 11.6x 8.8x 10.2x 10.3x Enterprise Value / EBIT 15.6x 11.2x 13.0x 13.8x Price / Earnings 21.4x 15.0x 15.5x 10.8x Price / Book Value 3.8x 3.0x 3.2x 2.6x Price / Tangible Book Value 3.0x 2.4x 2.6x 2.2x Valuation (SEK Millions, except per share data) FX Rate as of 9/8/17: USD to SEK 7.95014 0.0% 5.0% 10.0% 15.0% 0 5,000 10,000 15,000 2012 2013 2014 2015 2016 Gross Profit EBITDA Gross Profit Margin (RHS)` EBITDA Margin (RHS) 183.60 182.00 0 1,000 2,000 3,000 4,000 5,000 6,000 7,000 8,000 SEK 0 SEK 50 SEK 100 SEK 150 SEK 200 SEK 250 23-Aug-16 6-Sep-16 20-Sep-16 4-Oct-16 18-Oct-16 1-Nov-16 15-Nov-16 29-Nov-16 13-Dec-16 27-Dec-16 10-Jan-17 24-Jan-17 7-Feb-17 21-Feb-17 7-Mar-17 21-Mar-17 4-Apr-17 18-Apr-17 2-May-17 16-May-17 30-May-17 13-Jun-17 27-Jun-17 11-Jul-17 25-Jul-17 8-Aug-17 22-Aug-17 5-Sep-17 Daily Volume, '000s (RHS) Share Price Vol., 30-Day Rolling Avg., '000s (RHS)
  • 24. • 390 N Broadway, Jericho, NY, 11753 • (516) 882-4100 24 Balance Sheet Balance Sheet (In SEK Millions) 2014 2015 2016 2Q 2017 Corporate Level Cash 9,107 11,840 5,430 4,253 Total Accounts Receivable 26,288 25,877 29,759 27,626 Other Current Assets 39,372 41,843 51,350 54,661 Total Current Assets 74,767 79,560 86,539 86,540 Property, Plant & Equipment 7,122 6,504 6,837 6,963 Goodwill & Intangibles 5,740 6,010 6,304 6,185 Investments in JVs and Affiliates 2,618 2,852 4,160 3,773 Other Non-Current Assets 2,527 2,741 2,665 2,657 Total Assets 92,774 97,667 106,505 106,118 Total Current Debt 4,086 6,555 6,681 8,015 Accounts Payable 31,540 31,771 34,963 36,221 Other Current Liabilities 23,010 26,006 27,306 26,427 Total Current Liabilities 58,636 64,332 68,950 70,663 Total Long Term Debt 7,112 3,874 3,656 3,417 Other Long Term Liabilities 5,621 5,255 6,393 7,590 Total Liabilities 71,369 73,461 78,999 81,670 Total Shareholders' Equity: 21,405 24,206 27,506 24,448 Total Liabilities & Shareholders' Equity 92,774 97,667 106,505 106,118 Working Capital Ratio 1.3x 1.2x 1.3x 1.2x Total Debt 11,198 10,429 10,337 11,432 Net Debt 2,091 (1,411) 4,907 7,179 Backlog 170,498 158,248 196,254 202,200
  • 25. • 390 N Broadway, Jericho, NY, 11753 • (516) 882-4100 25 Income Statement Skanska Group Operations Skanska Group Historical Income Statement LTM Half-Year Results (In € '000s) 2014 2015 2016 1H 2017 1H 2016 1H 2017 Revenues 143,325 153,049 145,365 148,744 70,328 73,707 Gross Profit 13,110 13,889 14,246 12,344 7,483 5,581 Margin (%) 9.1% 9.1% 9.8% 8.3% 10.6% 7.6% Operating Income (Loss) 5,409 6,290 7,220 5,938 3,336 2,054 Margin (%) 3.8% 4.1% 5.0% 4.0% 4.7% 2.8% EBITDA (Adjusted) 7,282 7,971 9,193 7,937 4,041 2,785 Margin (%) 5.1% 5.2% 6.3% 5.3% 5.7% 3.8% Skanska Construction Operations Skanska Construction Historical Income Statement LTM Half Year Results (In € '000s) 2014 2015 2016 1H 2017 1H 2016 1H 2017 Total Revenue 128,700 140,648 138,001 144,564 64,205 70,768 Gross Profit 10,039 10,080 9,376 4,565 3,861 Margin (%) 7.1% 7.3% 6.5% 7.1% 5.5% Operating Income (Loss) 4,508 3,874 3,546 2,714 1,340 508 Margin (%) 3.5% 2.8% 2.6% 1.9% 2.1% 0.7% EBITDA 5,956 5,241 4,894 4,085 1,964 1,155 Margin (%) 4.6% 3.7% 3.5% 2.8% 3.1% 1.6%
  • 26. • 390 N Broadway, Jericho, NY, 11753 • (516) 882-4100 26 Recent Global News  Aug. 29, 2017: Skanska has signed a contract with the Meridian Group and the Rockefeller Group to build a new office building and movie theater in Tysons Corner in Virginia. The contract is worth $167MM. Skanska will build the new 20-story, 42,500 Sq. Meter Class A office building and a more than 10,000 Sq. Meter movie theater. Construction is ongoing, and the project is expected to be completed in October 2018.  July 7, 2017: Skanska has signed a contract with the University of South Florida to build the Morsani College of Medicine and Heart Institute tower in Tampa, FL, USA. The contract is worth $41MM. The new education and research tower will be located in an urban setting of the downtown area of the city. With about 409,000 Sq. Feet, the building will consist of an anticipated 14 levels. Construction began in Aug. 2017 and the project is expected to be complete in December 2019.  June 22, 2017: Skanska has signed a contract with New York City Transit for the improvements at four subway stations along the Astoria Line in the Borough of Queens in New York City. The contract is for $150MM. The project, which includes design and construction, consists of the rehabilitation of four elevated transit stations and the work includes new stairs, guard rails, automated fare collection areas and electrical upgrades as well as rehabilitating and strengthening structural concrete and steel. Construction began in April 2017 with an estimated completion in the first quarter of 2019.
  • 27. • 390 N Broadway, Jericho, NY, 11753 • (516) 882-4100 27 Company Snapshot - Vinci Price/ Volume Valuation Multiples 30-Day Avg. Share Price 76.91 52-Week High 79.91 52-Week Low 58.80 Market Cap 45,613,379 Total Debt 20,982,000 Minority Interest 531,000 Total Cash 4,784,000 Enterprise Value 62,342,379 Book Value 17,006,000 Goodwill & Intangibles 8,606,000 Tangible Book Value 8,400,000 (In € Millions) 2012 2013 2014 2015 2016 Total Revenue 15,327 16,775 15,419 14,491 13,681 Income Overview 2014 2015 2016 2Q2017 Backlog (€ Millions) 27,900 28,700 29,200 30,700 Backlog Months 8.6x 8.8x 9.1x 9.3x Book-To-Bill 1.0x 1.0x 1.0x 1.0x Enterprise Value / Revenue 1.2x 1.3x 1.5x 1.6x Enterprise Value / EBITDA 7.0x 8.8x 9.2x 9.9x Enterprise Value / EBIT 10.8x 13.6x 13.6x 14.6x Price / Earnings 16.3x 17.7x 16.0x 17.1x Price / Book Value 2.1x 2.4x 2.4x 2.7x Price / Tangible Book Value 4.2x 4.9x 4.8x 5.4x Valuation ( € '000s, except per share data ) FX Rate as of 9/8/17: USD to Euro 0.83491 0.0% 5.0% 10.0% 15.0% 0 500 1,000 1,500 2,000 2012 2013 2014 2015 2016 Gross Profit EBITDA Gross Profit Margin (RHS)` EBITDA Margin (RHS) 66.98 79.04 0 1,000 2,000 3,000 4,000 5,000 6,000 7,000 € 0 € 10 € 20 € 30 € 40 € 50 € 60 € 70 € 80 € 90 9-Sep-16 23-Sep-16 7-Oct-16 21-Oct-16 4-Nov-16 18-Nov-16 2-Dec-16 16-Dec-16 30-Dec-16 13-Jan-17 27-Jan-17 10-Feb-17 24-Feb-17 10-Mar-17 24-Mar-17 7-Apr-17 21-Apr-17 5-May-17 19-May-17 2-Jun-17 16-Jun-17 30-Jun-17 14-Jul-17 28-Jul-17 11-Aug-17 25-Aug-17 8-Sep-17 Daily Volume, '000s (RHS) Share Price Vol., 30-Day Rolling Avg., '000s (RHS)
  • 28. • 390 N Broadway, Jericho, NY, 11753 • (516) 882-4100 28 Balance Sheet Balance Sheet (In € Millions) 2014 2015 2016 2Q 2017 Assets: Cash and Cash Equivalents 6,411 5,632 6,678 4,784 Inventories and Work in Progress 932 964 935 946 Trade and Other Receivables 10,960 10,696 11,422 11,638 Other Current Operating Assets 4,568 4,635 5,099 4,823 Other Current Assets 905 953 781 763 Total Current Assets 23,776 22,880 24,915 22,954 Concession Intangible Assets 24,141 23,915 26,691 26,463 Goodwill & Intangibles 7,407 7,683 8,522 8,606 Other Assets 7,706 7,669 7,803 7,947 Total Assets 63,030 62,147 67,931 65,925 Liabilities: Current Borrowings 4,061 3,986 5,229 4,897 Current Provisions 3,844 4,053 4,172 4,065 Trade Payables 7,620 7,590 7,740 7,345 Other Current Operating Liabilities 10,769 10,884 11,838 11,014 Other Current Liabilities 454 904 836 785 Total Current Liabilities 26,748 27,417 29,815 28,106 Total Long-Term Borrowings 17,134 15,001 16,265 16,085 Other Liabilities 4,280 4,473 4,845 4,728 Total Liabilities 48,162 46,891 50,925 48,919 Total Shareholders' Equity: 14,868 15,256 17,006 17,006 Total Liabilities & Shareholders' Equity 63,030 62,147 67,931 65,925 Working Capital Ratio 0.89 0.83 0.84 0.82 Total Debt 21,195 18,987 21,494 20,982 Net Debt 14,784 13,355 14,816 16,198 Backlog 27,900 28,700 29,200 30,700 Cash Flow From Operations 3,633 4,521 4,346 4,390
  • 29. • 390 N Broadway, Jericho, NY, 11753 • (516) 882-4100 29 VINCI Group Income Statement Vinci Group Operations Vinci Group Historical Income Statement LTM Half-Year Results (In € '000s) 2014 2015 2016 1H 2017 1H 2016 1H 2017 Revenues 39,043 39,161 38,547 39,583 17,802 18,838 Gross Profit 4,243 3,715 4,118 4,258 1,706 1,846 Margin (%) 10.9% 9.5% 10.7% 10.8% 9.6% 9.8% Operating Income (Loss) 6,590 5,748 6,121 6,321 2,606 2,806 Margin (%) 16.9% 14.7% 15.9% 16.0% 14.6% 14.9% EBITDA (Adjusted) 1,906 2,079 2,545 2,660 940 1,055 Margin (%) 4.9% 5.3% 6.6% 6.7% 5.3% 5.6% Vinci Construction Operations Vinci Construction Historical Income Statement LTM Half Year Results (In € '000s) 2014 2015 2016 1H 2017 1H 2016 1H 2017 Total Revenue 15,419 14,491 13,681 13,778 6,453 6,550 Operating Income (Loss) 380 299 330 328 92 90 Margin (%) 2.5% 2.1% 2.4% 2.4% 1.4% 1.4% EBITDA 625 536 539 506 211 178 Margin (%) 4.1% 3.7% 3.9% 3.7% 3.3% 2.7%
  • 30. • 390 N Broadway, Jericho, NY, 11753 • (516) 882-4100 30 Recent News  Dec. 19, 2016 – Inauguration of Vinci’s first PPP Motorway in United States. 35-Year Concession for East End Crossing project connecting Indiana & Kentucky, which was valued at ~$1B. Vinci built 12 km of new infrastructure connecting Indiana and Kentucky; a cable-stayed bridge, a dual-tube tunnel and 19 engineering structures.  Dec. 15, 2016 – Eurovia (Vinci’s Sub) wins contract to renovate and widen the I-85 Motorway in Spartanburg and Cherokee Counties, South Carolina. Design-Build Contract to renovate and widen a 32 km section of I-85 Motorway between Charlotte and Greenville. Joint Venture lead by Blythe (60%) and Eurovia’s U.S. Sub, Zachry Construction (40%). Work will begin Spring of 2018 and is expected to take four years to complete. Project worth $435MM  Sept. 14, 2016 –Vinci acquires Phoenix, Arizona based TollPlus, a leading company focused on development, implementation and maintenance of dematerialized solutions for Electronic Toll Collection operations and customer management. With this stake, Vinci is strengthening its position in the ETC market, set to grow sharply in the USA, Latin America, Europe and Asia.  Jun. 17, 2016 – Reinforced Earth Company (Subsidiary of Vinci Construction) is hired to supply some 290,000 sq. meters of Reinforced Earth Wall, the Company’s largest contract ever, to Interstate 4 in Florida.  Feb. 3, 2016 – Eurovia has finalized the acquisition of Canadian rail works contractor, Rail Cantech, for an undisclosed amount. Cantech generated about €21M revenue in 2015 and the acquisition adds to Eurovia’s range of services in North America and increases its industrial capacity in a region where rail activity is growing rapidly.
  • 31. • 390 N Broadway, Jericho, NY, 11753 • (516) 882-4100 31 Services Overview Why We Are Different Connecting Global Players to the Local Market Focused Strictly on Infrastructure • Management has years of experience in the Infrastructure Industry • Solely focused on advising public and private clients in the Infrastructure/Construction sector Broad Range of Advisory Services • M&A, Project Financing, Strategic Consulting, Restructuring, Executive Placement, and Financial Analysis • All Industry Sub-Sectors Experience in All Major Infrastructure Markets • Star America has worked in all infrastructure markets, including Civil Construction, Vertical Building, Public-Private Partnerships, Industrial Service Offerings Business Development Mergers & Acquisitions PPP Financial Advisory Management Consulting Capital RaisingStrategic & Financial Analysis Star is well qualified to assist clients in developing their business plans in the U.S. Given the depth of experience of its partners and operating professionals, the company offers access to thought leadership of C- Level executives. We have a strong track record in both domestic and cross-border M&A advisory roles. We operate both negotiated processes and auctions, assist in deal structuring, and provide impartial advice about the merits of transactions in our industry of focus. Star provides financial advisory services to companies and consortia seeking to participate in alternative procurement processes. We advise on debt capital raising in the bank and bond markets, and help structure competitive bids for our clients. We work with clients to formulate and pursue strategic and tactical goals. Star provides true business solutions, including identifying potential management hires, developing and implementing marketing plans, and increasing operational efficiencies. We maintain contacts at banks, hedge funds, equipment finance companies, and other financial firms. These are sources of capital for clients desiring funds for expansionary capital expenditures or general operating cash flow needs. Industry analytics form the core of a successful financing or business development strategy. With our significant industry knowledge, we assess companies’ current and projected financial and competitive positions to provide actionable recommendations. We have the capacity to provide comprehensive financial analysis allowing contractors to properly vet lower tiers and improve overall capital strength. WWW.STARAMERICAP.COM
  • 32. • 390 N Broadway, Jericho, NY, 11753 • (516) 882-4100 32 Disclaimer This presentation regarding Star America Capital Advisors LLC (the “Company”) has been prepared for the exclusive use of the recipient (the “Recipient”). The information contained herein contains forward-looking statements and includes information provided by the Company and its affiliates (“Star”) and other publicly available information. Star has not independently verified the publicly available information contained herein, nor does Star make any representation or warranty, either express or implied, as to the accuracy, completeness or reliability of the publicly available or other information contained in this presentation. The forward-looking statements speak only as of the date of this presentation. Any estimates or projections as to events that may occur in the future contained in such forward-looking statements are based upon the information available to Star as of the date of this presentation. There is no guarantee that any of these estimates or projections will be achieved. Actual results may vary from these estimates and projections and such variations may be material. Star undertakes no obligation to update the forward-looking statements. Star makes no representations or warranties with respect to the information contained in this overview and Star expressly disclaims any and all liability relating or resulting from the Recipient’s use of this presentation. This presentation has been prepared solely for discussion purposes. This presentation shall not constitute an offer to sell or the solicitation of an offer to buy any securities, nor shall there be any offer, solicitation or sale of securities in any jurisdictions in which such offer, solicitation or sale would be unlawful prior to registration or qualification under the securities laws of any such jurisdiction. The Recipient should not construe the contents of this presentation as legal, tax, accounting or investment advice or a recommendation. The Recipient should consult its own counsel, tax and financial advisors as to legal and related matters concerning any transaction described herein. This presentation does not purport to be all inclusive or to contain all of the information which the Recipient may require. No investment, divestment or other financial decisions or actions should be based on the information in this presentation. If in the future Star offers securities, Star intends to provide the Recipient with a confidential offering memorandum; the Recipient should not rely on the information contained in this presentation; and the Recipient should read the confidential offering memorandum and all exhibits thereto prior to making any investment decision with respect to the securities offered thereby. This presentation has been prepared on a confidential basis solely for the benefit of the Recipient and constitutes confidential information of Star. The Recipient may not copy or reproduce, distribute, forward to others or otherwise disclose, or use this overview or the information contained herein without the prior written consent of Star. WWW.STARAMERICAP.COM