The modern era of “workforce development” can trace its roots back to the Manpower Development and Training Act (MDTA) of the 1960s and the Comprehensive Employment and Training Act (CETA) of the 1970s. Notable legislative milestones that followed included the Job Training Partnership Act (JTPA) of the 1980s that established a stronger role for employers via “private industry councils”, and then the Workforce Investment Act in the 1990s that emphasized service/funding coordination via “one stop centers.” It seems apparent that we are desperately in need of another transition as the Workforce Investment Act (WIA), passed in 1998 as a 5-year law continues to operate on year-to-year extensions combined with funding reductions. This session will discuss the needs and demands of the current workforce system and future policy course.
The following fact sheet distills some of the more problematic indicators of young adults are faring today, including employment & earnings, post-secondary education, as well as the accumulation of debt & assets.
Technology Adoption Lifecycle meets Intercultural Competence ContinuumKevin Carter
Special thanks to Daniel Maycock, an IT Strategy Solution Architect for Slalom Consulting, for being the inspiration to the diagram above. The model represents the belief that as leaders increase their cultural competence, they also increase their ability to inspire technology adoption with a larger base of individuals.
Inclusion Innovation represents the intersection of Diversity, Inclusion, Intercultural Competence and Social Media Technology.
What do you think?
Diversity, Inclusion & Innovation - Strategic Leadership Assessment Tool
The DII-SLA Provides a quantitative measurement of an leaders' comfort level and effectiveness in leveraging diversity, intercultural competence and Internet technologies to foster innovations in business products, services, processes and practices. The DII-SLA can be used as an initial assessment or to measure progress.
A leader with a high assessment score is more likely to engage all members of their team towards successful completion of organizational objectives.
Hang in there! You are somebody’s hope. There is a rumor mulling around
in colleges across the land that science, technology, engineering, and
math are the “hardcore” fields that some advance, others try, and many
avoid. Women and minorities are grossly underrepresented in STEM
careers and the numbers continue to decline. In a 2010 Bayer Corp. survey
of 1,226 women and underrepresented minority chemists and chemical
engineers, 40 percent said they were discouraged from pursuing a STEM
career. Sixty percent said college was where most of the discouragement
happened. STEM careers offer a rewarding journey of innovation and
powerful contributions, solutions, and tools that secure and advance our
future. So, what do you need to do to overcome challenges and succeed
in these fields?
At the end of this workshop, college students will:
a. Explore STEM Stats and common reasons students get discouraged
b. Create a resource toolbox and networking plan to overcome challenges
c. Explore 7 key habits that can increase success
d. Examine the benefits and options of a great STEM Career Path
STEM education: preparing for the jobs of the futureElsevier
A Report by the US Senate Joint Economic Committee Chairman’s Staff, Senator Bob Casey, Chairman, April 2012. "While it is difficult to project trends in the labor market, the demand for STEM-skilled workers is expected to continue to increase in the future, as both the number and proportion of STEM jobs are projected to grow," the authors write. This report considers studies, statistics and economic trends to anticipate where those jobs will be.
Women, the world's most valuable human resource, are the foundations of global economy.The low representation of women in the Science and Technolgy field is a social and economic concern.
Science, Technology, Engineering, and Mathematics workers are the source of growth and innovation, but meeting the economy's demand for these critical skills will be challenging.
Dr. Patricia J. Larke, Texas A&M Universityy, College Station, Texas and Dr. ...William Kritsonis
Dr. Patricia J. Larke, Texas A&M Universityy, College Station, Texas and Dr. Brandon L. Fox, Stephen F. Austin State University - Published in NATIONAL FORUM JOURNALS, Dr. William Allan Kritsonis, Editor-in-Chief - See: www.nationalforum.com
Strategic Equity, Diversity and Inclusion (EDI) Leadership AssessmentKevin Carter
The Strategic Equity, Diversity, and Inclusion (EDI) Leadership
Assessment is both a supplement to cultural competence coaching and training, as well as a stand-alone document that will enhance your ability to achieve personal, team,
and organizational success.
For all of us, the challenge and opportunity are to grow, from where you are now to a deeper understanding of how to best deliver the organization's brand to colleagues, customers, business partners, and the community.
Keep an open mind. Enjoy the journey. Let's begin!
ManToMan #MeToo Session: Being the Imperfect AllyKevin Carter
The "ManToMan #MeToo Session: Being the Imperfect Ally" is a 90-minutes to 1/2 day session that creates an empathetic space for authentic dialogue and provides a relationship based model for men and women to gain congruence on intentions, behaviors, and impact that represents #MeToo progress in the workplace.
On Behalf of Usher's New Look Urban Game Jam Event May 21stKevin Carter
On behalf of Usher’s New Look, we would like to invite you to be our special guest at the SparkLab University videogame workshop. The workshop will feature Urban Game Jam
presented by Entertainment Arts Research Inc.
The event will include a presentation from world renowned scientist Dr. Thomas Mensah, and executives from Microsoft and TVOne. The attendees will also include the CEO from Game Builder Studios and other digital media companies.
Diversity, Inclusion & Innovation - Strategic Leadership AssessmentKevin Carter
The Diversity, Inclusion & Innovation - Strategic Leadership Assessment has been updated. Please obtain a free assessment here http://www.inclusioninnovates.com/d-i-assessment-tool.
Network of Executive Women: The NEW Male Champion blog post series (downloa...Kevin Carter
The slide share contains the three blog posts to date from the Network of Executive Women (NEW) Leadership Summit "The NEW Male Champion" and "Engaging Men Who Get It" workshops.
The articles are entitled:
> The NEW inclusion of men which summaries workshop 1
>NEW male engagement in women's advancement which summaries workshop 2 and
> Intercultural Competence and Women's Advancement which highlights the use of the Intercultural Development Inventory (IDI) to accelerate women's advancement
Intercultural Competence and Women's AdvancementKevin Carter
Slide depicts how a growth along the intercultural development continuum as measured by the intercultural development inventory (IDI) can foster women engagement and advancement.
Network of Executive Women (NEW) The NEW Male Champion Report-OutKevin Carter
Network of Executive Women (NEW) The NEW Male Champion Report-Out
Congratulations to the men and women who developed and updated the report-out from "The NEW Male Champion" session at the Network of Executive Women (NEW) Leadership Summit.
Please provide any additional feedback and thoughts!
Kevin A Carter NEW Leadership Summit 2015 Planning GuideKevin Carter
The Summit Planning Guide is being used during the Network of Executive Women (NEW) Leadership Summit in Dallas, Texas, September 30 to October 2 to help participants better themselves, advance women and aid their organizations.
My Guide is attached to assist participants of two sessions I will facilitate, "The NEW Male Champion" and "Engaging Men Who Get It," complete their Guides.
Disruptive Inclusion _ Kevin Carter BiographyKevin Carter
Disruptive Inclusion is about proactive recognition and embracing of both the similarities and differences in people with a clear objective of improving organizational environments, individual motivation, and ultimately business innovation. Disruptive Inclusion is a conscious and deliberate effort to inject and foster difference into a team work environment for business results.
We believe in a unique approach to D&I that delivers innovative improvements for your workplace and its products and services, by cultivating the powerful and diverse networks that already exist inside and outside of your organization.
Inclusion Innovation intertwines diversity, "idea networks,” Intercultural expertise and collaborative technology to generate a "super-addictive" affect. Idea generation is then accelerated when networks within your organization are connected with customers and consumers outside your organization
Campbell Soup Co Hispanic Heritage EventKevin Carter
The Hispanic Network de Campbell (HNdC) in partnership with Sodexo will kick-off the internal celebration of Hispanic Heritage month with an on campus event for employees featuring a Pastelillos Cooking Demo with Sodexo Chef Tomas Garrido.
The HNdeC is one of eight Business Resource Affinity Networks at the Campbell Soup Co. HNdeC's mission is to build organizational vitality and promote excellence by fostering an environment that acknowledges and leverages the talents, perspectives, and leadership of Hispanic employees.
What is your organization doing to celebrate Hispanic Heritage Month? How can we collaborate together?
PHP Frameworks: I want to break free (IPC Berlin 2024)Ralf Eggert
In this presentation, we examine the challenges and limitations of relying too heavily on PHP frameworks in web development. We discuss the history of PHP and its frameworks to understand how this dependence has evolved. The focus will be on providing concrete tips and strategies to reduce reliance on these frameworks, based on real-world examples and practical considerations. The goal is to equip developers with the skills and knowledge to create more flexible and future-proof web applications. We'll explore the importance of maintaining autonomy in a rapidly changing tech landscape and how to make informed decisions in PHP development.
This talk is aimed at encouraging a more independent approach to using PHP frameworks, moving towards a more flexible and future-proof approach to PHP development.
DevOps and Testing slides at DASA ConnectKari Kakkonen
My and Rik Marselis slides at 30.5.2024 DASA Connect conference. We discuss about what is testing, then what is agile testing and finally what is Testing in DevOps. Finally we had lovely workshop with the participants trying to find out different ways to think about quality and testing in different parts of the DevOps infinity loop.
A tale of scale & speed: How the US Navy is enabling software delivery from l...sonjaschweigert1
Rapid and secure feature delivery is a goal across every application team and every branch of the DoD. The Navy’s DevSecOps platform, Party Barge, has achieved:
- Reduction in onboarding time from 5 weeks to 1 day
- Improved developer experience and productivity through actionable findings and reduction of false positives
- Maintenance of superior security standards and inherent policy enforcement with Authorization to Operate (ATO)
Development teams can ship efficiently and ensure applications are cyber ready for Navy Authorizing Officials (AOs). In this webinar, Sigma Defense and Anchore will give attendees a look behind the scenes and demo secure pipeline automation and security artifacts that speed up application ATO and time to production.
We will cover:
- How to remove silos in DevSecOps
- How to build efficient development pipeline roles and component templates
- How to deliver security artifacts that matter for ATO’s (SBOMs, vulnerability reports, and policy evidence)
- How to streamline operations with automated policy checks on container images
GDG Cloud Southlake #33: Boule & Rebala: Effective AppSec in SDLC using Deplo...James Anderson
Effective Application Security in Software Delivery lifecycle using Deployment Firewall and DBOM
The modern software delivery process (or the CI/CD process) includes many tools, distributed teams, open-source code, and cloud platforms. Constant focus on speed to release software to market, along with the traditional slow and manual security checks has caused gaps in continuous security as an important piece in the software supply chain. Today organizations feel more susceptible to external and internal cyber threats due to the vast attack surface in their applications supply chain and the lack of end-to-end governance and risk management.
The software team must secure its software delivery process to avoid vulnerability and security breaches. This needs to be achieved with existing tool chains and without extensive rework of the delivery processes. This talk will present strategies and techniques for providing visibility into the true risk of the existing vulnerabilities, preventing the introduction of security issues in the software, resolving vulnerabilities in production environments quickly, and capturing the deployment bill of materials (DBOM).
Speakers:
Bob Boule
Robert Boule is a technology enthusiast with PASSION for technology and making things work along with a knack for helping others understand how things work. He comes with around 20 years of solution engineering experience in application security, software continuous delivery, and SaaS platforms. He is known for his dynamic presentations in CI/CD and application security integrated in software delivery lifecycle.
Gopinath Rebala
Gopinath Rebala is the CTO of OpsMx, where he has overall responsibility for the machine learning and data processing architectures for Secure Software Delivery. Gopi also has a strong connection with our customers, leading design and architecture for strategic implementations. Gopi is a frequent speaker and well-known leader in continuous delivery and integrating security into software delivery.
Welocme to ViralQR, your best QR code generator.ViralQR
Welcome to ViralQR, your best QR code generator available on the market!
At ViralQR, we design static and dynamic QR codes. Our mission is to make business operations easier and customer engagement more powerful through the use of QR technology. Be it a small-scale business or a huge enterprise, our easy-to-use platform provides multiple choices that can be tailored according to your company's branding and marketing strategies.
Our Vision
We are here to make the process of creating QR codes easy and smooth, thus enhancing customer interaction and making business more fluid. We very strongly believe in the ability of QR codes to change the world for businesses in their interaction with customers and are set on making that technology accessible and usable far and wide.
Our Achievements
Ever since its inception, we have successfully served many clients by offering QR codes in their marketing, service delivery, and collection of feedback across various industries. Our platform has been recognized for its ease of use and amazing features, which helped a business to make QR codes.
Our Services
At ViralQR, here is a comprehensive suite of services that caters to your very needs:
Static QR Codes: Create free static QR codes. These QR codes are able to store significant information such as URLs, vCards, plain text, emails and SMS, Wi-Fi credentials, and Bitcoin addresses.
Dynamic QR codes: These also have all the advanced features but are subscription-based. They can directly link to PDF files, images, micro-landing pages, social accounts, review forms, business pages, and applications. In addition, they can be branded with CTAs, frames, patterns, colors, and logos to enhance your branding.
Pricing and Packages
Additionally, there is a 14-day free offer to ViralQR, which is an exceptional opportunity for new users to take a feel of this platform. One can easily subscribe from there and experience the full dynamic of using QR codes. The subscription plans are not only meant for business; they are priced very flexibly so that literally every business could afford to benefit from our service.
Why choose us?
ViralQR will provide services for marketing, advertising, catering, retail, and the like. The QR codes can be posted on fliers, packaging, merchandise, and banners, as well as to substitute for cash and cards in a restaurant or coffee shop. With QR codes integrated into your business, improve customer engagement and streamline operations.
Comprehensive Analytics
Subscribers of ViralQR receive detailed analytics and tracking tools in light of having a view of the core values of QR code performance. Our analytics dashboard shows aggregate views and unique views, as well as detailed information about each impression, including time, device, browser, and estimated location by city and country.
So, thank you for choosing ViralQR; we have an offer of nothing but the best in terms of QR code services to meet business diversity!
State of ICS and IoT Cyber Threat Landscape Report 2024 previewPrayukth K V
The IoT and OT threat landscape report has been prepared by the Threat Research Team at Sectrio using data from Sectrio, cyber threat intelligence farming facilities spread across over 85 cities around the world. In addition, Sectrio also runs AI-based advanced threat and payload engagement facilities that serve as sinks to attract and engage sophisticated threat actors, and newer malware including new variants and latent threats that are at an earlier stage of development.
The latest edition of the OT/ICS and IoT security Threat Landscape Report 2024 also covers:
State of global ICS asset and network exposure
Sectoral targets and attacks as well as the cost of ransom
Global APT activity, AI usage, actor and tactic profiles, and implications
Rise in volumes of AI-powered cyberattacks
Major cyber events in 2024
Malware and malicious payload trends
Cyberattack types and targets
Vulnerability exploit attempts on CVEs
Attacks on counties – USA
Expansion of bot farms – how, where, and why
In-depth analysis of the cyber threat landscape across North America, South America, Europe, APAC, and the Middle East
Why are attacks on smart factories rising?
Cyber risk predictions
Axis of attacks – Europe
Systemic attacks in the Middle East
Download the full report from here:
https://sectrio.com/resources/ot-threat-landscape-reports/sectrio-releases-ot-ics-and-iot-security-threat-landscape-report-2024/
Observability Concepts EVERY Developer Should Know -- DeveloperWeek Europe.pdfPaige Cruz
Monitoring and observability aren’t traditionally found in software curriculums and many of us cobble this knowledge together from whatever vendor or ecosystem we were first introduced to and whatever is a part of your current company’s observability stack.
While the dev and ops silo continues to crumble….many organizations still relegate monitoring & observability as the purview of ops, infra and SRE teams. This is a mistake - achieving a highly observable system requires collaboration up and down the stack.
I, a former op, would like to extend an invitation to all application developers to join the observability party will share these foundational concepts to build on:
Smart TV Buyer Insights Survey 2024 by 91mobiles.pdf91mobiles
91mobiles recently conducted a Smart TV Buyer Insights Survey in which we asked over 3,000 respondents about the TV they own, aspects they look at on a new TV, and their TV buying preferences.
Generative AI Deep Dive: Advancing from Proof of Concept to ProductionAggregage
Join Maher Hanafi, VP of Engineering at Betterworks, in this new session where he'll share a practical framework to transform Gen AI prototypes into impactful products! He'll delve into the complexities of data collection and management, model selection and optimization, and ensuring security, scalability, and responsible use.
FIDO Alliance Osaka Seminar: Passkeys and the Road Ahead.pdf
Women in Stem a Gender Gap to Innovation
1.
U.S. Department of Commerce
Economics and Statistics Administration
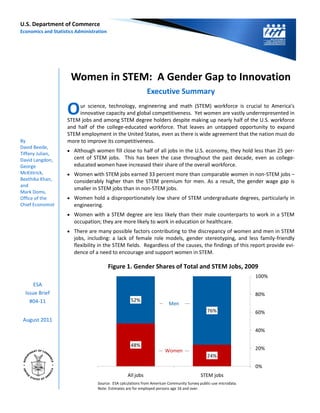
Women in STEM: A Gender Gap to Innovation
Executive Summary
O ur science, technology, engineering and math (STEM) workforce is crucial to America’s
innovative capacity and global competitiveness. Yet women are vastly underrepresented in
STEM jobs and among STEM degree holders despite making up nearly half of the U.S. workforce
and half of the college‐educated workforce. That leaves an untapped opportunity to expand
STEM employment in the United States, even as there is wide agreement that the nation must do
By more to improve its competitiveness.
David Beede,
Tiffany Julian,
Although women fill close to half of all jobs in the U.S. economy, they hold less than 25 per‐
David Langdon, cent of STEM jobs. This has been the case throughout the past decade, even as college‐
George educated women have increased their share of the overall workforce.
McKittrick, Women with STEM jobs earned 33 percent more than comparable women in non‐STEM jobs –
Beethika Khan, considerably higher than the STEM premium for men. As a result, the gender wage gap is
and
smaller in STEM jobs than in non‐STEM jobs.
Mark Doms,
Office of the Women hold a disproportionately low share of STEM undergraduate degrees, particularly in
Chief Economist engineering.
Women with a STEM degree are less likely than their male counterparts to work in a STEM
occupation; they are more likely to work in education or healthcare.
There are many possible factors contributing to the discrepancy of women and men in STEM
jobs, including: a lack of female role models, gender stereotyping, and less family‐friendly
flexibility in the STEM fields. Regardless of the causes, the findings of this report provide evi‐
dence of a need to encourage and support women in STEM.
Figure 1. Gender Shares of Total and STEM Jobs, 2009
100%
ESA
Issue Brief 80%
#04‐11 52%
Men
76% 60%
August 2011
40%
48%
Women 20%
24%
0%
All jobs STEM jobs
Source: ESA calculations from American Community Survey public‐use microdata.
Note: Estimates are for employed persons age 16 and over.
2. What is STEM? STEM employment. Second are engineering and
surveying occupations, representing approximately
The acronym STEM is fairly specific in nature— one‐third of all STEM employment, while 12 per‐
referring to science, technology, engineering and cent are in the physical and life sciences, and 8 per‐
math—however, there is no standard definition for cent in STEM management jobs.5
what constitutes a STEM job. Science, technology, Parallel to our list of STEM occupations, we also
engineering and math positions consistently make identify a set of STEM undergraduate degree fields
the lists of STEM occupations, but there is less that span computer science and mathematics, engi‐
agreement about whether to include other posi‐ neering, and life and physical sciences (see Appen‐
tions such as educators, managers, technicians, dix Table 2). We define STEM degree holders as
healthcare professionals and social scientists. In persons whose primary or secondary undergradu‐
this report, the Economics and Statistics Admini‐ ate major was in a STEM field. Consistent with the
stration (ESA) defines STEM jobs to include profes‐ occupations selected for this report, we exclude
sional and technical support occupations in the business, healthcare, and social science majors.6
fields of computer science and mathematics, engi‐
neering, and life and physical sciences. Three man‐
agement occupations are also included because of
Women in STEM jobs
their clear ties to STEM.1 Education jobs are not
According to the Census Bureau’s 2009 American
included because of the nature of the available
Community Survey (ACS), women comprise 48 per‐
data.2 In addition, social scientists are not in‐
cent of the U.S. workforce but just 24 percent of
cluded.3
STEM workers. In other words, half as many
ESA’s STEM list contains 50 specific occupation women are working in STEM jobs as one might ex‐
codes (see Appendix Table 1), and in 2009, there pect if gender representation in STEM professions
were 7.4 million workers in these jobs, represent‐ mirrored the overall workforce. (See Figure 1.)
ing 5.3 percent of the workforce. To better put
This underrepresentation has remained fairly con‐
these jobs into context, we divide STEM occupa‐
stant over the past decade, even as women’s share
tions into four categories: computer and math, en‐
of the college‐educated workforce has increased.
gineering and surveying, physical and life sciences,
As shown in Table 1, between 2000 and 2009,
and STEM managerial occupations.4 Across all lev‐
women’s share of the STEM workforce remained
els of educational attainment, the largest group of
constant at 24 percent, while their share of all col‐
STEM jobs is within the computer and math fields,
lege‐educated workers increased from 46 to 49
which account for close to half (47 percent) of all
percent. Using data from the Census Bureau’s Cur‐
Table 1. Total and STEM Employment by Gender and Educational Attainment, 2000 and 2009
(thousands of workers)
Male Female Percent Female
2000 2009 2000 2009 2000 2009
All workers 69,098 73,580 60,619 67,058 47% 48%
College‐educated 18,995 22,167 16,415 21,433 46% 49%
STEM workers 5,321 5,640 1,680 1,790 24% 24%
College‐educated 3,259 3,738 1,002 1,199 24% 24%
Source: ESA calculations from Census 2000 and 2009 American Community Survey public‐use microdata.
Note: Estimates are for employed persons age 16 and over.
2 U.S. Department of Commerce, Economics and Statistics Administration
3. Table 2. Employment in STEM Occupations in 2009
(thousands of workers)
Male Female Percent Female
2000 2009 2000 2009 2000 2009
STEM total 5,321 5,640 1,680 1,790 24% 24%
Computer science and math 2,202 2,534 940 929 30% 27%
Engineering 2,185 2,079 318 330 13% 14%
Physical and life sciences 551 553 310 374 36% 40%
STEM managers 382 474 111 157 23% 25%
Source: ESA calculations from Census 2000 and 2009 American Community Survey public‐use microdata.
Note: Estimates are for employed persons age 16 and over.
rent Population Survey (CPS) going back to 1994, years, while the number of male engineers declined
almost identical trends emerge. by 106,000. In physical and life sciences jobs, how‐
ever, women made up about 40 percent of the
Among STEM jobs, women’s representation has
workforce in 2009, up from 36 percent in 2000.
varied over time. While the female share has de‐
STEM managers is another area that has shown
clined in computer and math jobs, their share has
growth, with women’s share of the workforce in‐
risen in other occupations. In 2009, women com‐
creasing to 25 percent.
prised 27 percent of the computer and math work‐
force (the largest of the four STEM components), a Men are much more likely than women to have a
drop of 3 percentage points since 2000. (See Table STEM job regardless of educational attainment.
2.) Engineers are the second largest STEM occupa‐ Figure 2 demonstrates that higher education levels
tional group, but only about one out of every seven generally correspond to an increased likelihood of
engineers is female. Interestingly, the number of having a STEM job for both men and women. The
female engineers edged up by 12,000 over nine gap lessens somewhat at the doctoral level, but
Figure 2. Share of Workers in STEM Jobs
by Gender and Educational Attainment, 2009
25%
Men
Women 20%
15%
10%
5%
0%
No College Some college Associate Bachelor's Master's Doctorate Professional
degree degree degree degree
Source: ESA calculations from American Community Survey public‐use microdata.
Note: Professional degrees include medical, dental, veterinary, and law degrees. Estimates are for employed
persons age 16 and over.
U.S. Department of Commerce, Economics and Statistics Administration 3
4. women still lag far behind men in STEM employ‐ percent) less, smaller than the 21 percent gender
ment.7 wage gap in non‐STEM occupations, but a clear
gender disparity nonetheless.
STEM worker earnings and gender While illustrative, these simple comparisons do not
take into account the many factors that can help
There are two notable findings in examining the explain why STEM workers tend to earn more than
relationship between STEM, gender and earnings. non‐STEM workers, or why women earn less than
First, as is clearly documented in our previous re‐ men. Following the methodology of our earlier
port “STEM: Good Jobs Now and for the Future,” STEM report, we use regression analyses to control
STEM workers earn considerably more than their for many of these factors, including workers’ age,
non‐STEM counterparts (what we call in this report educational attainment, and region of residence.
the “STEM earnings premium”). Second is the gen‐ The results of these analyses underscore both the
der wage gap – a robust finding that women earn STEM earnings premium and the gender earnings
considerably less than men, even after controlling gap.
for a wide set of characteristics such as education
and age. Figure 3 highlights how these two findings In our previous report on this issue, we found that
intersect by showing the average hourly earnings of STEM workers earn significantly more than their
full‐time, year‐round workers in private sector non‐STEM counterparts in the private sector. So,
STEM and non‐STEM jobs. On average, men and one way to compare men and women in STEM is to
women earn $36.34 and $31.11 per hour, respec‐ see to what extent their STEM earnings premium
tively, in STEM jobs – higher than the $24.47 that varies. Our analysis shows that, all else being equal,
men earn and $19.26 that women earn, on aver‐ women in STEM jobs earn 33 percent more than
age, in other occupations. For every dollar earned their female peers in other jobs, while the STEM
by a man in STEM, a woman earns 14 cents (or 14 premium for men is 25 percent.
Figure 3. Average Hourly Earnings by Gender and Occupation, 2009
$40
$36.34 Men
14% gender wage gap: Women
$31.11 For every dollar earned by a man,
women in STEM earn $0.86. $30
$24.47
21%
$19.26 $20
$10
$0
STEM jobs Non‐STEM jobs
Source: ESA calculations from American Community Survey public‐use microdata.
Note: Estimates are for full‐time year‐round private wage and salary workers age 16 and over.
4 U.S. Department of Commerce, Economics and Statistics Administration
5. Figure 4. Regression‐adjusted Gender Wage Gap of
College‐educated STEM Workers by Occupation, 2009
14%
12% 12%
12%
10%
9%
8%
8%
7%
6%
4%
STEM Computer Engineering Physical and STEM
total and math life sciences managerial
Source: ESA calculations from American Community Survey public‐use microdata.
Note: Estimates are for full‐time year‐round private wage and salary workers age 25 and over.
Given that the STEM premium for women is higher STEM degrees and fields of study
than for men, we would expect women in STEM to
face a smaller gender earnings gap than women in
by gender
other occupations. Not surprisingly, we find that
Since the gateway to many high‐paying STEM jobs
the gap shrinks but does not disappear for women is a STEM degree, it is useful to examine the extent
in STEM. Furthermore, as we look at more specific to which college‐educated workers had STEM de‐
groups of STEM workers (which allows us to make grees. The 2009 ACS provides a rich new data
better “apples‐to‐apples” comparisons of male and source for analyzing the link between undergradu‐
female wages), we find an even smaller gender ate studies and subsequent employment. The ACS
wage difference. Figure 4 shows the regression‐ data on undergraduate fields of study show that
adjusted gender wage gap for college‐educated women account for nearly half of employed college
STEM workers in each of the four major occupa‐ graduates age 25 and over, but only about 25 per‐
tional groups. Interestingly, the most male‐ cent of employed STEM degree holders and an
dominated STEM occupational group—engineers— even smaller share – just about 20 percent – of
is also the one with the smallest regression‐ STEM degree holders working in STEM jobs.
adjusted wage gap; female engineers earned 7 per‐ There were 2.5 million college‐educated working
cent less per hour than male counterparts. Physical women with STEM degrees in 2009 compared with
and life sciences occupations, the most gender‐ 6.7 million men. What makes this disparity even
balanced STEM group, have an 8 percent wage gap, more alarming is that, in the overall labor force,
and STEM managers a 9 percent gap. Notably there are 21.4 million women (49 percent of the
higher was the 12 percent gender wage gap in com‐ total) and 22.2 million men who are employed and
puter and math occupations. have bachelor’s degrees.
Among STEM majors, the distribution of men and
U.S. Department of Commerce, Economics and Statistics Administration 5
6. Figure 5. College‐educated Workers with a STEM Degree
by Gender and STEM Degree Field, 2009
6.7 million workers 2.5 million workers
100%
Math degree 6% 10%
Computer degree 15%
14%
75%
18%
Engineering degree 48%
50%
57%
25%
Physical and life sciences degree 31%
0%
Men Women
Source: ESA calculations from American Community Survey public‐use microdata.
Note: Estimates are for employed persons age 25 and over. The shares for men and women do not add up
to 100% due to rounding.
women differs significantly. As shown in Figure 5, STEM jobs. (See Figure 6.)
well over half (57 percent) of female STEM majors
Men are more likely to have non‐STEM manage‐
study physical and life sciences, while fewer than
ment jobs than women, 16 percent and 11 percent,
one‐third (31 percent) of men choose these fields.
respectively. In contrast, female STEM majors are
The share of women choosing math majors is also
twice as likely as men to work in education or
higher than men: 10 versus 6 percent. The bulk of
healthcare. Nearly one in five STEM college‐
men with STEM majors (48 percent) choose engi‐
educated women works in healthcare occupations,
neering degrees, two‐and‐a‐half times the share of
compared with about one in ten men. Likewise,
women who choose engineering. Equal shares of
approximately 14 percent of female STEM majors
male and female STEM majors enter computer sci‐
end up in education occupations, compared with
ence. In terms of raw numbers, however, men in
approximately 6 percent of men. Similar shares of
the workforce with STEM degrees outnumber
men and women with STEM degrees worked in
women across all four fields of study.8
business and financial occupations or other fields.
STEM degrees and careers
STEM premiums and gender
by gender
As highlighted in our earlier STEM report, receiving
As noted in the previous section, college‐educated
a STEM degree tends to result in higher earnings
women are much less likely than men to major in
later in life. Figure 7 illustrates the considerable
STEM fields. But even when women choose STEM
extent to which the earnings premium from having
degrees, their typical career paths diverge substan‐
a STEM job or STEM degree varies by gender.
tially from their male counterparts. About 40 per‐
Women enjoy a much bigger STEM job premium
cent (2.7 million) of men with STEM college degrees
than men, but a slightly smaller premium for having
work in STEM jobs, whereas only 26 percent (0.6
earned a STEM bachelor’s degree. Specifically,
million) of women with STEM degrees work in
when we control for whether or not women have
6 U.S. Department of Commerce, Economics and Statistics Administration
7. Figure 6. College‐educated Workers with a STEM Degree
by Gender and STEM Occupation, 2009
6.7 million workers 2.5 million workers
100%
Other occupations 23% 23%
Business & financial occupations 5% 6% 75%
Non‐STEM managers 16% 11%
Healthcare occupations 10% 19% 50%
Education occupations 6%
14%
25%
STEM occupations 40%
26%
0%
Men Women
Source: ESA calculations from American Community Survey public‐use microdata.
Note: Estimates are for employed persons age 25 and over. The shares for men and women do not add up
to 100% due to rounding.
STEM degrees, we find that college‐educated nearly 12 percent. The biggest STEM‐related wage
women (regardless of choice of undergraduate ma‐ premiums go to men and women who both major
jor) earn 20 percent more in STEM jobs than else‐ in a STEM field and choose a STEM job. This career
where. This is nearly double the 11 percent pre‐ path nets women 29 percent higher hourly earn‐
mium that college‐educated men realize working in ings, on average, than their peers who have neither
STEM. On the other hand, female STEM degree a STEM degree nor a STEM job. The corresponding
holders earn 9 percent more than women with premium for men is smaller, but also sizeable, at 23
other degrees, regardless of their job. The STEM percent.
degree premium for men is somewhat higher at
Figure 7. Wage Premium from Having a STEM Job and/or Degree
29% 30%
STEM degree
and job
25%
23% 9%
STEM degree
20%
12%
15%
20% 10%
11% STEM job
5%
0%
Men Women
Source: ESA calculations from American Community Survey public‐use microdata.
Note: Estimates are for full‐time year‐round private wage and salary workers who have at least a
bachelor’s degree and are age 25 and over.
U.S. Department of Commerce, Economics and Statistics Administration 7
8. Conclusion
This report finds that women are underrepresented
both in STEM jobs and STEM undergraduate de‐
grees and have been consistently over the last dec‐
ade. The relatively few women who receive STEM
degrees are concentrated in physical and life sci‐
ences, in contrast to men, who are concentrated
primarily in engineering. Women who do receive
STEM degrees are less likely to work in STEM jobs
than their male counterparts. And while women
working in STEM jobs earn less than their male
counterparts, they experience a smaller gender
wage gap compared to others in non‐STEM occupa‐
tions.
The underrepresentation of women in STEM ma‐
jors and jobs may be attributable to a variety of
factors. These may include different choices men
and women typically make in response to incen‐
tives in STEM education and STEM employment –
for example, STEM career paths may be less accom‐
modating to people cycling in and out of the work‐
force to raise a family – or it may be because there
are relatively few female STEM role models. Per‐
haps strong gender stereotypes discourage women
from pursuing STEM education and STEM jobs.
While this report does not – and cannot – explain
why gender differences in STEM exist, it does aim
to provide data and insight that will enable more
informed policymaking. The findings provide de‐
finitive evidence of a need to encourage and sup‐
port women in STEM with a goal of gender parity.
Given the high‐quality, well‐paying jobs in the fields
of science, technology, engineering and math,
there is great opportunity for growth in STEM in
support of American competitiveness, innovation
and jobs of the future.
8 U.S. Department of Commerce, Economics and Statistics Administration
9. Appendix Table 1. Detailed STEM occupations and Standard Occupational Classification (SOC)
SOC
Occupation Occupation SOC code
Code
Computer and math occupations
Network systems and data communications
Computer scientists and systems analysts 15‐10XX 15‐1081
analysts
Computer programmers 15‐1021 Mathematicians 15‐2021
Computer software engineers 15‐1030 Operations research analysts 15‐2031
Computer support specialists 15‐1041 Statisticians 15‐2041
Miscellaneous mathematical science occupa‐
Database administrators 15‐1061 15‐2090
tions
Network and computer systems administrators 15‐1071
Engineering and surveying occupations
Surveyors, cartographers, and photogrammet‐ 17‐1020 Materials engineers 17‐2131
Aerospace engineers 17‐2011 Mechanical engineers 17‐2141
Mining and geological engineers, including 17‐2151
Agricultural engineers 17‐2021 mining safety engineers
Biomedical engineers 17‐2031 Nuclear engineers 17‐2161
Chemical engineers 17‐2041 Petroleum engineers 17‐2171
Civil engineers 17‐2051 Engineers, all other 17‐2199
Computer hardware engineers 17‐2061 Drafters 17‐3010
Electrical and electronic engineers 17‐2070 Engineering technicians, except drafters 17‐3020
Environmental engineers 17‐2081 Surveying and mapping technicians 17‐3031
Industrial engineers, including health and safety 17‐2110 Sales engineers 41‐9031
Marine engineers and naval architects 17‐2121
Physical and life sciences occupations
Agricultural and food scientists 19‐1010 Physical scientists, all other 19‐2099
Biological scientists 19‐1020 Agricultural and food science technicians 19‐4011
Conservation scientists and foresters 19‐1030 Biological technicians 19‐4021
Medical scientists 19‐1040 Chemical technicians 19‐4031
Astronomers and physicists 19‐2010 Geological and petroleum technicians 19‐4041
Atmospheric and space scientists 19‐2021 Nuclear technicians 19‐4051
Other life, physical, and social science techni‐
Chemists and materials scientists 19‐2030 cians 19‐40XX
Environmental scientists and geoscientists 19‐2040
STEM managerial occupations
Computer and information systems managers 11‐3021 Natural sciences managers 11‐9121
Engineering managers 11‐9041
U.S. Department of Commerce, Economics and Statistics Administration 9
10. Appendix Table 2. Detailed STEM undergraduate majors
Computer majors
Computer and information Computer administration
Computer science
systems management and security
Computer programming and Computer networking and
Information sciences
data processing telecommunications
Math majors
Mathematics and computer
Mathematics
Statistics and decision science
science
Applied mathematics
Engineering majors
General engineering Environmental engineering Petroleum engineering
Geological and geophysical
Aerospace engineering Miscellaneous engineering
engineering
Industrial and manufacturing
Biological engineering Engineering technologies
engineering
Materials engineering and Engineering and industrial
Architectural engineering
materials science management
Biomedical engineering Mechanical engineering Electrical engineering technology
Industrial production
Chemical engineering Metallurgical engineering
technologies
Mining and mineral Mechanical engineering related
Civil engineering
engineering technologies
Naval architecture and marine Miscellaneous engineering
Computer engineering
engineering technologies
Electrical engineering Nuclear engineering Military technologies
Engineering mechanics physics
and science
Physical and life sciences majors
Animal sciences Genetics Physical sciences
Food science Microbiology Astronomy and astrophysics
Atmospheric sciences and
Plant science and agronomy Pharmacology
meteorology
Soil science Physiology Chemistry
Environmental science Zoology Geology and earth science
Biology Miscellaneous biology Geosciences
Biochemical sciences Nutrition sciences Oceanography
Botany Neuroscience Physics
Cognitive science and Nuclear, industrial radiology, and
Molecular biology
biopsychology biological technologies
Ecology
10 U.S. Department of Commerce, Economics and Statistics Administration
11. The Commerce Department’s Economics and persons typically have jobs that we do not character‐
Statistics Administration has released two ize as STEM.
8
Using data from a different source, the number of
other reports detailing the roles of women in bachelor’s degrees conferred annually in STEM fields
American society. The first, Women‐Owned in the United States increased about 20 percent be‐
Businesses in the 21st Century, was released in tween 1998 and 2008 (from 200,000 to 240,000). But
women’s share has not risen and remains far below
October 2010. The second, Women in America: parity with men (35 percent in both years), despite
Indicators of Social and Economic Well‐Being, the fact that a majority of all bachelor degrees are
was released in March 2011. Both reports can conferred on women (56 percent in 1998 and 57 per‐
cent in 2008). About one‐quarter of bachelor’s de‐
be found at http://www.esa.doc.gov/reports grees awarded to men are in STEM fields, compared
Endnotes with one‐tenth conferred on women; these shares
1
These occupations are computer and information have remained about the same between 1998 and
systems managers, engineering managers, and natu‐ 2008. About two‐thirds of STEM degrees awarded to
ral sciences managers. men were in engineering and computer science, com‐
2
Although our principal data source, the 2009 Ameri‐ pared with one‐quarter awarded to women. Over
can Community Survey (ACS), collects detailed infor‐ half of STEM degrees awarded to women were in
mation on workers’ occupations, it does not break biological sciences compared with 20 percent for
out educators by their specific field. As a result, it is men. See U.S. Department of Commerce, Economics
not possible to distinguish math and science profes‐ and Statistics Administration and Executive Office of
sors from other professors. Data from the Bureau of the President, Office of Management and Budget
Labor Statistics’ Occupational Employment Statistics (2011) Women in America: Indicators of Social and
program show that there are roughly 200,000 post‐ Economic Well‐Being (http://www.esa.doc.gov/sites/
secondary teachers in STEM fields, and so their exclu‐ default/files/reports/documents/
sion is unlikely to materially affect our results. womeninamerica.pdf), p. 23.
3
The National Science Foundation does count social
scientists among “science and engineering jobs” in
keeping with the agency’s mission supporting “all
fields of fundamental science and engineering, except
for medical sciences.” This report, however, follows a
different approach.
4
Note that persons in science occupations include
not just scientists but also science technicians. Like‐
wise, engineering and surveying occupations include The authors are economists in the Office of the Chief
engineering technicians and drafters, and computer Economist of the U.S. Department of Commerce’s
occupations range from computer support specialists Economics and Statistics Administration.
to computer software engineers.
5
The estimates reported in this paragraph are based
Technical inquiries:
on 2009 data from the American Community Survey
Office of the Chief Economist
(ACS). The estimates are very similar to those cited in
STEM: Good Jobs Now and For the Future (http:// (202) 482‐3523
www.esa.doc.gov/Reports/stem‐good‐jobs‐now‐and‐
future), p. 2, which were based on 2010 data from Media inquiries:
the Current Population Survey. The estimates are Office of Communications
very similar but not exactly the same because they (202) 482‐3331
were drawn from different samples of workers in two
different years.
6
In the few cases where both the primary and secon‐ U.S. Department of Commerce
dary undergraduate majors were in STEM fields, we Economics and Statistics Administration
used the primary major as the STEM major. 1401 Constitution Ave., NW
7
Few persons with professional degrees (e.g., MBA’s, Washington, DC 20230
law, and medicine) work in STEM jobs because such www.esa.doc.gov
U.S. Department of Commerce, Economics and Statistics Administration 11