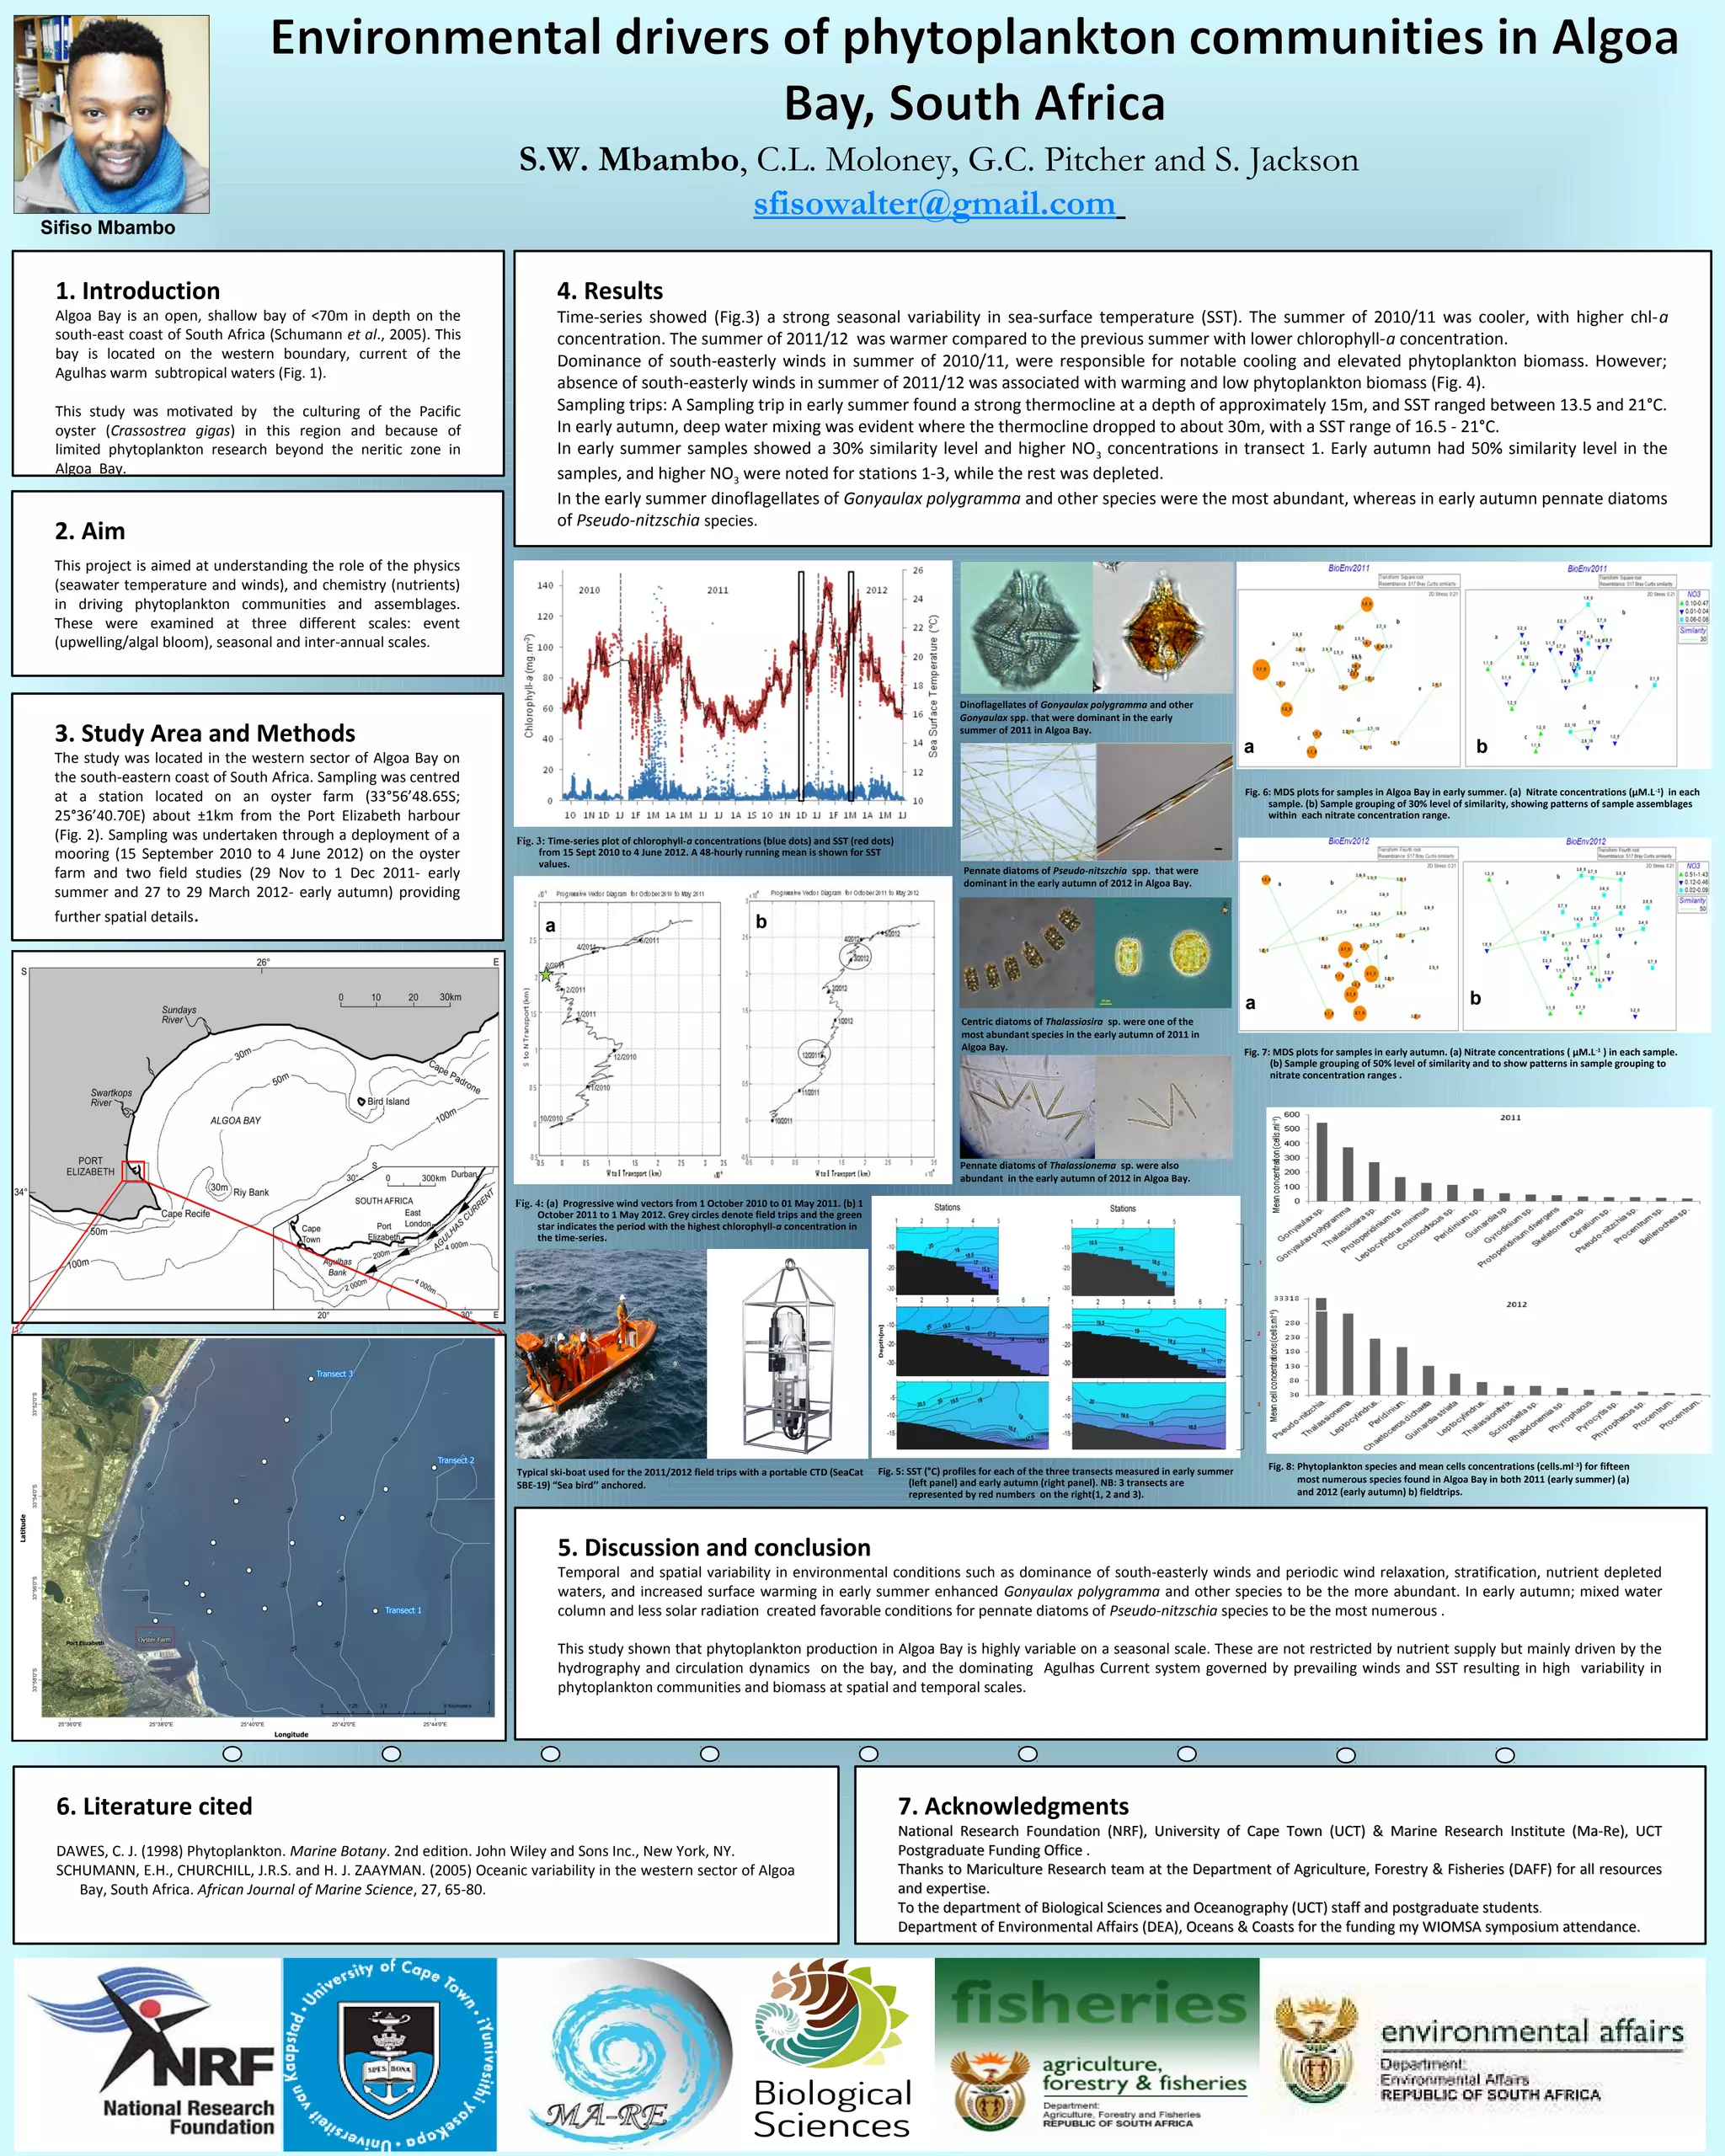
This study examined phytoplankton communities in Algoa Bay, South Africa at different temporal scales. A time-series from 2010-2012 showed strong seasonal variability in sea surface temperature, with cooler temperatures and higher chlorophyll-a in 2010/2011 and warmer temperatures and lower chlorophyll-a in 2011/2012. This corresponded to dominance of south-easterly winds in 2010/2011 which cooled waters and increased phytoplankton biomass. Sampling trips found dinoflagellates dominant in early summer 2011 and pennate diatoms dominant in early autumn 2012, corresponding to nutrient levels and water column mixing at the time.
The decadal character of northern California's winter precipitationScott St. George
Starting in the 1930s, northern California has experienced major decade-to-decade swings in the amount of precipitation that falls during winter. Is this behavior
A B S T R A C T
Urban stormwater lakes in cold regions are ice-covered for substantial parts of the winter. It has long been considered that the ice-covered period is the “dormant season,” during which ecological processes are inactive. However, little is known about this period due to the historical focus on the open-water season. Recent pioneering research on ice-covered natural lakes has suggested that some critical ecological processes play out on the ice. The objective of this study was to investigate the active processes in ice-covered stormwater lakes. Data collected during a two-year field measurement program at a stormwater lake located in Edmonton, Alberta, Canada were analyzed. The lake was covered by ice from November to mid-April of the following year. The mean value of chlorophyll-a during the ice-covered period was 22.09% of the mean value for the open-water season, suggesting that primary productivity under ice can be important. Nitrogen and phosphorus were remarkably higher during the ice-covered period, while dissolved organic carbon showed little seasonal variation. Under ice-covered conditions, the total phosphorus was the major nutrient controlling the ratio of total nitrogen to total phosphorus, and a significant positive correlation existed between total phosphorus and chlorophyll-a when the ratio was smaller than 10. The results provide preliminary evidence of the critical nutrient processes in the Stormwater Lake during the ice-covered period.
Noah, Joseph, And High-Resolution PaleoclimatologyScott St. George
In 1968, Benoit Mandelbrot and James Wallis published an article titled ‘Noah, Joseph, and operational Hydrology’ in the journal Water Resources Research. In it, they argued that hydrological models of the day were not able to estimate the true risk of extreme floods or prolonged drought, and that rare hydrological events were much more common than usually assumed.
In this lecture, I’ll review how high-resolution paleoenvironmental archives can help us judge more accurately the risks posed by the ‘Noah’- and ‘Joseph’-style events described by Mandelbrot and Wallis. I’ll give particular emphasis to the environmental information recovered from the rings of ancient trees, and explain how dendrochronology (tree-ring research) has been used to redefine the ‘flood of record’, test potential avenues for long-lead climate predictions, and gage the performance of state-of-the-art climate models.
Expanding the window - the past, present, and future of Minnesota's waterScott St. George
Nearly all decisions about water in Minnesota relate either directly or indirectly to data collected by the state’s hydrological observing network. Because most gauges were installed in early 20th century, as a whole the network provides us with roughly a 100-year ‘window’ to estimate flood risks, develop worst-case scenarios for drought, and set maximum allowable withdrawals for aquifers. But when we rely exclusively on observations made during this relatively brief interval, we may inadvertently increase our exposure to hydrological ‘surprises’. In order to make sound decisions about water in Minnesota, we need to expand this window: into the past, drawing upon historical accounts and natural archives; and into the future, via projections from climate and hydrological models. By cultivating a broader perspective on hydrological variability and extremes across the state, we will be better prepared to ensure adequate water supplies and mitigate the impacts of future floods and droughts.
Large-scale dendrochronology and low-frequency climate variabilityScott St. George
Large-scale low-frequency variability has emerged as a priority for climate research, but instrumental observations are not long enough to characterize this behavior or gage its impacts on dependent geophysical or ecological systems. As the leading source of high-resolution paleoclimate information in the middle- and high-latitudes, tree rings are essential to understand low-frequency variability prior to the instrumental period. But even though tree rings possess several advantages as climate proxies, like other natural archives they also have their own particular impediments. In this lecture, Dr. St. George will describe the structure and characteristics of the Northern Hemisphere tree-ring width network, and outline how the fingerprint of decadal and multidecadal climate variability encoded within ancient trees varies across the hemisphere.
Expecting the unexpected: The relevance of old floods to modern hydrologyScott St. George
As one of the most destructive hazards on our planet, floods kill thousands of people and cause billions of dollars in property damage every year. We usually try to gage the risk of future floods by fitting mathematic functions to hydrological data and then extrapolating the upper tail of those distributions. But because large floods are rare and river gage records are short, the conventional approach can sometimes drastically underestimate the threat posed to communities and infrastructure by extreme floods. In this lecture, I’ll argue that paleoflood hydrology — the study of ancient floods as recorded by river and lake sediments, trees, caves, and historical documents — is absolutely essential to judge the real risk of large, rare floods. And I’ll use examples from North America to illustrate how a ‘deeper river memory’ can help people evaluate their own vulnerability to floods, weigh the potential benefits of proposed infrastructure projects, and become more aware of what nature is truly capable of producing.
S Pillay, Dr. A. J. Smit, Dr Deborah Robertson-Andersson. Submitted to the ninth Scientific Symposium of the Western Indian Ocean Marine Science (WIOMSA) 2015.
Flood rings: Paleoflood evidence in tree-ring anatomyScott St. George
In low-gradient, low energy rivers, forms of tree-ring evidence such as impact scars or stem deformation do not provide useful evidence of past floods. In this talk, I explain the strengths and limitations of wood anatomy as tools in in paleoflood hydrology.
Absent rings are rare in Northern Hemisphere forests outside the American Sou...Scott St. George
Background/Question/Methods
Under environmental stress, boreal and temperate trees will occasionally form a discontinuous layer of wood about their stem, a condition described as a locally-absent (or “missing”) growth ring. Absent rings can potentially cause errors in tree-ring dates and dendroclimatic reconstructions but the frequency, distribution and controls of these features are not well understood at large spatial scales. Furthermore, the recent claim that the Northern Hemisphere tree-ring network contains multiple chronological errors caused by widespread but unrecognized locally-absent rings has been difficult to evaluate because it is not known where or when absent rings have occurred across boreal and temperate forests or what environmental factors cause the development of spatially-extensive absent rings. Here we present a synthesis of locally-absent rings across the Northern Hemisphere during the last millennium based on 2,359 publicly-available tree ring-width records.
Results/Conclusions
Over the entire dataset, one locally-absent ring was observed for every 240 visible rings. More than half of all records (1,296 of 2,359) did not contain a single absent ring. Absent rings were extremely uncommon at high latitudes; poleward of 50°N, the absent:visible ratio increased from 1:240 to 1:2,500. Absent rings were not widespread during the growing seasons that followed the four largest stratospheric sulfate aerosol injection events of the last millennium, including A.D. 1259 and the “Year Without a Summer” in A.D. 1816 or during the coldest year in the Northern Hemisphere in the last 1,500 years. Because these features have occurred so rarely in high-latitude and high-elevation tree ring-width records, the argument that paleotemperature estimates based on these data contain chronological errors due to unrecognized absent rings is not consistent with field observations. If however the rate of absent-ring formation were to increase in forests outside of the American Southwest, that behavior would represent a response to environmental stress that is without precedent over the last millennium.
In many settings, trees growing on floodplains provide an important source of indirect evidence that may be used to infer the occurrence, extent, and magnitude of floods prior to direct observations. That evidence may take several forms, including external scars caused by abrasion or impact from floating debris, anatomical changes within the annual growth increment following prolonged stem or root inundation, or tilting or uprooting due to the hydraulic pressure of floodwaters. Likely the most useful characteristic of paleoflood studies based on floodplain trees is their relatively high temporal resolution and dating accuracy compared to most other methods. Dendrochronological methods can routinely date past floods to the year of their occurrence and, in rare cases, can estimate the timing of floods that occur during the growing season to within two weeks. This high degree of chronological control, which is surpassed only by that provided by direct observation or instrumentation, can be used to determine whether floods in separate watersheds were synchronous or offset by several years and test hypotheses that suppose linkages between extreme floods and specific forcing mechanisms. Furthermore, the wide geographic distribution of tree species with dateable rings combined with the broad suite of methods available to examine interconnections between floods and tree growth allow this style of paleoflood hydrology to be applied to many settings that are not suitable for techniques that depend on geological evidence. Future paleoflood research involving tree rings will need to strike a balance between improving our understanding of the biological and fluvial processes that link tree growth to past events, and providing answers to questions about flood dynamics and hazards that are needed to safeguard people and property from future floods.
The "Year Without A Summer" was not a year without a ringScott St. George
The Tambora eruption of 1815 cooled the planet and caused the "Year Without A Summer" in western Europe and eastern North America. But was it cold enough to cause trees across the Northern Hemisphere to skip a ring?
The Toba super-eruption: micro-scale traces of a global-scale climate event?Kim Cobb
Who doesn't love a super-eruption? In this presentation, I review the facts surrounding the Toba super-eruption that occurred 74,000 years ago, and present preliminary data about its impacts on a cave system in the rain forests of Borneo.
Kim Cobb's Borneo stalagmite talk - AGU 2015Kim Cobb
This talk presents the latest results from the Borneo stalagmite project that seeks to reconstruct Western tropical Pacific hydrology over the last half million years. We discuss our results in the context of climate forcing, the El Nino-Southern Oscillation, and climate modeling studies.
ES 1010, Earth Science 1 Course Learning Outcomes for.docxaryan532920
ES 1010, Earth Science 1
Course Learning Outcomes for Unit V
Upon completion of this unit, students should be able to:
7. Compare the geography, composition, circulation, and temporal cycles of the oceans.
Reading Assignment
Chapter 9:
Oceans: The Last Frontier
Chapter 10:
The Restless Ocean
Watch the following video:
Williams, C. [IDT-CSU]. (2015, August 7). Coastal processes [Video file]. Retrieved from
https://youtu.be/ZO07SgCFKWs
Click here to access a transcript of the video.
NASA Goddard. (2008, October 24). In the zone. Retrieved from https://youtu.be/lB1FADETAyg
Unit Lesson
It is easy to see why Earth is referred to as the “Blue
Planet”—71% of the Earth’s surface is covered by
oceans and seas. However, less than 5% of our
oceans have been explored (National Oceanic and
Atmospheric Administration [NOAA] 2014). So
essentially, most of our Earth is still unexplored and
largely unknown. We do know that oceans contain the
highest mountains, the deepest trenches, and the
longest mountain ranges. On average, the ocean
depth is about four times the average elevation of
continents. In fact, Lutgens & Tarbuck (2014) state that
if the Earth’s continents were perfectly flat, they would
be completely submerged under more than 2,000
meters of seawater!
Oceanography is the branch of science that studies
the world’s oceans. It includes geology, chemistry,
physics, and biology (Lutgens & Tarbuck, 2014).
Oceanographers started mapping the oceans floors as
early as 1872 by dropping weighted lines down to the
ocean bottom at random points. The use of sound navigation and ranging (sonar) began during World War I
to detect enemy submarines, and was later improved during World War II. Sonar uses the echo of sound
waves to plot the profile of the ocean floor. Satellite radar technology has also contributed to mapping the
ocean floor. Today, we have a fairly good picture of the ocean floor topography.
As we study the ocean floor, we notice three major features: continental margins, basin floors, and mid-
oceanic ridge. The continental margins can be classified as active or passive. Active margins are where the
UNIT V STUDY GUIDE
Oceans
An iceberg captured on camera during a 30-day mission in
2012 to map areas of the Arctic aboard the NOAA Ship
Fairweather (NOAA, 2013).
https://online.columbiasouthern.edu/CSU_Content/courses/General_Studies/ES/ES1010/15N/UnitV_CoastalProcesses.pdf
ES 1010, Earth Science
UNIT x STUDY GUIDE
Title
ocean lithosphere is subducted beneath the continental crust (recall what you learned in Units III and IV).
These are mainly found around the Pacific Ocean. Passive margins are those that are not experiencing plate
tectonic activity and have more stable topography. Basin floors make up about 30% of the Earth’s surface
(Lutgens & Tarbuck, 2014). These areas are between the margins and the mid-ocean ridges and include
deep trenches, under ...
This is a pamphlet I made for the Hui Aloha O Kiholo community group in Kona that describes the current findings of research I am conducting at Kiholo Bay.
Greetings all,
This month’s newsletter is devoted to ocean indices aiming at a better understanding of the state of the ocean climate. Ocean
climate indices can be linked to major patterns of climate variability and usually have a significant social impact. The estimation of
the ocean climate indices along with their uncertainty is thus crucial: It gives an indication of our ability to measure the ocean. It is
as well a useful tool for decision making. Ocean climate indices also provide an at-a-glance overview of the state of the ocean
climate, and a way to talk to a wider audience about the ocean observing system. Several groups of experts are now working on
various ocean indicators using ocean forecast models, satellite data and reanalysis models in observing system simulation
experiments, among which the OOPC, NOAA and MERSEA/Boss4Gmes communities for example:
http://ioc3.unesco.org/oopc/state_of_the_ocean/index.php
http://www.cpc.ncep.noaa.gov/products/analysis_monitoring/enso_advisory/
http://www.aoml.noaa.gov/phod/cyclone/data/method.html
http://www.mersea.eu.org/Indicators-with-B4G.html
Scientific articles about Ocean indices in the present Newsletter are displayed as follows: The first article by Von Schuckmann et
al. is dealing with the estimation of global ocean indicators from a gridded hydrographic field. Then, Crosnier et al. are describing
the need to conduct intercomparison of model analyses and forecast in order for experts to provide a reliable scientific expertise
on ocean climate indicators. The next article by Coppini et al. is telling us about ocean indices computed from the Mediterranean
Forecasting System for the European Environment Agency and Boss4Gmes. Then Buarque et al. are revisiting the Tropical
Cyclone Heat Potential Index in order to better represent the ocean heat content that interacts with Hurricane. The last article by Greiner et al. is dealing with the assessment of robust ocean indicators and gives an example with oceanic predictors for the
Sahel precipitations.
The next July 2009 newsletter will review the current work on data assimilation and its techniques and progress for operational
oceanography.
We wish you a pleasant reading.
Lower than expected air temperatures and sunshine are now both increasing; rivers are generally running high. Willapa Bay unfolds its beauty from a bird’s-eye view. The spring phytoplankton bloom is picking up in Puget Sound. A large red-orange-brown bloom persists in southern Hood Canal at a scale sufficient for the MODIS satellite to pick up. Jellyfish are still going strong in southern inlets. Ocean climate indices (PDO, NPGO and Upwelling Index) explain much of the variability in Puget Sound temperature, salt and oxygen. Nutrients, however, are steadily increasing while sub-surface algal pigments (chlorophyll a) are declining!
Presented by Keyla Soto:
Penetration of Human-InducedWarming into the World’s Oceans
Tim P. Barnett, David W. Pierce, Krishna M. AchutaRao,Peter J. Gleckler, Benjamin D. Santer, Jonathan M. Gregory,Warren M. Washington
Spatial variation in physico chemical parameters of eastern obolo estuary, ni...
WOIMSA_conference
1. 1. Introduction
Algoa Bay is an open, shallow bay of <70m in depth on the
south-east coast of South Africa (Schumann et al., 2005). This
bay is located on the western boundary, current of the
Agulhas warm subtropical waters (Fig. 1).
This study was motivated by the culturing of the Pacific
oyster (Crassostrea gigas) in this region and because of
limited phytoplankton research beyond the neritic zone in
Algoa Bay.
3. Study Area and Methods
The study was located in the western sector of Algoa Bay on
the south-eastern coast of South Africa. Sampling was centred
at a station located on an oyster farm (33°56’48.65S;
25°36’40.70E) about ±1km from the Port Elizabeth harbour
(Fig. 2). Sampling was undertaken through a deployment of a
mooring (15 September 2010 to 4 June 2012) on the oyster
farm and two field studies (29 Nov to 1 Dec 2011- early
summer and 27 to 29 March 2012- early autumn) providing
further spatial details.
7. Acknowledgments
National Research Foundation (NRF), University of Cape Town (UCT) & Marine Research Institute (Ma-Re), UCTNational Research Foundation (NRF), University of Cape Town (UCT) & Marine Research Institute (Ma-Re), UCT
Postgraduate Funding Office .Postgraduate Funding Office .
Thanks to Mariculture Research team at the Department of Agriculture, Forestry & Fisheries (DAFF) for all resourcesThanks to Mariculture Research team at the Department of Agriculture, Forestry & Fisheries (DAFF) for all resources
and expertise.and expertise.
To the department of Biological Sciences and Oceanography (UCT) staff and postgraduate studentsTo the department of Biological Sciences and Oceanography (UCT) staff and postgraduate students..
Department of Environmental Affairs (DEA), Oceans & Coasts for the funding my WIOMSA symposium attendance.Department of Environmental Affairs (DEA), Oceans & Coasts for the funding my WIOMSA symposium attendance.
5. Discussion and conclusion
Temporal and spatial variability in environmental conditions such as dominance of south-easterly winds and periodic wind relaxation, stratification, nutrient depleted
waters, and increased surface warming in early summer enhanced Gonyaulax polygramma and other species to be the more abundant. In early autumn; mixed water
column and less solar radiation created favorable conditions for pennate diatoms of Pseudo-nitzschia species to be the most numerous .
This study shown that phytoplankton production in Algoa Bay is highly variable on a seasonal scale. These are not restricted by nutrient supply but mainly driven by the
hydrography and circulation dynamics on the bay, and the dominating Agulhas Current system governed by prevailing winds and SST resulting in high variability in
phytoplankton communities and biomass at spatial and temporal scales.
S.W. Mbambo, C.L. Moloney, G.C. Pitcher and S. Jackson
sfisowalter@gmail.com
6. Literature cited
DAWES, C. J. (1998) Phytoplankton. Marine Botany. 2nd edition. John Wiley and Sons Inc., New York, NY.
SCHUMANN, E.H., CHURCHILL, J.R.S. and H. J. ZAAYMAN. (2005) Oceanic variability in the western sector of Algoa
Bay, South Africa. African Journal of Marine Science, 27, 65-80.
2. Aim
This project is aimed at understanding the role of the physics
(seawater temperature and winds), and chemistry (nutrients)
in driving phytoplankton communities and assemblages.
These were examined at three different scales: event
(upwelling/algal bloom), seasonal and inter-annual scales.
1
2
3
a b
a b
Fig. 3: Time-series plot of chlorophyll-a concentrations (blue dots) and SST (red dots)
from 15 Sept 2010 to 4 June 2012. A 48-hourly running mean is shown for SST
values.
Fig. 4: (a) Progressive wind vectors from 1 October 2010 to 01 May 2011. (b) 1
October 2011 to 1 May 2012. Grey circles denote field trips and the green
star indicates the period with the highest chlorophyll-a concentration in
the time-series.
Fig. 5: SST (°C) profiles for each of the three transects measured in early summer
(left panel) and early autumn (right panel). NB: 3 transects are
represented by red numbers on the right(1, 2 and 3).
Fig. 6: MDS plots for samples in Algoa Bay in early summer. (a) Nitrate concentrations (µM.L-1
) in each
sample. (b) Sample grouping of 30% level of similarity, showing patterns of sample assemblages
within each nitrate concentration range.
Fig. 7: MDS plots for samples in early autumn. (a) Nitrate concentrations ( µM.L-1
) in each sample.
(b) Sample grouping of 50% level of similarity and to show patterns in sample grouping to
nitrate concentration ranges .
Fig. 8: Phytoplankton species and mean cells concentrations (cells.ml-3
) for fifteen
most numerous species found in Algoa Bay in both 2011 (early summer) (a)
and 2012 (early autumn) b) fieldtrips.
Dinoflagellates of Gonyaulax polygramma and other
Gonyaulax spp. that were dominant in the early
summer of 2011 in Algoa Bay.
Pennate diatoms of Pseudo-nitszchia spp. that were
dominant in the early autumn of 2012 in Algoa Bay.
Typical ski-boat used for the 2011/2012 field trips with a portable CTD (SeaCat
SBE-19) “Sea bird’’ anchored.
4. Results
Time-series showed (Fig.3) a strong seasonal variability in sea-surface temperature (SST). The summer of 2010/11 was cooler, with higher chl-a
concentration. The summer of 2011/12 was warmer compared to the previous summer with lower chlorophyll-a concentration.
Dominance of south-easterly winds in summer of 2010/11, were responsible for notable cooling and elevated phytoplankton biomass. However;
absence of south-easterly winds in summer of 2011/12 was associated with warming and low phytoplankton biomass (Fig. 4).
Sampling trips: A Sampling trip in early summer found a strong thermocline at a depth of approximately 15m, and SST ranged between 13.5 and 21°C.
In early autumn, deep water mixing was evident where the thermocline dropped to about 30m, with a SST range of 16.5 - 21°C.
In early summer samples showed a 30% similarity level and higher NO3 concentrations in transect 1. Early autumn had 50% similarity level in the
samples, and higher NO3 were noted for stations 1-3, while the rest was depleted.
In the early summer dinoflagellates of Gonyaulax polygramma and other species were the most abundant, whereas in early autumn pennate diatoms
of Pseudo-nitzschia species.
a b
Centric diatoms of Thalassiosira sp. were one of the
most abundant species in the early autumn of 2011 in
Algoa Bay.
Pennate diatoms of Thalassionema sp. were also
abundant in the early autumn of 2012 in Algoa Bay.
Sifiso Mbambo
Editor's Notes
Copyright Colin Purrington (http://colinpurrington.com/tips/academic/posterdesign).