Download to read offline
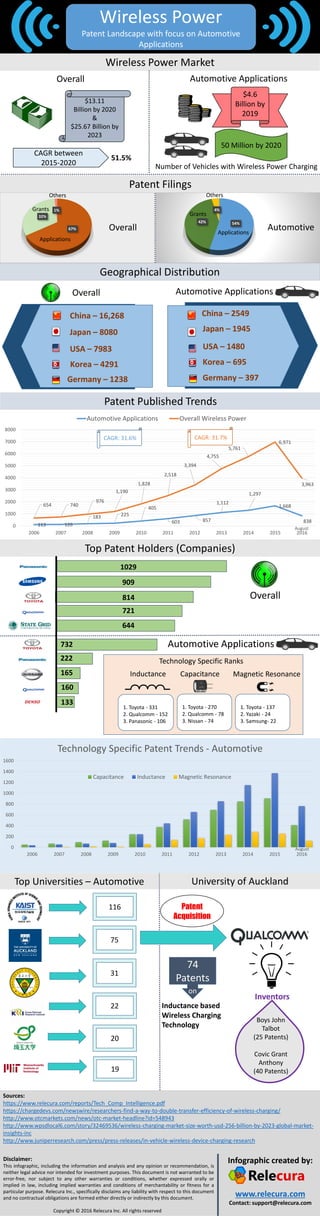

The wireless power market is projected to grow substantially over the next few years, reaching $13.11 billion by 2020 and $25.67 billion by 2023. Automotive applications of wireless power charging are expected to reach $4.6 billion by 2019. By 2020, 50 million vehicles are projected to include wireless power charging capabilities. Toyota, Qualcomm, and Panasonic are among the top patent holders for wireless power technologies overall and in automotive applications. Inductive charging accounts for the majority of patented wireless power technologies.


