Download to read offline


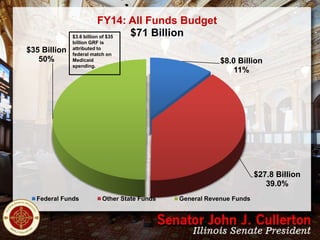
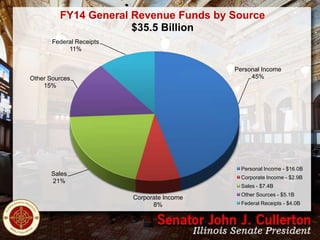
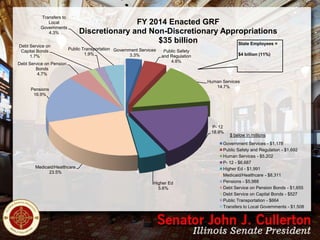

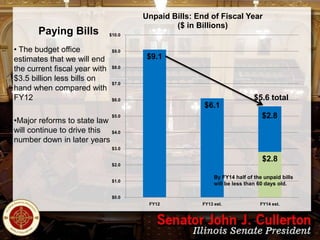
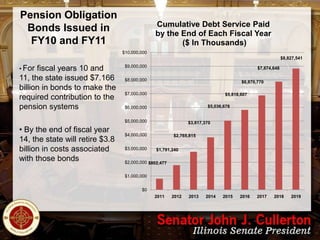
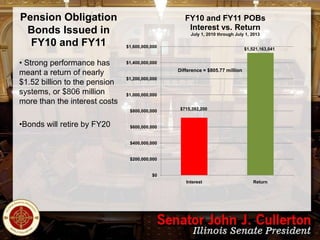
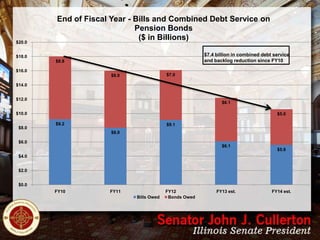

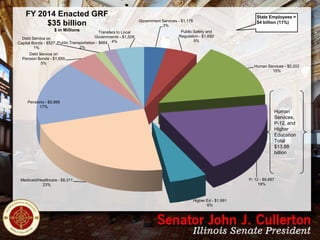


The document provides an overview of the state's FY2014 budget and finances. It shows that the $71 billion all funds budget draws from various sources, including $35 billion from general revenue funds. The general revenue funds come largely from personal income taxes and are allocated to areas like Medicaid, pensions, education, and human services. The state has reduced its backlog of unpaid bills from $9.1 billion in FY2012 to an estimated $5.6 billion in FY2014. Pension obligation bonds issued in FY2010-2011 will be fully retired by FY2020 and have generated $806 million more in returns than interest costs.