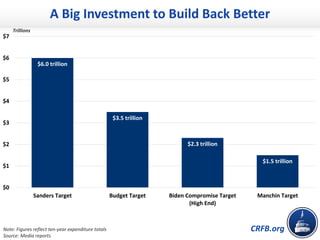
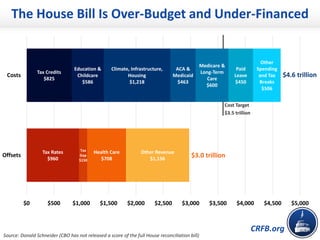
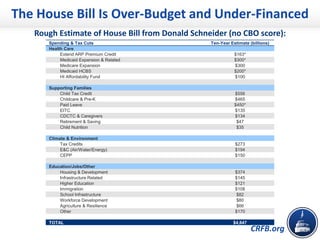
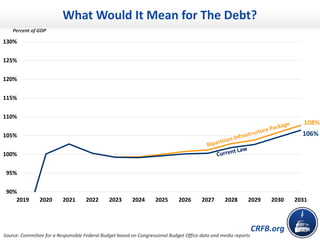
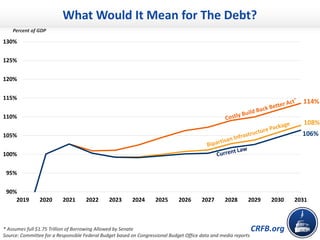
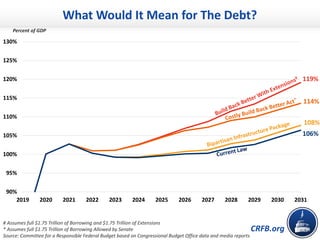
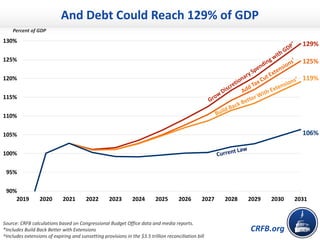
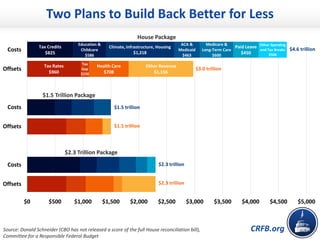
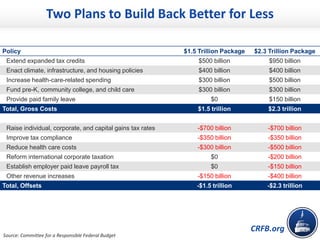
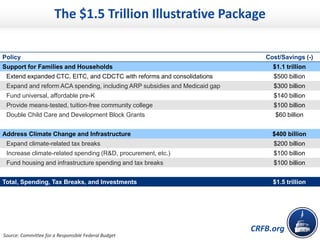
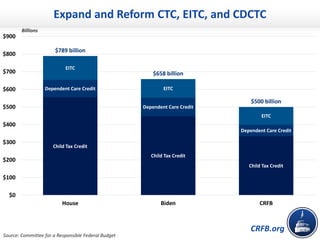
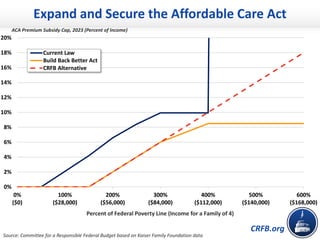
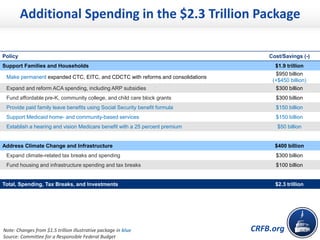
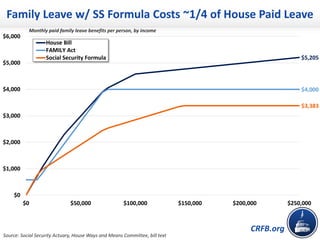
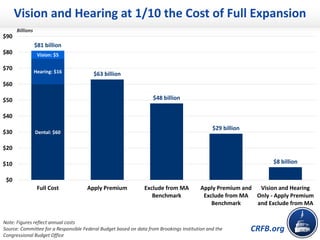
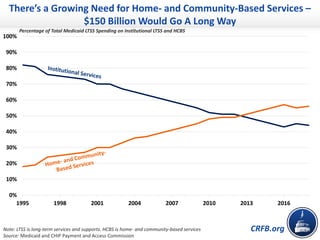
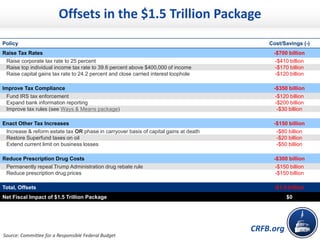
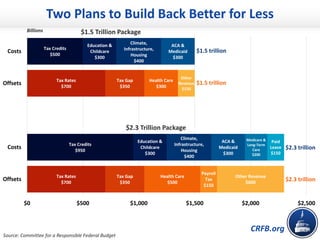
This document summarizes proposals for President Biden's economic recovery package, known as "Build Back Better". It compares the cost and policies of proposals ranging from $1.5 trillion to $4.6 trillion. The House-passed bill is estimated to cost $4.6 trillion but is underfunded. Alternative proposals that cost $1.5 trillion or $2.3 trillion are outlined, focusing spending on families, health care, education, climate and paid leave, and offsetting costs through tax increases. The $2.3 trillion option is described in more detail, expanding programs like the child tax credit while means-testing benefits and implementing reforms to reduce costs.
CRFB Webinar - The COVID-19 Economic Crisis, the Federal Response, and Our Ri...CRFBGraphics
This brief presentation contains a number of charts and other visualizations that help make sense of our nation’s fiscal state prior to the onset of the pandemic, the nature and scale of the current economic crisis, how the Federal Government has responded thus far, and the future implications of that response for the federal budget, deficit and debt.
The Committee for a Responsible Federal Budget gave an overview of the latest COVID relief deal and how much it will boost incomes and economic growth, and discussed the proposal for $2,000 checks.
The Committee for a Responsible Federal Budget published the only existing comprehensive study to detail and compare the fiscal cost of President Donald Trump and Vice President Joe Biden's campaign agendas. We estimate that both candidates would add trillions to the debt – but in very different ways.
States may provide Medicaid benefits either by directly reimbursing providers or by paying private health insurance plans or provider groups (called managed care organizations, or MCOs) to provide services to enrollees. This presentation examines the extent to which Medicaid benefits are delivered through MCOs and the reasons for recent growth in enrollment in and spending for managed care. CBO found that although the overwhelming majority of Medicaid beneficiaries are enrolled in MCOs, payments to MCOs account for less than half of all Medicaid spending. As for the increase in the use of managed care programs to provide Medicaid benefits, the agency found that it is largely attributable to MCOs’ expanding the types of beneficiaries, geographic areas, and range of services that they cover.
Presentation by Alice Burns, an analyst in CBO’s Budget Analysis Division, and by Ben Layton and Lyle Nelson, both of CBO’s Health, Retirement, and Long-Term Analysis Division, at AcademyHealth’s Annual Research Meeting.
The federal minimum wage is $7.25 per hour for most workers. CBO has examined how increasing the federal minimum wage to $10, $12, or $15 per hour by 2025 would affect employment and family income. Increasing the minimum wage would have two principal effects on low-wage workers. For most of them, earnings and family income would increase, which would lift some families out of poverty. But other low-wage workers would become jobless, and their family income would fall—in some cases, below the poverty threshold.
CRFB Webinar - Unpacking the Latest COVID Relief Package - April 22, 2020CRFBGraphics
Earlier this week, the Senate passed the Paycheck Protection Program and Health Care Enhancement Act – the fourth piece of legislation aimed at providing economic relief in the wake of the COVID-19 outbreak.
On Wednesday, the Committee for a Responsible Federal Budget hosted a webinar in which Senior Vice President and Senior Policy Director Marc Goldwein broke down and answered questions regarding the bill and recent actions taken by Congress, the Executive Branch, and the Federal Reserve in response to the COVID-19 crisis.
Presentation by Heidi Golding, an analyst in CBO’s National Security Division, at the Southern Economic Association Annual Meeting.
In this presentation, CBO provides background information on the VA health care system and past spending and describes 10-year projections by CBO on VA health spending under three different scenarios. CBO finds that, under certain assumptions, future spending required to treat veterans may be substantially higher (in inflation-adjusted dollars) than recent appropriations.
Presentation by Jeffrey Kling, an Associate Director for Economic Analysis at CBO, for the Commonwealth of Pennsylvania’s Independent Fiscal Office. (Canceled due to inclement weather.)
The transparency of CBO’s work has always been a priority, and this year the agency has added and shifted resources to redouble its efforts in that area. CBO has three goals in being transparent:
1. CBO aims to enhance the credibility of its work by showing how it relies on data, professional research, and expert feedback.
2. CBO seeks to promote a thorough understanding of its analyses by sharing information in an accessible, clear, and detailed manner.
3. CBO wants to help people gauge how its estimates might change if policies or circumstances were different.
CBO estimates that expected annual economic losses total $54 billion (adjusted to remove the effects of inflation) for most types of damage caused by storm surges, hurricane winds, and heavy precipitation. Expected annual federal spending in response to hurricane winds and storm-related flooding totals $17 billion.
Presentation by Terry Dinan (from CBO's Microeconomic Studies Division) at a Congressional Research Service seminar.
This presentation highlights laws that have been enacted to address a lapse in appropriations, CBO’s cost estimates for some recently proposed legislation that would provide spending authority during such a lapse, and other proposals introduced in the 116th Congress that would provide spending authority when there is a lapse in appropriations.
Presentation by Justin Riordan, an analyst in CBO’s Budget Analysis Division, at the American Association of Budget and Policy Analysis Spring 2019 Symposium.
Appropriation acts provide authority for federal programs or agencies to incur obligations and make payments. When appropriations lapse, the result is what is commonly called a government shutdown. This presentation briefly describes various legislative proposals related to a shutdown, such as a recently enacted law that pays furloughed federal workers once a shutdown ends and a proposed bill that would keep funding government operations at their current rate during a shutdown.
Presentation by Keith Hall, CBO Director, at the 35th Annual NABE Economic Policy Conference.
Federal debt is already large, and budget deficits over the next decade and beyond are projected to keep pushing it up in relation to the size of the economy. Eventually, debt as a share of economic output would reach its highest level in our nation’s history.
CBO estimates that the federal budget deficit in 2020 will be $1.0 trillion, or 4.6 percent of gross domestic product (GDP). It would increase to 5.4 percent of GDP in 2030 if current law did not change. In CBO’s projections, federal debt held by the public reaches $17.9 trillion at the end of 2020. That amount equals 81 percent of GDP—more than twice its average over the past 50 years. By 2030, debt is projected to reach $31.4 trillion, or 98 percent of GDP, a larger percentage than at any time since just after World War II. It would continue to grow after 2030, reaching 180 percent of GDP by 2050.
Inflation-adjusted GDP is projected to grow by 2.2 percent this year, largely because of continued strength in consumer spending and a rebound in business fixed investment. Output is projected to be higher than the economy’s maximum sustainable output in 2020 to a greater degree than it has been in recent years, leading to higher inflation and interest rates after a period in which both were low, on average. CBO projects that continued strength in the demand for labor will keep the unemployment rate low and drive employment and wages higher. Then over the coming decade, the economy is projected to expand at an average annual rate of 1.7 percent, roughly the same rate as its potential rate of growth.
Presentation by Christina Hawley Anthony, Chief of the Projections Unit in CBO’s Budget Analysis Division, to the National Conference of State Legislatures Base Camp.
CRFB webinar - Where Does the Next Phase of COVID Relief Stand - July 31, 2020CRFBGraphics
Lawmakers on Capitol Hill have been negotiating over a new package of economic and public health support to combat COVID-19. Congress has already enacted $3.7 trillion of spending, tax cuts and deferrals, loans, and other fiscal aid, but some of this support is now expiring, particularly expanded unemployment benefits.
On July 31st, Committee for a Responsible Federal Budget senior vice president Marc Goldwein presented a webinar titled "Where Does the Next Phase of COVID Relief Stand?" This slide deck was made to accompany that webinar.
Sen. Don Harmon and Rep. Camille Lilly held a town hall meeting in Oak Park to share information and answer questions on the Senate’s budget plan and the status of budget negotiations in Springfield.
US Budget Watch 2024: Fiscal Challenges Facing the Next AdministratinCRFBGraphics
This slide deck accompanied a presentation given by Marc Goldwein, senior vice president and senior policy director of the Committee for a Responsible Federal Budget, regarding the fiscal challenges that the winner of the 2024 presidential election will have to face, the principles that make for a fiscally responsible campaign, and the kinds of fiscal policies candidates are talking about on the campaign trail.
Slide deck from a May 11, 2020 webinar on who is buying the federal debt resulting from the COVID-19 economic relief efforts. Watch the video of the webinar at http://www.crfb.org/events/6-trillion-dollar-question-who-will-buy-our-debts.
This report provides an overview of key provisions of the two separate comprehensive health reform bills passed by the five committees of jurisdiction in the U.S. Congress: the Finance Committee and the Health, Education, Labor, and Pensions (HELP) Committee of the Senate, and the Ways and Means, Education and Labor, and Energy and Commerce committees of the House of Representatives. While the general frameworks of the bills are very similar—all bills include provisions intended to improve and expand coverage and all would create a comprehensive and coherent strategy for improving health care quality—they differ in a few key respects. Most important, the Senate Finance Committee bill does not include a public plan option or a requirement that employers offer coverage, nor does it reform for more than one year Medicare’s formula for setting physician fees; the House bill includes all of these features.
CRFB Webinar - What's the Status of COVID Relief Money - June 2, 2020CRFBGraphics
On Tuesday, June 2nd, 2020, CRFB Policy Director Marc Goldwein gave a webinar presentation on the current status of economic support funds provided by Congress through several major pieces of legislation passed in response to the COVID-19 pandemic and related economic crisis. This slide deck accompanied that presentation.
CRFB Webinar - Where Do We Stand on the National Debt - june 29 2020CRFBGraphics
On June 29th, Committee for a Responsible Federal Budget Policy Director Marc Goldwein gave a webinar detailing where the national debt and deficit stand in the post-COVID environment, featuring CRFB's updated 10-year budget projections. This slide deck accompanied that webinar.
Presentation delivered by Tom Gibney, SVP & Chief Financial Officer, St. Luke's Cornwall Hospital at the marcus evans National Healthcare CFO Summit Fall 2019 in San Diego CA.
Heritage Foundation economist Bill Beach explains how the federal government's tax-and-spend policies undermine the American Dream at a meeting of the Atlanta Committee for Heritage on June 3, 2010.
what is the future of Pi Network currency.DOT TECH
The future of the Pi cryptocurrency is uncertain, and its success will depend on several factors. Pi is a relatively new cryptocurrency that aims to be user-friendly and accessible to a wide audience. Here are a few key considerations for its future:
Message: @Pi_vendor_247 on telegram if u want to sell PI COINS.
1. Mainnet Launch: As of my last knowledge update in January 2022, Pi was still in the testnet phase. Its success will depend on a successful transition to a mainnet, where actual transactions can take place.
2. User Adoption: Pi's success will be closely tied to user adoption. The more users who join the network and actively participate, the stronger the ecosystem can become.
3. Utility and Use Cases: For a cryptocurrency to thrive, it must offer utility and practical use cases. The Pi team has talked about various applications, including peer-to-peer transactions, smart contracts, and more. The development and implementation of these features will be essential.
4. Regulatory Environment: The regulatory environment for cryptocurrencies is evolving globally. How Pi navigates and complies with regulations in various jurisdictions will significantly impact its future.
5. Technology Development: The Pi network must continue to develop and improve its technology, security, and scalability to compete with established cryptocurrencies.
6. Community Engagement: The Pi community plays a critical role in its future. Engaged users can help build trust and grow the network.
7. Monetization and Sustainability: The Pi team's monetization strategy, such as fees, partnerships, or other revenue sources, will affect its long-term sustainability.
It's essential to approach Pi or any new cryptocurrency with caution and conduct due diligence. Cryptocurrency investments involve risks, and potential rewards can be uncertain. The success and future of Pi will depend on the collective efforts of its team, community, and the broader cryptocurrency market dynamics. It's advisable to stay updated on Pi's development and follow any updates from the official Pi Network website or announcements from the team.
The secret way to sell pi coins effortlessly.DOT TECH
Well as we all know pi isn't launched yet. But you can still sell your pi coins effortlessly because some whales in China are interested in holding massive pi coins. And they are willing to pay good money for it. If you are interested in selling I will leave a contact for you. Just telegram this number below. I sold about 3000 pi coins to him and he paid me immediately.
Telegram: @Pi_vendor_247
Even tho Pi network is not listed on any exchange yet.
Buying/Selling or investing in pi network coins is highly possible through the help of vendors. You can buy from vendors[ buy directly from the pi network miners and resell it]. I will leave the telegram contact of my personal vendor.
@Pi_vendor_247
The European Unemployment Puzzle: implications from population agingGRAPE
We study the link between the evolving age structure of the working population and unemployment. We build a large new Keynesian OLG model with a realistic age structure, labor market frictions, sticky prices, and aggregate shocks. Once calibrated to the European economy, we quantify the extent to which demographic changes over the last three decades have contributed to the decline of the unemployment rate. Our findings yield important implications for the future evolution of unemployment given the anticipated further aging of the working population in Europe. We also quantify the implications for optimal monetary policy: lowering inflation volatility becomes less costly in terms of GDP and unemployment volatility, which hints that optimal monetary policy may be more hawkish in an aging society. Finally, our results also propose a partial reversal of the European-US unemployment puzzle due to the fact that the share of young workers is expected to remain robust in the US.
how to sell pi coins in all Africa Countries.DOT TECH
Yes. You can sell your pi network for other cryptocurrencies like Bitcoin, usdt , Ethereum and other currencies And this is done easily with the help from a pi merchant.
What is a pi merchant ?
Since pi is not launched yet in any exchange. The only way you can sell right now is through merchants.
A verified Pi merchant is someone who buys pi network coins from miners and resell them to investors looking forward to hold massive quantities of pi coins before mainnet launch in 2026.
I will leave the telegram contact of my personal pi merchant to trade with.
@Pi_vendor_247
how to swap pi coins to foreign currency withdrawable.DOT TECH
As of my last update, Pi is still in the testing phase and is not tradable on any exchanges.
However, Pi Network has announced plans to launch its Testnet and Mainnet in the future, which may include listing Pi on exchanges.
The current method for selling pi coins involves exchanging them with a pi vendor who purchases pi coins for investment reasons.
If you want to sell your pi coins, reach out to a pi vendor and sell them to anyone looking to sell pi coins from any country around the globe.
Below is the contact information for my personal pi vendor.
Telegram: @Pi_vendor_247
The Evolution of Non-Banking Financial Companies (NBFCs) in India: Challenges...beulahfernandes8
Role in Financial System
NBFCs are critical in bridging the financial inclusion gap.
They provide specialized financial services that cater to segments often neglected by traditional banks.
Economic Impact
NBFCs contribute significantly to India's GDP.
They support sectors like micro, small, and medium enterprises (MSMEs), housing finance, and personal loans.
USDA Loans in California: A Comprehensive Overview.pptxmarketing367770
USDA Loans in California: A Comprehensive Overview
If you're dreaming of owning a home in California's rural or suburban areas, a USDA loan might be the perfect solution. The U.S. Department of Agriculture (USDA) offers these loans to help low-to-moderate-income individuals and families achieve homeownership.
Key Features of USDA Loans:
Zero Down Payment: USDA loans require no down payment, making homeownership more accessible.
Competitive Interest Rates: These loans often come with lower interest rates compared to conventional loans.
Flexible Credit Requirements: USDA loans have more lenient credit score requirements, helping those with less-than-perfect credit.
Guaranteed Loan Program: The USDA guarantees a portion of the loan, reducing risk for lenders and expanding borrowing options.
Eligibility Criteria:
Location: The property must be located in a USDA-designated rural or suburban area. Many areas in California qualify.
Income Limits: Applicants must meet income guidelines, which vary by region and household size.
Primary Residence: The home must be used as the borrower's primary residence.
Application Process:
Find a USDA-Approved Lender: Not all lenders offer USDA loans, so it's essential to choose one approved by the USDA.
Pre-Qualification: Determine your eligibility and the amount you can borrow.
Property Search: Look for properties in eligible rural or suburban areas.
Loan Application: Submit your application, including financial and personal information.
Processing and Approval: The lender and USDA will review your application. If approved, you can proceed to closing.
USDA loans are an excellent option for those looking to buy a home in California's rural and suburban areas. With no down payment and flexible requirements, these loans make homeownership more attainable for many families. Explore your eligibility today and take the first step toward owning your dream home.
Turin Startup Ecosystem 2024 - Ricerca sulle Startup e il Sistema dell'Innov...Quotidiano Piemontese
Turin Startup Ecosystem 2024
Una ricerca de il Club degli Investitori, in collaborazione con ToTeM Torino Tech Map e con il supporto della ESCP Business School e di Growth Capital
Lecture slide titled Fraud Risk Mitigation, Webinar Lecture Delivered at the Society for West African Internal Audit Practitioners (SWAIAP) on Wednesday, November 8, 2023.
2. CRFB.org
A Big Investment to Build Back Better
$6.0 trillion
$3.5 trillion
$2.3 trillion
$1.5 trillion
$0
$1
$2
$3
$4
$5
$6
$7
Sanders Target Budget Target Biden Compromise Target
(High End)
Manchin Target
Note: Figures reflect ten-year expenditure totals
Source: Media reports
Trillions
3. CRFB.org
Tax Credits
$825
Education &
Childcare
$586
Climate, Infrastructure,
Housing
$1,218
ACA &
Medicaid
$463
Medicare &
Long-Term
Care
$600
Paid
Leave
$450
Tax Rates
$960
Tax
Gap
$150
Health Care
$708
Other Revenue
$1,156
Other
Spending
and Tax
Breaks
$506
$0 $500 $1,000 $1,500 $2,000 $2,500 $3,000 $3,500 $4,000 $4,500 $5,000
Offsets
Costs
The House Bill Is Over-Budget and Under-Financed
Cost Target
$3.5 trillion
Source: Donald Schneider (CBO has not released a score of the full House reconciliation bill)
$4.6 trillion
$3.0 trillion
4. CRFB.org
The House Bill Is Over-Budget and Under-Financed
Spending & Tax Cuts Ten-Year Estimate (billions)
Health Care
Extend ARP Premium Credit $163*
Medicaid Expansion & Related $300*
Medicare Expansion $300
Medicaid HCBS $200*
HI Affordability Fund $100
Supporting Families
Child Tax Credit $556
Childcare & Pre-K $465
Paid Leave $450*
EITC $135
CDCTC & Caregivers $134
Retirement & Saving $47
Child Nutrition $35
Climate & Environment
Tax Credits $273
E&C (Air/Water/Energy) $194
CEPP $150
Education/Jobs/Other
Housing & Development $374
Infrastructure Related $145
Higher Education $121
Immigration $108
School Infrastructure $82
Workforce Development $80
Agriculture & Resilience $66
Other $170
TOTAL $4,647
Rough Estimate of House Bill from Donald Schneider (no CBO score):
6. CRFB.org
Percent of GDP
114%
108%
106%
90%
95%
100%
105%
110%
115%
120%
125%
130%
2019 2020 2021 2022 2023 2024 2025 2026 2027 2028 2029 2030 2031
What Would It Mean for The Debt?
* Assumes full $1.75 Trillion of Borrowing Allowed by Senate
Source: Committee for a Responsible Federal Budget based on Congressional Budget Office data and media reports
7. CRFB.org
# Assumes full $1.75 Trillion of Borrowing and $1.75 Trillion of Extensions
* Assumes full $1.75 Trillion of Borrowing Allowed by Senate
Source: Committee for a Responsible Federal Budget based on Congressional Budget Office data and media reports
Percent of GDP
119%
114%
108%
106%
90%
95%
100%
105%
110%
115%
120%
125%
130%
2019 2020 2021 2022 2023 2024 2025 2026 2027 2028 2029 2030 2031
What Would It Mean for The Debt?
8. CRFB.org
Percent of GDP
129%
125%
119%
106%
90%
95%
100%
105%
110%
115%
120%
125%
130%
2019 2020 2021 2022 2023 2024 2025 2026 2027 2028 2029 2030 2031
And Debt Could Reach 129% of GDP
Source: CRFB calculations based on Congressional Budget Office data and media reports.
*Includes Build Back Better with Extensions
^Includes extensions of expiring and sunsetting provisions in the $3.5 trillion reconciliation bill
9. CRFB.org
Fitting $5 Trillion of Policies In a $1.5-$2.3 Trillion Plan
1. Prioritize between policies – do a few things well
2. Prioritize within policies – do what matters most
3. Minimize cost for maximal return – means-test, target, find
efficiencies, scale, consolidate, and reform
4. Avoid sunsets and other gimmicks – sunsets add chaos, put
programs at risk, and hide true cost
5. Pay for new priorities – offset spending with revenue and
health savings; don’t add a dollar to the debt
6. Mind the politics – do what can pass
9
10. CRFB.org
Two Plans to Build Back Better for Less
Source: Donald Schneider (CBO has not released a score of the full House reconciliation bill),
Committee for a Responsible Federal Budget
Tax Credits
$825
Education &
Childcare
$586
Climate, Infrastructure, Housing
$1,218
ACA &
Medicaid
$463
Medicare &
Long-Term Care
$600
Paid Leave
$450
Tax Rates
$960
Tax
Gap
$150
Health Care
$708
Other Revenue
$1,156
Other Spending
and Tax Breaks
$506
$0 $500 $1,000 $1,500 $2,000 $2,500 $3,000 $3,500 $4,000 $4,500 $5,000
Offsets
Costs
Offsets
Costs
Offsets
Costs
$1.5 Trillion Package
$2.3 Trillion Package
House Package
$4.6 trillion
$3.0 trillion
$1.5 trillion
$1.5 trillion
$2.3 trillion
$2.3 trillion
11. CRFB.org
Tax Credits
$950
Tax Credits
$500
Education &
Childcare
$300
Education &
Childcare
$300
Climate,
Infrastructure,
Housing
$400
Climate,
Infrastructure,
Housing
$400
ACA &
Medicaid
$300
ACA &
Medicaid
$300
Medicare &
Long-Term
Care
$200
Paid
Leave
$150
Tax Rates
$700
Tax Rates
$700
Tax Gap
$350
Tax Gap
$350
Health Care
$500
Health Care
$300
Payroll
Tax
$150
Other Revenue
$600
Other
Revenue
$150
$0 $500 $1,000 $1,500 $2,000 $2,500
Offsets
Costs
Offsets
Costs
Two Plans to Build Back Better for Less
Billions $1.5 Trillion Package
$2.3 Trillion Package
Source: Committee for a Responsible Federal Budget
$1.5 trillion
$1.5 trillion
$2.3 trillion
$2.3 trillion
12. CRFB.org
Policy $1.5 Trillion Package $2.3 Trillion Package
Extend expanded tax credits $500 billion $950 billion
Enact climate, infrastructure, and housing policies $400 billion $400 billion
Increase health-care-related spending $300 billion $500 billion
Fund pre-K, community college, and child care $300 billion $300 billion
Provide paid family leave $0 $150 billion
Total, Gross Costs $1.5 trillion $2.3 trillion
Raise individual, corporate, and capital gains tax rates -$700 billion -$700 billion
Improve tax compliance -$350 billion -$350 billion
Reduce health care costs -$300 billion -$500 billion
Reform international corporate taxation $0 -$200 billion
Establish employer paid leave payroll tax $0 -$150 billion
Other revenue increases -$150 billion -$400 billion
Total, Offsets -$1.5 trillion -$2.3 trillion
Source: Committee for a Responsible Federal Budget
Two Plans to Build Back Better for Less
13. CRFB.org
Policy Cost/Savings (-)
Support for Families and Households $1.1 trillion
Extend expanded CTC, EITC, and CDCTC with reforms and consolidations $500 billion
Expand and reform ACA spending, including ARP subsidies and Medicaid gap $300 billion
Fund universal, affordable pre-K $140 billion
Provide means-tested, tuition-free community college $100 billion
Double Child Care and Development Block Grants $60 billion
Address Climate Change and Infrastructure $400 billion
Expand climate-related tax breaks $200 billion
Increase climate-related spending (R&D, procurement, etc.) $100 billion
Fund housing and infrastructure spending and tax breaks $100 billion
Total, Spending, Tax Breaks, and Investments $1.5 trillion
Source: Committee for a Responsible Federal Budget
The $1.5 Trillion Illustrative Package
14. CRFB.org
Expand and Reform CTC, EITC, and CDCTC
Child Tax Credit
Child Tax Credit
Child Tax Credit
Dependent Care Credit
EITC
EITC
EITC
$789 billion
$658 billion
$500 billion
$0
$100
$200
$300
$400
$500
$600
$700
$800
$900
House Biden CRFB
Billions
Source: Committee for a Responsible Federal Budget
15. CRFB.org
Expand and Reform CTC, EITC, and CDCTC
The details:
• Provide a $150 per child refundable monthly benefit, increased to $200 per month for
children under age six (for a total of $1,800/$2,400).
• Provide an additional $1,200 refundable CTC, phased in with earnings as in current law.
• Means test the combined credits during tax filing, with single filers making over $50,000 and
married filers making over $100,000 seeing the initial $1,000 (or $1,600 for kids under six)
phased out and the rest phased out over $200,000 for single/$400,000 for married filers.
• Provide a fully refundable CDCTC of 50 percent of expenses for those making $40,000 or
less, phased down to 20 percent above $100,000 to 0 percent between $400,000 and
$440,000. Maximum credit of $4,000 for one dependent and $8,000 for two or more.
• Make a young child eligible for either the CDCTC or the $50 per month CTC supplement.
• Extend EITC expansion similar to the ARP.
• Enact other changes as necessary to address interactions, target benefits, and contain costs.
16. CRFB.org
* First figure is when credit starts to phase down (CTC from $3,000 to $2,000; CDCTC from 50% to 20%),
second figure is when credit starts to phase out
Source: Committee for a Responsible Federal Budget
Current Law (pre-ARP) Biden Proposal Illustrative Plan
CTC
Maximum per child CTC $2,000 $3,000 $3,000
Amount paid monthly $0 $125 $150
Maximum refundable CTC $1,400 $3,000 $3,000
Credit w/ no 15% phase-in $0 $3,000 $1,800
Phasedown thresholds* $400k $150k & $400k $100k & $400k
Additional CTC for 0-5-year-olds $0 $600 $600 or CDCTC
CDCTC
Maximum Credit (% of costs) 35% up to $1,050 50% up to $4,000 50% up to $4,000
Phase down thresholds* $15k & n/a $125k & $400k $40k & $400k
Refundable or non-refundable Non-refundable Refundable Refundable
Expand and Reform CTC, EITC, and CDCTC
17. CRFB.org
Expand and Secure the Affordable Care Act
Our reforms cost ~$300 billion as opposed to $500 billion.
The details:
• Restore cost-sharing reduction payments discontinued by the Trump Administration.
• Establish a state-based reinsurance and invisible risk pool fund.
• Extend subsidy increases with a more progressive formula above 300 percent of poverty.
• Establish federal Medicaid program for those below 138 percent of poverty in gap states.
• Provide those below poverty exchange subsidies until federal Medicaid is established.
18. CRFB.org
Expand and Secure the Affordable Care Act
Source: Committee for a Responsible Federal Budget based on Kaiser Family Foundation data
Percent of Federal Poverty Line (Income for a Family of 4)
0%
2%
4%
6%
8%
10%
12%
14%
16%
18%
20%
0%
($0)
100%
($28,000)
200%
($56,000)
300%
($84,000)
400%
($112,000)
500%
($140,000)
600%
($168,000)
Current Law
Build Back Better Act
CRFB Alternative
ACA Premium Subsidy Cap, 2023 (Percent of Income)
19. CRFB.org
Pre-K, Child Care, and Community College
Fund Universal, Affordable Pre-K ($140 billion)
The President’s budget proposes grants to states to support universal pre-K for all three- and four-year-olds. While the
White House estimates this would cost $140 billion over a decade, meeting that budget could require means testing or
targeting in some states.
Provide Means-Tested, Tuition-Free Community College ($100 billion)
The President’s budget proposes to fund up to two years of universal tuition-free community college at a cost of roughly
$110 billion. Our illustrative package includes tuition-free community college for those in households earning less than
$100,000 per year, phased out gradually above that. To the extent total costs fall below $100 billion, remaining funds
could be used to support college completion grants or to provide other higher education support.
Double Child Care and Development Block Grants ($60 billion)
In addition to substantially expanding the CDCTC, the President’s budget proposes a new set of subsidies designed to limit
a family’s child care costs to 7 percent of income. The White House estimates its proposal would cost $225 billion, but
actual costs could be higher.
To support state and local efforts to provide for affordable child care, our illustrative alternative would appropriate $60
billion over ten years toward Child Care and Development Block Grants. This would roughly double the size of these
grants, assuming appropriations continue as projected. This grant funding would be in addition to the expanded CDCTC.
20. CRFB.org
Targeted Pre-K and Care Do More for Economic Growth
Year
Targeted
Childcare
Universal
Childcare Targeted Pre-K
Universal
Pre-K
Targeted Pre-K
and Childcare
Universal Pre-K
and Childcare
2031 +0.3 0.2 +0.1 0 +0.2 +0.1
2041 +0.2 0 0 0 +0.2 0
2051 +0.1 -0.2 +0.1 0 +0.1 -0.2
GDP impact of different proposals
Source: Penn Wharton Budget Model
21. CRFB.org
$400B More, $1T Total, for Climate and Infrastructure
Policy Cost
Renewable energy and efficiency tax credits (House GREEN Act) $135 billion
Electric car, renewable fuels, and energy efficiency credits (Biden) $65 billion
Climate-related spending (R&D, procurement, green infra bank, etc.) $100 billion
Infrastructure & affordable housing spending and tax breaks $100 billion
Subtotal, Climate and Infrastructure Spending in Illustrative Plan $400 billion
Climate and Infrastructure spending in Bipartisan Infrastructure Plan $572 billion
Total Climate and Infrastructure Policies in “Build Back Better” $972 billion
Source: Committee for a Responsible Federal Budget, Congressional Budget Office
22. CRFB.org
Policy Cost/Savings (-)
Support Families and Households $1.9 trillion
Make permanent expanded CTC, EITC, and CDCTC with reforms and consolidations
$950 billion
(+$450 billion)
Expand and reform ACA spending, including ARP subsidies $300 billion
Fund affordable pre-K, community college, and child care block grants $300 billion
Provide paid family leave benefits using Social Security benefit formula $150 billion
Support Medicaid home- and community-based services $150 billion
Establish a hearing and vision Medicare benefit with a 25 percent premium $50 billion
Address Climate Change and Infrastructure $400 billion
Expand climate-related tax breaks and spending $300 billion
Fund housing and infrastructure spending and tax breaks $100 billion
Total, Spending, Tax Breaks, and Investments $2.3 trillion
Note: Changes from $1.5 trillion illustrative package in blue
Source: Committee for a Responsible Federal Budget
Additional Spending in the $2.3 Trillion Package
23. CRFB.org
Monthly paid family leave benefits per person, by income
Source: Social Security Actuary, House Ways and Means Committee, bill text
Family Leave w/ SS Formula Costs ~1/4 of House Paid Leave
$5,205
$4,000
$3,383
$0
$1,000
$2,000
$3,000
$4,000
$5,000
$6,000
$0 $50,000 $100,000 $150,000 $200,000 $250,000
House Bill
FAMILY Act
Social Security Formula
24. CRFB.org
Note: Figures reflect annual costs
Source: Committee for a Responsible Federal Budget based on data from Brookings Institution and the
Congressional Budget Office
Billions
Dental: $60
Hearing: $16
Vision: $5
$81 billion
$63 billion
$48 billion
$29 billion
$8 billion
$0
$10
$20
$30
$40
$50
$60
$70
$80
$90
Full Cost Apply Premium Exclude from MA
Benchmark
Apply Premium and
Exclude from MA
Benchmark
Vision and Hearing
Only - Apply Premium
and Exclude from MA
Vision and Hearing at 1/10 the Cost of Full Expansion
26. CRFB.org
There’s a Growing Need for Home- and Community-Based Services –
$150 Billion Would Go A Long Way
0%
10%
20%
30%
40%
50%
60%
70%
80%
90%
100%
1995 1998 2001 2004 2007 2010 2013 2016
Percentage of Total Medicaid LTSS Spending on Institutional LTSS and HCBS
Note: LTSS is long-term services and supports. HCBS is home- and community-based services
Source: Medicaid and CHIP Payment and Access Commission
27. CRFB.org
Policy Cost/Savings (-)
Raise Tax Rates -$700 billion
Raise corporate tax rate to 25 percent -$410 billion
Raise top individual income tax rate to 39.6 percent above $400,000 of income -$170 billion
Raise capital gains tax rate to 24.2 percent and close carried interest loophole -$120 billion
Improve Tax Compliance -$350 billion
Fund IRS tax enforcement -$120 billion
Expand bank information reporting -$200 billion
Improve tax rules (see Ways & Means package) -$30 billion
Enact Other Tax Increases -$150 billion
Increase & reform estate tax OR phase in carryover basis of capital gains at death -$80 billion
Restore Superfund taxes on oil -$20 billion
Extend current limit on business losses -$50 billion
Reduce Prescription Drug Costs -$300 billion
Permanently repeal Trump Administration drug rebate rule -$150 billion
Reduce prescription drug prices -$150 billion
Total, Offsets -$1.5 trillion
Net Fiscal Impact of $1.5 Trillion Package $0
Source: Committee for a Responsible Federal Budget
Offsets in the $1.5 Trillion Package
28. CRFB.org
Source: Congressional Budget Office, Office of Management and Budget, Penn Wharton Budget Model
Billions
Closing the Tax Gap Raises Revenue Without Raising Taxes
$41 billion
$60 billion
$63 billion
$87 billion
$120 billion
$400 billion
$711 billion
$0
$100
$200
$300
$400
$500
$600
$700
$20b IRS
Funding
(CBO)
Trump Plan
(CBO)
$40b IRS
Funding
(CBO)
Trump Plan
(OMB)
$80b of IRS
Funding
(CBO)
Biden Plan
(CBO)
Biden Plan
(PWBM)
Biden Plan
(OMB)
IRS Funding
Information Reporting and Other Reforms
29. CRFB.org
Information Reporting Massively Improves Compliance
Source: Internal Revenue Service
Billions
$9 $12
$36
$109
1%
5%
17%
55%
0%
10%
20%
30%
40%
50%
60%
70%
80%
90%
100%
$0
$24
$48
$72
$96
$120
Income Subject to
Substantial Information
Reporting and
Withholding
Income Subject to
Substantial Information
Reporting
Income Subject to Some
Information Reporting
Income Subject to Little or
No Information Reporting
Underreporting Tax Gap
Net Misreporting Percentage
31. CRFB.org
Reforming Stepped-Up Basis Would Generate Substantial Revenue
Note: Costs are in billions of nominal dollars and are over the applicable budget window when the
policy was scored. For reference, replacing stepped-up basis with carryover basis and taxing capital
gains at death is scored over the 2021-2030 budget window. The Obama proposal is scored over the
2016-2026 window and the Biden proposal is scored over the 2022-2031 window.
Sources: Congressional Budget Office, Joint Committee on Taxation, U.S. Department of Treasury.
$110
$204
$249
$322
$0
$50
$100
$150
$200
$250
$300
$350
Replace Stepped-Up Basis
With Carryover Basis (CBO)
Tax Capital Gains at Death
(PWBM)
Obama: Tax Capital Gains at
Death, 24.2% Rate (JCT)
Biden: Tax Capital Gains at
Death for Millionaires,
39.6% Rate (Treasury)
Billions of Nominal Dollars
32. CRFB.org
Share of Tax Benefit from Stepped-Up Basis
Source: Congressional Budget Office
60th to 80th Percentile
17%
90th to 99th Percentile
34%
Bottom 60 Percent
18%
80th to 90th
Percentile
10%
Top 1 Percentile
21%
While Improving Tax Efficiency, Equity, and Fairness
33. CRFB.org
Policy Cost/Savings (-)
Raise Tax Rates -$700 billion
Raise corporate tax rate to 25 percent -$410 billion
Raise top individual income tax rate to 39.6 percent above $400,000 of income -$170 billion
Raise capital gains tax rate to 24.2 percent and close carried interest loophole -$120 billion
Improve Tax Compliance -$350 billion
Fund IRS tax enforcement -$120 billion
Improve bank information reporting and improve tax rules (see Ways and Means package) -$230 billion
Other Taxes -$750 billion
Close gap in the 3.8 percent NIIT/SECA tax on high-income households -$250 billion
Reform international tax rules -$200 billion
Establish 0.2 percent employer payroll tax to fund paid family leave -$150 billion
Increase & reform estate tax OR phase in carryover basis of capital gains at death -$80 billion
Restore Superfund taxes on oil -$20 billion
Extend current limit on business losses -$50 billion
Reduce Health Care Costs -$500 billion
Reduce prescription drug costs -$300 billion
Reduce health care costs (Medicare providers, Medicare Advantage, drugs) -$200 billion
Total, Offsets -$2.3 trillion
Net Fiscal Impact of $2.3 Trillion Package $0
Note: Changes from $1.5 trillion illustrative package in blue
Source: Committee for a Responsible Federal Budget
More Offsets in the $2.3 Trillion Illustrative Package
34. CRFB.org
Policy Ten-Year Savings
Reduce Prescription Drug Costs
Require drug price negotiations with international cap Up to $500 billion
Enact Part D formula re-design $5 to $75 billion
Cap drug price growth at inflation $35 to $80 billion
Transition Medicare Part B payments to a system that fosters competition among clinically comparable drugs $120 billion
Expand Medicare and Medicaid Drug Rebates up to $150 billion
Prevent evergreening delays of generic drug competition through FDA exclusivity rules $10 billion
Reduce or Reform Medicare Provider Payments
Equalize Medicare payments regardless of site-of-care $150 to $280 billion
Reduce and reform payments for uncompensated care up to $90 billion
Reduce and reform Medicare post-acute care payments $50 to $100 billion
Reduce and reform payments for Graduate Medical Education $35 to $90 billion
Reduce or repeal Medicare payments for bad debts $25 to $80 billion
Expand use of bundled payments $10 to $50 billion
Health Savings Options
Note: All numbers rounded to the nearest $5 billion
Source: Congressional Budget Office, Health Savers Initiative, and Committee for a Responsible Federal Budget
35. CRFB.org
Policy Ten-Year Savings
Reduce or Reform Medicare Advantage (MA) Payments
Adjust Medicare Advantage payments for accurately for coding intensity $45 to $355 billion
Set Medicare Advantage payments using competitive bidding $55 to $230 billion
Modify risk adjustment payments in Medicare Advantage $50 to $80 billion
Reduce excessive quality bonus payments to Medicare Advantage plans $30 to $165 billion
Enact Affordable Care Act (ACA) Savings
Establish a public option for the health exchanges ~$150 billion
Restore cost-sharing reductions funding ~$100 billion
Recapture excessive premium subsidies $50 billion
Note: All numbers rounded to the nearest $5 billion
Source: Congressional Budget Office, Health Savers Initiative, and Committee for a Responsible Federal Budget
Health Savings Options
36. CRFB.org
We Don’t Hide the True Costs with Numerous Expirations*
* In our $1.5 trillion bill, we only extend the CTC expansion until other parts of the TCJA expire in 2025.
Policymakers must fully commit to offset any further extension
Source: Committee for a Responsible Federal Budget
“True Cost” of
$1.5T Package
(with extensions)
“True Cost” of
$2.3T Package
(with extensions)
Sunset After 2 Years (Jan 1, 2024) $9.3 trillion $14.3 trillion
Sunset After 4 Years (Jan 1, 2026) $4.0 trillion $6.2 trillion
Sunset After 6 Years (Jan 1, 2028) $3.1 trillion $3.8 trillion
Sunset After 8 Years (Jan 1, 2030) $1.8 trillion $2.8 trillion
Illustrative Cost of reconciliation in extreme case that ALL provisions expired and
were later extended without offsets
37. CRFB.org
* No Cost
Note: Numbers are rounded to one decimal place
Source: Congressional Budget Office, Moody’s, Penn Wharton Budget Model, Tax Foundation, and
Committee for a Responsible Federal Budget
0.6%
0.1%
0.4%
-0.6%
-0.1%
-2.5%
2.0%
3.5%
-3.0% -2.0% -1.0% 0.0% 1.0% 2.0% 3.0% 4.0%
Tax Cuts & Jobs Act (CBO)
$500 Billion of Infrastructure* (CBO)
Universal Pre-K & Child Care* (PWBM)
Reconciliation Tax Policies (Tax Foundation)
$1.5 Trillion Reconciliation (PWBM)
$3.5 Trillion Reconciliation (PWBM)
$3.5 Trillion Reconciliation (Moody's)
Increase to Generate $600 Billion Dynamic Effect
2031 GDP Change from Different Policies
We Don’t Rely on Rosy Dynamic Scoring
38. CRFB.org
Source: Tax Policy Center
Average 2022 Benefit from Repeal of SALT Cap, dollars
$0 $2 $15 $85 $360
$2,480
$35,660
$0
$5,000
$10,000
$15,000
$20,000
$25,000
$30,000
$35,000
$40,000
Bottom
Quintile
Second
Quintile
Middle
Quintile
Fourth
Quintile
80th-90th
Percentile
90th-99th
Percentile
Top 1%
We Don’t Waste a Dime on SALT Cap Repeal
39. CRFB.org
$85
$110
$23
$17
$11
$70
$50
$33
$0
$20
$40
$60
$80
$100
$120
SALT Cap
Repeal
Extended
Expanded
Child Tax
Credit
Paid Family
Leave
Universal
Pre-K
Free
Community
College
Raise
Corporate
Rate to 28%
Drug Price
Negotiations
Increase Top
Individual
Rate to 39.6%
Billions Per Year
Note: Annual costs of proposed policies use averages of the total cost over the time relevant time period
Source: Tax Policy Center, Office of Management and Budget, Senate Finance Committee, Committee for
a Responsible Federal Budget
We Don’t Waste a Dime on SALT Cap Repeal
40. CRFB.org
Source: Tax Policy Center, Tax Foundation, Committee for a Responsible Federal Budget
Percent of Overall Benefit of Different Tax Reform Proposals that Would Accrue to the Bottom Three Income Quintiles
0.8% 1.6% 2.6%
12.3%
34.7%
63.6%
0%
10%
20%
30%
40%
50%
60%
70%
Repeal SALT
Cap
Repeal SALT
Cap Below $1m
Repeal SALT
Cap Below
$500k
Repeal SALT
Cap Below
$200k
Tax Cuts and
Jobs Act
CASH Act
($2k rebates)
We Don’t Waste a Dime on SALT Cap Repeal
41. CRFB.org
Tax Credits
$950
Tax Credits
$500
Education &
Childcare
$300
Education &
Childcare
$300
Climate,
Infrastructure,
Housing
$400
Climate,
Infrastructure,
Housing
$400
ACA &
Medicaid
$300
ACA &
Medicaid
$300
Medicare &
Long-Term
Care
$200
Paid
Leave
$150
Tax Rates
$700
Tax Rates
$700
Tax Gap
$350
Tax Gap
$350
Health Care
$500
Health Care
$300
Payroll
Tax
$150
Other Revenue
$600
Other
Revenue
$150
$0 $500 $1,000 $1,500 $2,000 $2,500
Offsets
Costs
Offsets
Costs
Two Plans to Build Back Better for Less
Billions $1.5 Trillion Package
$2.3 Trillion Package
Source: Committee for a Responsible Federal Budget
$1.5 trillion
$1.5 trillion
$2.3 trillion
$2.3 trillion