1) The document describes a study using Universal Mechanism software to optimize wheel profiles for Russian railways. Wheel profiles were optimized for freight cars with 23.5 and 25 tonne axle loads, and passenger cars up to 160 km/h.
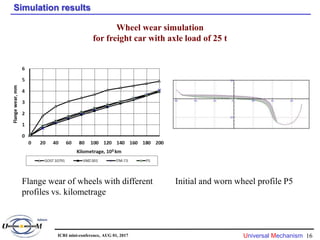
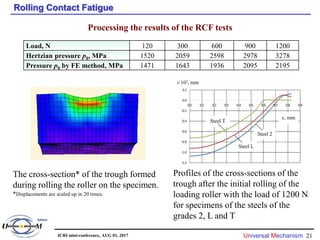
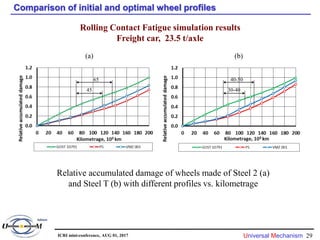
2) Simulations of wheel wear and rolling contact fatigue were conducted to evaluate different wheel profiles against criteria of wear, fatigue, and safety. Optimal profiles were identified that extended re-profiling intervals and reduced maintenance costs.
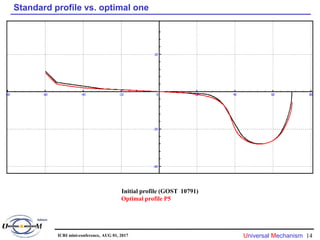
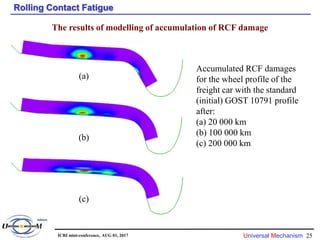
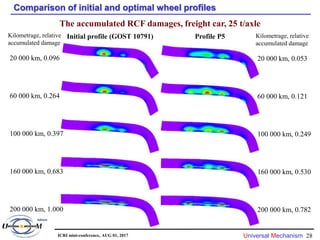
3) Comparisons of initial and optimized profiles found the optimized profiles significantly reduced accumulated rolling contact fatigue damage over long distances, improving wheel lifespan.


![Universal Mechanism 9
Wear Model and Parameters
Wear model
A
k
I V
I is the volume wear, m3;
kV is the factor of the volume wear, m3/J;
A is the work of friction, J
Research in the field conditions on the Gottard line [1]
km = (1.1-2.4)∙10-3 mg/Nm
Wear factor vs. hardness
km = 5.455·10-3 – 1.3·10-5 HB mg/Nm (1)
Steel grade 2 L T
Wear factor km, mg/Nm 1.83∙10-3 1.54∙10-3 1.24∙10-3
[1] O. Krettek, A. Szabo, E. Bekefi, I. Zobory. On identification of wear coefficient used in the
dissipated energy based wear hypothesis, in: Proc. of the 2nd mini conf. Contact mechanics and
wear of rail/wheel systems, Budapest, 1996, pp. 260-265.
[2] D.P. Markov, Increasing the hardness of railway wheels, Bull. All Russia Sci. Res. Inst. Railway
Transport 3 (1995) 10-17 (in Russian).
ICRI mini-conference, AUG 01, 2017](https://image.slidesharecdn.com/wheelprofileoptimizationicri-rcf-240406022742-09c4fca8/85/Wheel-profile-optimization-icri-rcf-pptx-9-320.jpg)


![Universal Mechanism 30
Discussion of RCF Criteria
Criteria of RCF damage
1) The maximum Hertzian pressure
2) The amplitude of the maximum shear stress
3) The Dang Van criterion
4) The Sines criteria
5) The potential energy of deformation
2
/
)
( 3
1
max
e
h
DV
a
DV t
t
)
(
)
(
is the shear stress “amplitude” ;
is the hydrostatic stress;
is the fatigue limit of material in pure shear;
is the Dang Van factor
)
(t
a
)
(t
h
e
DV
A
J
J
J
J P
R
M
)
( 1
1
1
2
)
(
6
)
(
)
(
)
(
3
1 2
2
2
2
2
2
2 zx
yz
xy
x
z
z
y
y
x T
T
T
S
S
S
S
S
S
J
)]
(
2
[
2
1
1
3
3
2
2
1
2
3
2
2
2
1
0
E
U
ICRI mini-conference, AUG 01, 2017](https://image.slidesharecdn.com/wheelprofileoptimizationicri-rcf-240406022742-09c4fca8/85/Wheel-profile-optimization-icri-rcf-pptx-30-320.jpg)


