Download as PDF, PPTX
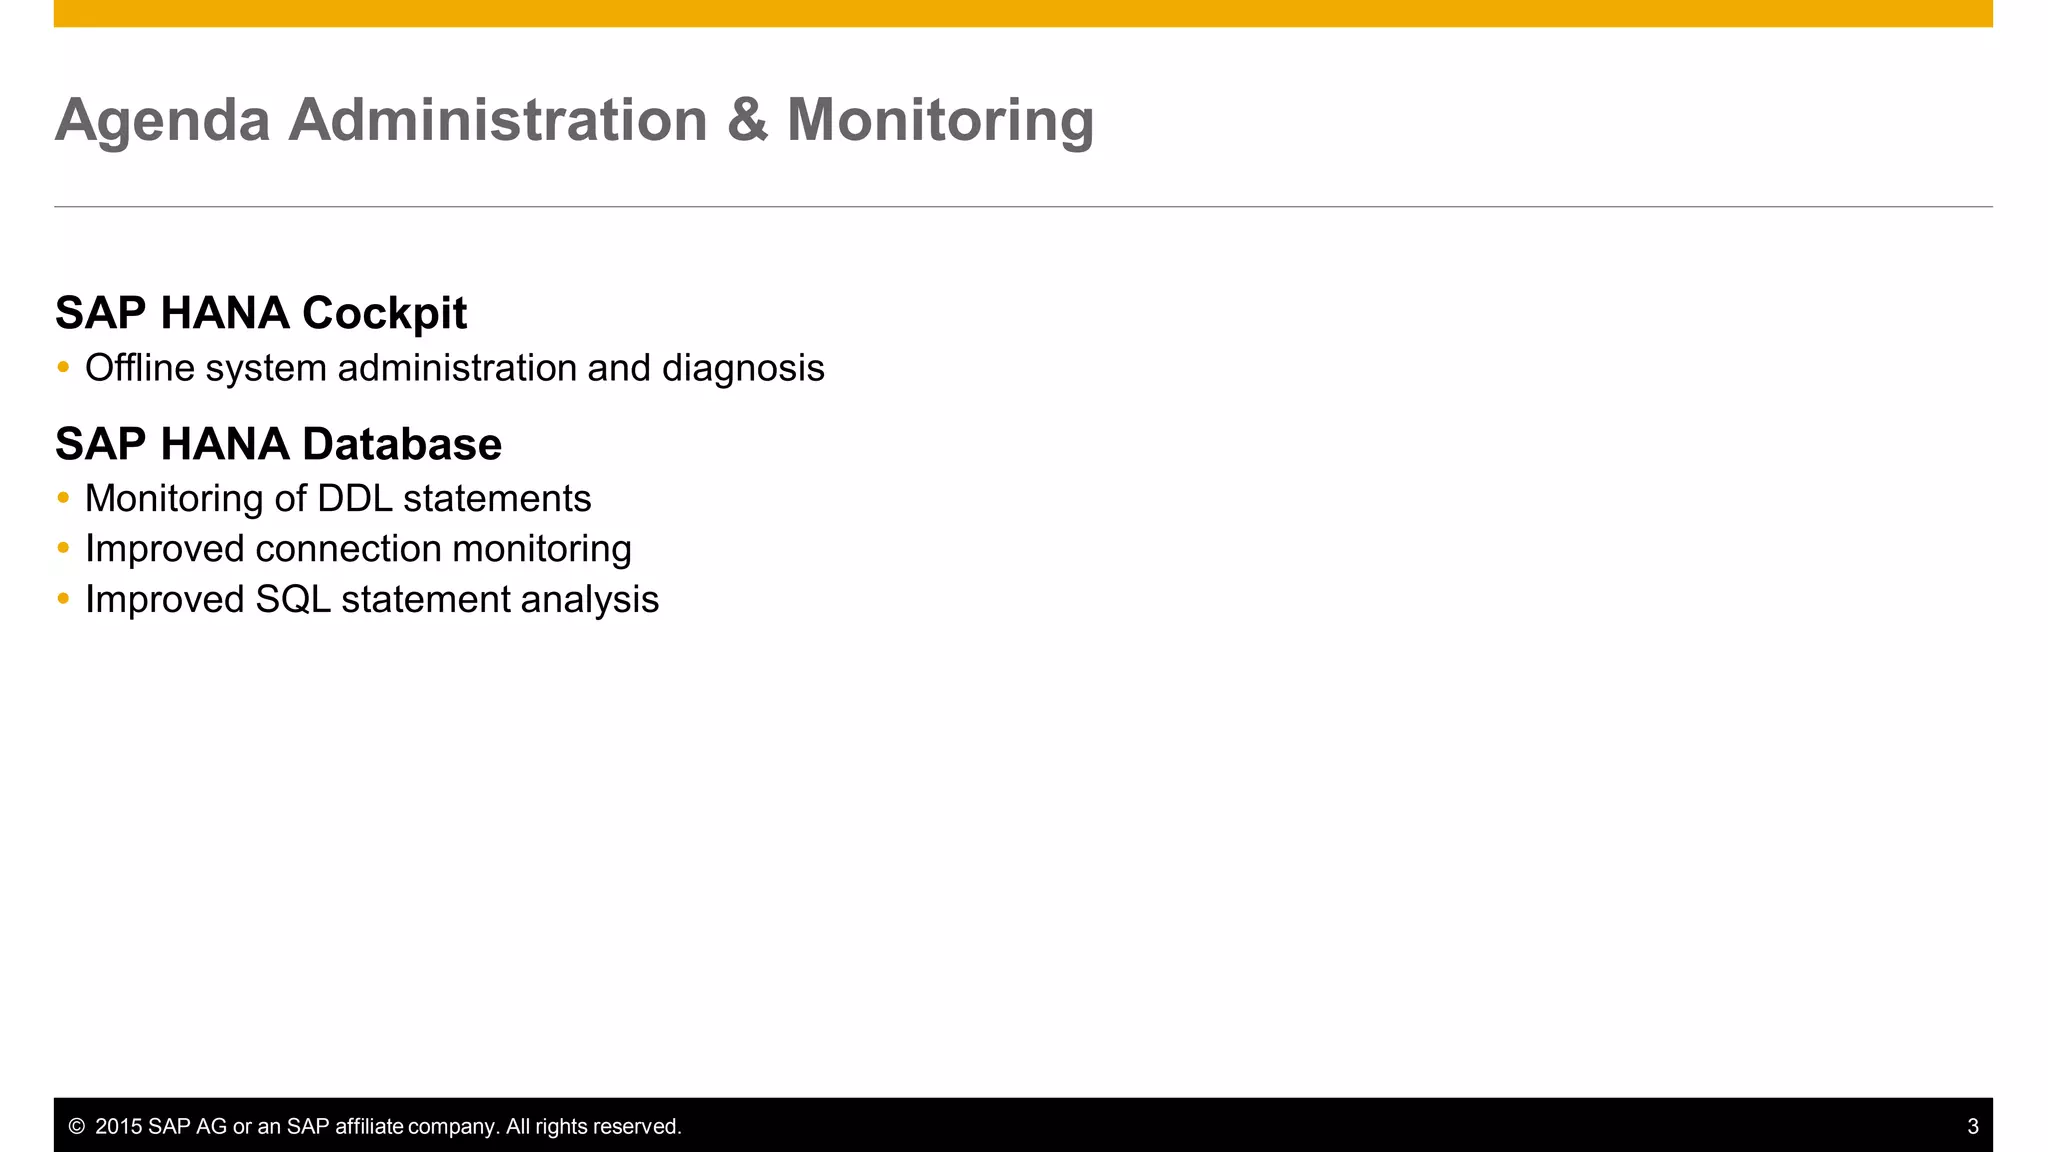

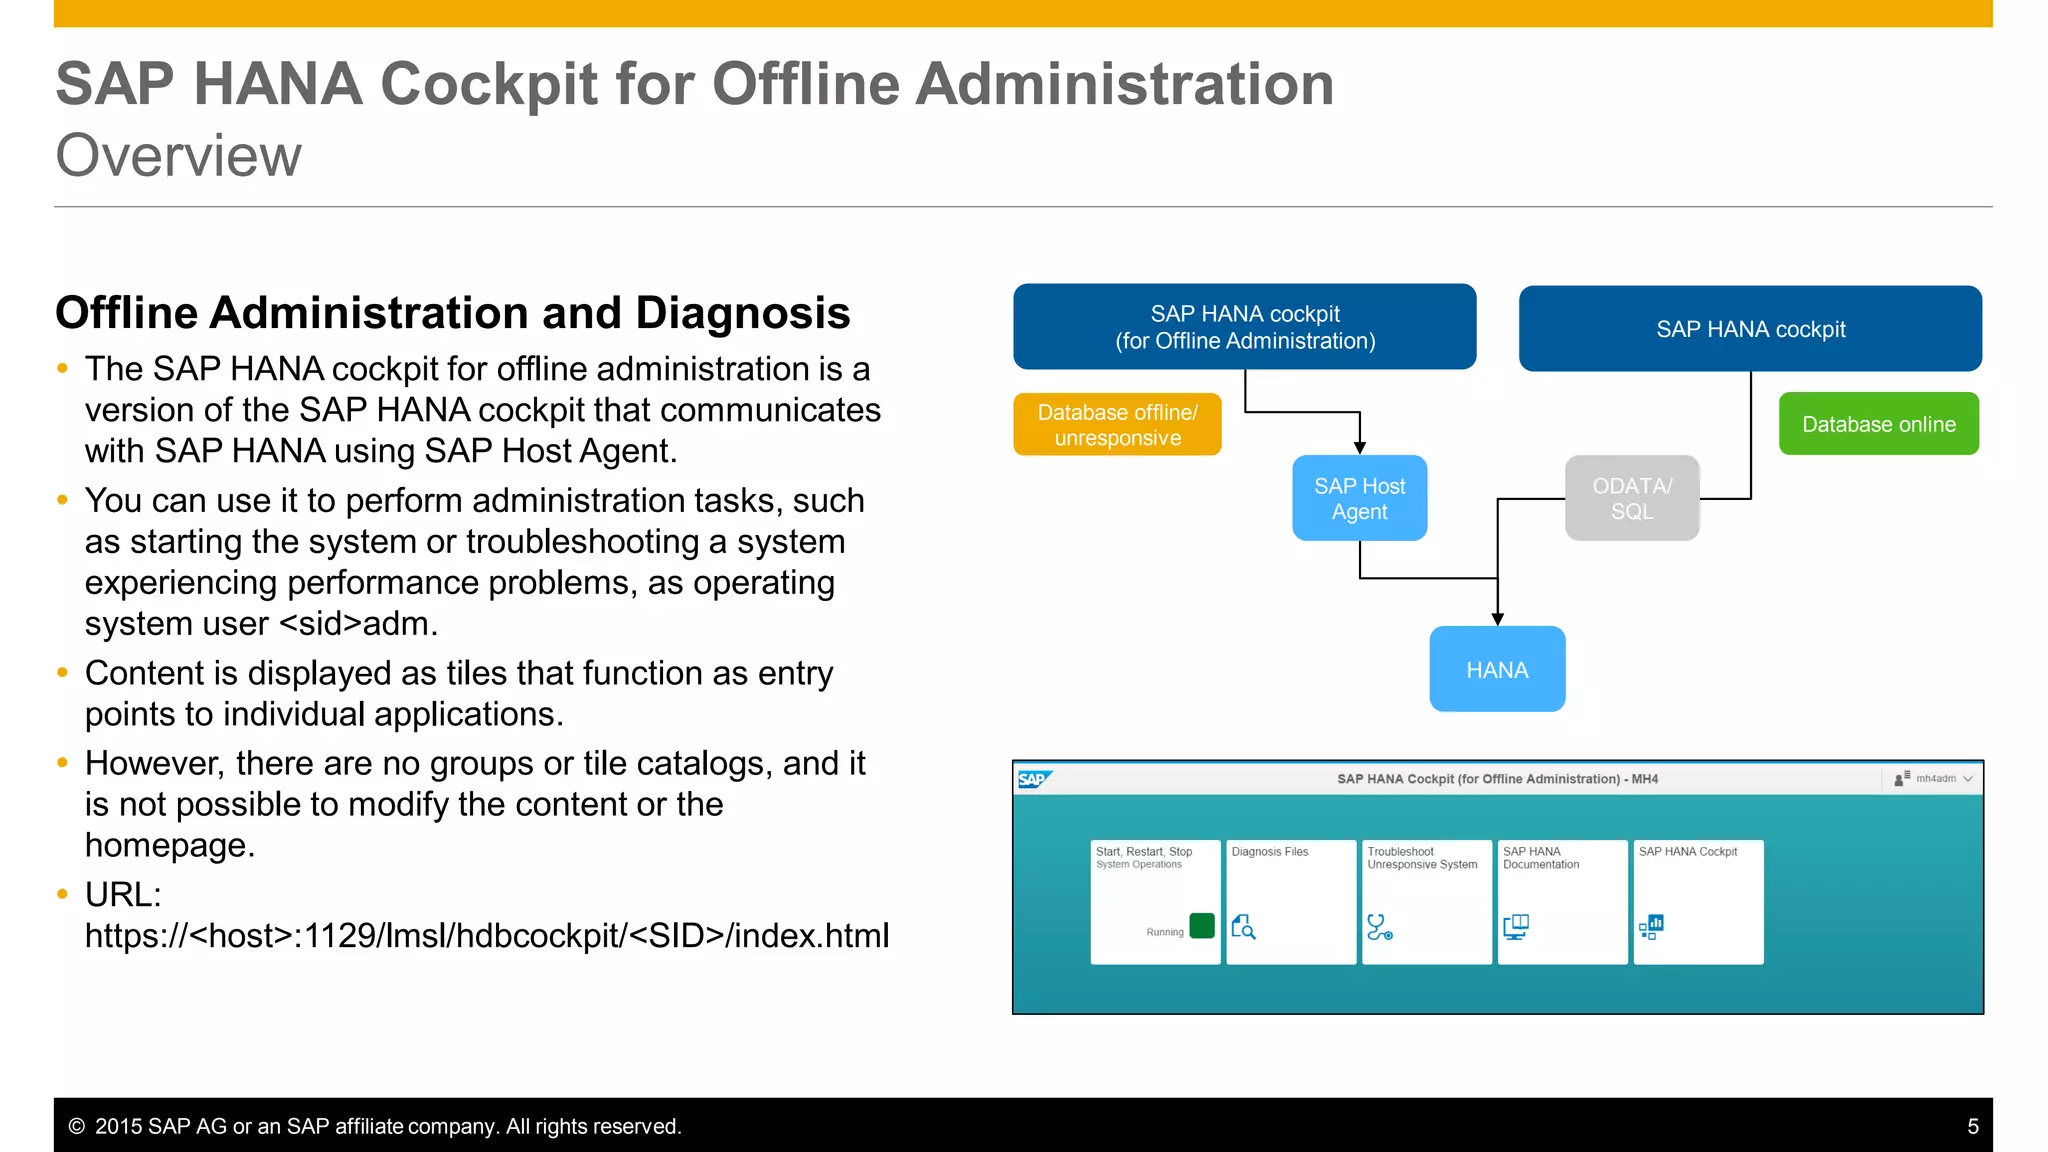
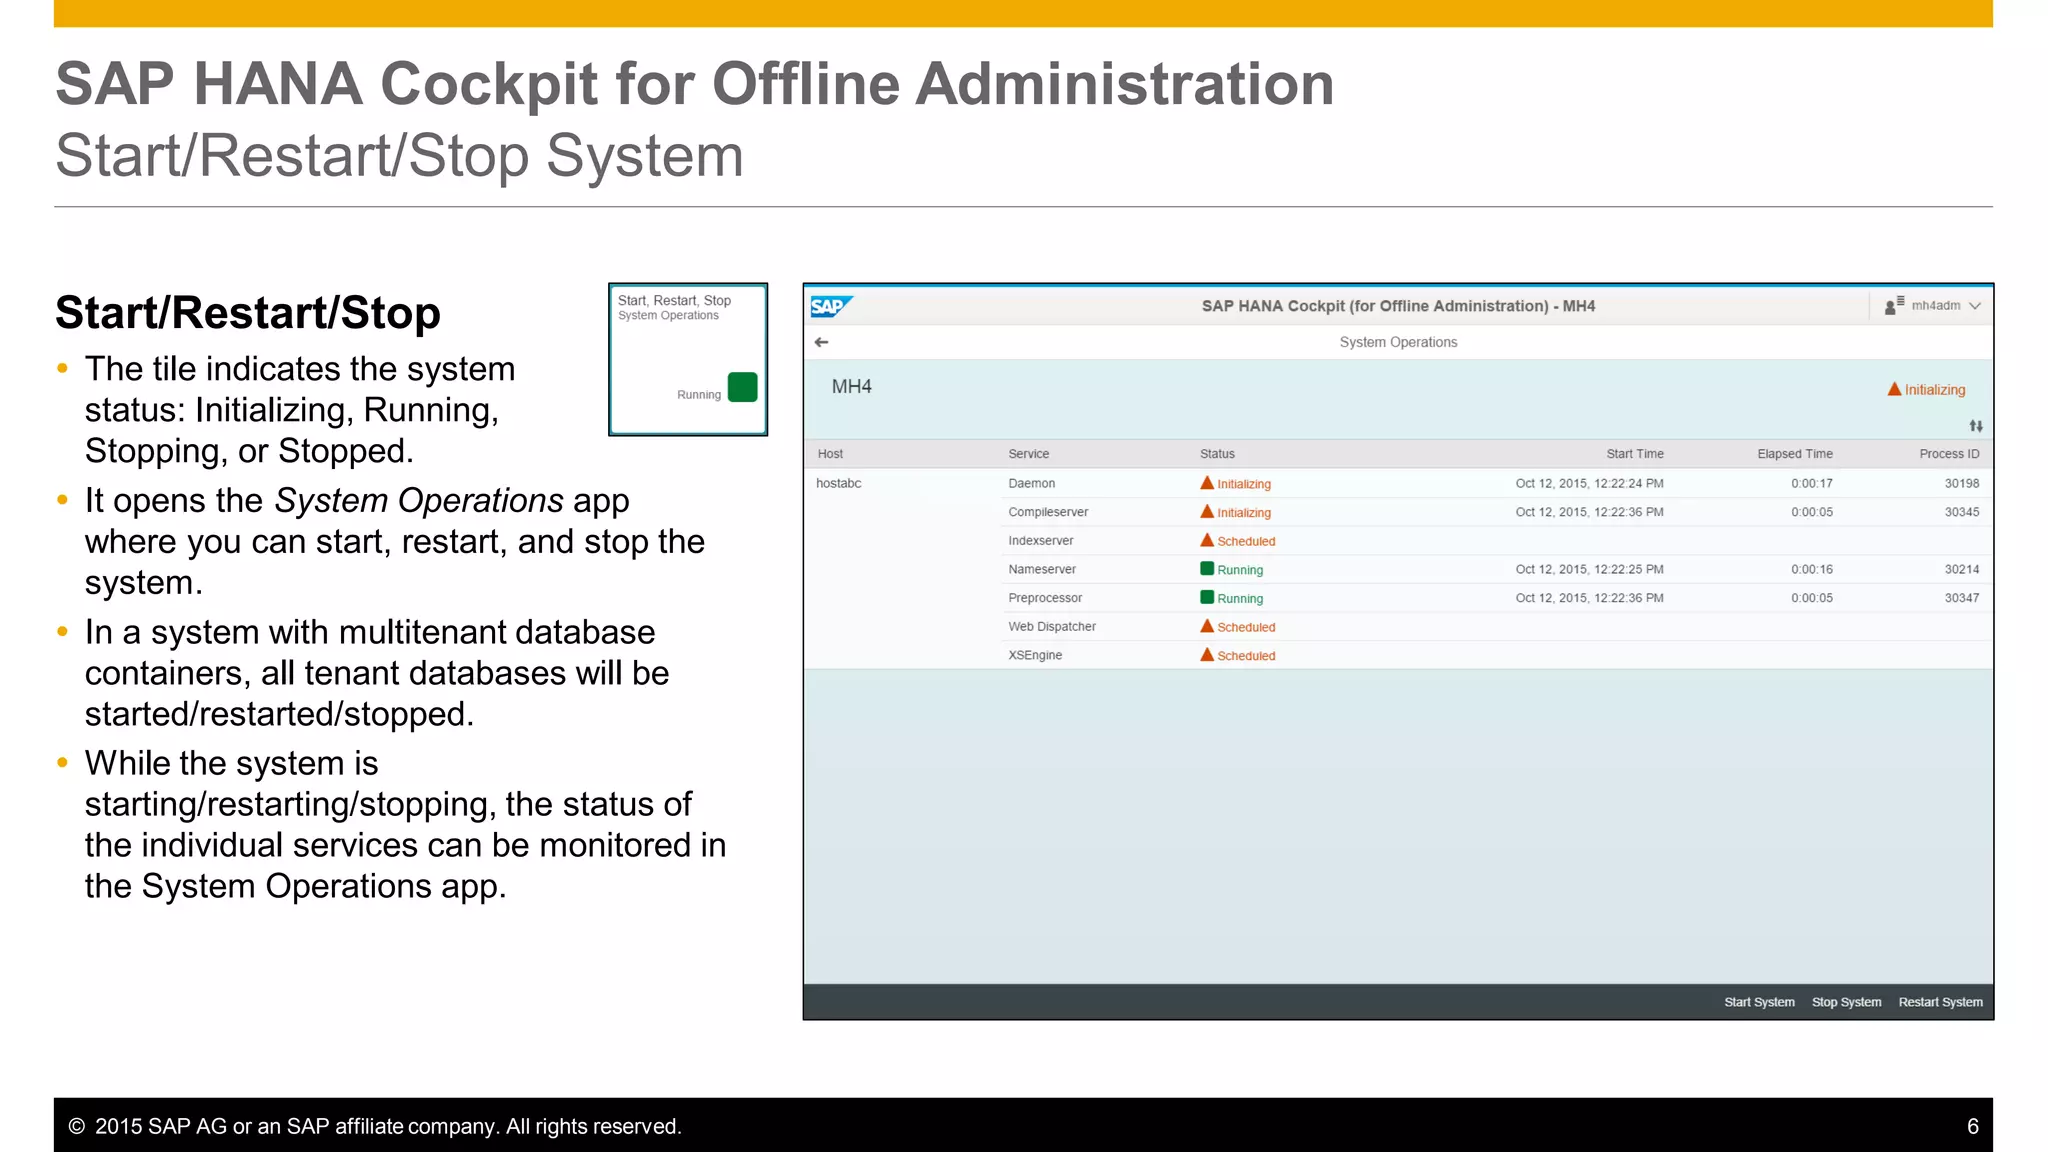
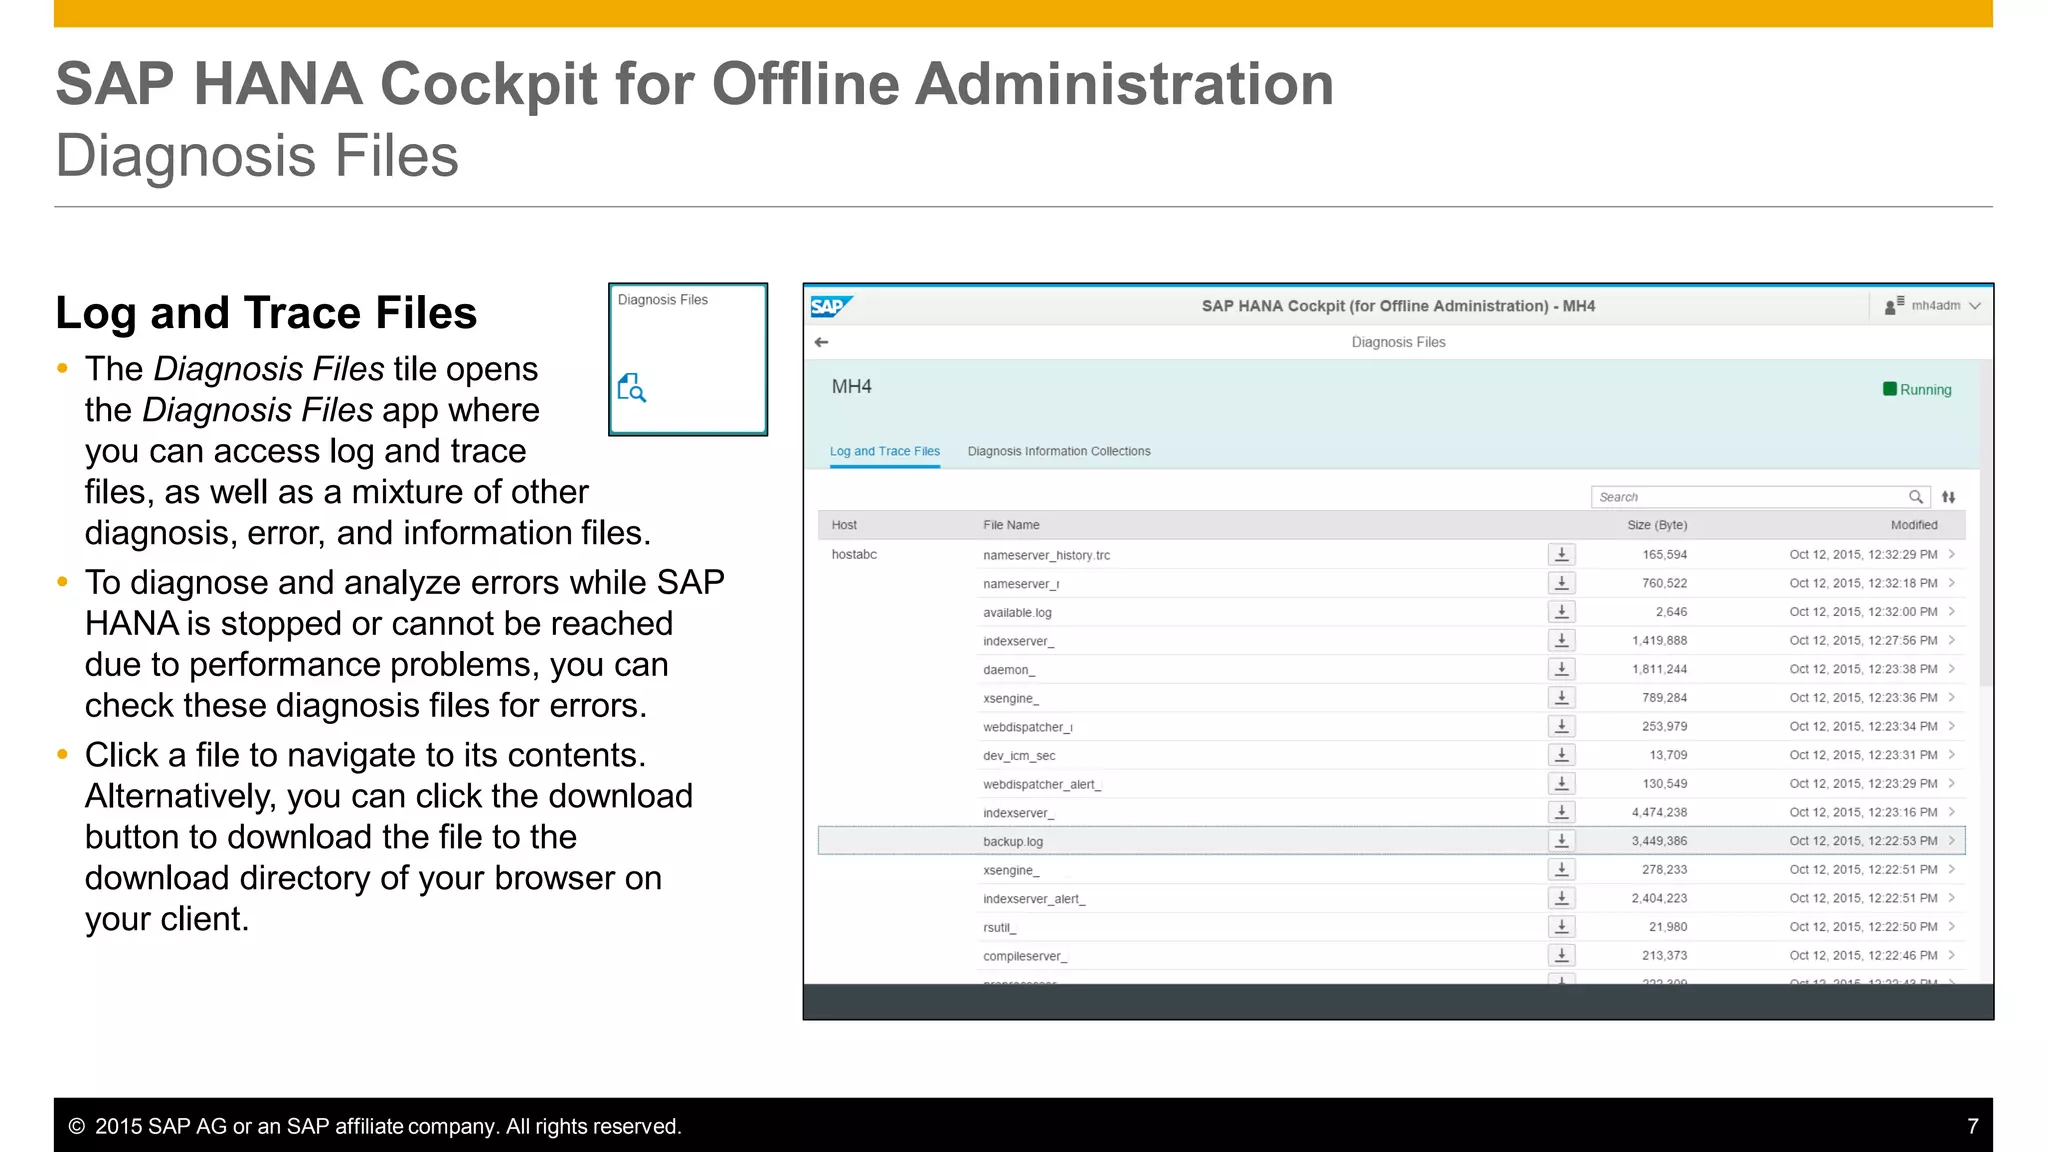
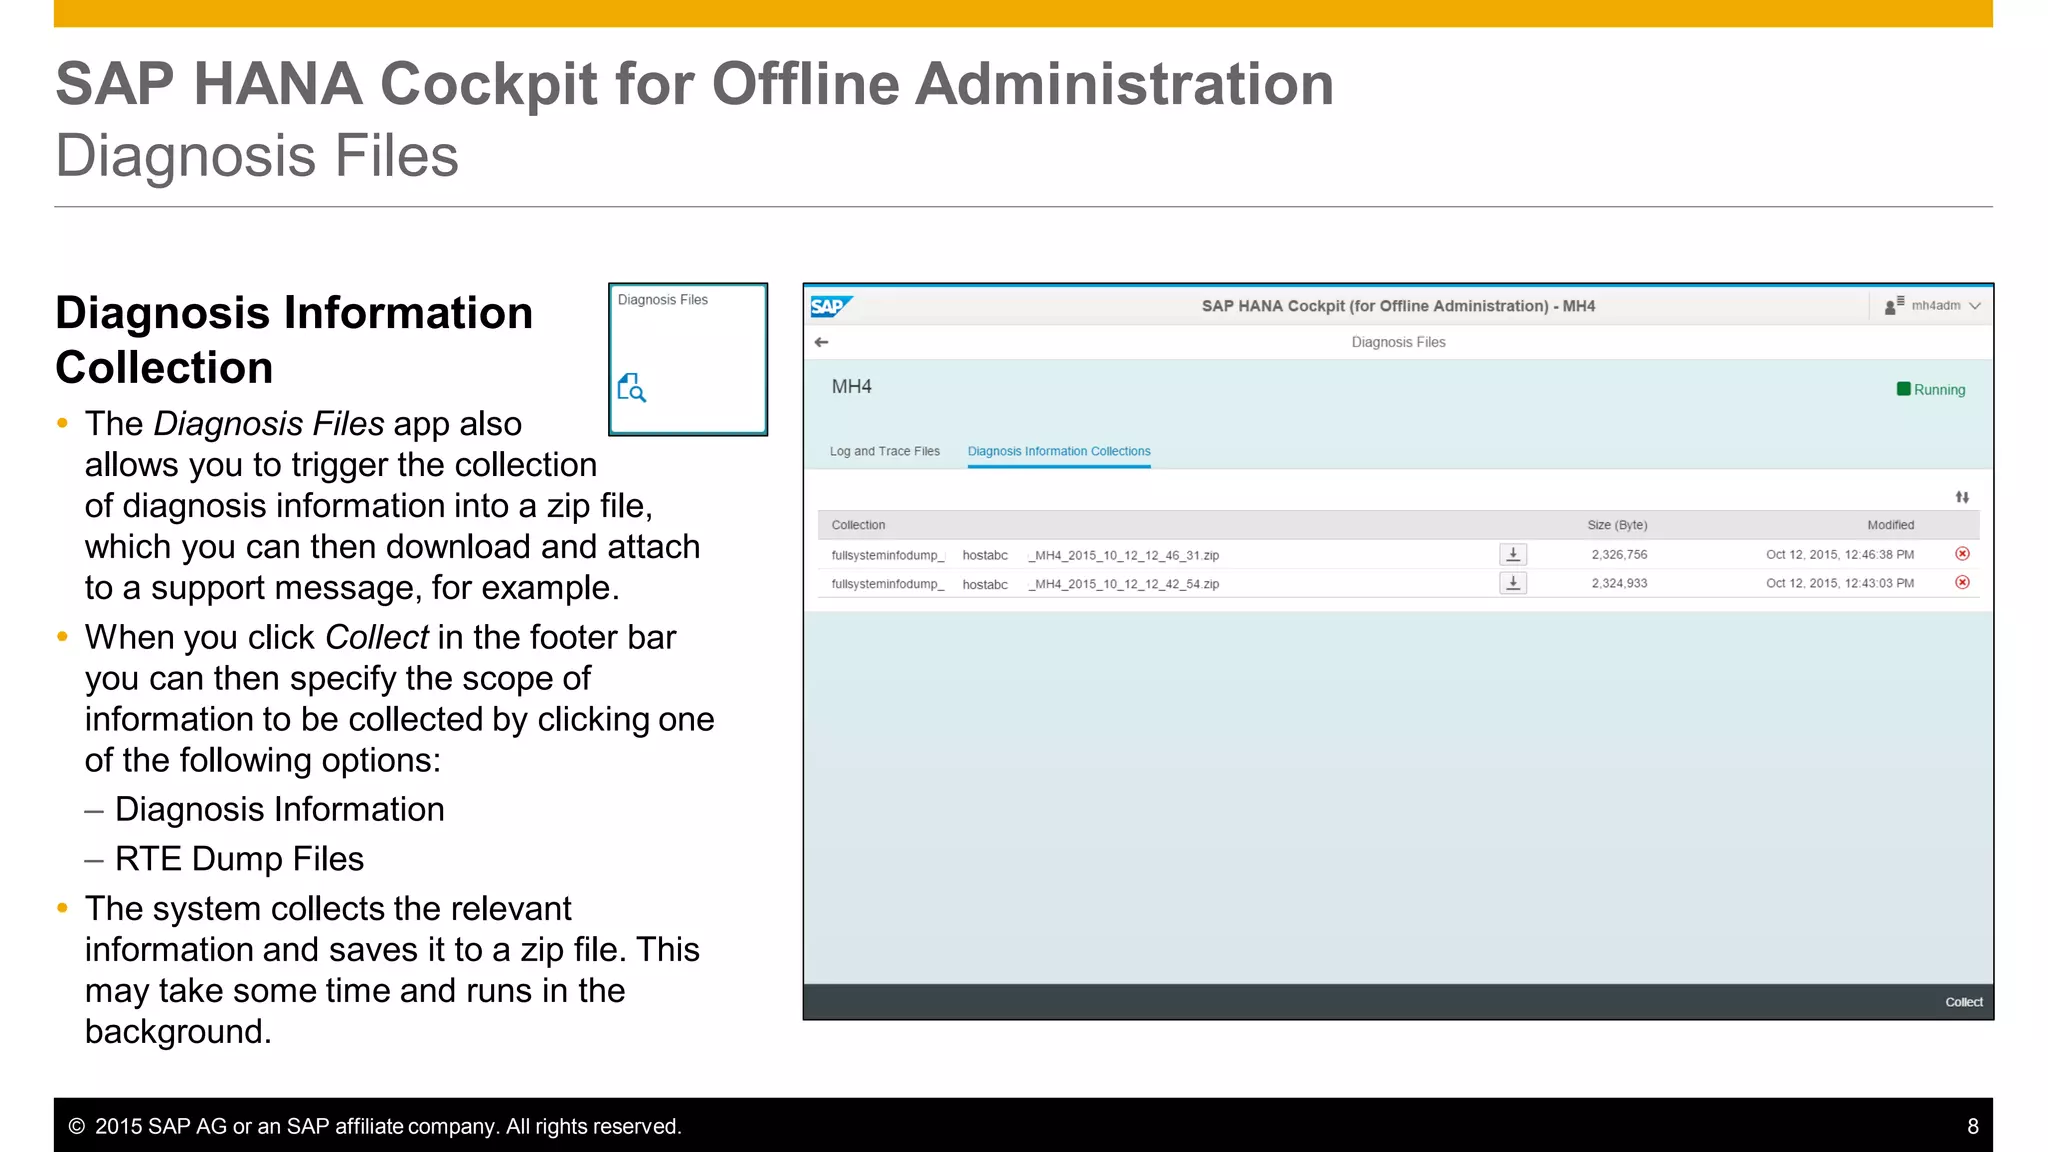
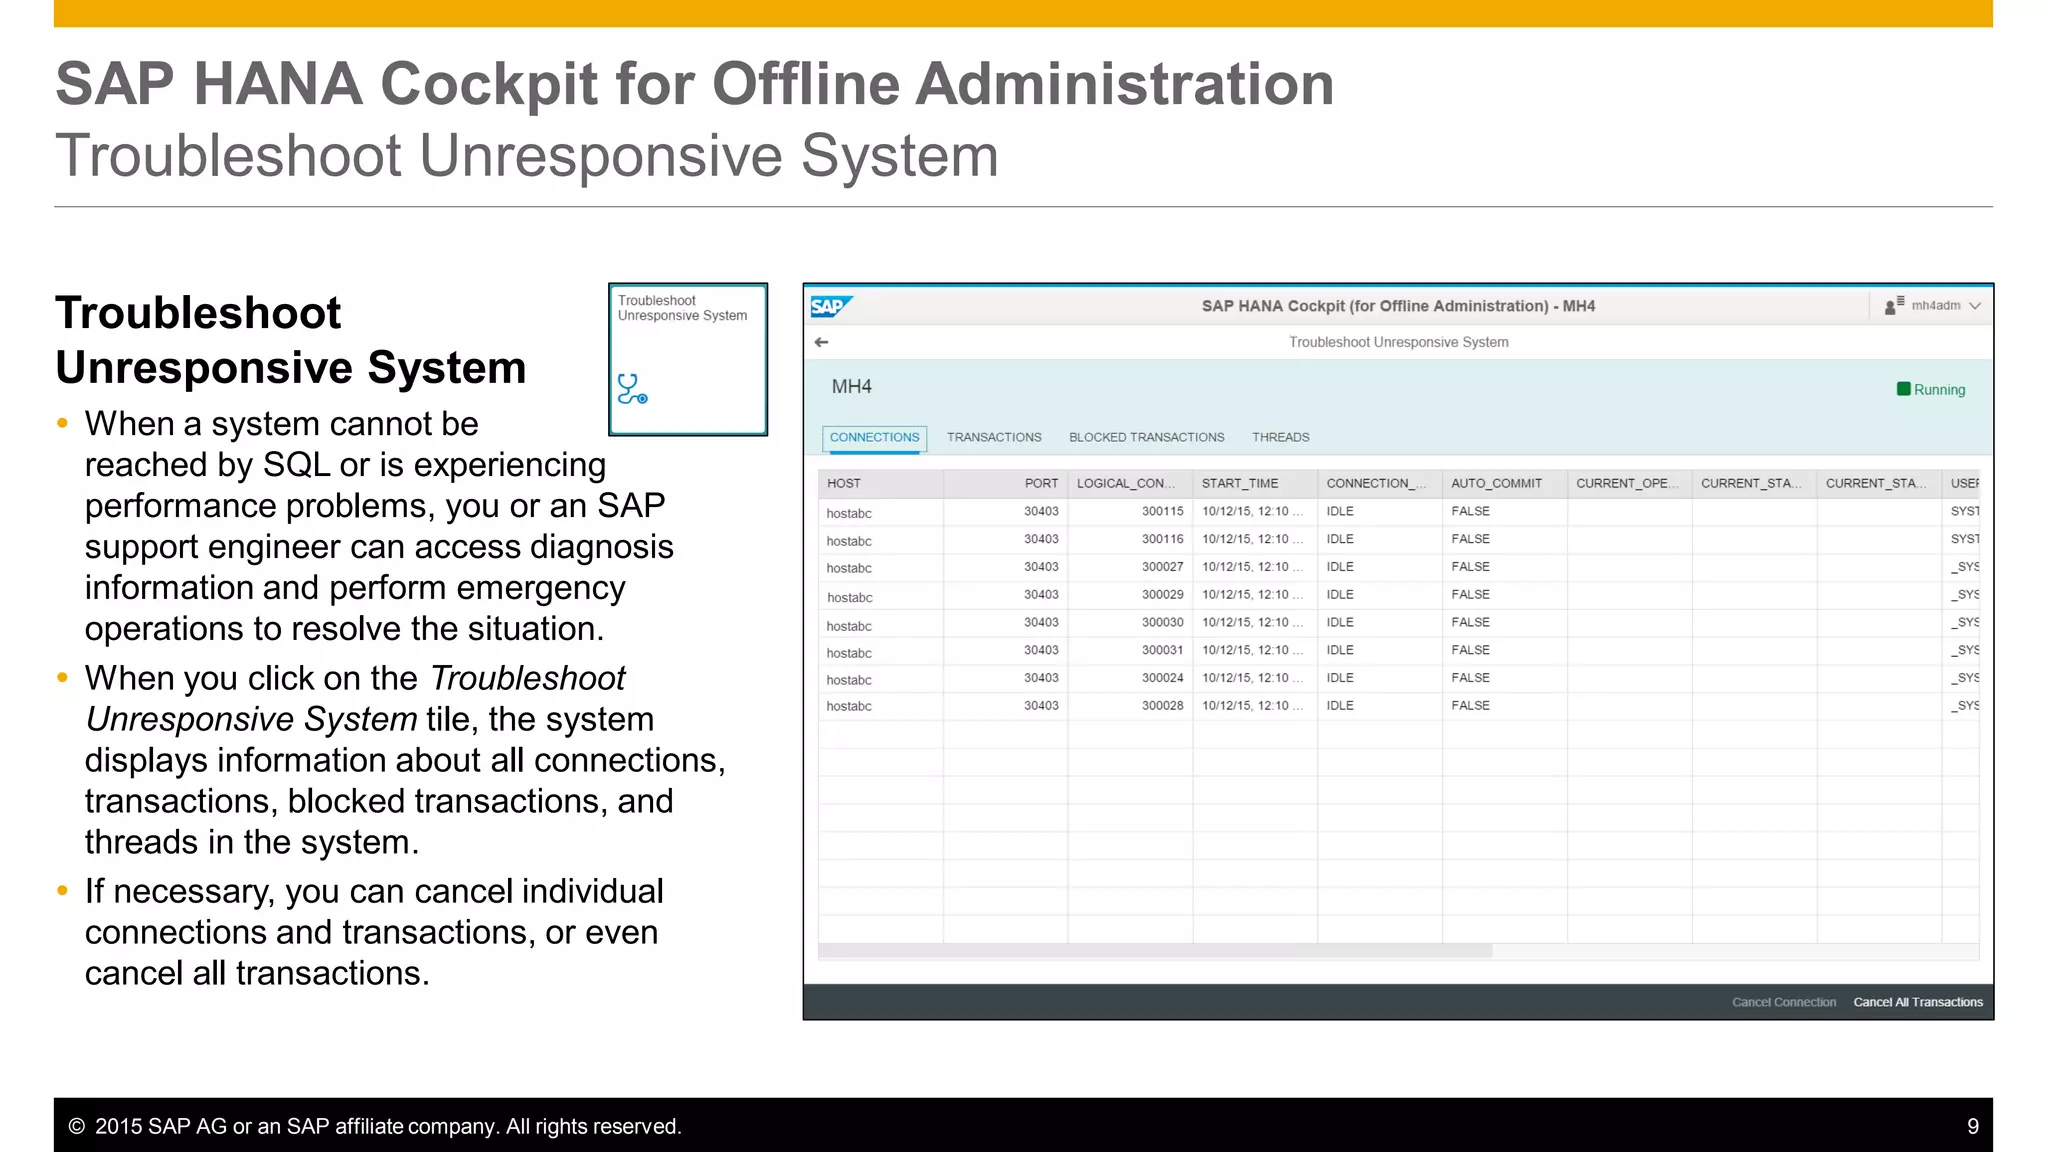
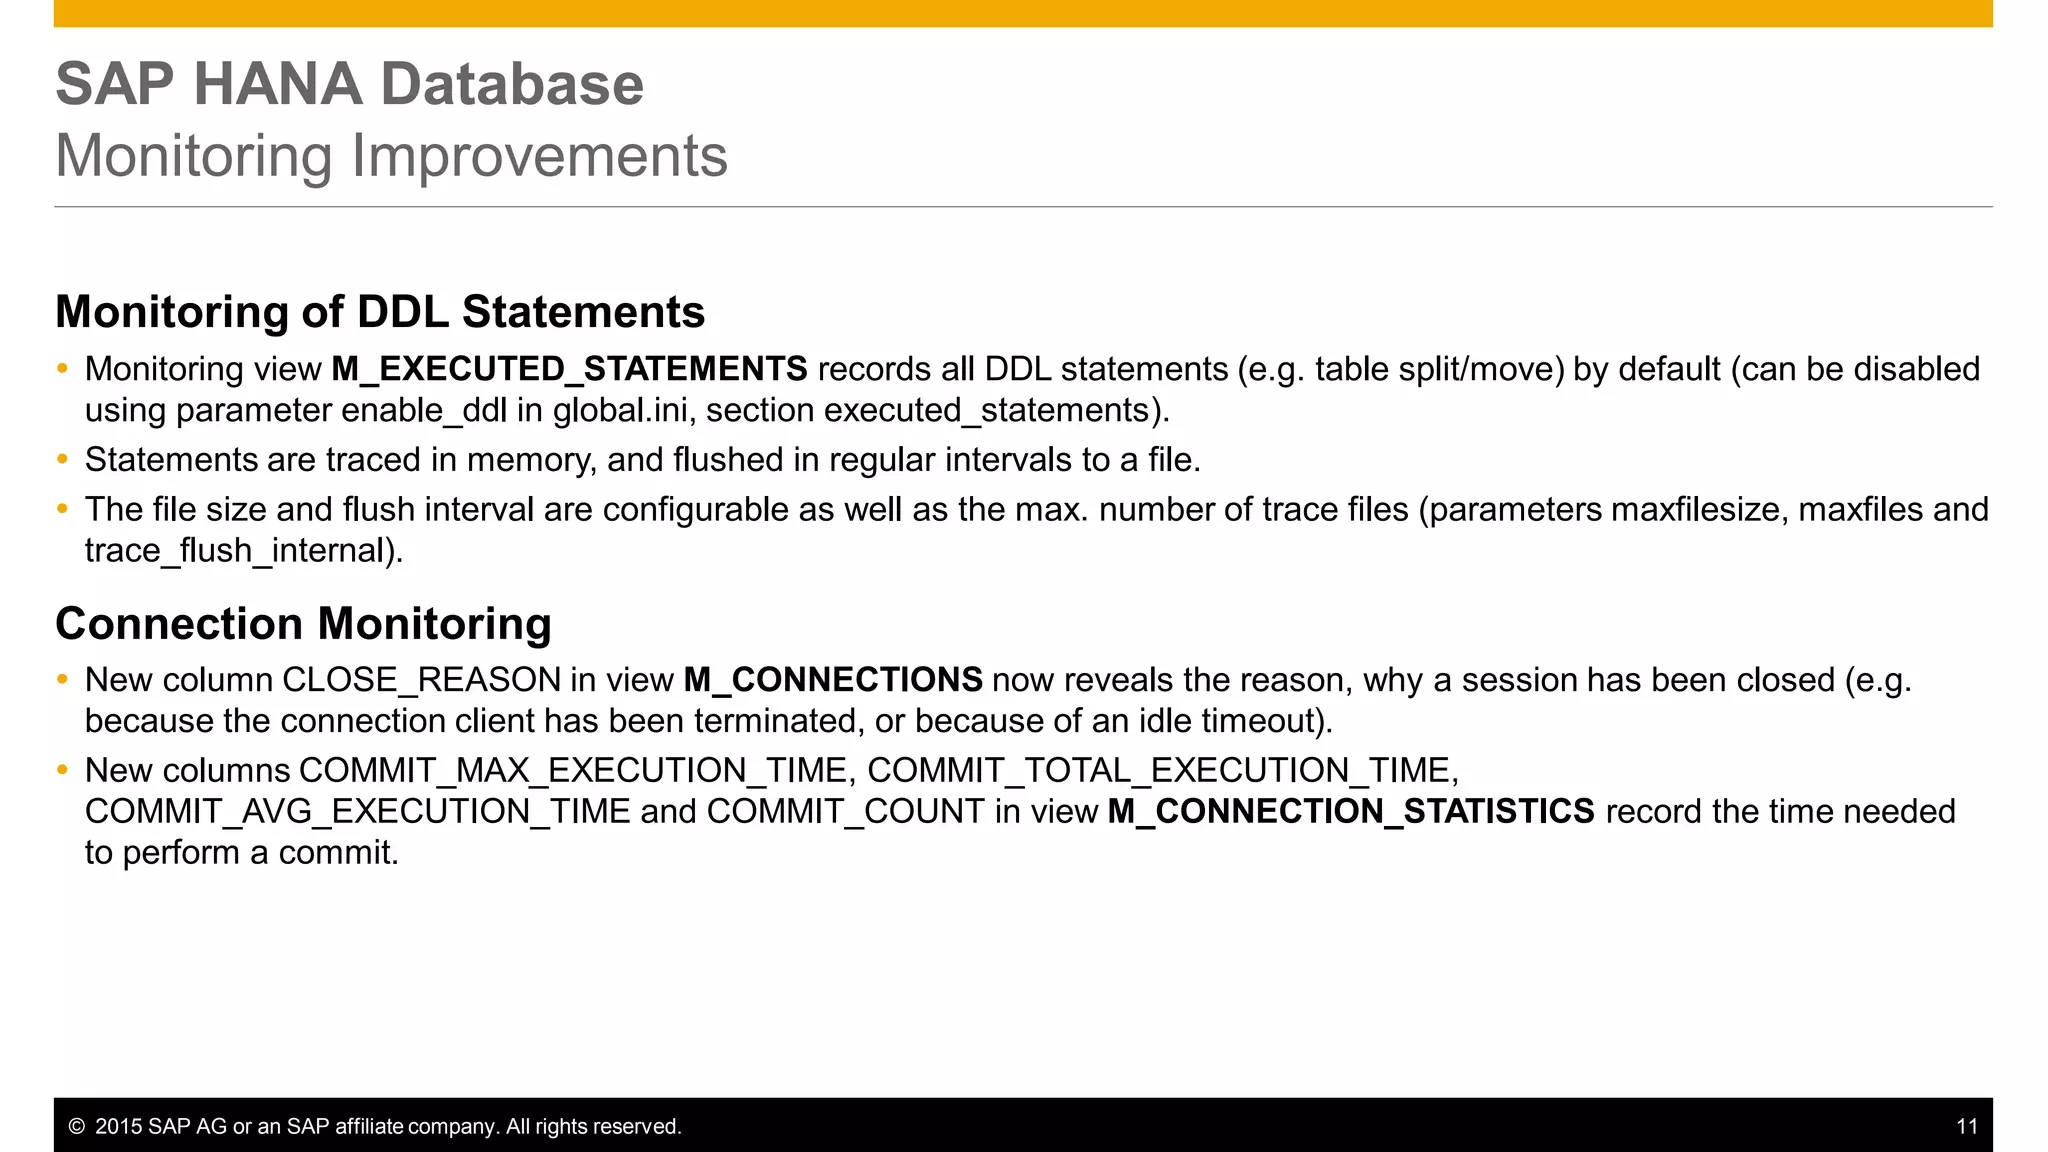
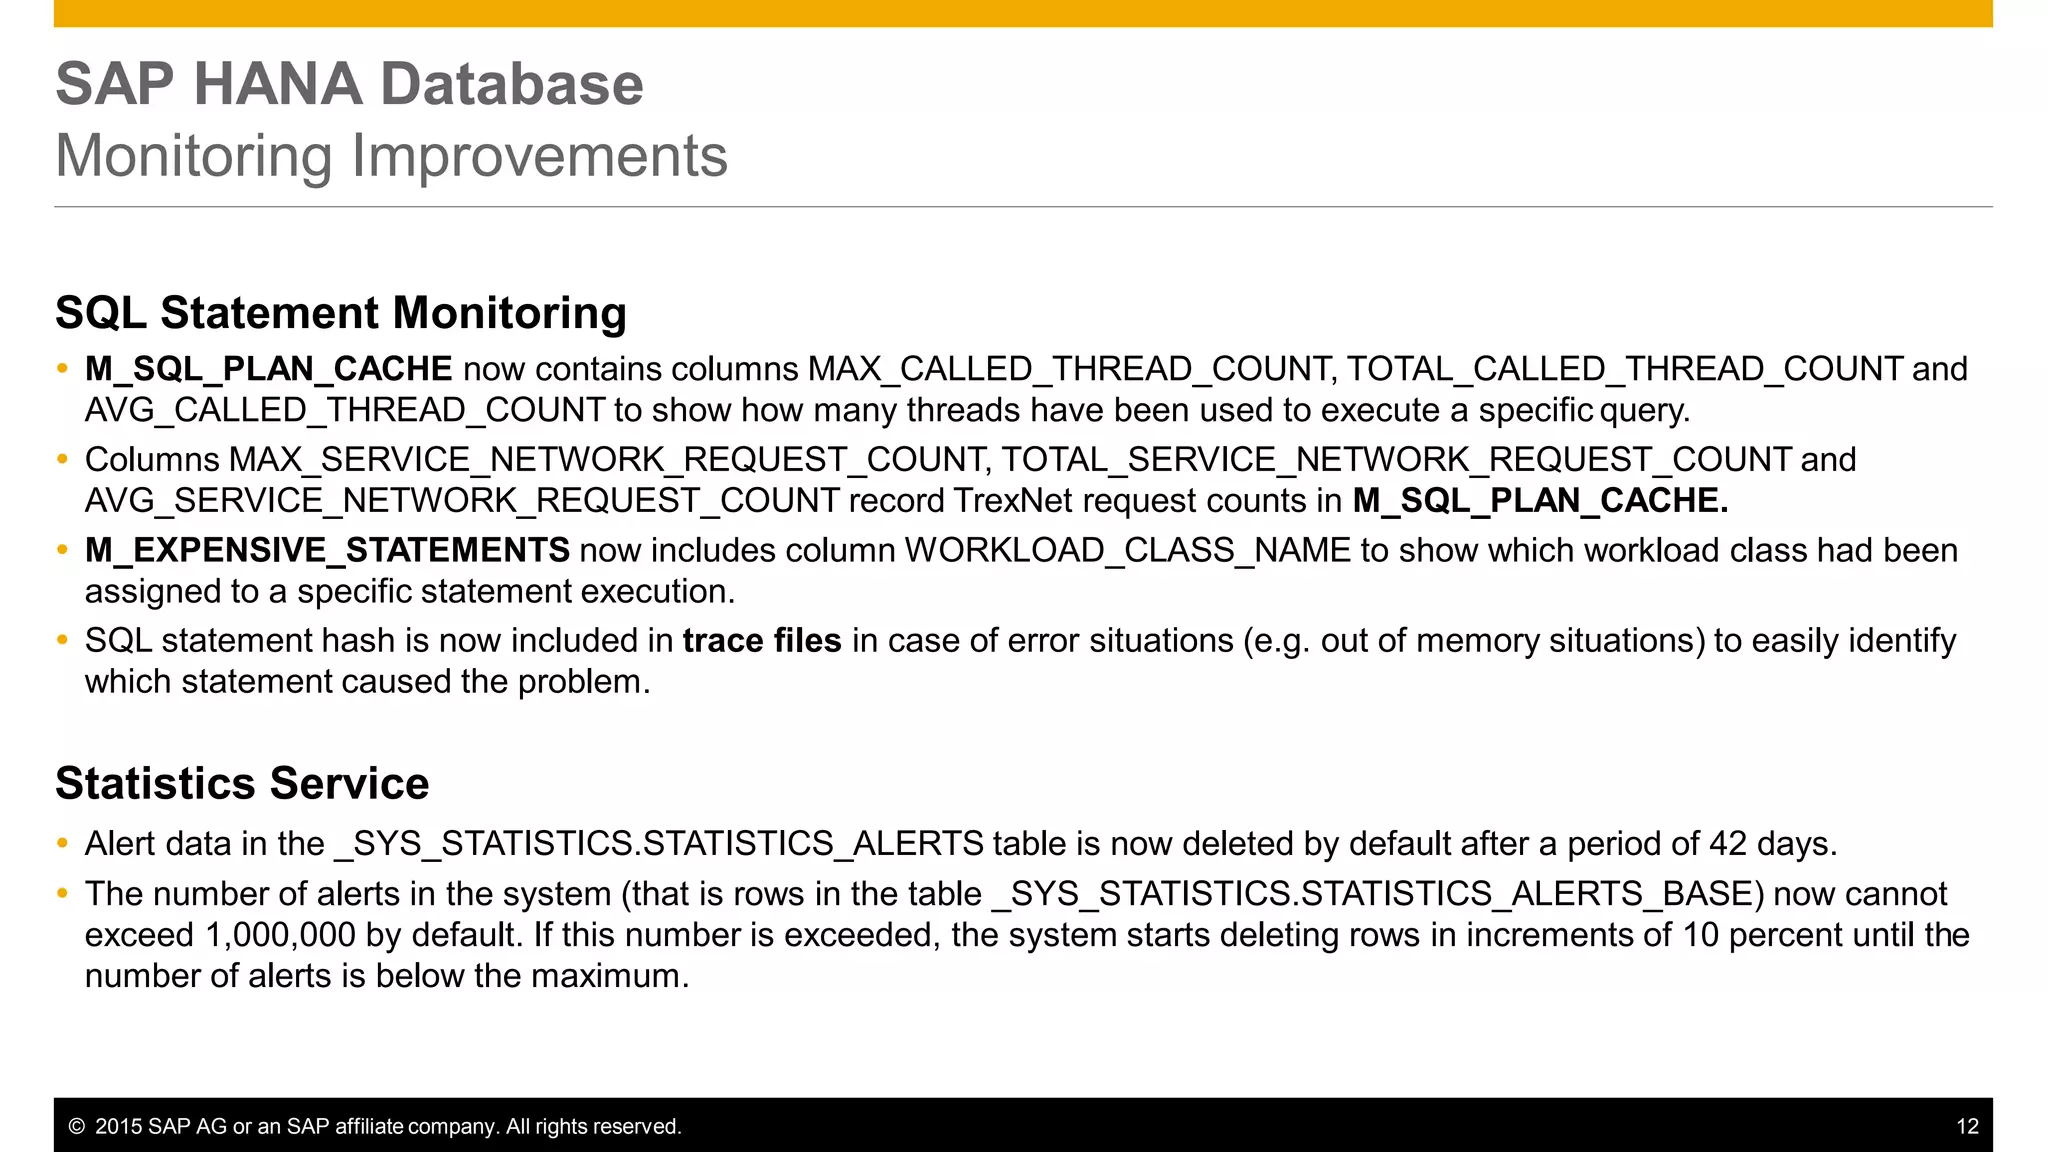


This document summarizes new features in SAP HANA SPS 11, including improvements to administration and monitoring, backup and recovery, high availability, and application lifecycle management. Key highlights include: - The SAP HANA cockpit now allows offline administration and diagnosis of unresponsive systems. - Monitoring has been improved with tracking of DDL statements, connection details, and additional SQL statement metrics. - Statistics alerts are now automatically deleted after 42 days and are capped at 1 million rows.


![[DSC Europe 25] Nikola Rajovic - Hardware Technologies Under the Hood: RISC-V...](https://cdn.slidesharecdn.com/ss_thumbnails/o2gptrmtoyqndgoshwgq-dsc2025-tenstorrent-rajovic-251205090438-814685f5-thumbnail.jpg?width=640&height=640&fit=bounds)

![[DSC Europe 25] Dragan Vucic - Building the Learning Organization - How AI Tr...](https://cdn.slidesharecdn.com/ss_thumbnails/8brigo2sbu6qur6gxrra-7-251205085715-6ae07d24-thumbnail.jpg?width=640&height=640&fit=bounds)


