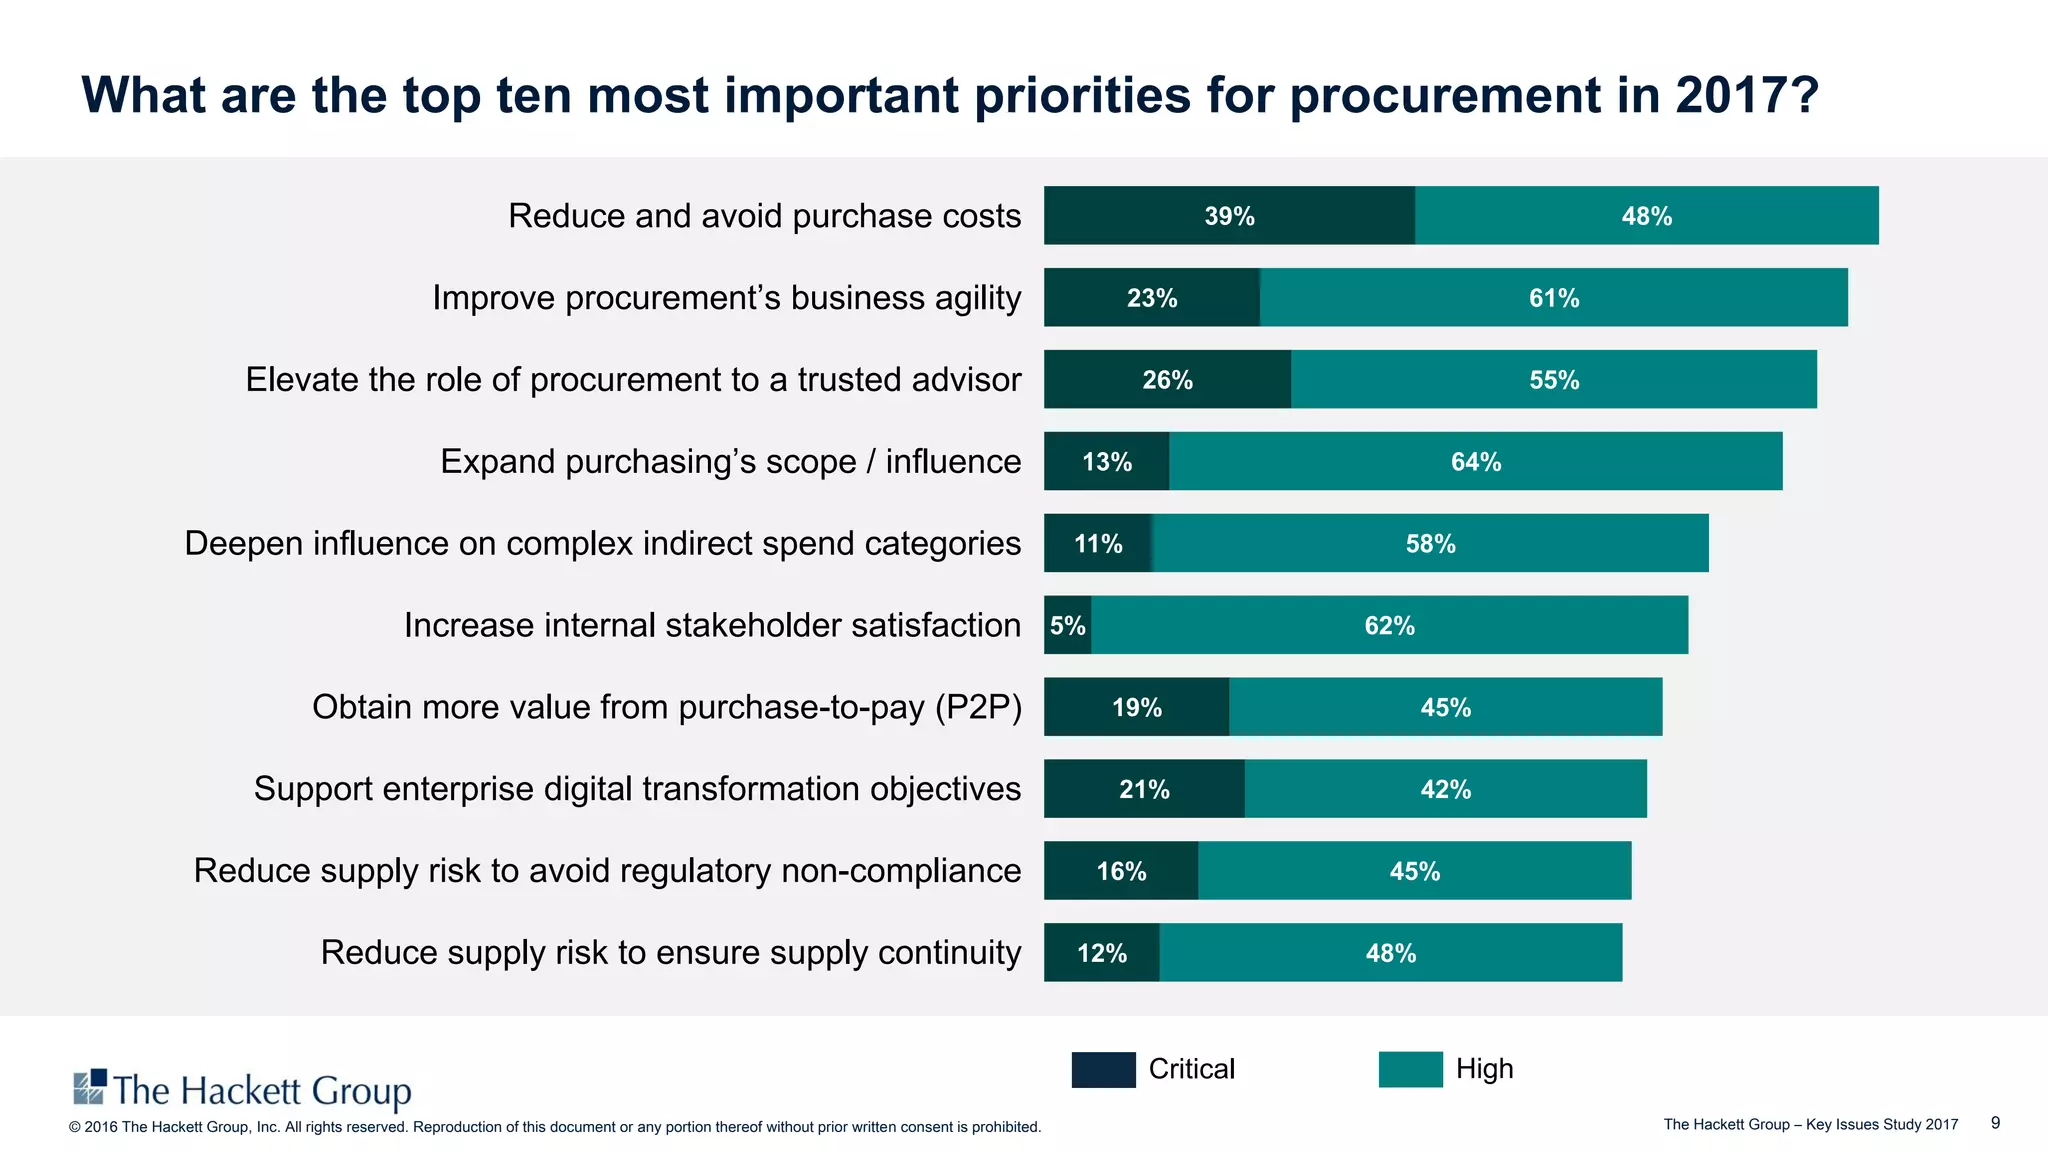
Spend Analysis: What Your Spend Data Is
Telling You and Why It’s Worth Listening
Speakers:
 Kurt Albertson, Principal, Procurement Advisory, The Hackett Group
 Jacob Ingvalson, Director, Strategic Sourcing and Procurement, Aflac
 Simon Hauser, Ph.D., Manager, Spend Analysis, SAP Ariba (SAP)
Moderator:
Sundar Kamak, Vice President, Product and Innovations, SAP Ariba (SAP)
PUBLIC
2PUBLIC© 2017 SAP SE or an SAP affiliate company. All rights reserved. ǀ
Public
Overview and introductions
Panel Presentations
 Kurt Albertson, Principal, Procurement Advisory, The Hackett Group
 Jacob Ingvalson, Director, Strategic Sourcing and Procurement, Aflac
 Simon Hauser, Manager, Spend Analysis, SAP Ariba (SAP)
Open Q&A
Agenda
Overview and Introductions
4PUBLIC© 2017 SAP SE or an SAP affiliate company. All rights reserved. ǀ
Public
Data aggregation
Dashboards and reporting
Traditional business intelligence is just the tip of the iceberg…
Commodity
classifications
Supplier data enrichment
Market insights
and benchmarks
5PUBLIC© 2017 SAP SE or an SAP affiliate company. All rights reserved. ǀ
Public
“Knowing is not enough,
we must apply.
Willing is not enough,
we must do.”
Bruce Lee
6PUBLIC© 2017 SAP SE or an SAP affiliate company. All rights reserved. ǀ
Public
Panelists
Simon Hauser, Ph.D.
Manager, Spend Analysis
SAP Ariba (SAP)
Kurt Albertson
Principal, Procurement Advisory
The Hackett Group
Jacob Ingvalson
Director, Strategic Sourcing and
Procurement
Aflac
Spend Analysis
March 21, 2017
Statement of Confidentiality and Usage Restrictions
This document contains trade secrets and other information that is company sensitive, proprietary, and confidential, the disclosure of which
would provide a competitive advantage to others. As a result, the reproduction, copying, or redistribution of this document or the contents
contained herein, in whole or in part, for any purpose is strictly prohibited without the prior written consent of The Hackett Group.
Copyright © 2017 The Hackett Group, World-Class Defined. All rights reserved.
9© 2016 The Hackett Group, Inc. All rights reserved. Reproduction of this document or any portion thereof without prior written consent is prohibited. The Hackett Group – Key Issues Study 2017
What are the top ten most important priorities for procurement in 2017?
Critical High
39%
23%
26%
13%
11%
5%
19%
21%
16%
12%
48%
61%
55%
64%
58%
62%
45%
42%
45%
48%
Elevate the role of procurement to a trusted advisor
Improve procurement’s business agility
Reduce and avoid purchase costs
Expand purchasing’s scope / influence
Deepen influence on complex indirect spend categories
Increase internal stakeholder satisfaction
Obtain more value from purchase-to-pay (P2P)
Support enterprise digital transformation objectives
Reduce supply risk to avoid regulatory non-compliance
Reduce supply risk to ensure supply continuity
10© 2016 The Hackett Group, Inc. All rights reserved. Reproduction of this document or any portion thereof without prior written consent is prohibited. The Hackett Group – Key Issues Study 2017
In 2017 spend influence continues to be important both from a “quantity” but
also from a “quality” perspective
Savings for stage when
procurement is involved (Quality)
4,57%
2,85%
1,92%
0,61%
0,60%
0,56%
Design / Specification
(Demand Mgmt.)
Supplier Identification Negotiation & Contracting
Cost Reduction Cost Avoidance
3.45%
2.48%
5.18%
Source: The Hackett Group, 2016
85%
77%
68%
100%
95% 93%
Direct Materials Indirect Materials Indirect Services
Procurement Spend
Influence (Quantity)
Peer Group World Class
24% believe greatest
opportunity is here
26% believe greatest
opportunity is here
36% believe opportunity
is across both
11© 2016 The Hackett Group, Inc. All rights reserved. Reproduction of this document or any portion thereof without prior written consent is prohibited. The Hackett Group – Key Issues Study 2017
Spend analysis is a critical enabler of achieving trusted advisor status and
delivering on value objectives
Value Drivers Planned Benefits Actually Benefits
Reduced the amount of time required to complete spend analysis by: 49% 33%
Increased the percentage of total spend being analyzed and reported on by: 49% 34%
Increased the accuracy of spend reporting by: 55% 38%
Identified and reduced non-compliant spend by: 46% 18%
Identified cost savings opportunities leading to additional strategic sourcing
savings of (on average):
37% 15%
Identified opportunities and was able to consolidate the supply base by: 29% 8%
Source: Spend Analysis Poll, The Hackett Group, February 2015
12© 2016 The Hackett Group, Inc. All rights reserved. Reproduction of this document or any portion thereof without prior written consent is prohibited. The Hackett Group – Key Issues Study 2017
“Spend data is widely available globally” was the most important success
factor in successfully managing spend at a global level
7,25% 5,86% 4,00% 3,48%
Global category
strategy
BU / region / large
country
Local / small country Tactical sourcing
Estimated average savings
Source: Global Category Management Study, The Hackett Group, 2016
40% 25% 10% 10%
Global category
strategy
BU / region / large
country
Local / small country Tactical sourcing
Percent of spend
13© 2016 The Hackett Group, Inc. All rights reserved. Reproduction of this document or any portion thereof without prior written consent is prohibited. The Hackett Group – Key Issues Study 2017
Greater granularity from a classification perspective is helpful but should
be viewed by category
35%
35%
41%
47%
47%
53%
53%
53%
59%
59%
Indirect, Sales & Marketing Support
Indirect, Business & Administrative Services
Indirect, General Equipment & Supplies
Direct, Purchased Finished Goods (Resale)
Direct Services
Capital Equipment/Facilities Operations
Indirect, Travel & Entertainment
Indirect, HR Services
Direct, Raw Materials/Packaging/Other
Indirect, IT & Telecommunications
Categories that are classified at a more granular level
Indirect IT & Telecom and Direct Raw Materials are often being measured at a more granular level
than other categories
Source: Spend Analysis Poll, The Hackett Group, February 2015
14© 2016 The Hackett Group, Inc. All rights reserved. Reproduction of this document or any portion thereof without prior written consent is prohibited. The Hackett Group – Key Issues Study 2017
Business case for moving from master family to sub-category
classifications
3%
13%
3%
24%
17%
7%
23%
20%
14%
% reduction in non-compliant / maverick spend % increase in cost savings from strategic sourcing % consolidation in the supply base
Master Family (Ex. Professional Services) Sub-Category (Ex. Exhibit Construction) More granular than sub-category (Ex. Item)
Source: Spend Analysis Poll, The Hackett Group, February 2015
Managed, Influenced & Unmanaged
Reporting in Ariba…
AGENDA
Agenda slides
• Use this slide or choose a test page
from the new page menu
• Use sentence case for section titles
• Make the current section title gray;
use light blue for the other sections
• About Aflac
• Hackett Metrics
• Reporting Journey…
• Questions
16
About Aflac
17
• Aflac is a Fortune 500 company, providing financial protection to more than 50 million people
worldwide. When a policyholder or insured gets sick or hurt, Aflac pays cash benefits fairly,
promptly and directly to the insured.
• For more than six decades, Aflac voluntary insurance policies have given policyholders the
opportunity to focus on recovery, not financial stress.
• Aflac is committed to finding a cure for childhood cancer and has contributed more than
$113MM to the research and treatment of childhood cancer.
Founded by principal founder John Amos, and brothers Paul and Bill Amos
Operate in the US (1955) and Japan (1974)
$22.6 Billion in Revenue (2016)
Hackett Metrics
18
Managed:
• Spend that was actually sourced by SS&P consistent with Aflac’s Procurement Policy.
Influenced:
• Spend in which SS&P had some influence. This may include spend that was not sourced by
SS&P but where SS&P was involved late. For example, participated in contract and price
negotiations? Reduced risk? Reduced or avoided cost?
Unmanaged:
• Spend that does not fit either of the two other categories.
Reporting Journey…
19
Impact:
• Manual
• Monthly or Quarterly, After the Fact
• Multiple Sources (MS Office & SAP Ariba
solutions)
• Time Consuming/Prone to Error
Process:
1. Monthly or Quarterly, Managers review spend in an
Excel file spend and tag it as "Managed" or
"Influenced" or "Unmanaged" or "Unaddressable".
2. These indicators are then loaded into SAP Ariba
Spend Visibility.
Process:
1. As created, mark each SAP Ariba contract
workspace with the Spend Indicator.
2. As created, mark each SAP Ariba purchase
requisition with the Spend Indicator.
3. Push the Spend Indicator into SAP.
4. Push the Spend Indicator into SAP Ariba Spend
Visibility
Impact:
• Automated
• Real Time
• Single Source of Truth
• Efficient
Current Future
20
Reporting Journey…
Thank You!
21
March 23, 2017
Simon Hauser, Ph.D., SAP Ariba (SAP)
Spend Analysis: Run at Your Best and
Make Adoption Work
23PUBLIC© 2017 SAP SE or an SAP affiliate company. All rights reserved. ǀ
Public
User Adoption – What We Have Learned
Best Practices Evolution
Services Update
Open Q&A
Agenda
User Adoption What We Have Learned
25PUBLIC© 2017 SAP SE or an SAP affiliate company. All rights reserved. ǀ
Public
“Where is the data coming from?”
“Can I trust the data?”
“Why should I use this tool?”
“How do I identify opportunities and areas
for improvement?”
“How do I build the reports I need?”
“What is the data telling me?”
Deploying spend analysis raises
questions
26PUBLIC© 2017 SAP SE or an SAP affiliate company. All rights reserved. ǀ
Public
 Ability to articulate business case for SAP
Ariba Spend Analysis
 Single point of contact for end users
 Advanced user of SAP Ariba Spend
Analysis – train end users
 Coordination with SAP Ariba solution
deployment lead and internal
stakeholders on
– Custom reports and dashboard content
– Announcements, recent successes
– Communication of enrichment availability
Make adoption work
Let superusers lead the way
27PUBLIC© 2017 SAP SE or an SAP affiliate company. All rights reserved. ǀ
Public
 Trust in data and classification are essential
for user adoption!
 Regularly review commodity classifications
with predefined timeline
 Create refinement report to focus enrichment
review on newly loaded data
 Consolidate approach via online ECR
(enrichment change request) feature or bulk
upload
 Implement source system data
improvements to further enhance enrichment
outcomes
Make adoption work
Data improvement
28PUBLIC© 2017 SAP SE or an SAP affiliate company. All rights reserved. ǀ
Public
 A custom taxonomy allows you to
translate the classification taxonomy for
SAP Ariba solutions to suit your end users
 Structure custom taxonomy based on
products/services to execute on initiatives
such as strategic sourcing, maverick
spend management, and rebate programs
 Build taxonomy at a deeper level to
support direct spend vs. indirect
 Minimize M:1 relationships, work toward a
1:1 mapping with the classification
taxonomy to preserve granularity
Make adoption work
Custom taxonomy
29PUBLIC© 2017 SAP SE or an SAP affiliate company. All rights reserved. ǀ
Public
 Keep dashboards and reports focused on
key user groups
 Get easy access to predefined content
 Leverage announcement/news section for
project successes, milestones, timeline
 Integrate compound reports to give 360-
degree view of suppliers and commodities
 House relevant documents on dashboard
(cheat sheets, presentations, and more)
Make adoption work – dashboards and reports
Best Practices Evolution
31PUBLIC© 2017 SAP SE or an SAP affiliate company. All rights reserved. ǀ
Public
SAP Ariba Best Practices Center
 Managed project available to all SAP Ariba Spend Analysis
customers to increase solution adoption and ROI after go-live
 Best practices center offerings include:
 Custom taxonomy support
 Jump start
 User guide
 Operational reporting (group dashboards, advanced reporting, Microsoft Excel
templates)
 Significant growth in customers taking advantage of this service
over the last few years
32PUBLIC© 2017 SAP SE or an SAP affiliate company. All rights reserved. ǀ
Public
SAP Ariba Spend Analysis – best practices center projects by year
*As of Q1 2017
*
Services Update
34PUBLIC© 2017 SAP SE or an SAP affiliate company. All rights reserved. ǀ
Public
Services update
 Growing global team of deployment leads supporting multiple languages and time zones
 New solutions: SAP Ariba Supplier Risk and master data cleansing service for SAP Ariba
solutions
 Continue to invest in strategic and consultative skill development for the team
 Ongoing innovation around new service offerings based on what customers are telling us.
Some possible innovations include:
 Data extraction services
 On-site workshops to accelerate deployment
 Additional consulting offerings (adoption focus/goal tracking)
 Data improvement in analysis
Other current focus areas include
 Partnership with 3rd party provider to help with savings realization – currently running pilot program
 Replacement of category experience data in SAP Ariba solutions
35PUBLIC© 2017 SAP SE or an SAP affiliate company. All rights reserved. ǀ
Public
Summary
• Enable superusers to support your end users
• Gain trustworthy data thanks to ongoing refinement
• Implement a custom taxonomy structured to support sourcing and effective spend
management
• Enjoy easy access and group-relevant dashboard content
• Take advantage of the best practices center
• Look for new service offerings and additional content forthcoming in H2 2017
Thank you.
Kurt Albertson
Principal, Procurement Advisory,
The Hackett Group
kalbertson@thehackettgroup.com
Jacob Ingvalson
Director,
Strategic Sourcing and
Procurement, Aflac
jingvalson@aflac.com
Simon Hauser, Ph.D.
Manager, Spend Analysis
simon.hauser@sap.com
Sundar Kamak
Vice President, Product
and Innovations, SAP Ariba
(SAP)
Sundar.kamak@sap.com
Contact Information
No part of this publication may be reproduced or transmitted in any form or for any purpose without the express permission of SAP SE or an SAP affiliate company.
The information contained herein may be changed without prior notice. Some software products marketed by SAP SE and its distributors contain proprietary software components
of other software vendors. National product specifications may vary.
These materials are provided by SAP SE or an SAP affiliate company for informational purposes only, without representation or warranty of any kind, and SAP or its affiliated
companies shall not be liable for errors or omissions with respect to the materials. The only warranties for SAP or SAP affiliate company products and services are those that are
set forth in the express warranty statements accompanying such products and services, if any. Nothing herein should be construed as constituting an additional warranty.
In particular, SAP SE or its affiliated companies have no obligation to pursue any course of business outlined in this document or any related presentation, or to develop or release
any functionality mentioned therein. This document, or any related presentation, and SAP SE’s or its affiliated companies’ strategy and possible future developments, products,
and/or platform directions and functionality are all subject to change and may be changed by SAP SE or its affiliated companies at any time for any reason without notice. The
information in this document is not a commitment, promise, or legal obligation to deliver any material, code, or functionality. All forward-looking statements are subject to various
risks and uncertainties that could cause actual results to differ materially from expectations. Readers are cautioned not to place undue reliance on these forward-looking statements,
and they should not be relied upon in making purchasing decisions.
SAP and other SAP products and services mentioned herein as well as their respective logos are trademarks or registered trademarks of SAP SE (or an SAP affiliate company)
in Germany and other countries. All other product and service names mentioned are the trademarks of their respective companies.
See http://global.sap.com/corporate-en/legal/copyright/index.epx for additional trademark information and notices.
© 2017 SAP SE or an SAP affiliate company. All rights reserved.

What Your Spend Data Is Telling You and Why It’s Worth Listening

  • 1.
    Spend Analysis: WhatYour Spend Data Is Telling You and Why It’s Worth Listening Speakers:  Kurt Albertson, Principal, Procurement Advisory, The Hackett Group  Jacob Ingvalson, Director, Strategic Sourcing and Procurement, Aflac  Simon Hauser, Ph.D., Manager, Spend Analysis, SAP Ariba (SAP) Moderator: Sundar Kamak, Vice President, Product and Innovations, SAP Ariba (SAP) PUBLIC
  • 2.
    2PUBLIC© 2017 SAPSE or an SAP affiliate company. All rights reserved. ǀ Public Overview and introductions Panel Presentations  Kurt Albertson, Principal, Procurement Advisory, The Hackett Group  Jacob Ingvalson, Director, Strategic Sourcing and Procurement, Aflac  Simon Hauser, Manager, Spend Analysis, SAP Ariba (SAP) Open Q&A Agenda
  • 3.
  • 4.
    4PUBLIC© 2017 SAPSE or an SAP affiliate company. All rights reserved. ǀ Public Data aggregation Dashboards and reporting Traditional business intelligence is just the tip of the iceberg… Commodity classifications Supplier data enrichment Market insights and benchmarks
  • 5.
    5PUBLIC© 2017 SAPSE or an SAP affiliate company. All rights reserved. ǀ Public “Knowing is not enough, we must apply. Willing is not enough, we must do.” Bruce Lee
  • 6.
    6PUBLIC© 2017 SAPSE or an SAP affiliate company. All rights reserved. ǀ Public Panelists Simon Hauser, Ph.D. Manager, Spend Analysis SAP Ariba (SAP) Kurt Albertson Principal, Procurement Advisory The Hackett Group Jacob Ingvalson Director, Strategic Sourcing and Procurement Aflac
  • 7.
  • 8.
    Statement of Confidentialityand Usage Restrictions This document contains trade secrets and other information that is company sensitive, proprietary, and confidential, the disclosure of which would provide a competitive advantage to others. As a result, the reproduction, copying, or redistribution of this document or the contents contained herein, in whole or in part, for any purpose is strictly prohibited without the prior written consent of The Hackett Group. Copyright © 2017 The Hackett Group, World-Class Defined. All rights reserved.
  • 9.
    9© 2016 TheHackett Group, Inc. All rights reserved. Reproduction of this document or any portion thereof without prior written consent is prohibited. The Hackett Group – Key Issues Study 2017 What are the top ten most important priorities for procurement in 2017? Critical High 39% 23% 26% 13% 11% 5% 19% 21% 16% 12% 48% 61% 55% 64% 58% 62% 45% 42% 45% 48% Elevate the role of procurement to a trusted advisor Improve procurement’s business agility Reduce and avoid purchase costs Expand purchasing’s scope / influence Deepen influence on complex indirect spend categories Increase internal stakeholder satisfaction Obtain more value from purchase-to-pay (P2P) Support enterprise digital transformation objectives Reduce supply risk to avoid regulatory non-compliance Reduce supply risk to ensure supply continuity
  • 10.
    10© 2016 TheHackett Group, Inc. All rights reserved. Reproduction of this document or any portion thereof without prior written consent is prohibited. The Hackett Group – Key Issues Study 2017 In 2017 spend influence continues to be important both from a “quantity” but also from a “quality” perspective Savings for stage when procurement is involved (Quality) 4,57% 2,85% 1,92% 0,61% 0,60% 0,56% Design / Specification (Demand Mgmt.) Supplier Identification Negotiation & Contracting Cost Reduction Cost Avoidance 3.45% 2.48% 5.18% Source: The Hackett Group, 2016 85% 77% 68% 100% 95% 93% Direct Materials Indirect Materials Indirect Services Procurement Spend Influence (Quantity) Peer Group World Class 24% believe greatest opportunity is here 26% believe greatest opportunity is here 36% believe opportunity is across both
  • 11.
    11© 2016 TheHackett Group, Inc. All rights reserved. Reproduction of this document or any portion thereof without prior written consent is prohibited. The Hackett Group – Key Issues Study 2017 Spend analysis is a critical enabler of achieving trusted advisor status and delivering on value objectives Value Drivers Planned Benefits Actually Benefits Reduced the amount of time required to complete spend analysis by: 49% 33% Increased the percentage of total spend being analyzed and reported on by: 49% 34% Increased the accuracy of spend reporting by: 55% 38% Identified and reduced non-compliant spend by: 46% 18% Identified cost savings opportunities leading to additional strategic sourcing savings of (on average): 37% 15% Identified opportunities and was able to consolidate the supply base by: 29% 8% Source: Spend Analysis Poll, The Hackett Group, February 2015
  • 12.
    12© 2016 TheHackett Group, Inc. All rights reserved. Reproduction of this document or any portion thereof without prior written consent is prohibited. The Hackett Group – Key Issues Study 2017 “Spend data is widely available globally” was the most important success factor in successfully managing spend at a global level 7,25% 5,86% 4,00% 3,48% Global category strategy BU / region / large country Local / small country Tactical sourcing Estimated average savings Source: Global Category Management Study, The Hackett Group, 2016 40% 25% 10% 10% Global category strategy BU / region / large country Local / small country Tactical sourcing Percent of spend
  • 13.
    13© 2016 TheHackett Group, Inc. All rights reserved. Reproduction of this document or any portion thereof without prior written consent is prohibited. The Hackett Group – Key Issues Study 2017 Greater granularity from a classification perspective is helpful but should be viewed by category 35% 35% 41% 47% 47% 53% 53% 53% 59% 59% Indirect, Sales & Marketing Support Indirect, Business & Administrative Services Indirect, General Equipment & Supplies Direct, Purchased Finished Goods (Resale) Direct Services Capital Equipment/Facilities Operations Indirect, Travel & Entertainment Indirect, HR Services Direct, Raw Materials/Packaging/Other Indirect, IT & Telecommunications Categories that are classified at a more granular level Indirect IT & Telecom and Direct Raw Materials are often being measured at a more granular level than other categories Source: Spend Analysis Poll, The Hackett Group, February 2015
  • 14.
    14© 2016 TheHackett Group, Inc. All rights reserved. Reproduction of this document or any portion thereof without prior written consent is prohibited. The Hackett Group – Key Issues Study 2017 Business case for moving from master family to sub-category classifications 3% 13% 3% 24% 17% 7% 23% 20% 14% % reduction in non-compliant / maverick spend % increase in cost savings from strategic sourcing % consolidation in the supply base Master Family (Ex. Professional Services) Sub-Category (Ex. Exhibit Construction) More granular than sub-category (Ex. Item) Source: Spend Analysis Poll, The Hackett Group, February 2015
  • 15.
    Managed, Influenced &Unmanaged Reporting in Ariba…
  • 16.
    AGENDA Agenda slides • Usethis slide or choose a test page from the new page menu • Use sentence case for section titles • Make the current section title gray; use light blue for the other sections • About Aflac • Hackett Metrics • Reporting Journey… • Questions 16
  • 17.
    About Aflac 17 • Aflacis a Fortune 500 company, providing financial protection to more than 50 million people worldwide. When a policyholder or insured gets sick or hurt, Aflac pays cash benefits fairly, promptly and directly to the insured. • For more than six decades, Aflac voluntary insurance policies have given policyholders the opportunity to focus on recovery, not financial stress. • Aflac is committed to finding a cure for childhood cancer and has contributed more than $113MM to the research and treatment of childhood cancer. Founded by principal founder John Amos, and brothers Paul and Bill Amos Operate in the US (1955) and Japan (1974) $22.6 Billion in Revenue (2016)
  • 18.
    Hackett Metrics 18 Managed: • Spendthat was actually sourced by SS&P consistent with Aflac’s Procurement Policy. Influenced: • Spend in which SS&P had some influence. This may include spend that was not sourced by SS&P but where SS&P was involved late. For example, participated in contract and price negotiations? Reduced risk? Reduced or avoided cost? Unmanaged: • Spend that does not fit either of the two other categories.
  • 19.
    Reporting Journey… 19 Impact: • Manual •Monthly or Quarterly, After the Fact • Multiple Sources (MS Office & SAP Ariba solutions) • Time Consuming/Prone to Error Process: 1. Monthly or Quarterly, Managers review spend in an Excel file spend and tag it as "Managed" or "Influenced" or "Unmanaged" or "Unaddressable". 2. These indicators are then loaded into SAP Ariba Spend Visibility. Process: 1. As created, mark each SAP Ariba contract workspace with the Spend Indicator. 2. As created, mark each SAP Ariba purchase requisition with the Spend Indicator. 3. Push the Spend Indicator into SAP. 4. Push the Spend Indicator into SAP Ariba Spend Visibility Impact: • Automated • Real Time • Single Source of Truth • Efficient Current Future
  • 20.
  • 21.
  • 22.
    March 23, 2017 SimonHauser, Ph.D., SAP Ariba (SAP) Spend Analysis: Run at Your Best and Make Adoption Work
  • 23.
    23PUBLIC© 2017 SAPSE or an SAP affiliate company. All rights reserved. ǀ Public User Adoption – What We Have Learned Best Practices Evolution Services Update Open Q&A Agenda
  • 24.
    User Adoption WhatWe Have Learned
  • 25.
    25PUBLIC© 2017 SAPSE or an SAP affiliate company. All rights reserved. ǀ Public “Where is the data coming from?” “Can I trust the data?” “Why should I use this tool?” “How do I identify opportunities and areas for improvement?” “How do I build the reports I need?” “What is the data telling me?” Deploying spend analysis raises questions
  • 26.
    26PUBLIC© 2017 SAPSE or an SAP affiliate company. All rights reserved. ǀ Public  Ability to articulate business case for SAP Ariba Spend Analysis  Single point of contact for end users  Advanced user of SAP Ariba Spend Analysis – train end users  Coordination with SAP Ariba solution deployment lead and internal stakeholders on – Custom reports and dashboard content – Announcements, recent successes – Communication of enrichment availability Make adoption work Let superusers lead the way
  • 27.
    27PUBLIC© 2017 SAPSE or an SAP affiliate company. All rights reserved. ǀ Public  Trust in data and classification are essential for user adoption!  Regularly review commodity classifications with predefined timeline  Create refinement report to focus enrichment review on newly loaded data  Consolidate approach via online ECR (enrichment change request) feature or bulk upload  Implement source system data improvements to further enhance enrichment outcomes Make adoption work Data improvement
  • 28.
    28PUBLIC© 2017 SAPSE or an SAP affiliate company. All rights reserved. ǀ Public  A custom taxonomy allows you to translate the classification taxonomy for SAP Ariba solutions to suit your end users  Structure custom taxonomy based on products/services to execute on initiatives such as strategic sourcing, maverick spend management, and rebate programs  Build taxonomy at a deeper level to support direct spend vs. indirect  Minimize M:1 relationships, work toward a 1:1 mapping with the classification taxonomy to preserve granularity Make adoption work Custom taxonomy
  • 29.
    29PUBLIC© 2017 SAPSE or an SAP affiliate company. All rights reserved. ǀ Public  Keep dashboards and reports focused on key user groups  Get easy access to predefined content  Leverage announcement/news section for project successes, milestones, timeline  Integrate compound reports to give 360- degree view of suppliers and commodities  House relevant documents on dashboard (cheat sheets, presentations, and more) Make adoption work – dashboards and reports
  • 30.
  • 31.
    31PUBLIC© 2017 SAPSE or an SAP affiliate company. All rights reserved. ǀ Public SAP Ariba Best Practices Center  Managed project available to all SAP Ariba Spend Analysis customers to increase solution adoption and ROI after go-live  Best practices center offerings include:  Custom taxonomy support  Jump start  User guide  Operational reporting (group dashboards, advanced reporting, Microsoft Excel templates)  Significant growth in customers taking advantage of this service over the last few years
  • 32.
    32PUBLIC© 2017 SAPSE or an SAP affiliate company. All rights reserved. ǀ Public SAP Ariba Spend Analysis – best practices center projects by year *As of Q1 2017 *
  • 33.
  • 34.
    34PUBLIC© 2017 SAPSE or an SAP affiliate company. All rights reserved. ǀ Public Services update  Growing global team of deployment leads supporting multiple languages and time zones  New solutions: SAP Ariba Supplier Risk and master data cleansing service for SAP Ariba solutions  Continue to invest in strategic and consultative skill development for the team  Ongoing innovation around new service offerings based on what customers are telling us. Some possible innovations include:  Data extraction services  On-site workshops to accelerate deployment  Additional consulting offerings (adoption focus/goal tracking)  Data improvement in analysis Other current focus areas include  Partnership with 3rd party provider to help with savings realization – currently running pilot program  Replacement of category experience data in SAP Ariba solutions
  • 35.
    35PUBLIC© 2017 SAPSE or an SAP affiliate company. All rights reserved. ǀ Public Summary • Enable superusers to support your end users • Gain trustworthy data thanks to ongoing refinement • Implement a custom taxonomy structured to support sourcing and effective spend management • Enjoy easy access and group-relevant dashboard content • Take advantage of the best practices center • Look for new service offerings and additional content forthcoming in H2 2017
  • 36.
    Thank you. Kurt Albertson Principal,Procurement Advisory, The Hackett Group kalbertson@thehackettgroup.com Jacob Ingvalson Director, Strategic Sourcing and Procurement, Aflac jingvalson@aflac.com Simon Hauser, Ph.D. Manager, Spend Analysis simon.hauser@sap.com Sundar Kamak Vice President, Product and Innovations, SAP Ariba (SAP) Sundar.kamak@sap.com Contact Information
  • 37.
    No part ofthis publication may be reproduced or transmitted in any form or for any purpose without the express permission of SAP SE or an SAP affiliate company. The information contained herein may be changed without prior notice. Some software products marketed by SAP SE and its distributors contain proprietary software components of other software vendors. National product specifications may vary. These materials are provided by SAP SE or an SAP affiliate company for informational purposes only, without representation or warranty of any kind, and SAP or its affiliated companies shall not be liable for errors or omissions with respect to the materials. The only warranties for SAP or SAP affiliate company products and services are those that are set forth in the express warranty statements accompanying such products and services, if any. Nothing herein should be construed as constituting an additional warranty. In particular, SAP SE or its affiliated companies have no obligation to pursue any course of business outlined in this document or any related presentation, or to develop or release any functionality mentioned therein. This document, or any related presentation, and SAP SE’s or its affiliated companies’ strategy and possible future developments, products, and/or platform directions and functionality are all subject to change and may be changed by SAP SE or its affiliated companies at any time for any reason without notice. The information in this document is not a commitment, promise, or legal obligation to deliver any material, code, or functionality. All forward-looking statements are subject to various risks and uncertainties that could cause actual results to differ materially from expectations. Readers are cautioned not to place undue reliance on these forward-looking statements, and they should not be relied upon in making purchasing decisions. SAP and other SAP products and services mentioned herein as well as their respective logos are trademarks or registered trademarks of SAP SE (or an SAP affiliate company) in Germany and other countries. All other product and service names mentioned are the trademarks of their respective companies. See http://global.sap.com/corporate-en/legal/copyright/index.epx for additional trademark information and notices. © 2017 SAP SE or an SAP affiliate company. All rights reserved.