Downloaded 18 times


![Measurement
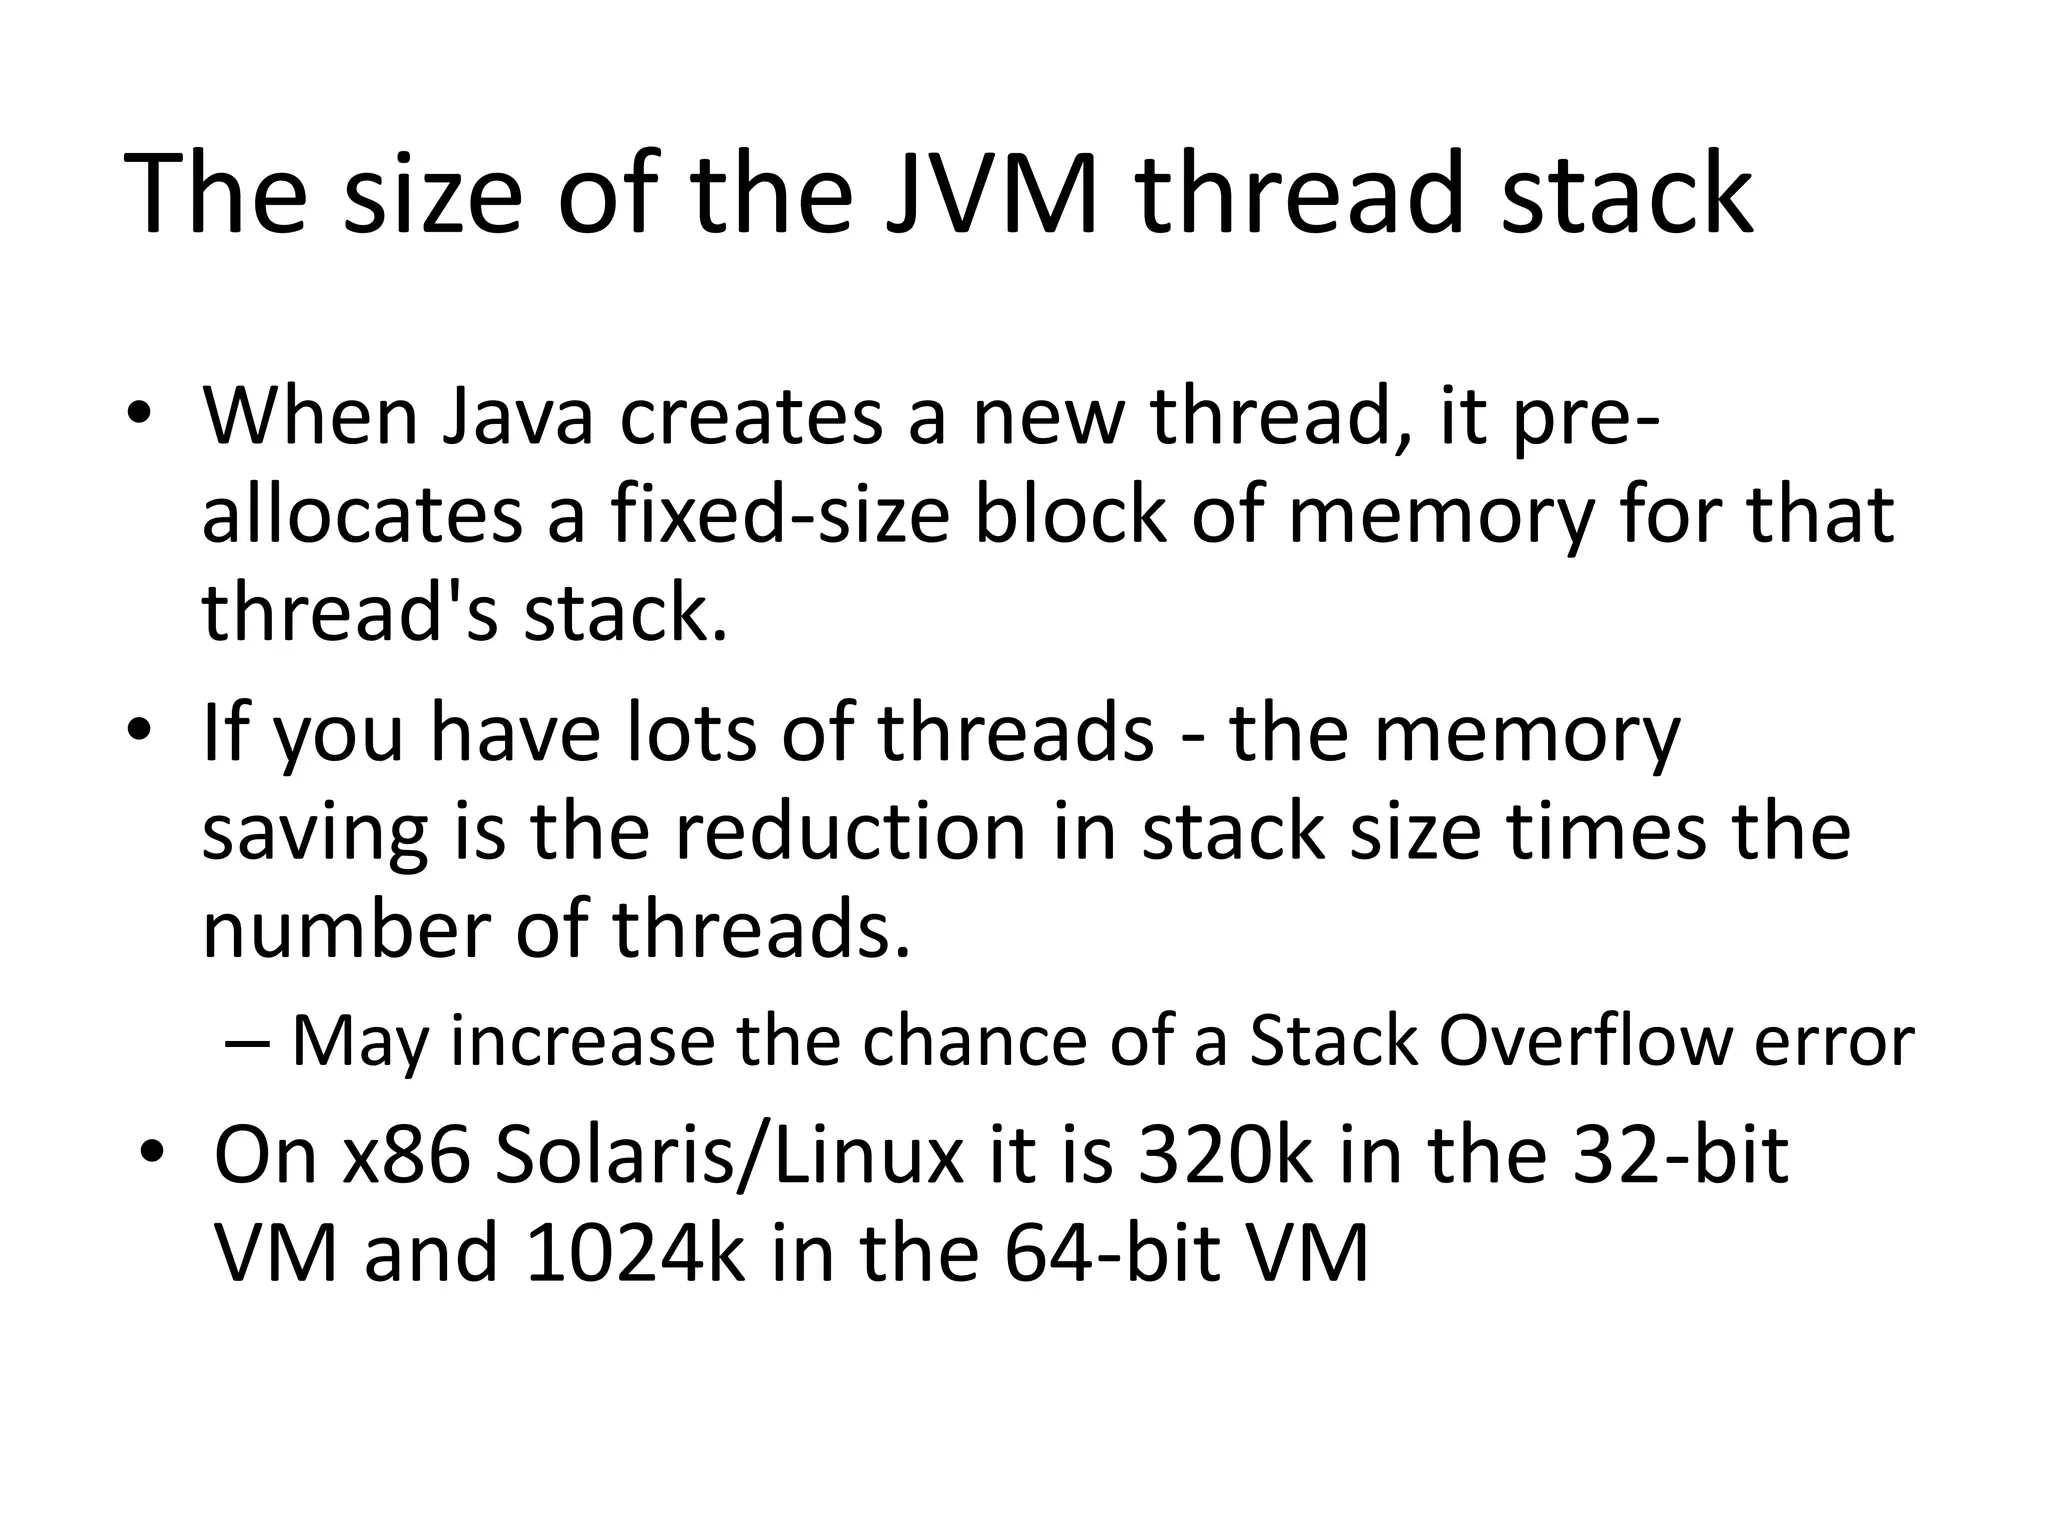
• -verbose:gc
information about the heap and garbage collection
to be printed at each collection.
[GC 325407K->83000K(776768K), 0.2300771 secs]
[GC 325816K->83372K(776768K), 0.2454258 secs]
[Full GC 267628K->83769K(776768K), 1.8479984 secs]](https://image.slidesharecdn.com/aboutgc-140512222820-phpapp02/75/What-you-need-to-know-about-GC-19-2048.jpg)
![Measurement…
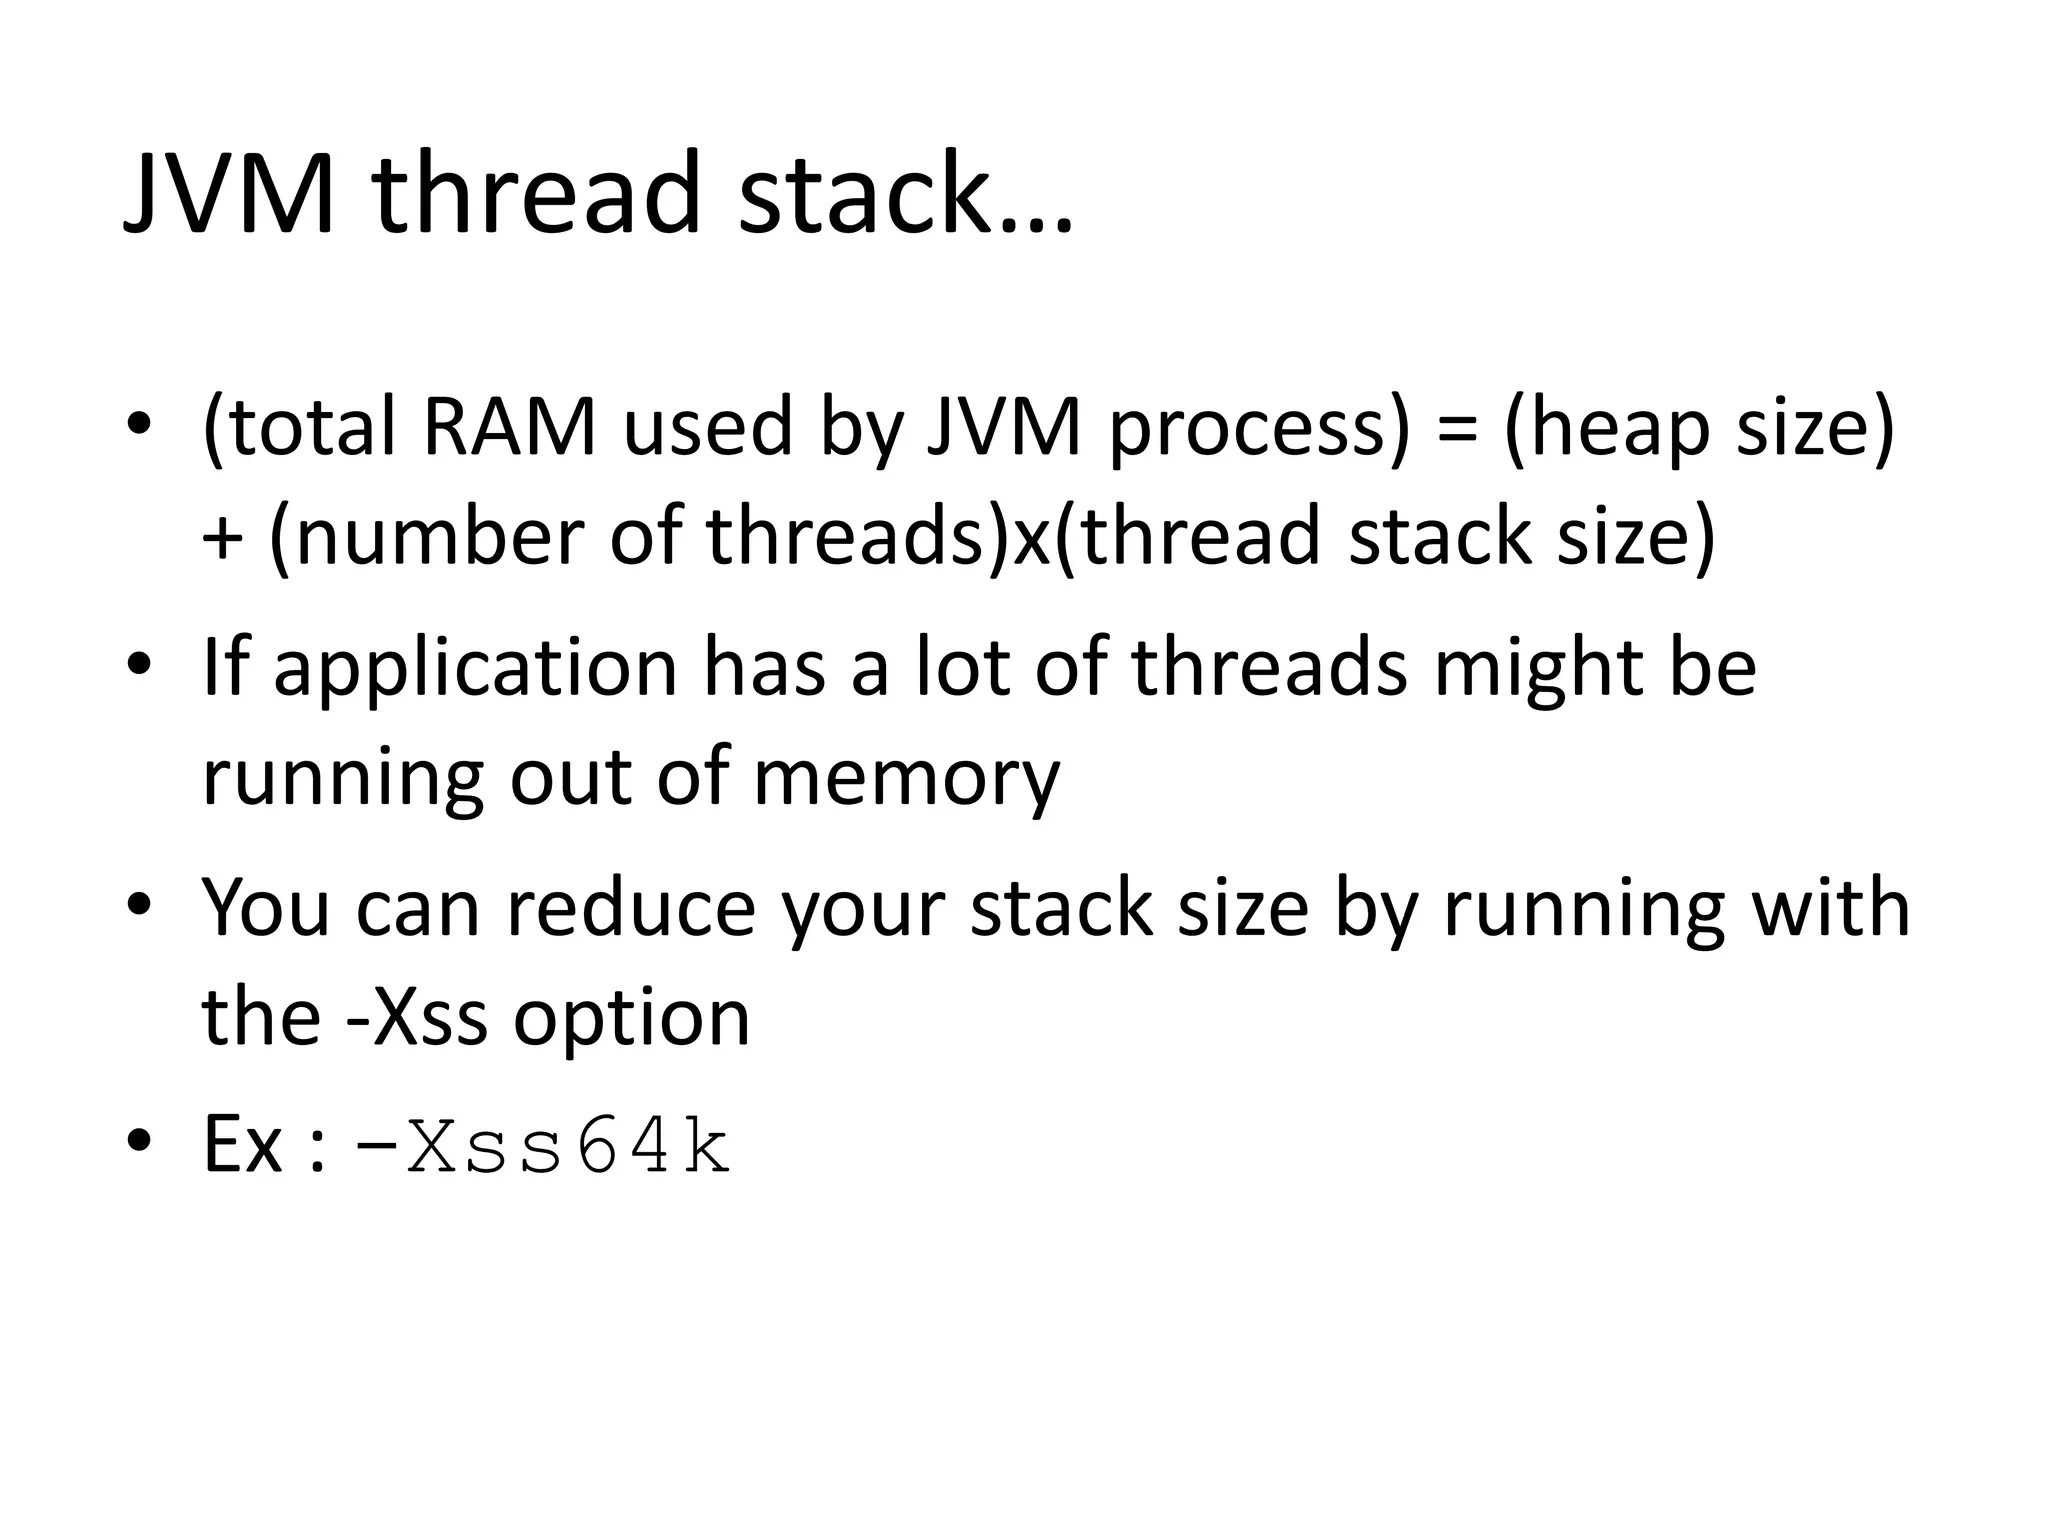
• -XX:+PrintGCDetails
[GC [DefNew: 64575K->959K(64576K), 0.0457646 secs]
196016K->133633K(261184K), 0.0459067 secs]
• -XX:+PrintGCTimeStamps
111.042: [GC 111.042: [DefNew: 8128K->8128K(8128K),
0.0000505 secs]111.042: [Tenured: 18154K->2311K(24576K),
0.1290354 secs] 26282K->2311K(32704K), 0.1293306 secs]](https://image.slidesharecdn.com/aboutgc-140512222820-phpapp02/75/What-you-need-to-know-about-GC-20-2048.jpg)


![[GC [1 CMS-initial-mark: 13991K(20288K)] 14103K(22400K), 0.0023781 secs]
[GC [DefNew: 2112K->64K(2112K), 0.0837052 secs] 16103K->15476K(22400K), 0.0838519
secs]
...
[GC [DefNew: 2077K->63K(2112K), 0.0126205 secs] 17552K->15855K(22400K), 0.0127482
secs]
[CMS-concurrent-mark: 0.267/0.374 secs]
[GC [DefNew: 2111K->64K(2112K), 0.0190851 secs] 17903K->16154K(22400K), 0.0191903
secs]
[CMS-concurrent-preclean: 0.044/0.064 secs]
[GC [1 CMS-remark: 16090K(20288K)] 17242K(22400K), 0.0210460 secs]
[GC [DefNew: 2112K->63K(2112K), 0.0716116 secs] 18177K->17382K(22400K), 0.0718204
secs]
[GC [DefNew: 2111K->63K(2112K), 0.0830392 secs] 19363K->18757K(22400K), 0.0832943
secs]
...
[GC [DefNew: 2111K->0K(2112K), 0.0035190 secs] 17527K->15479K(22400K), 0.0036052 secs]
[CMS-concurrent-sweep: 0.291/0.662 secs]
[GC [DefNew: 2048K->0K(2112K), 0.0013347 secs] 17527K->15479K(27912K), 0.0014231 secs]
[CMS-concurrent-reset: 0.016/0.016 secs]
[GC [DefNew: 2048K->1K(2112K), 0.0013936 secs] 17527K->15479K(27912K), 0.0014814 secs]](https://image.slidesharecdn.com/aboutgc-140512222820-phpapp02/75/What-you-need-to-know-about-GC-39-2048.jpg)

![References
[1] "Java SE 6 HotSpot™ Virtual Machine Garbage
Collection Tuning", [Online]. Available:
http://www.oracle.com/technetwork/java/javase/g
c-tuning-6-140523.html [Accessed 12-May-2014]
[2] "Frequently Asked Questions About the Java
HotSpot VM", [Online]. Available:
http://www.oracle.com/technetwork/java/hotspotf
aq-138619.htm [Accessed 12-May-2014]](https://image.slidesharecdn.com/aboutgc-140512222820-phpapp02/75/What-you-need-to-know-about-GC-46-2048.jpg)


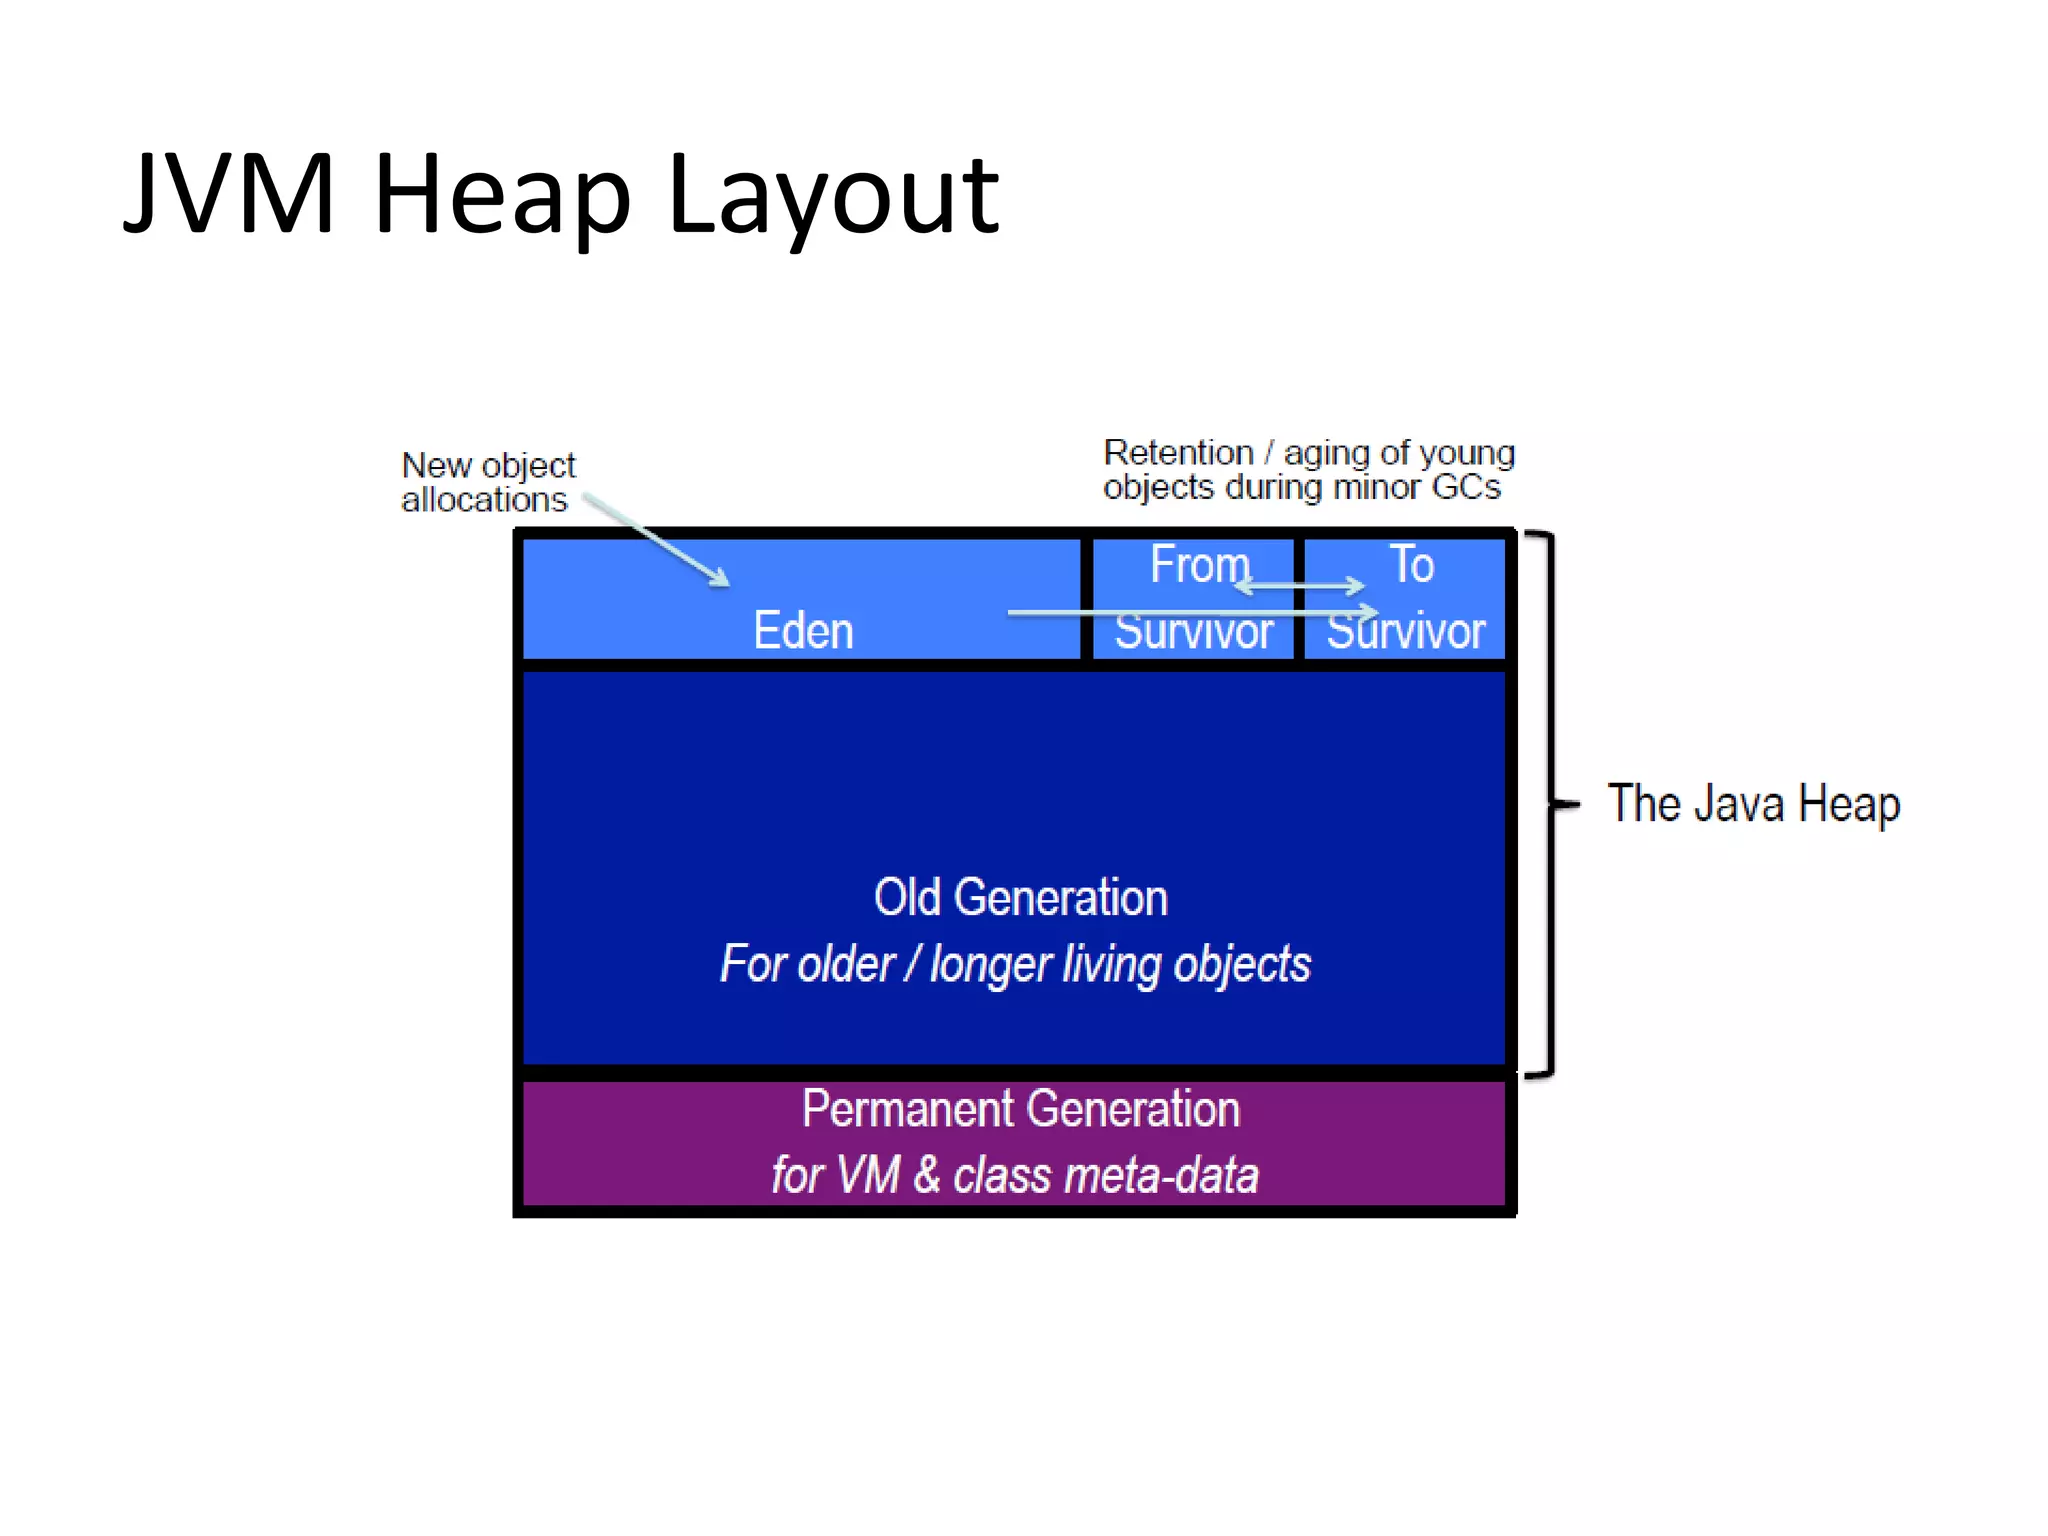
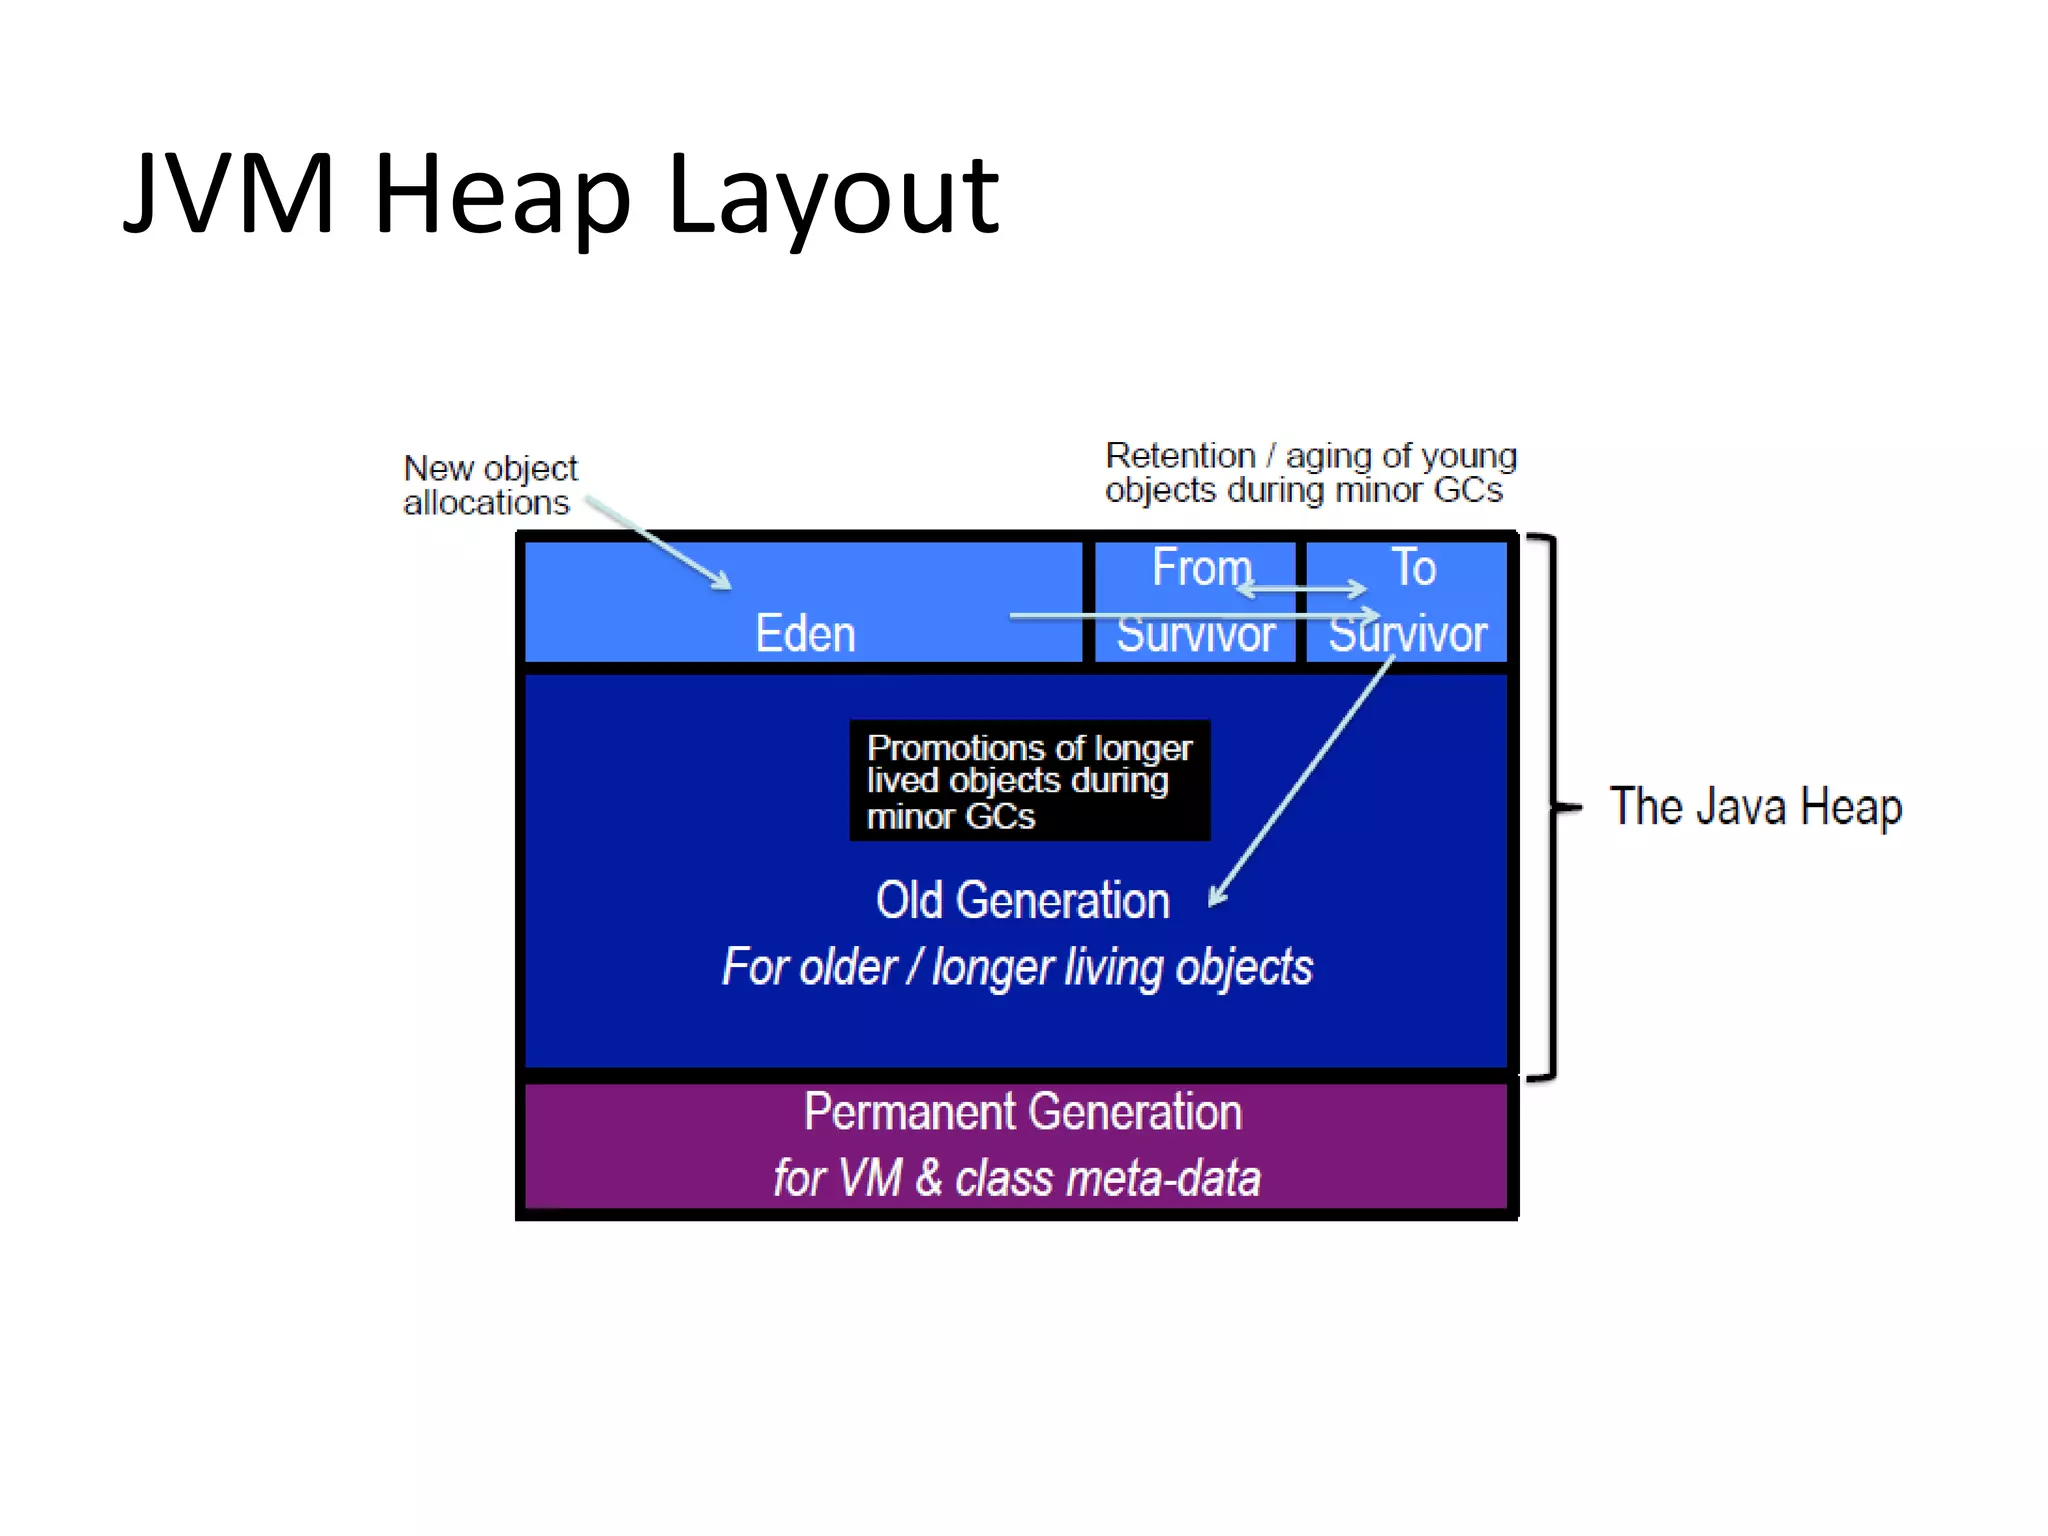
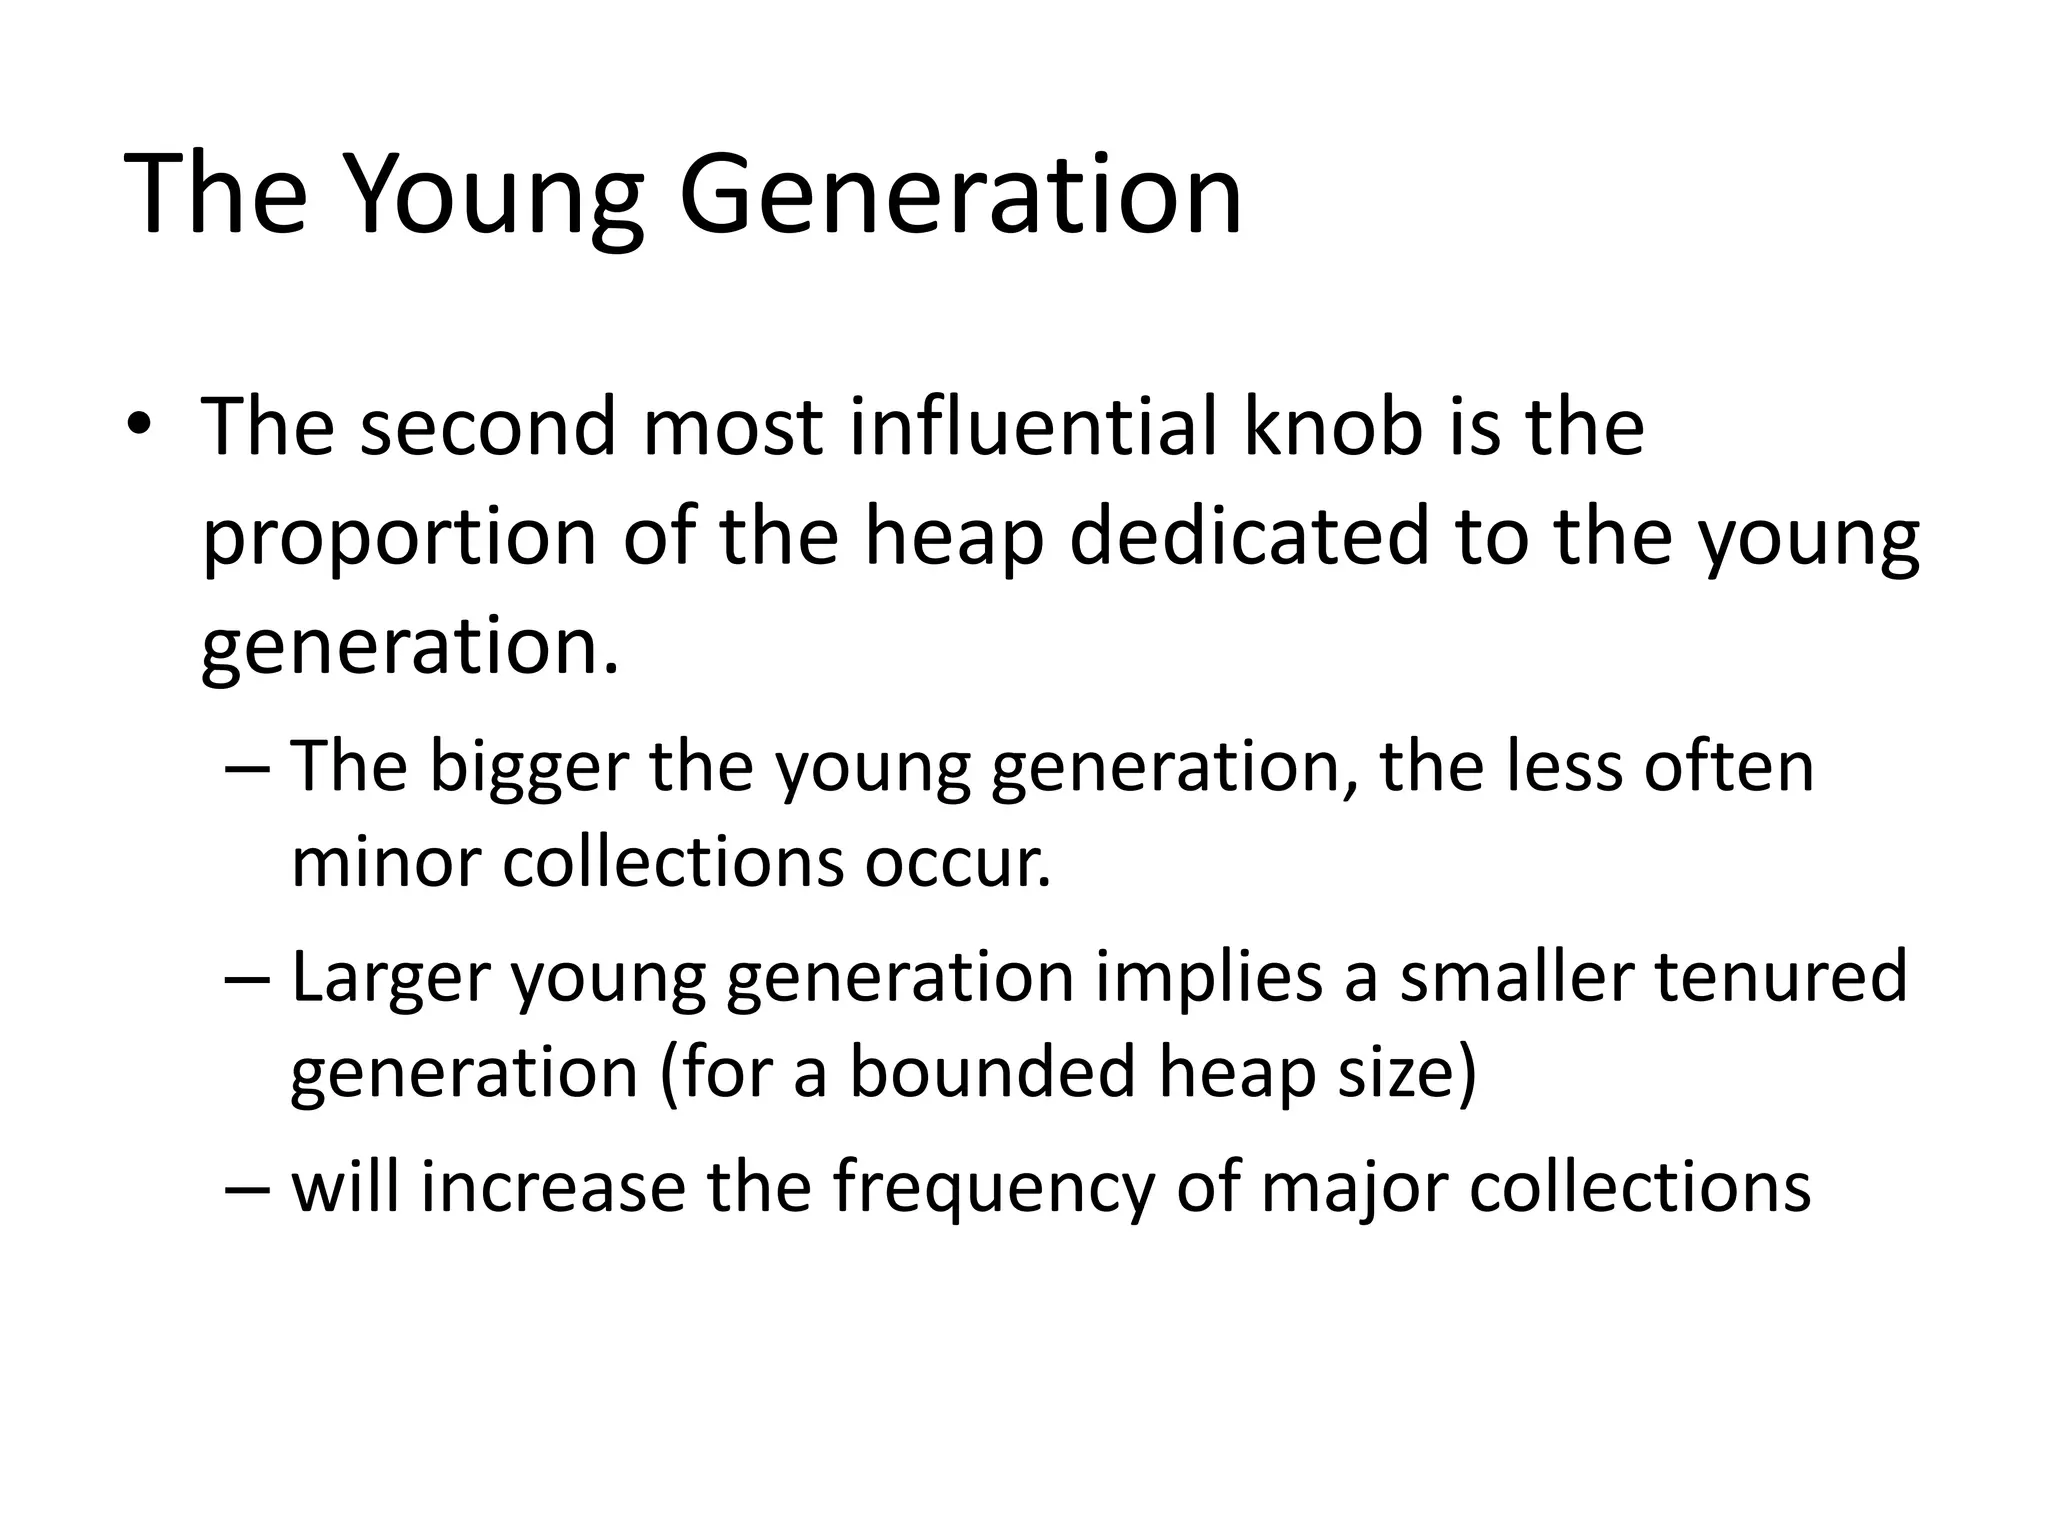
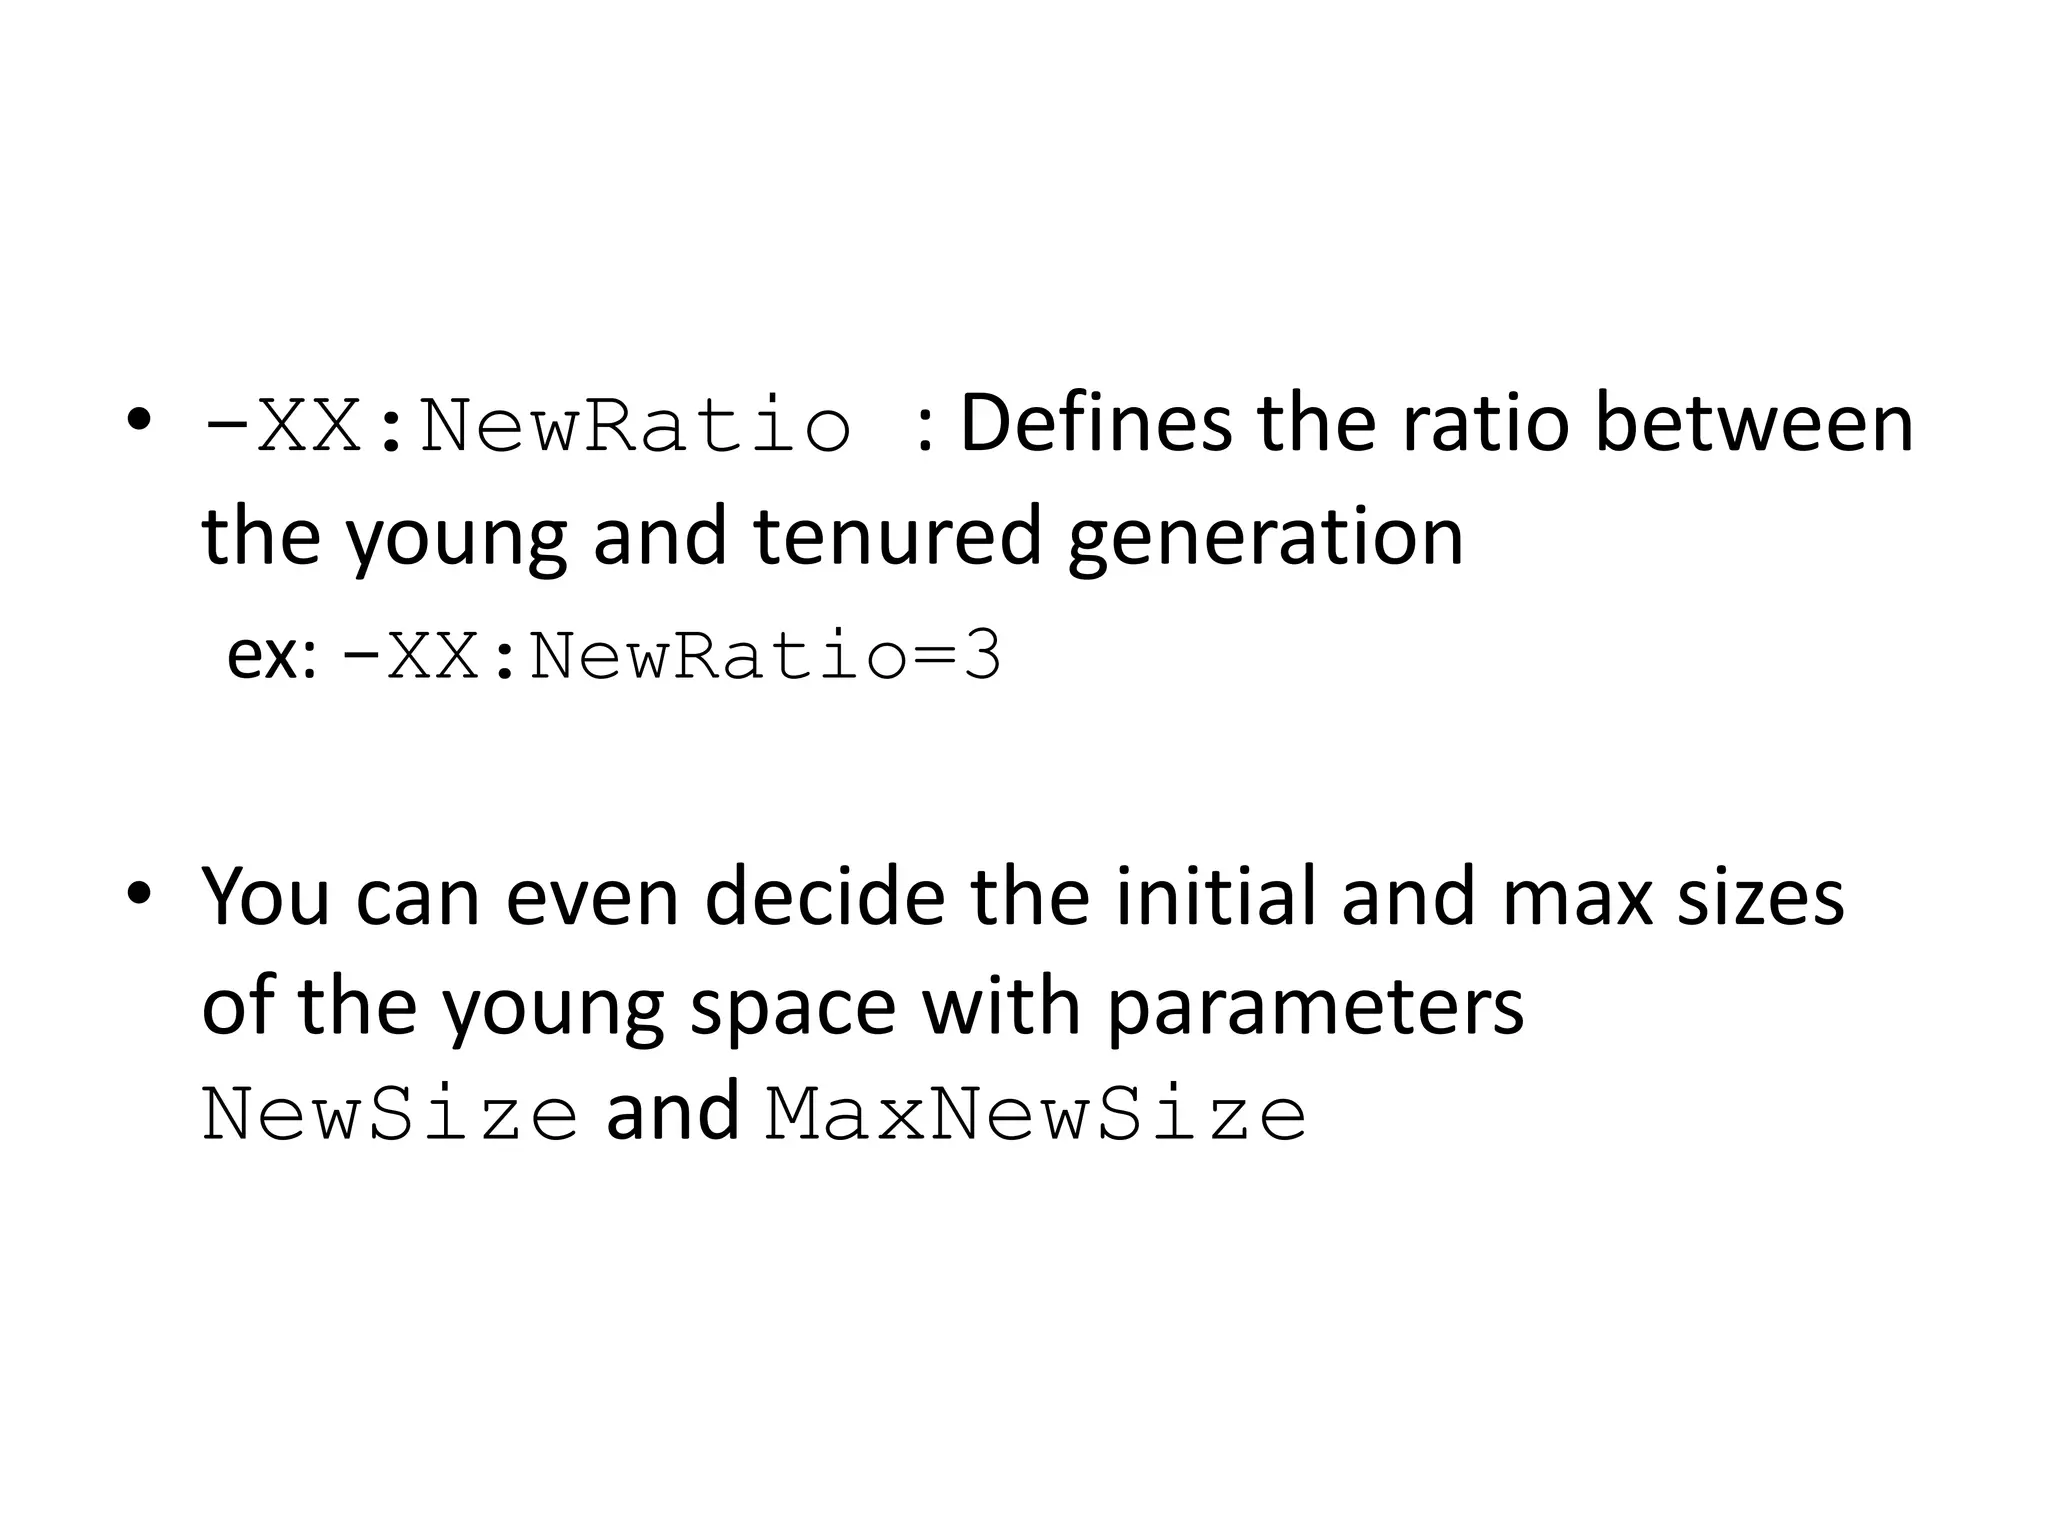
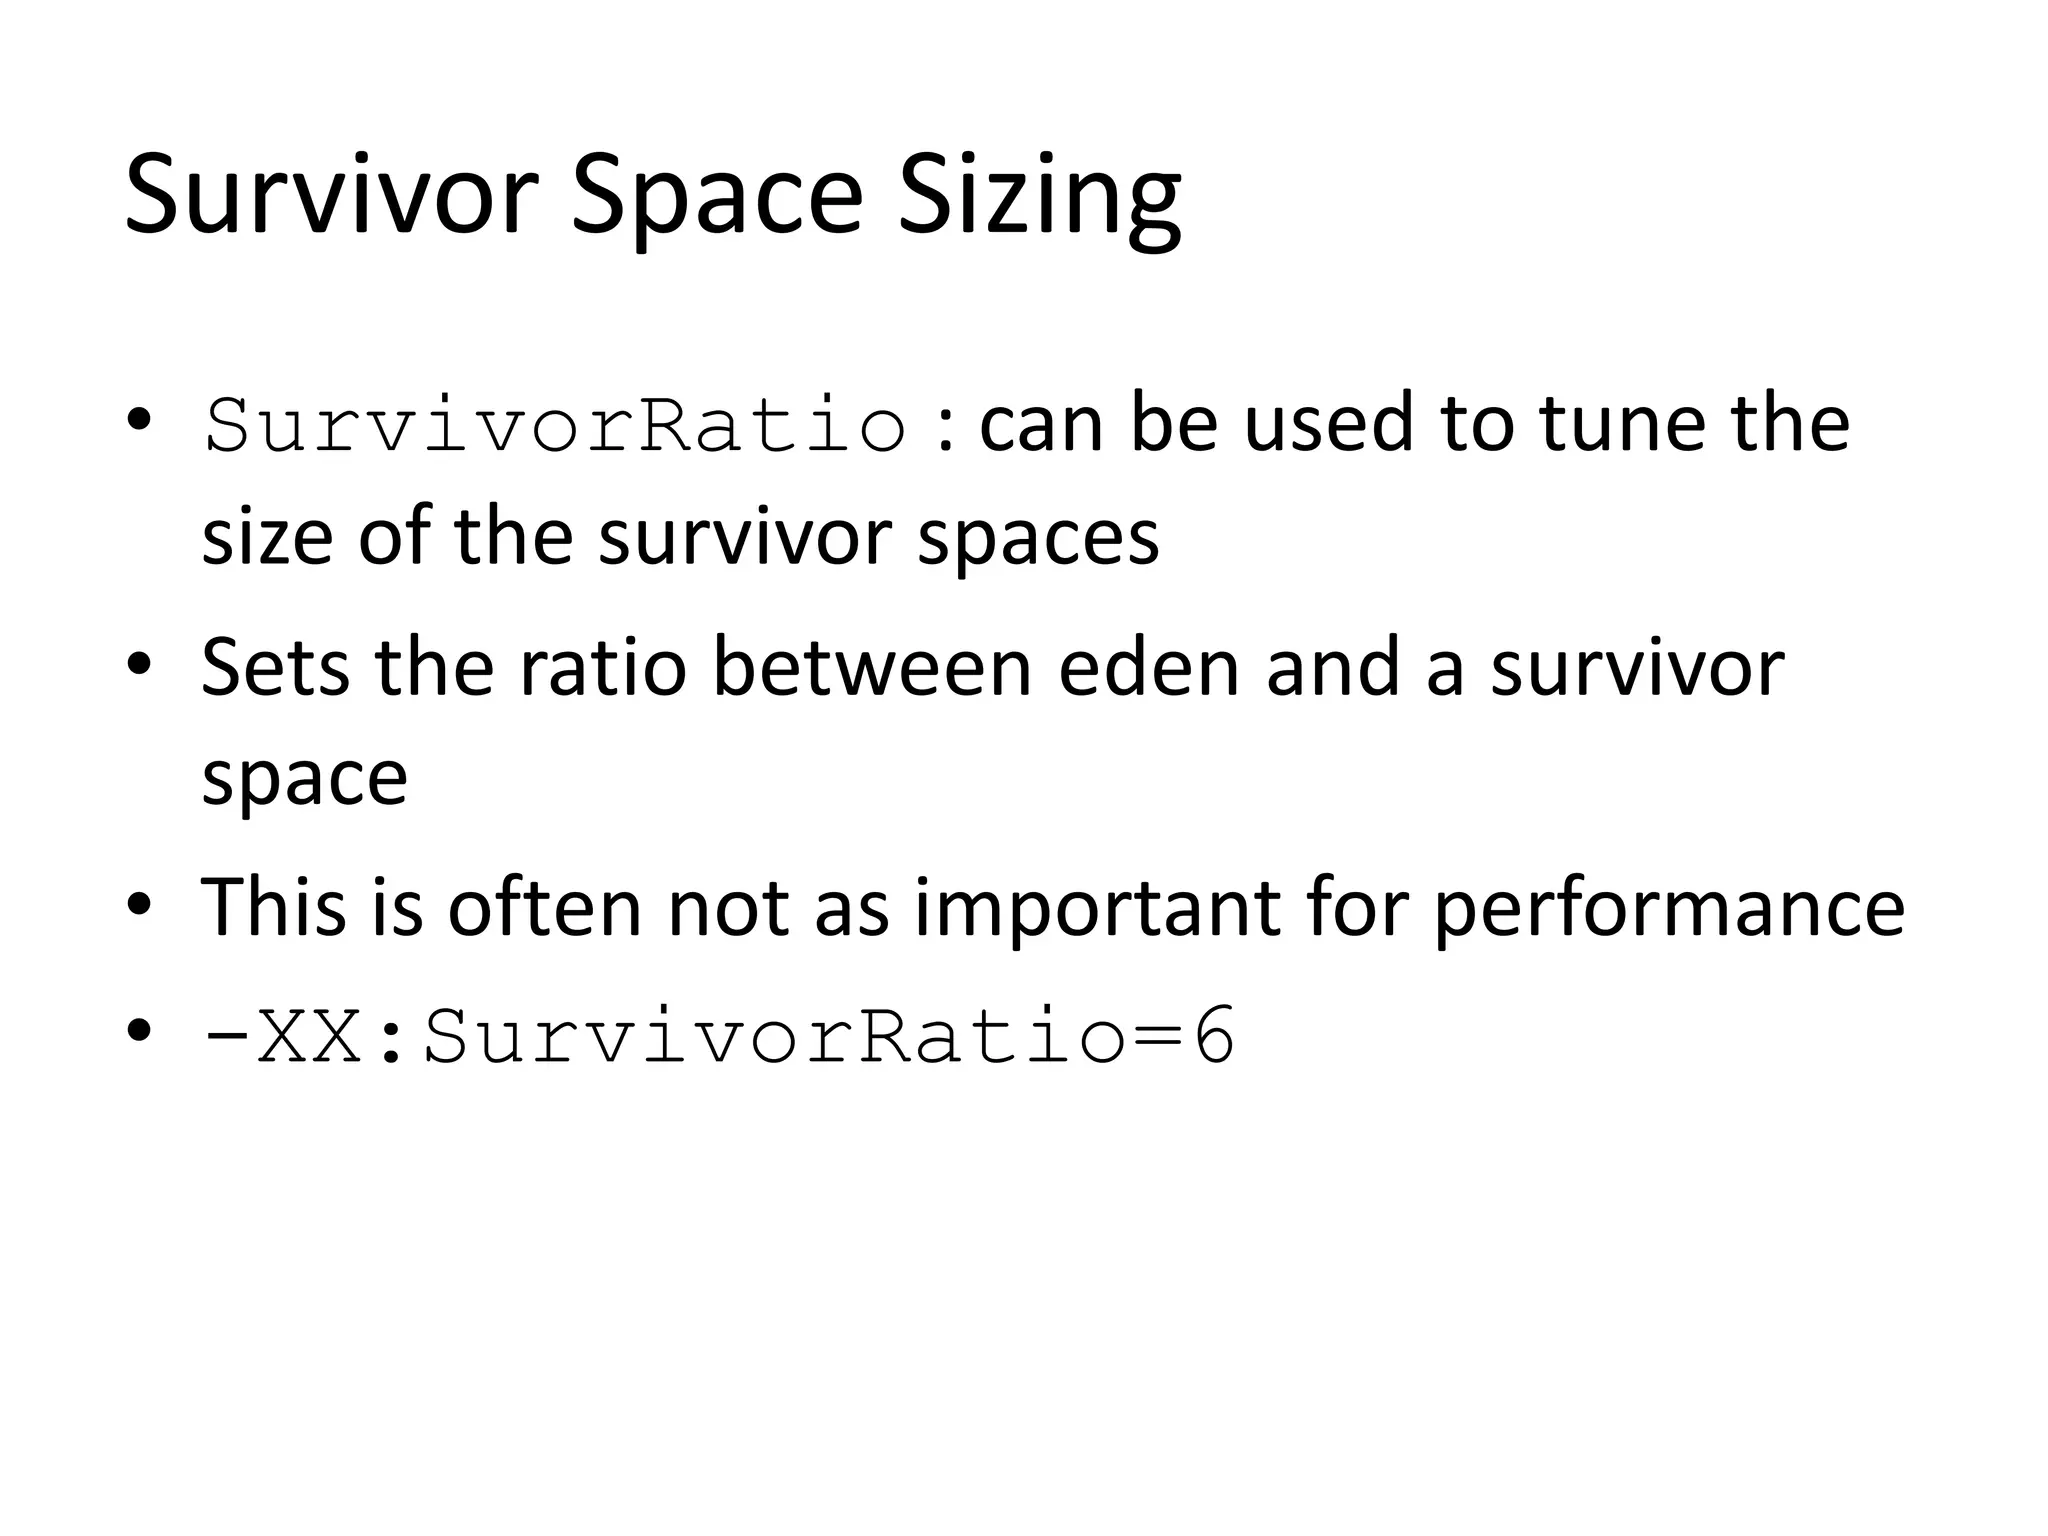
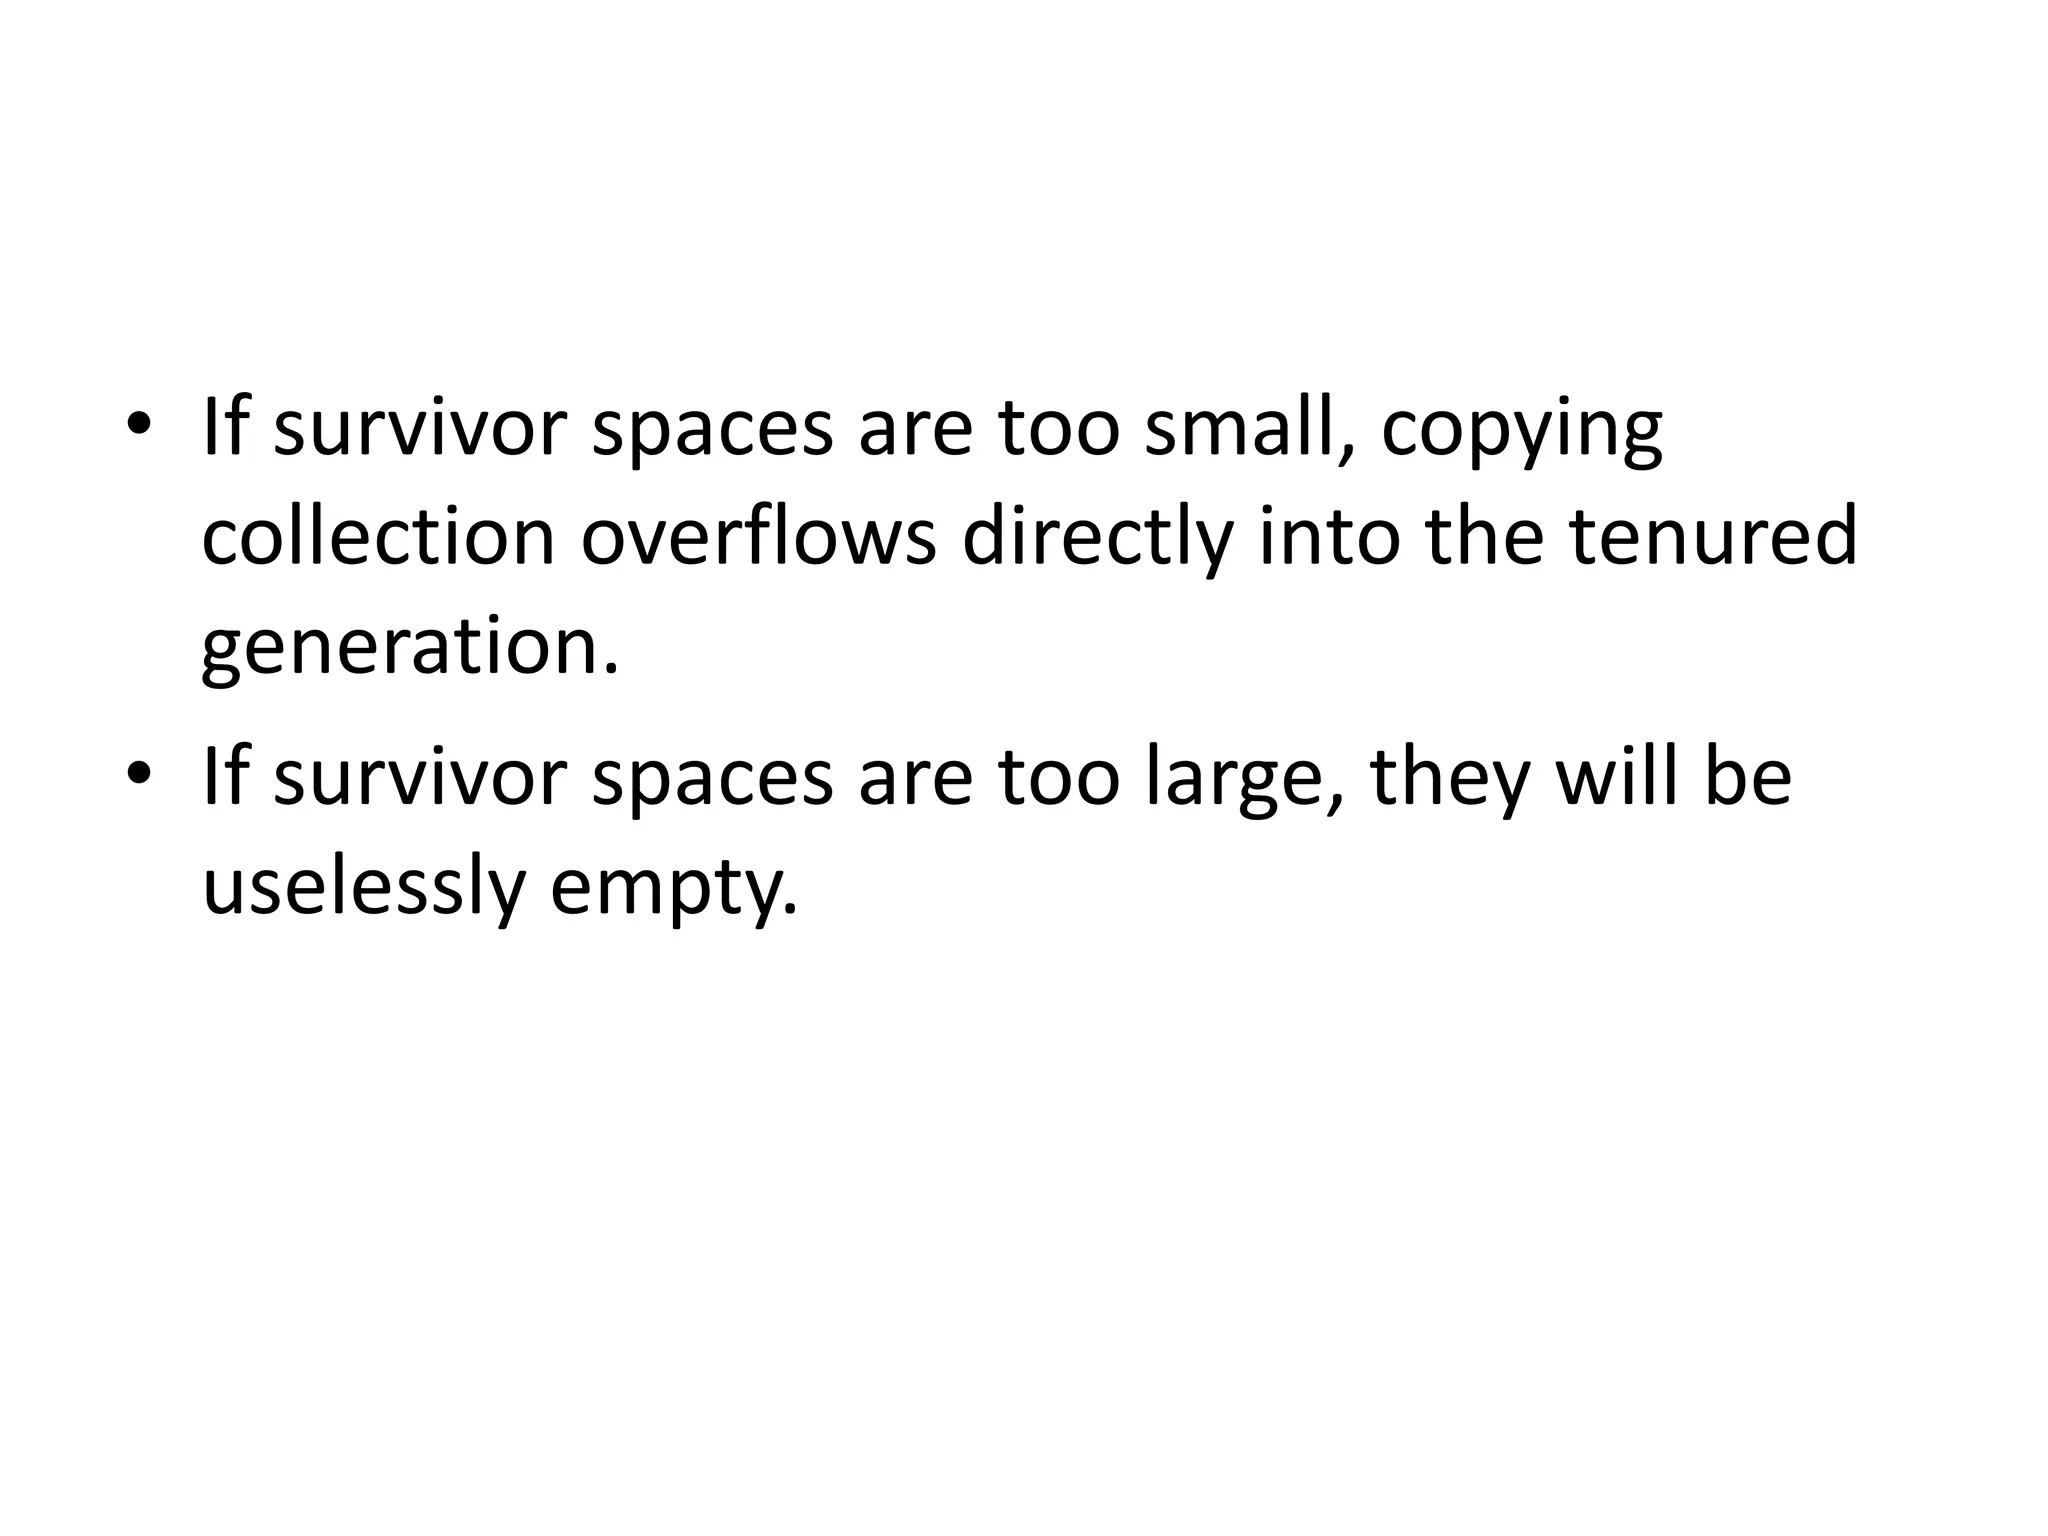
The document provides an overview of garbage collection in Java SE 6 HotSpot VM, detailing the importance of memory management, types of garbage collectors, and their performance considerations. It discusses the generational garbage collection strategy, tuning parameters, and how different configurations affect application performance, especially in relation to throughput, pause times, and memory footprint. The document also highlights various collectors such as the serial, parallel, and concurrent collectors, including their use cases and configurations for optimizing garbage collection.


![[BGOUG] Java GC - Friend or Foe](https://cdn.slidesharecdn.com/ss_thumbnails/javagcfriendorfoe-101125015602-phpapp01-thumbnail.jpg?width=640&height=640&fit=bounds)