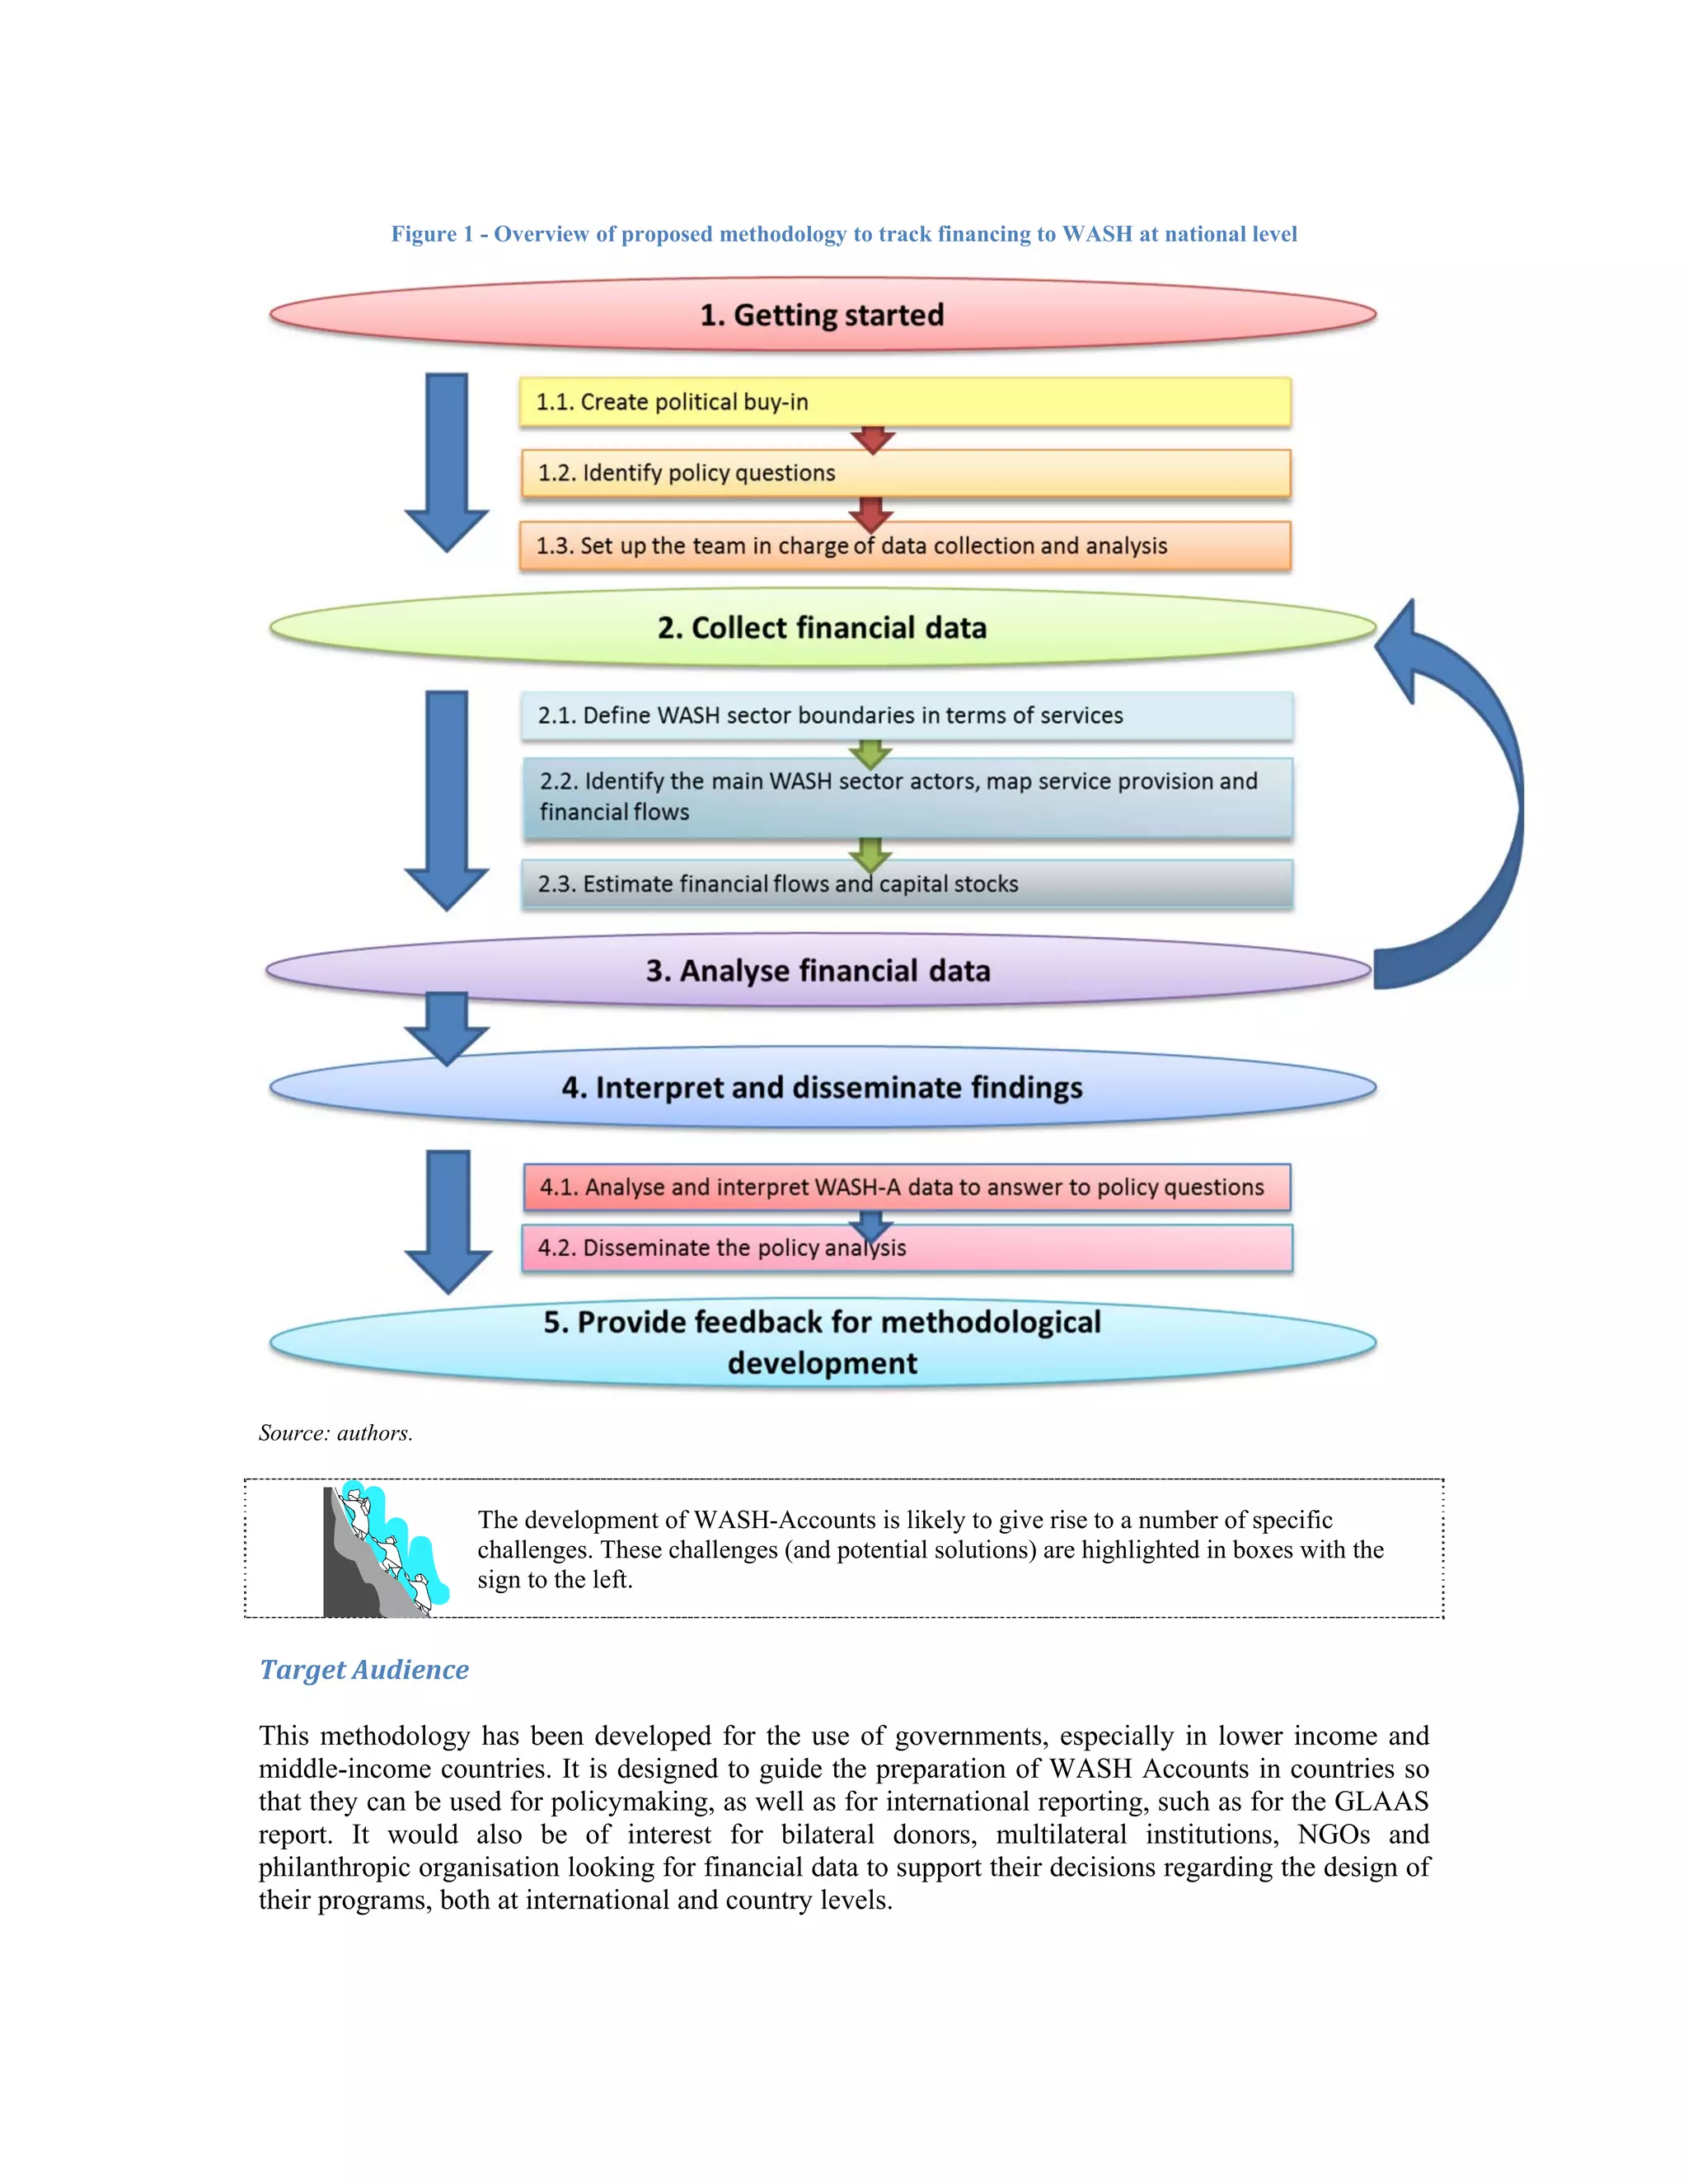
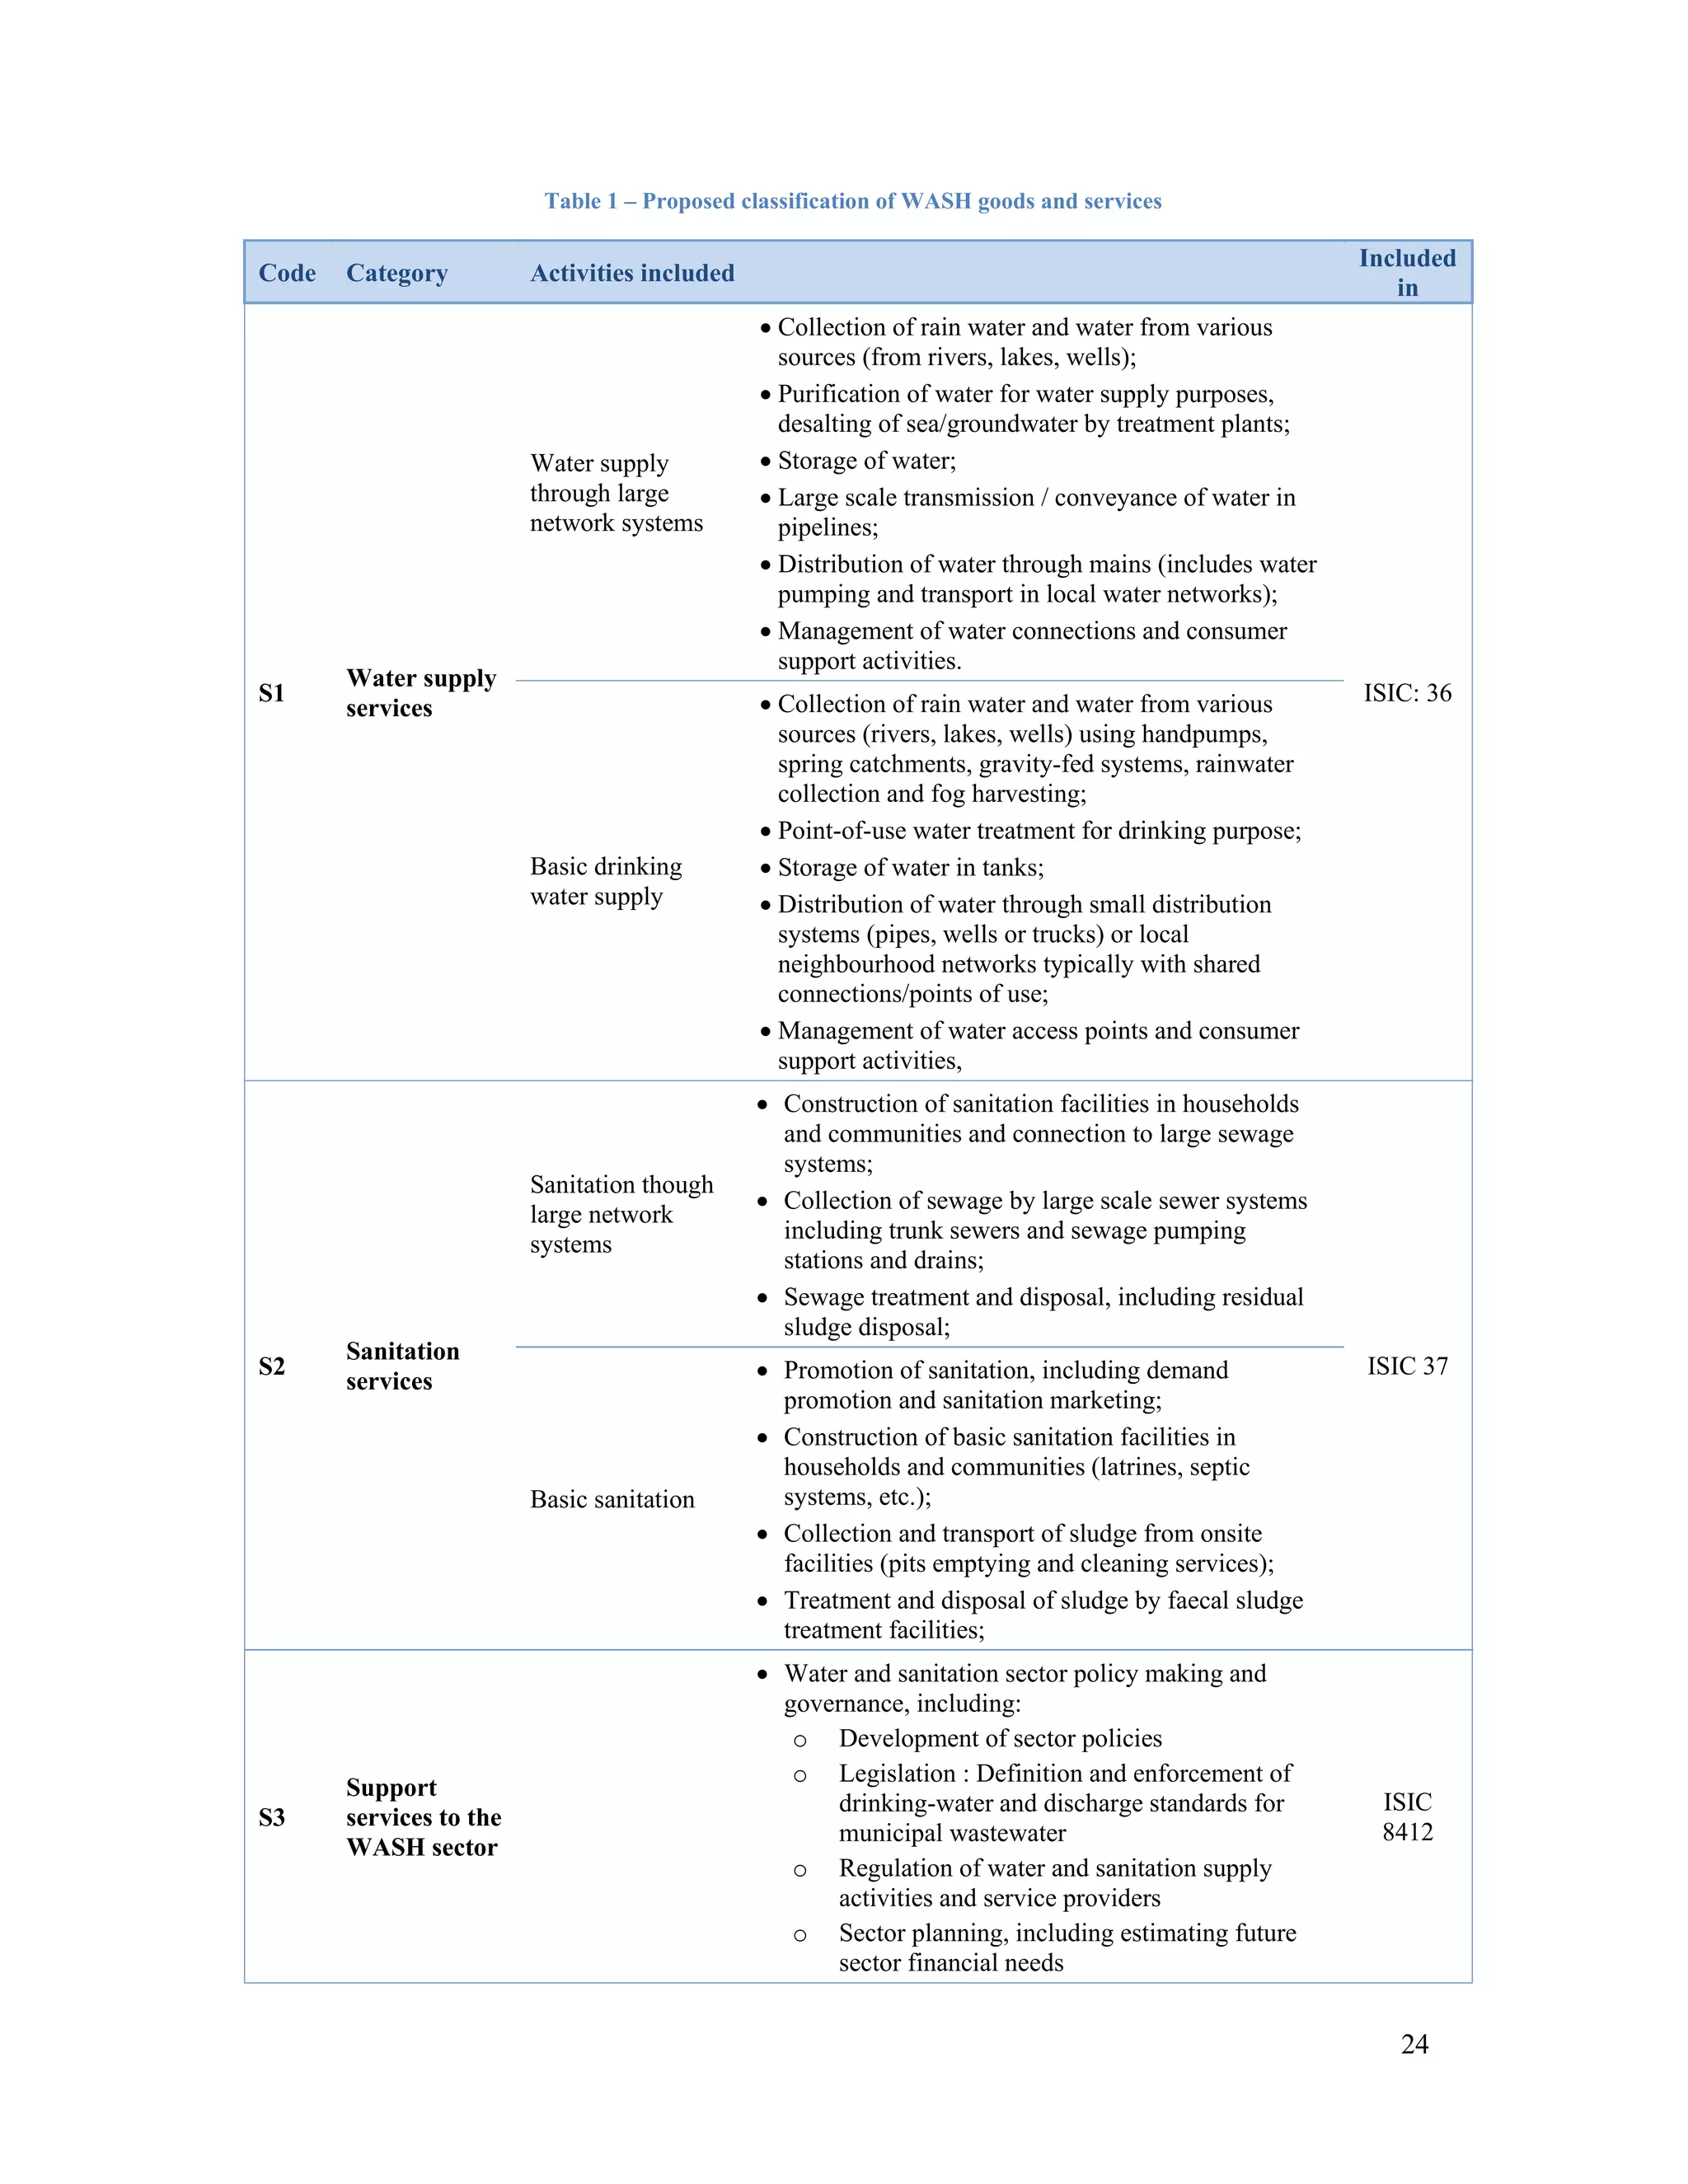
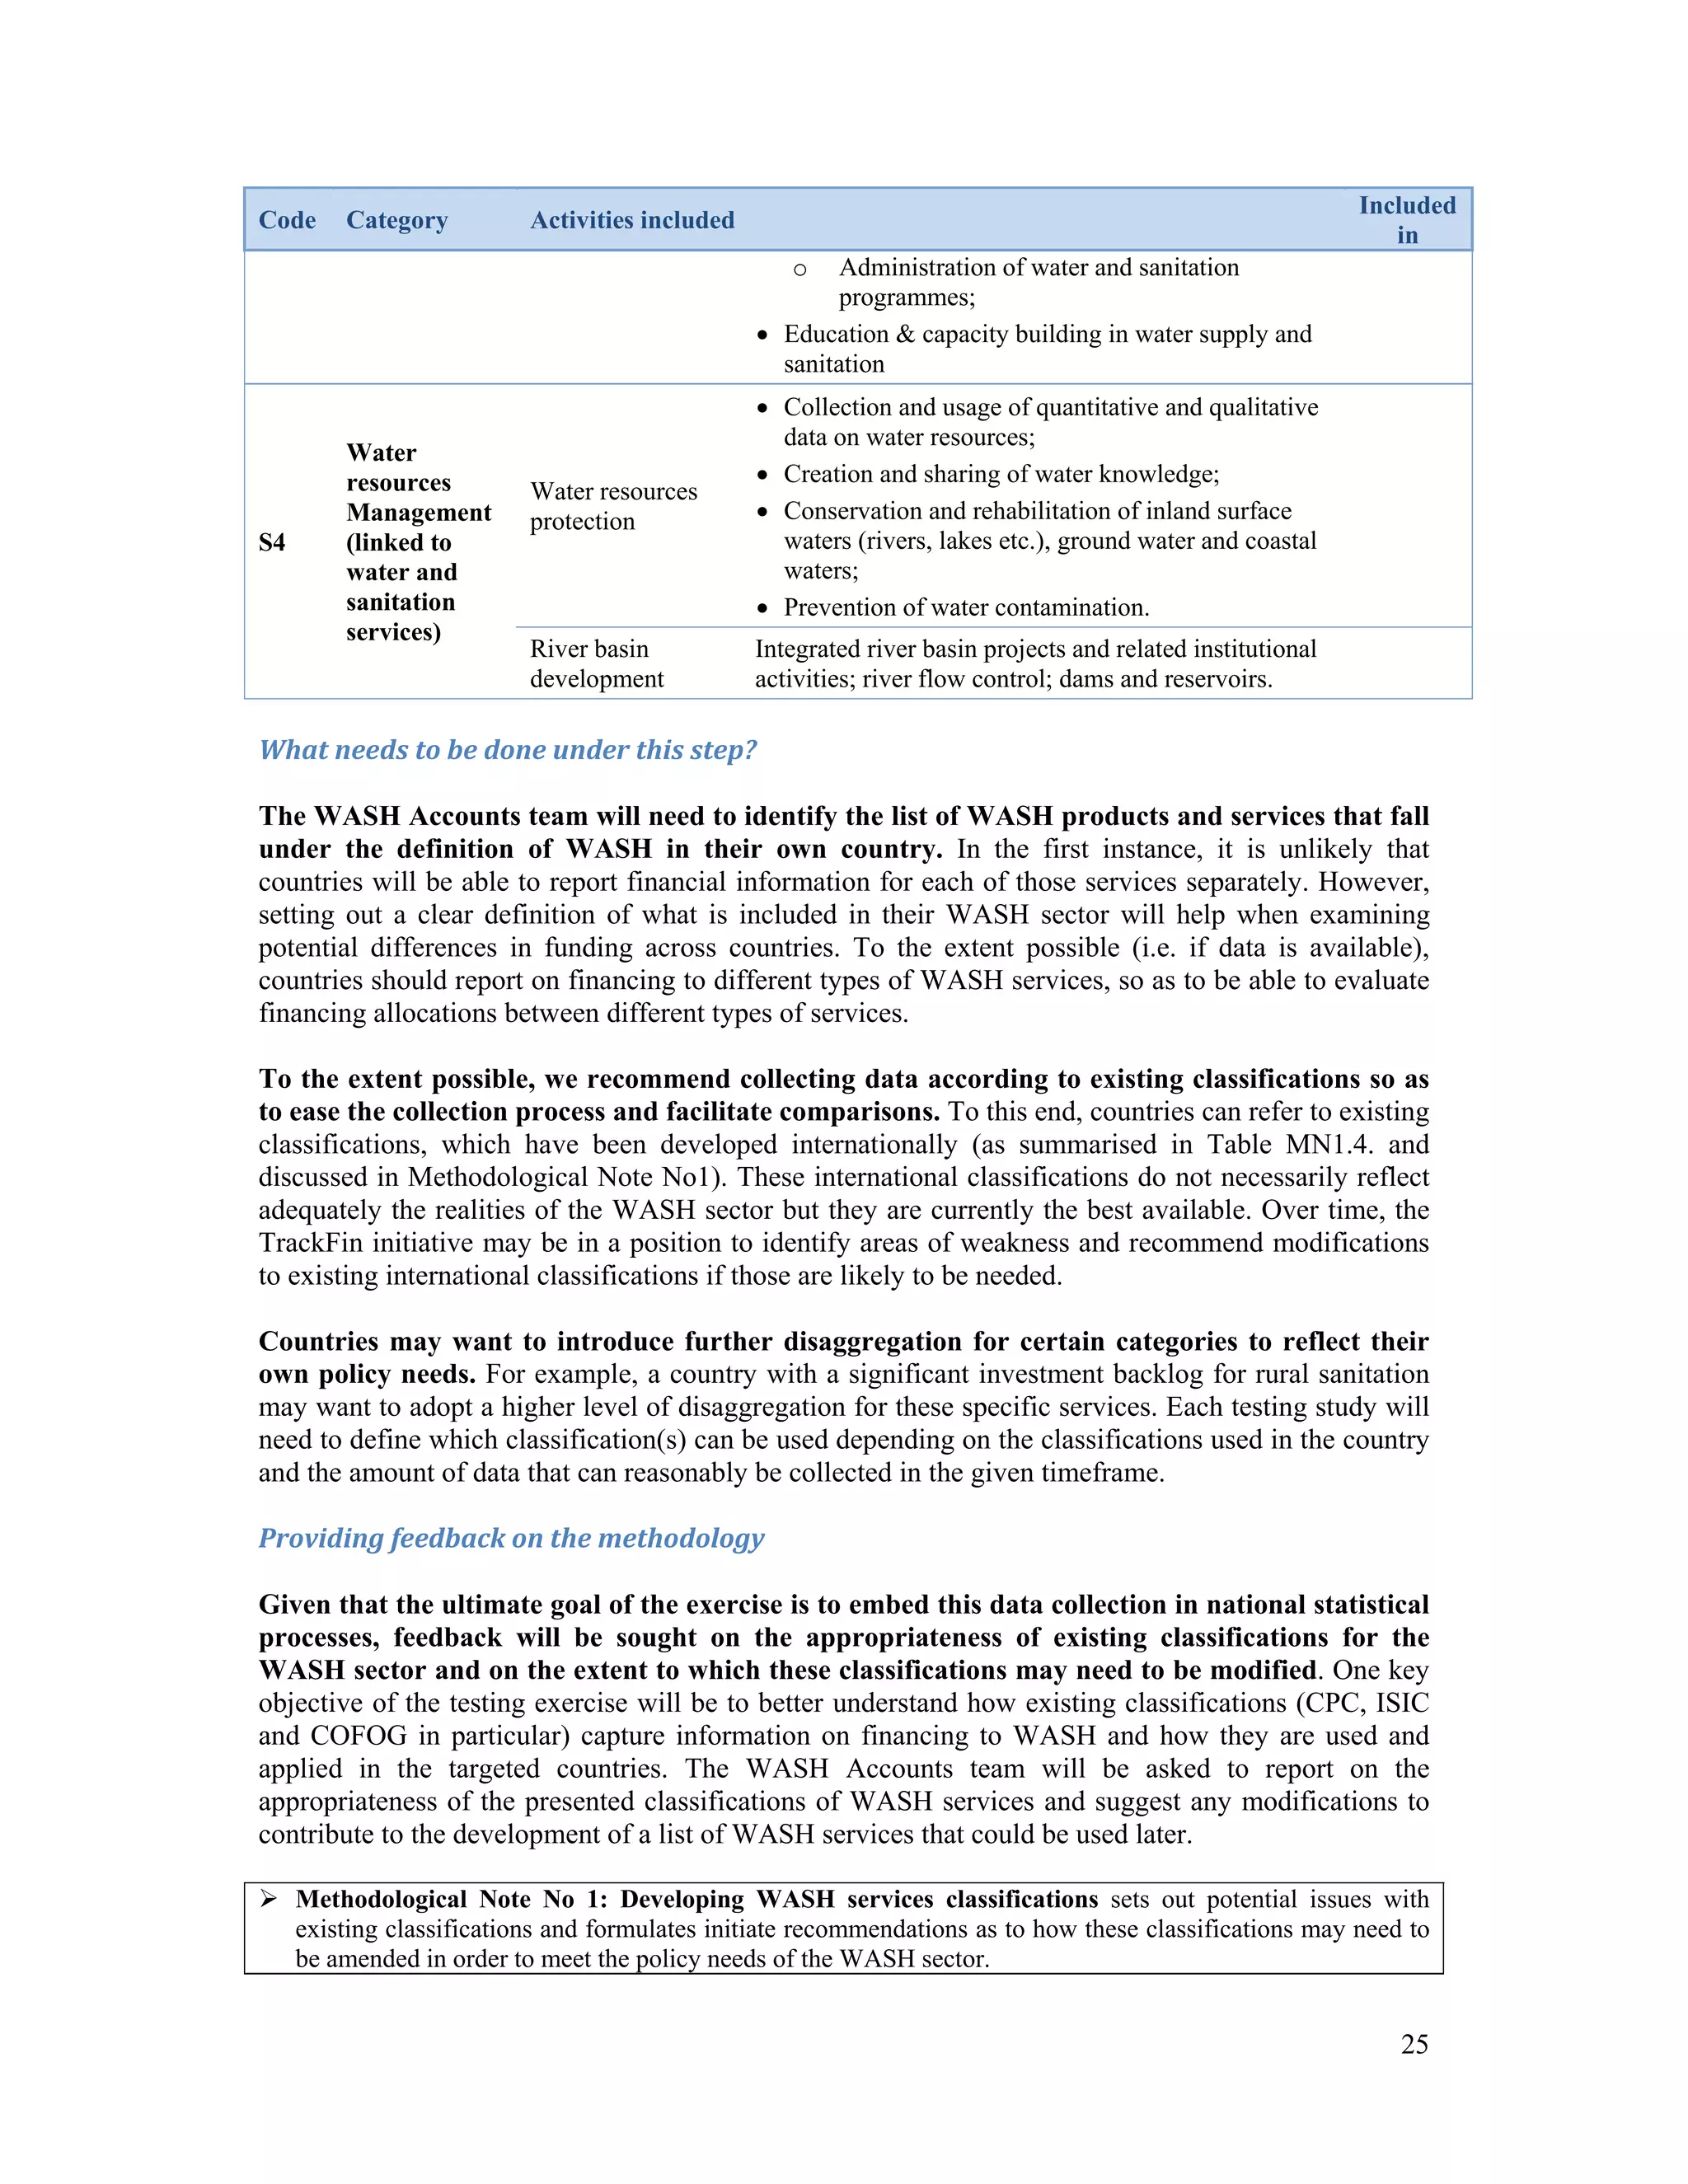
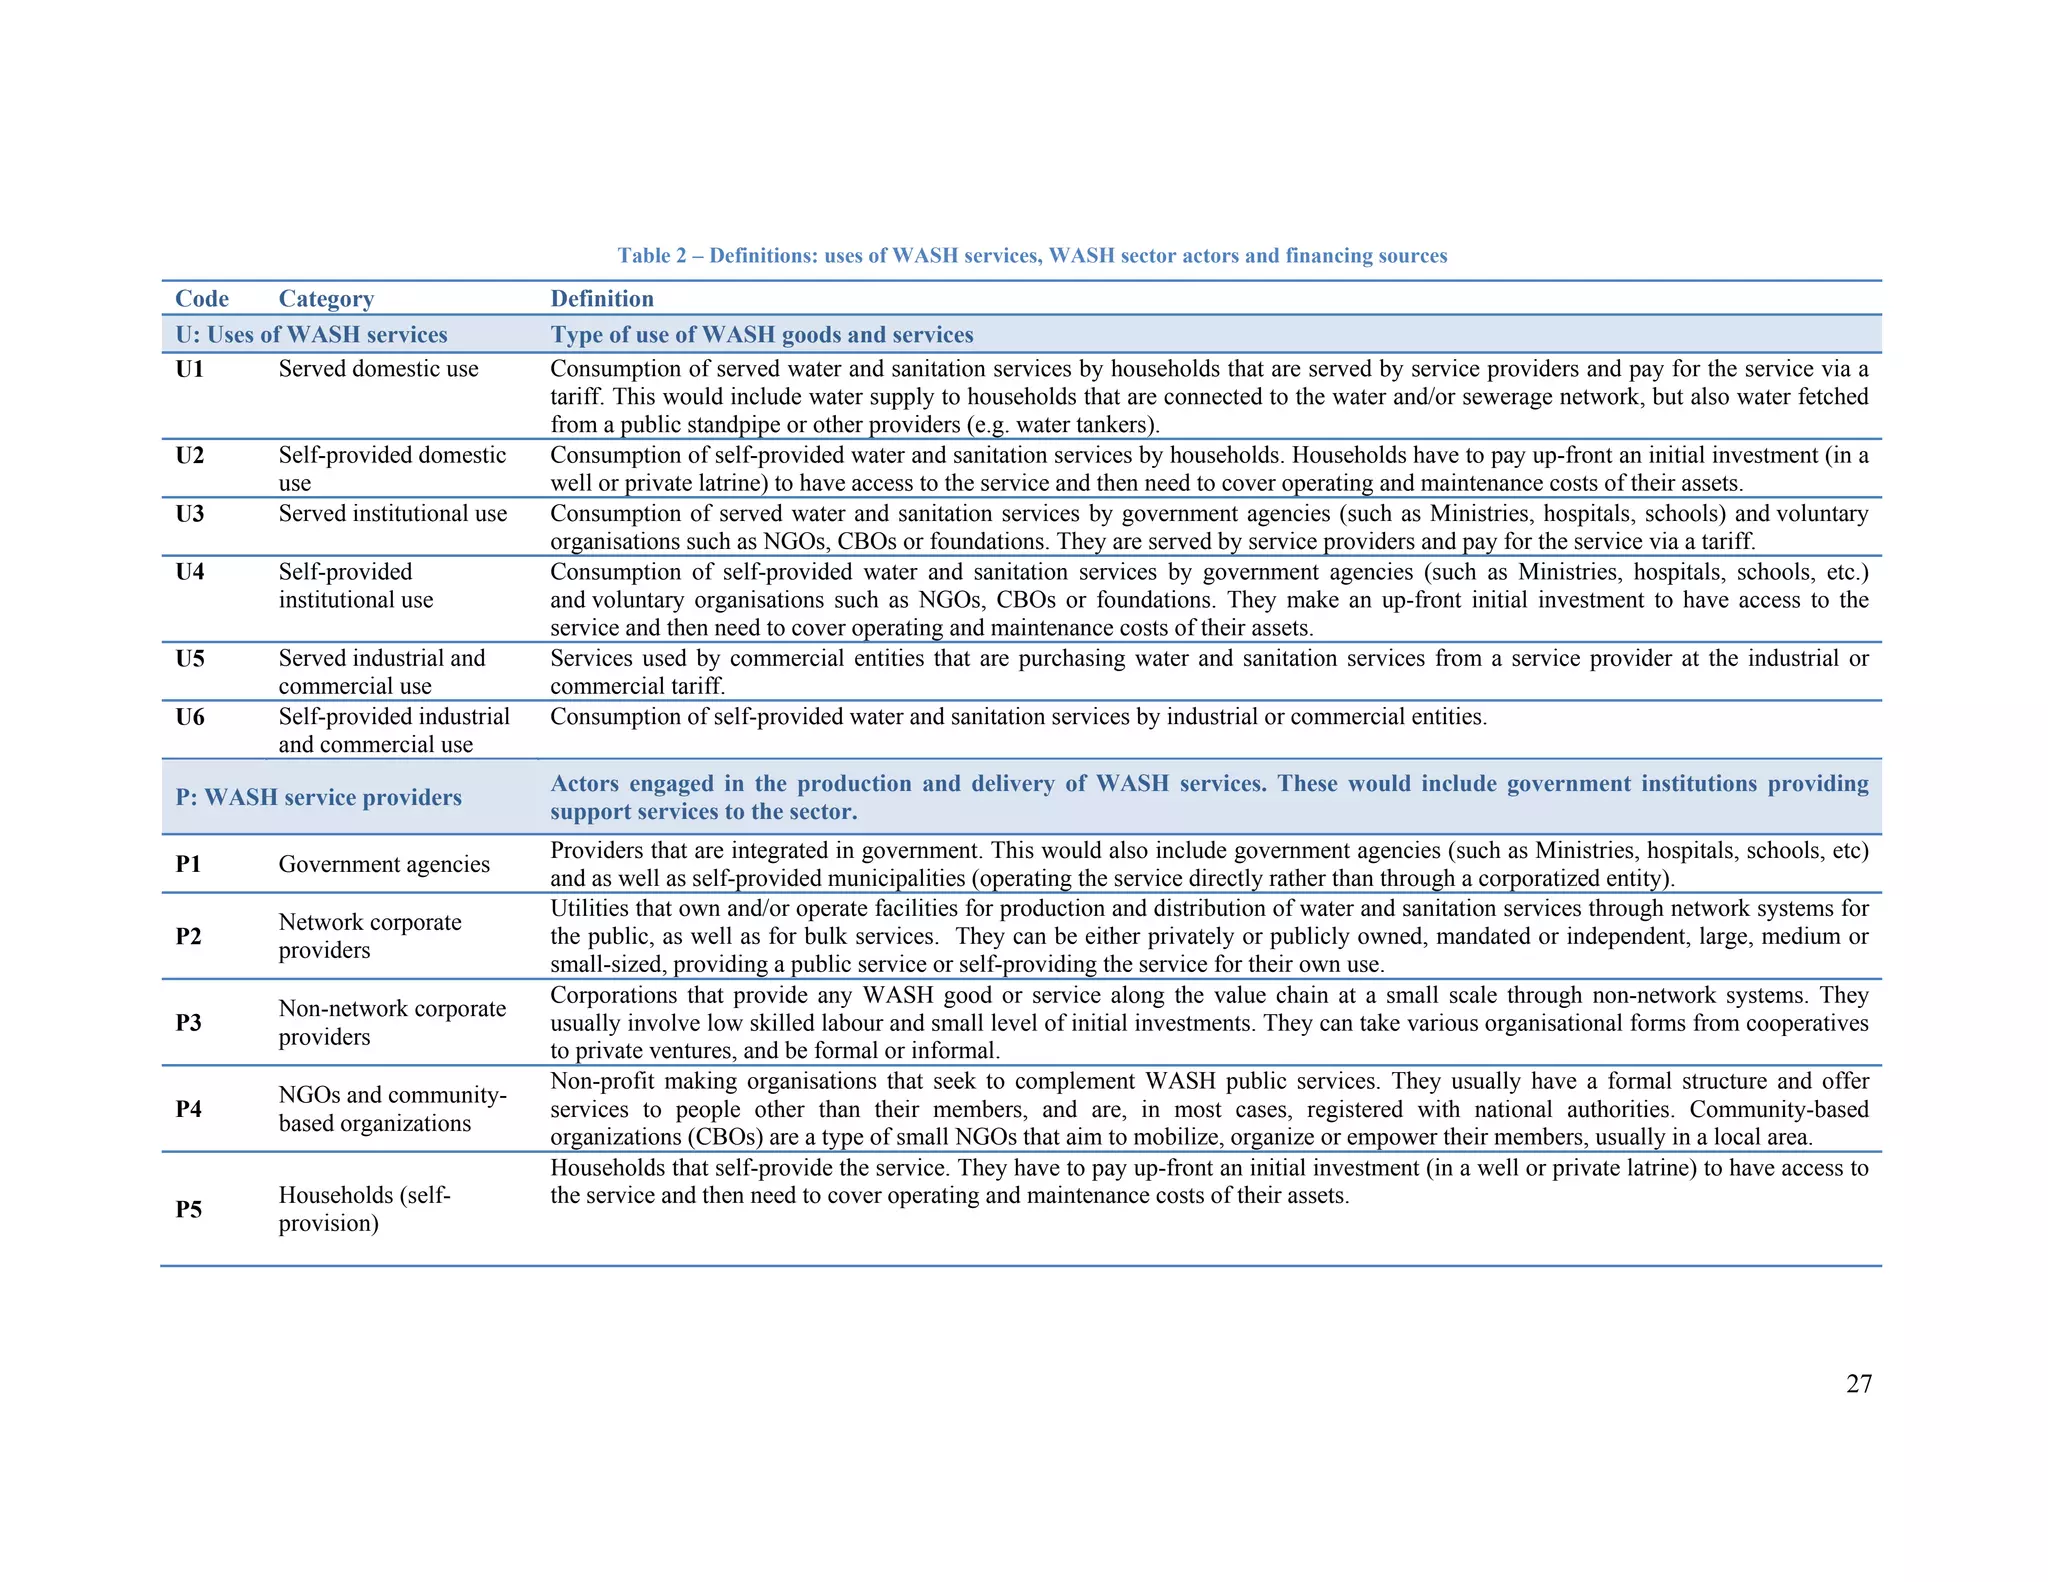
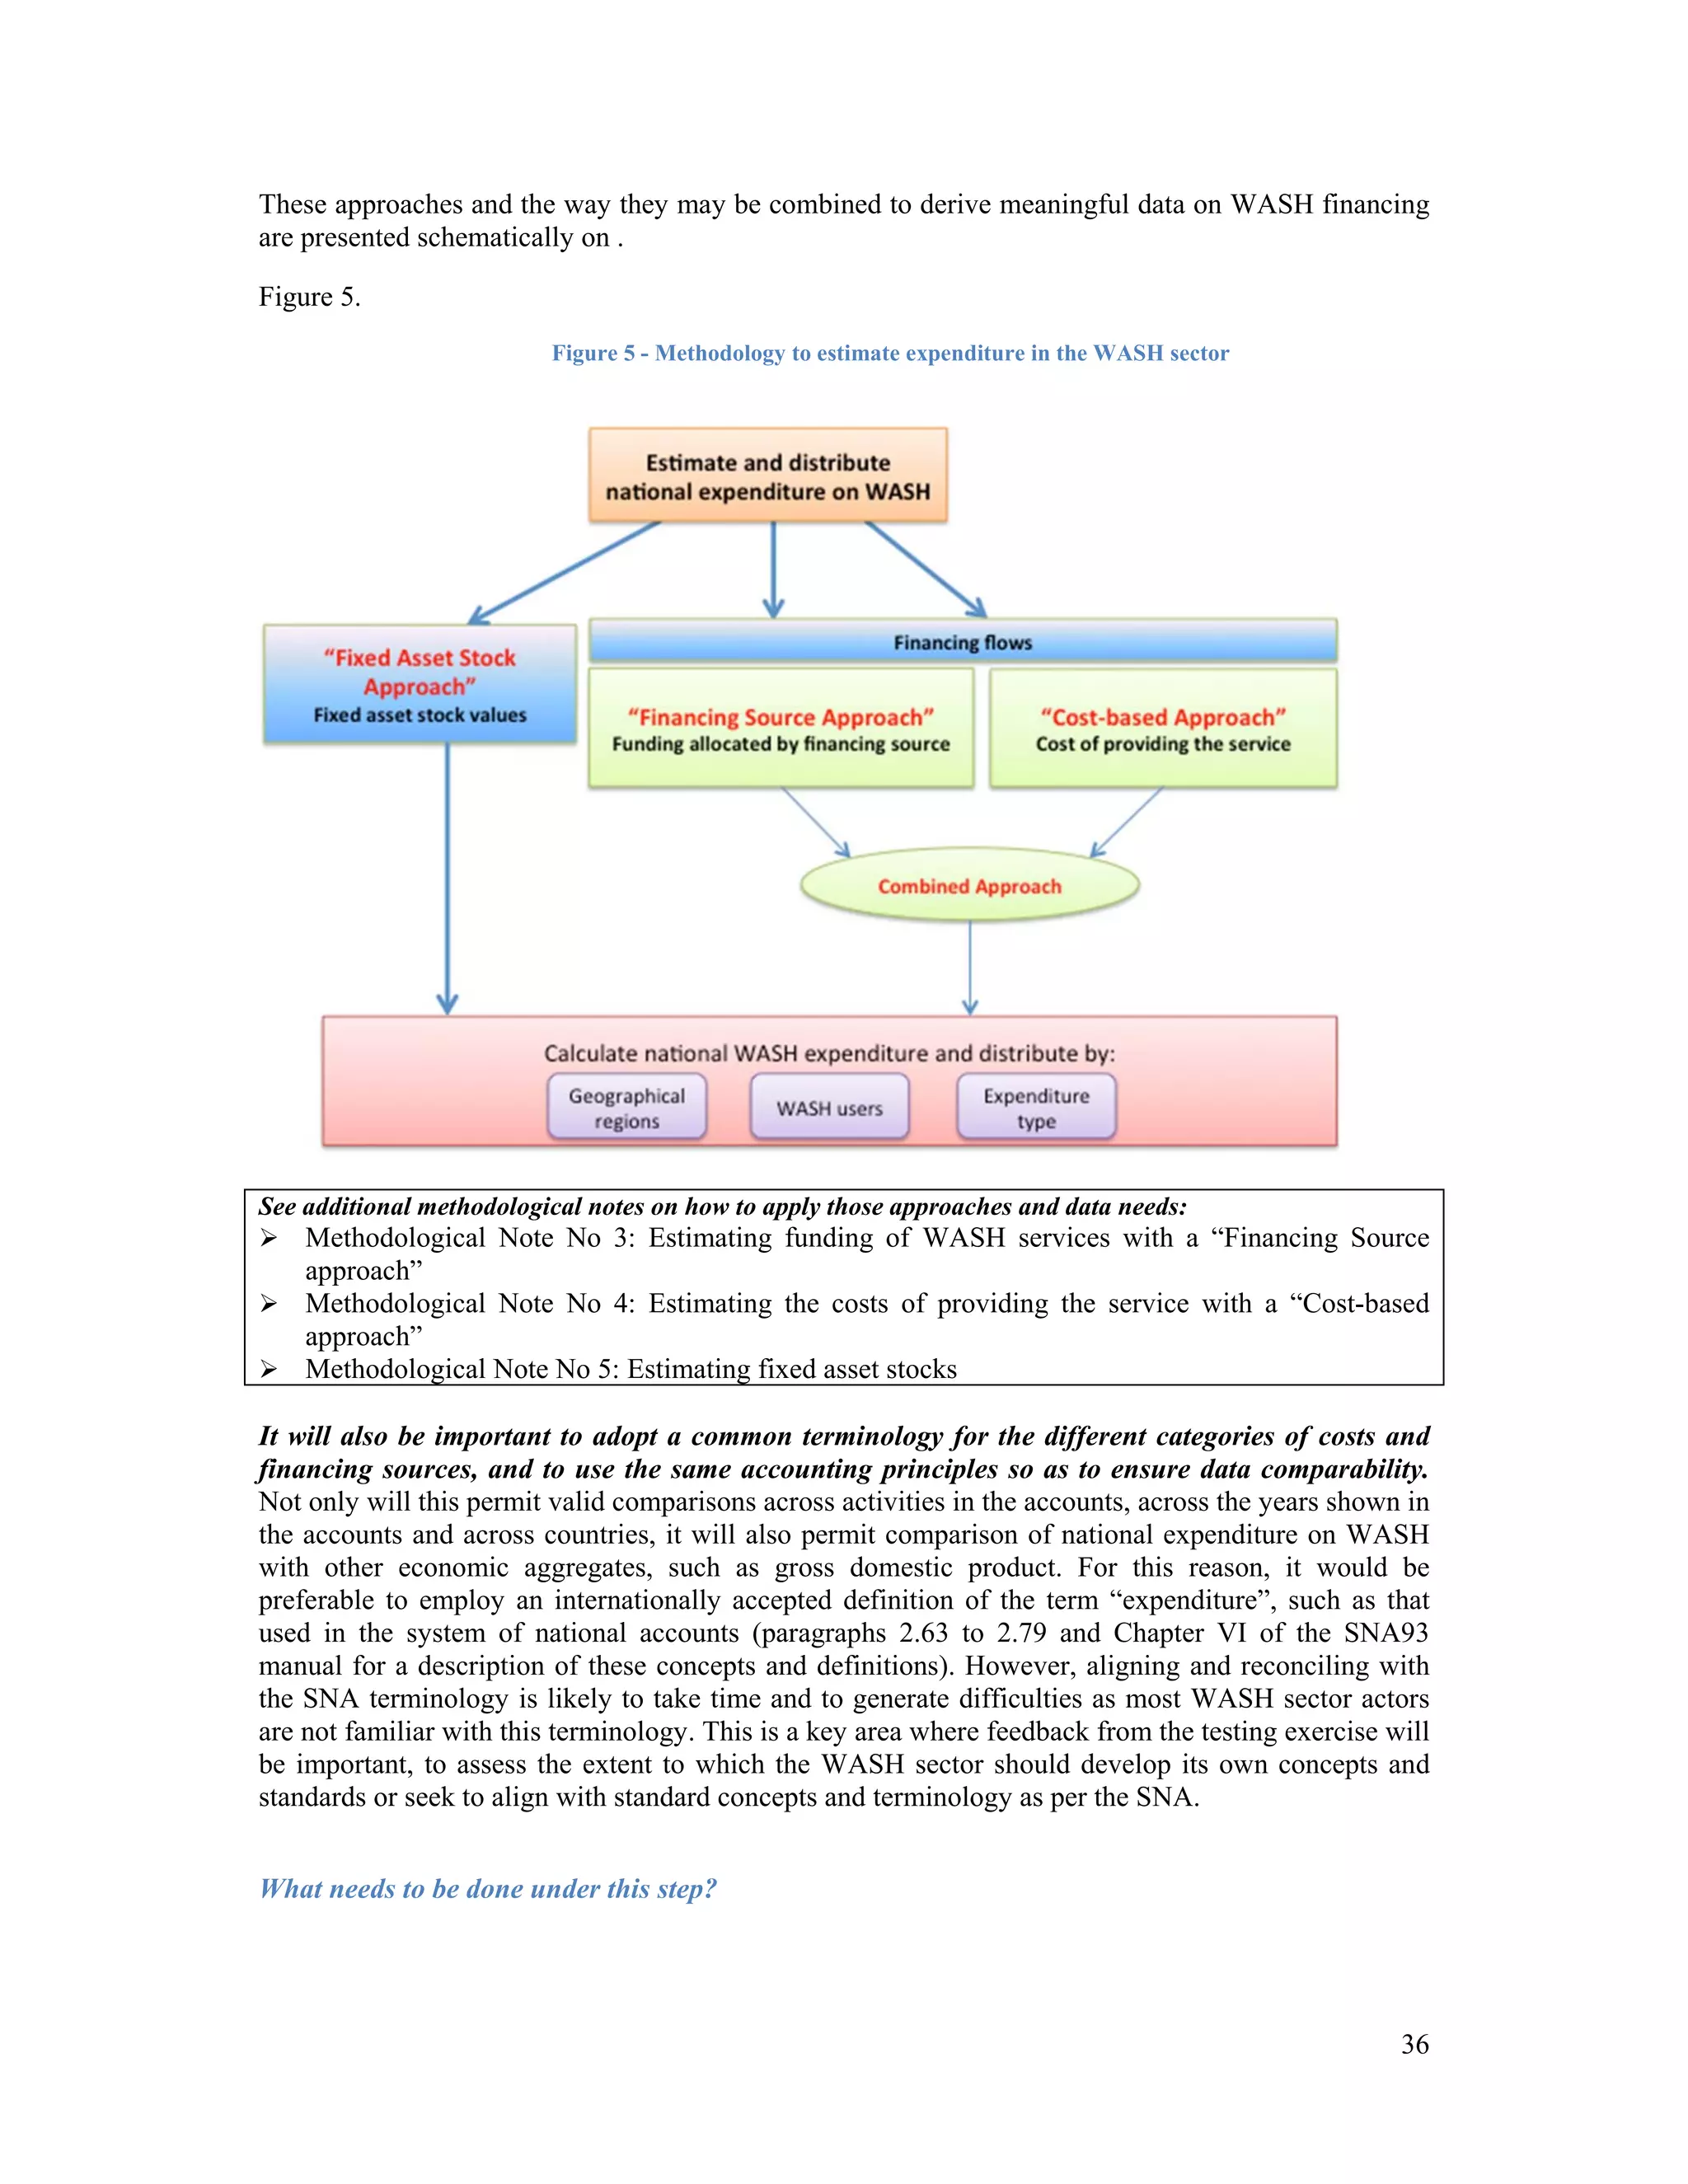
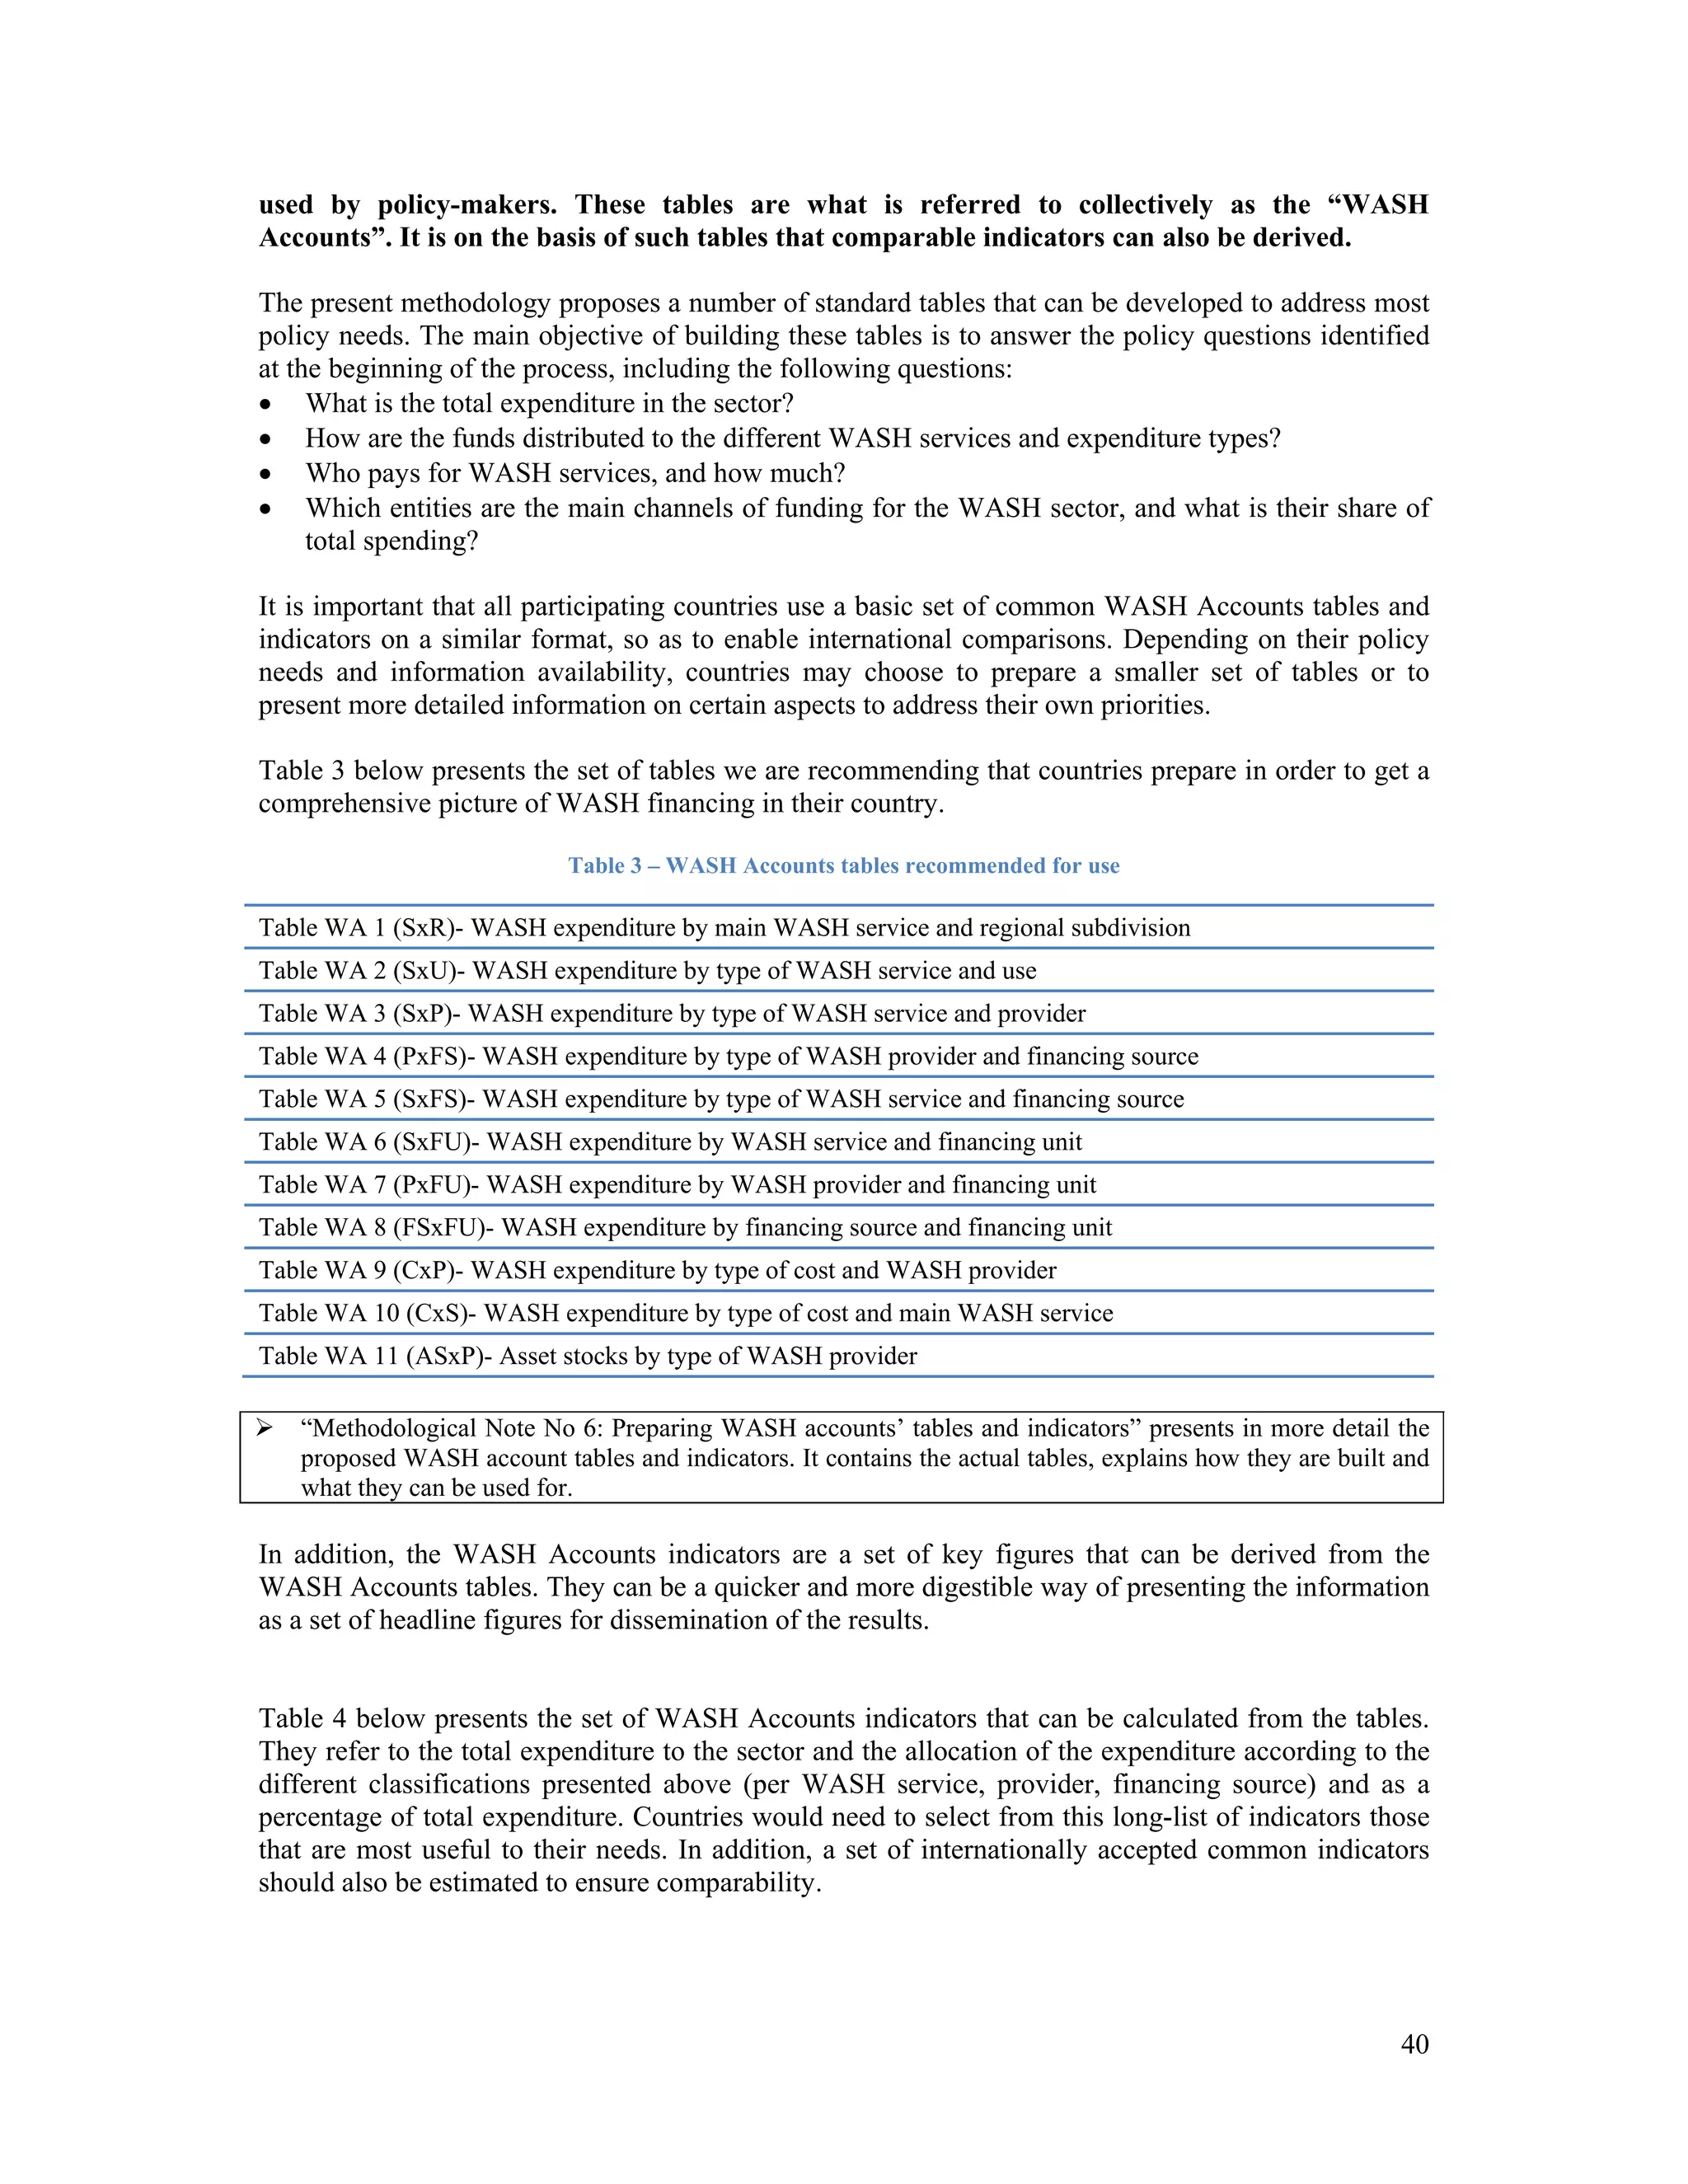
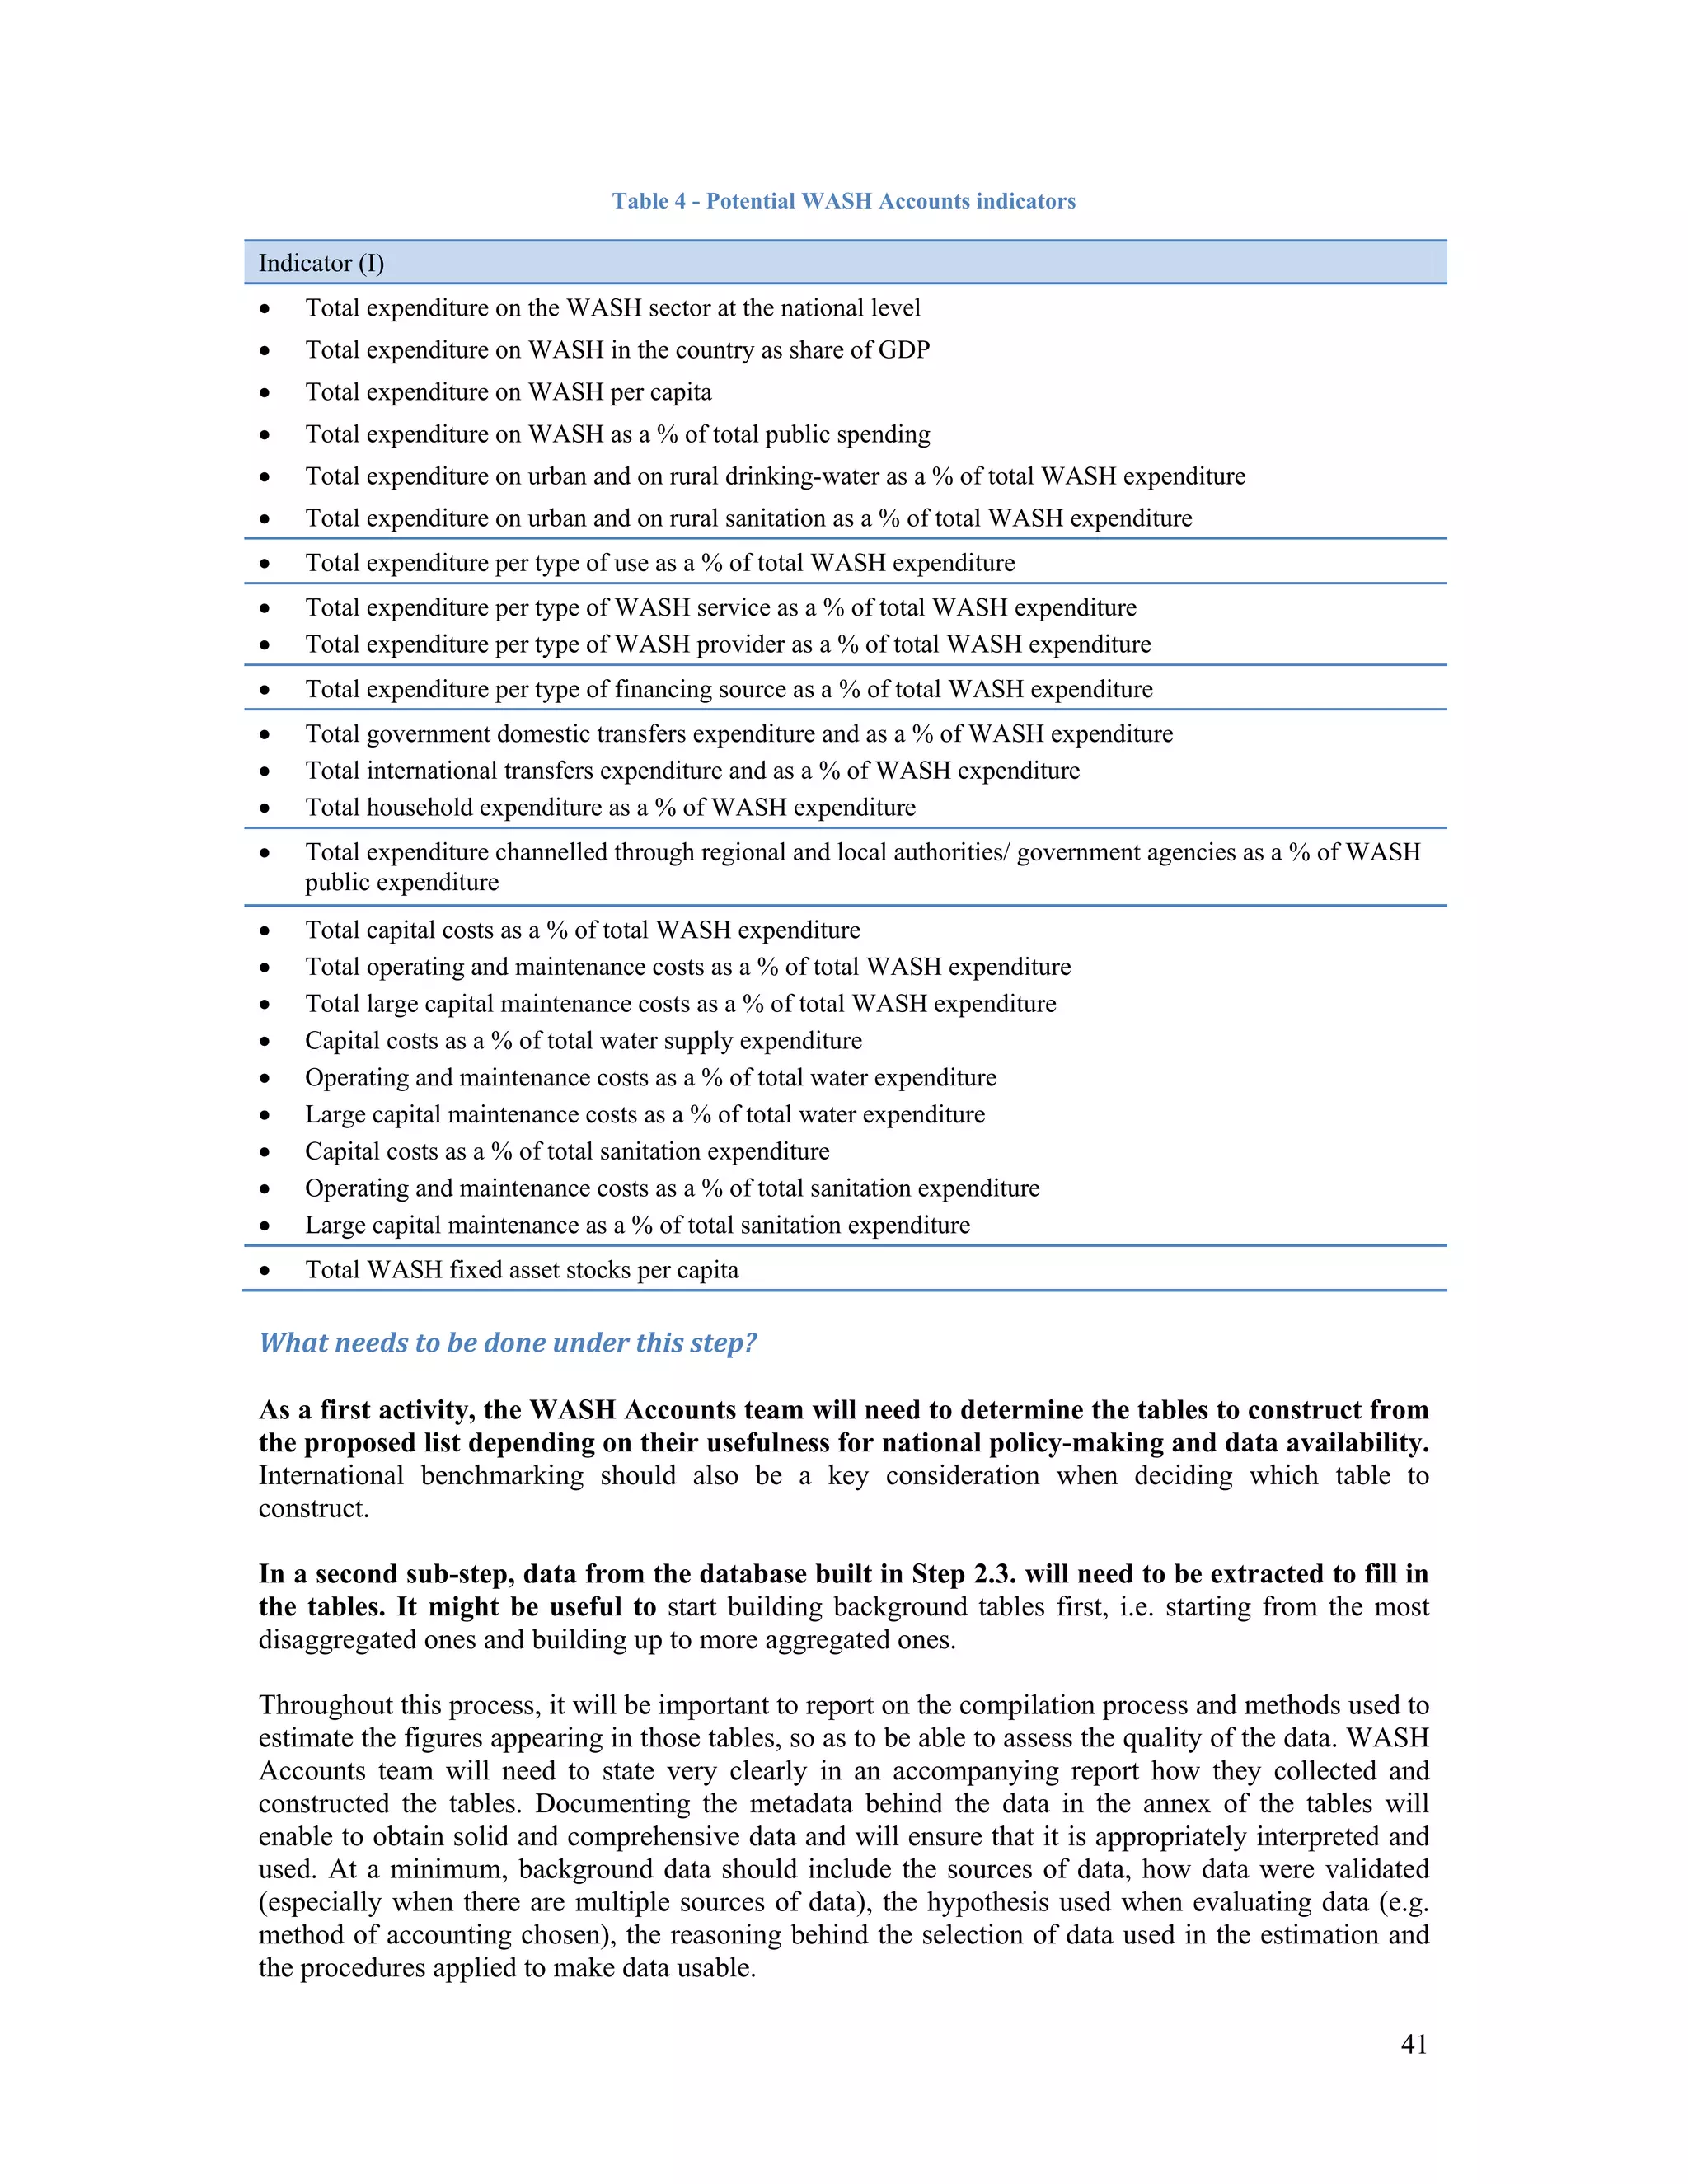
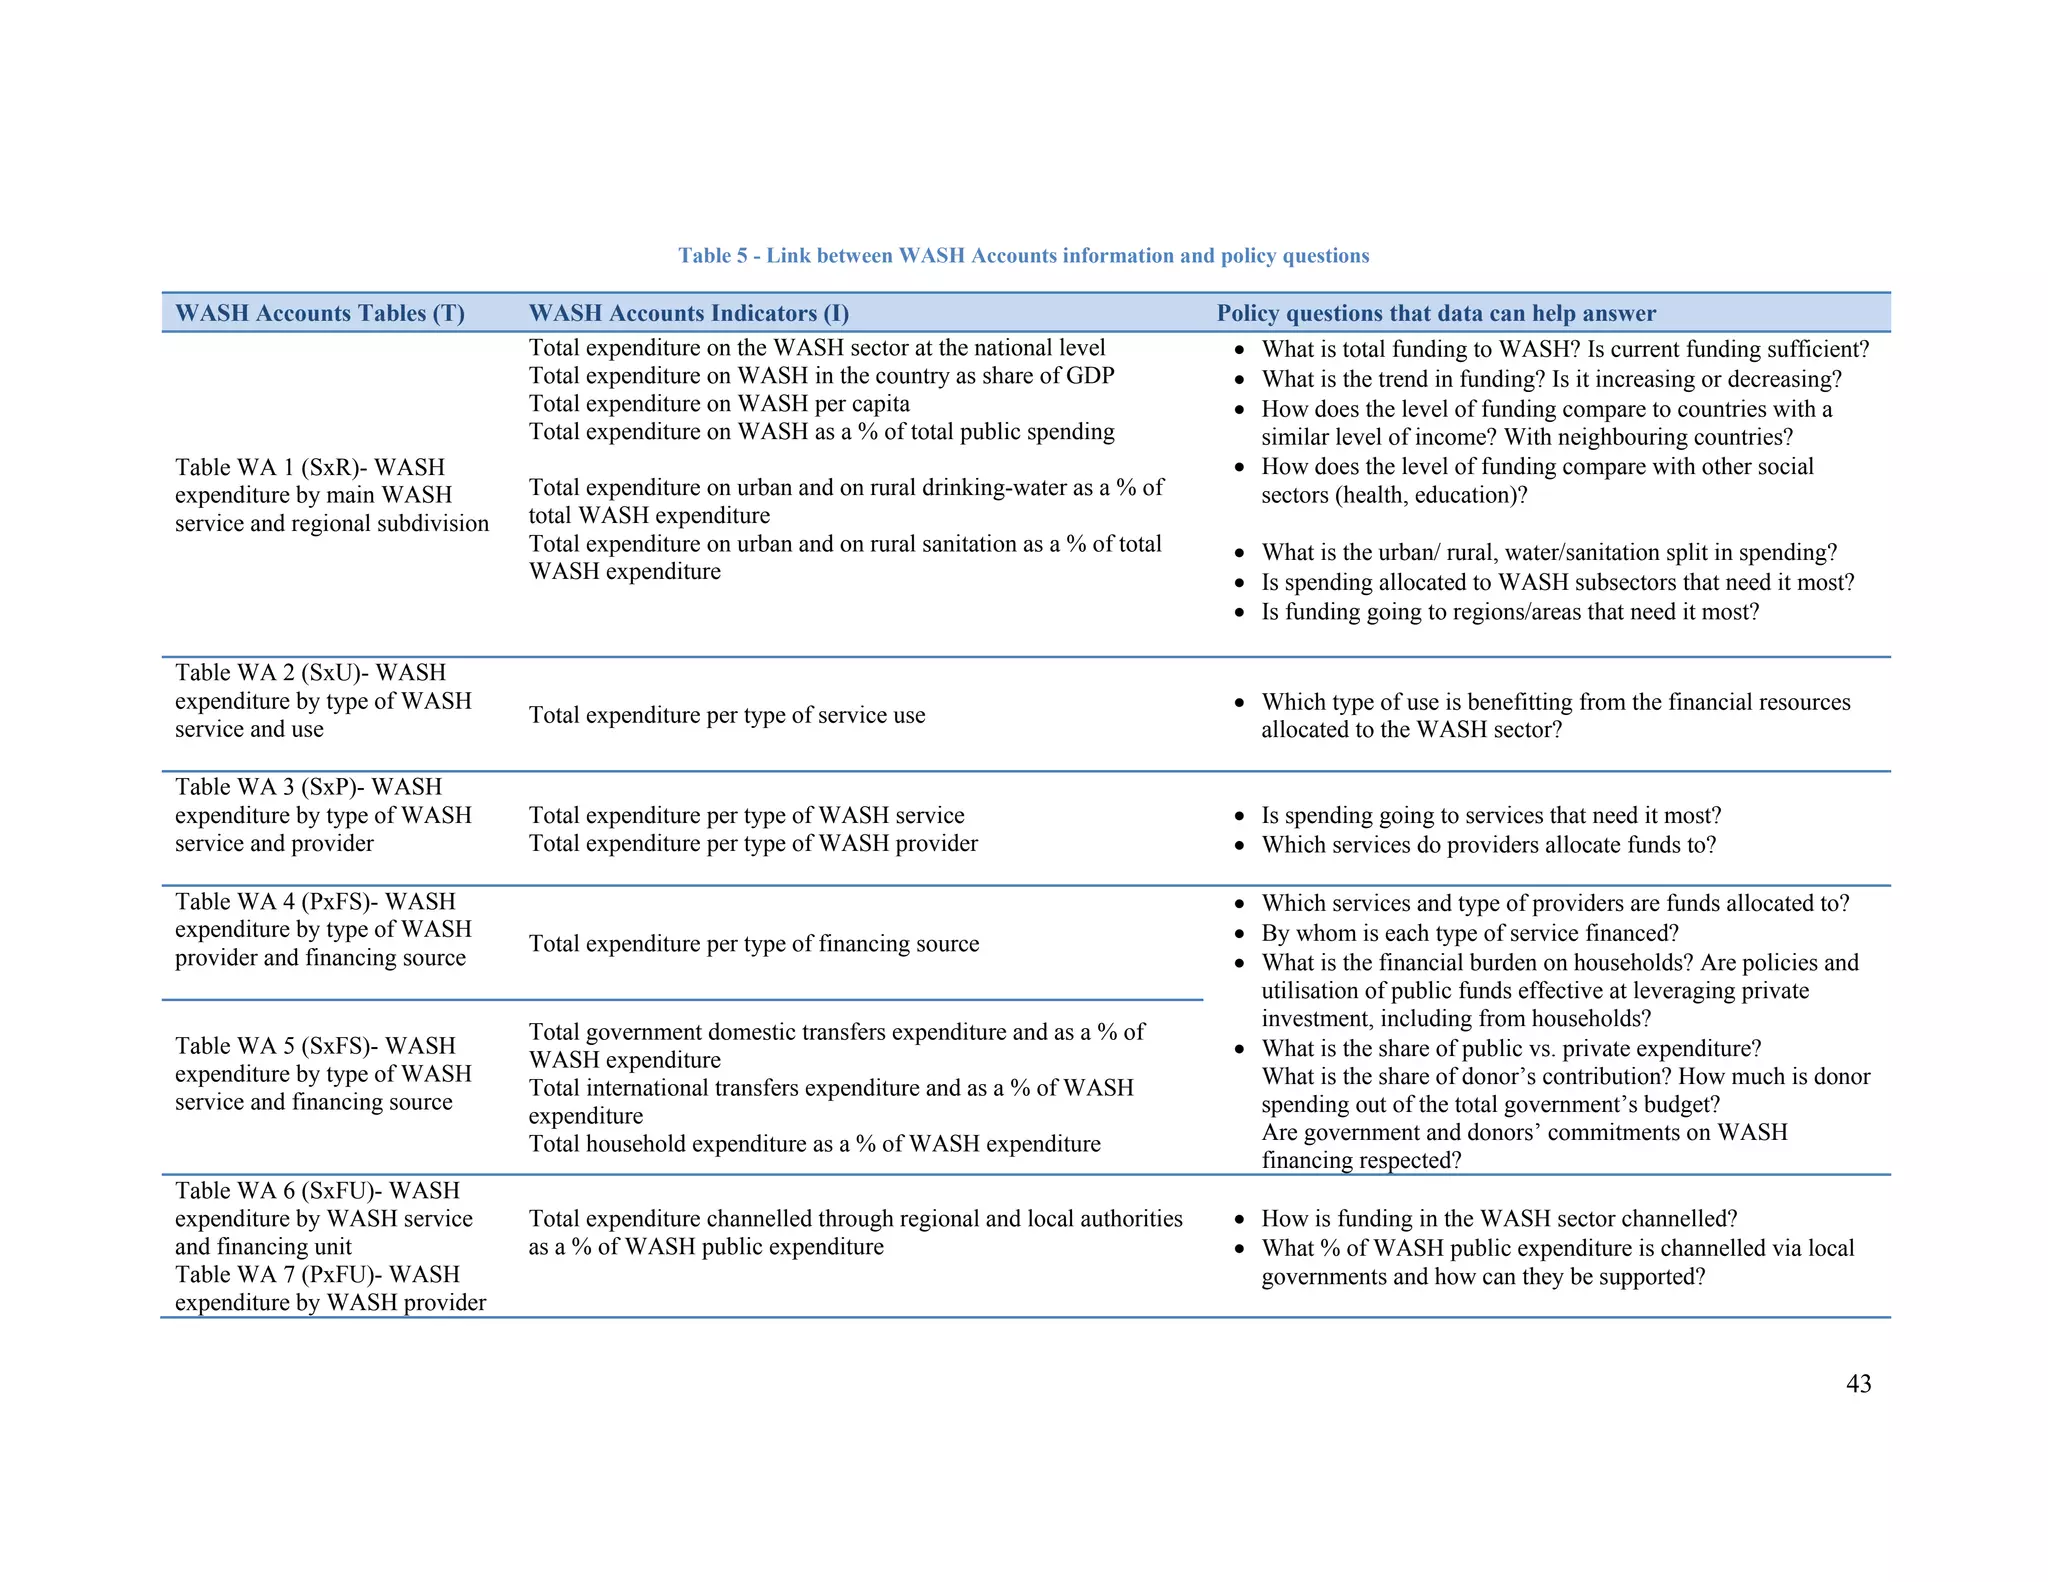
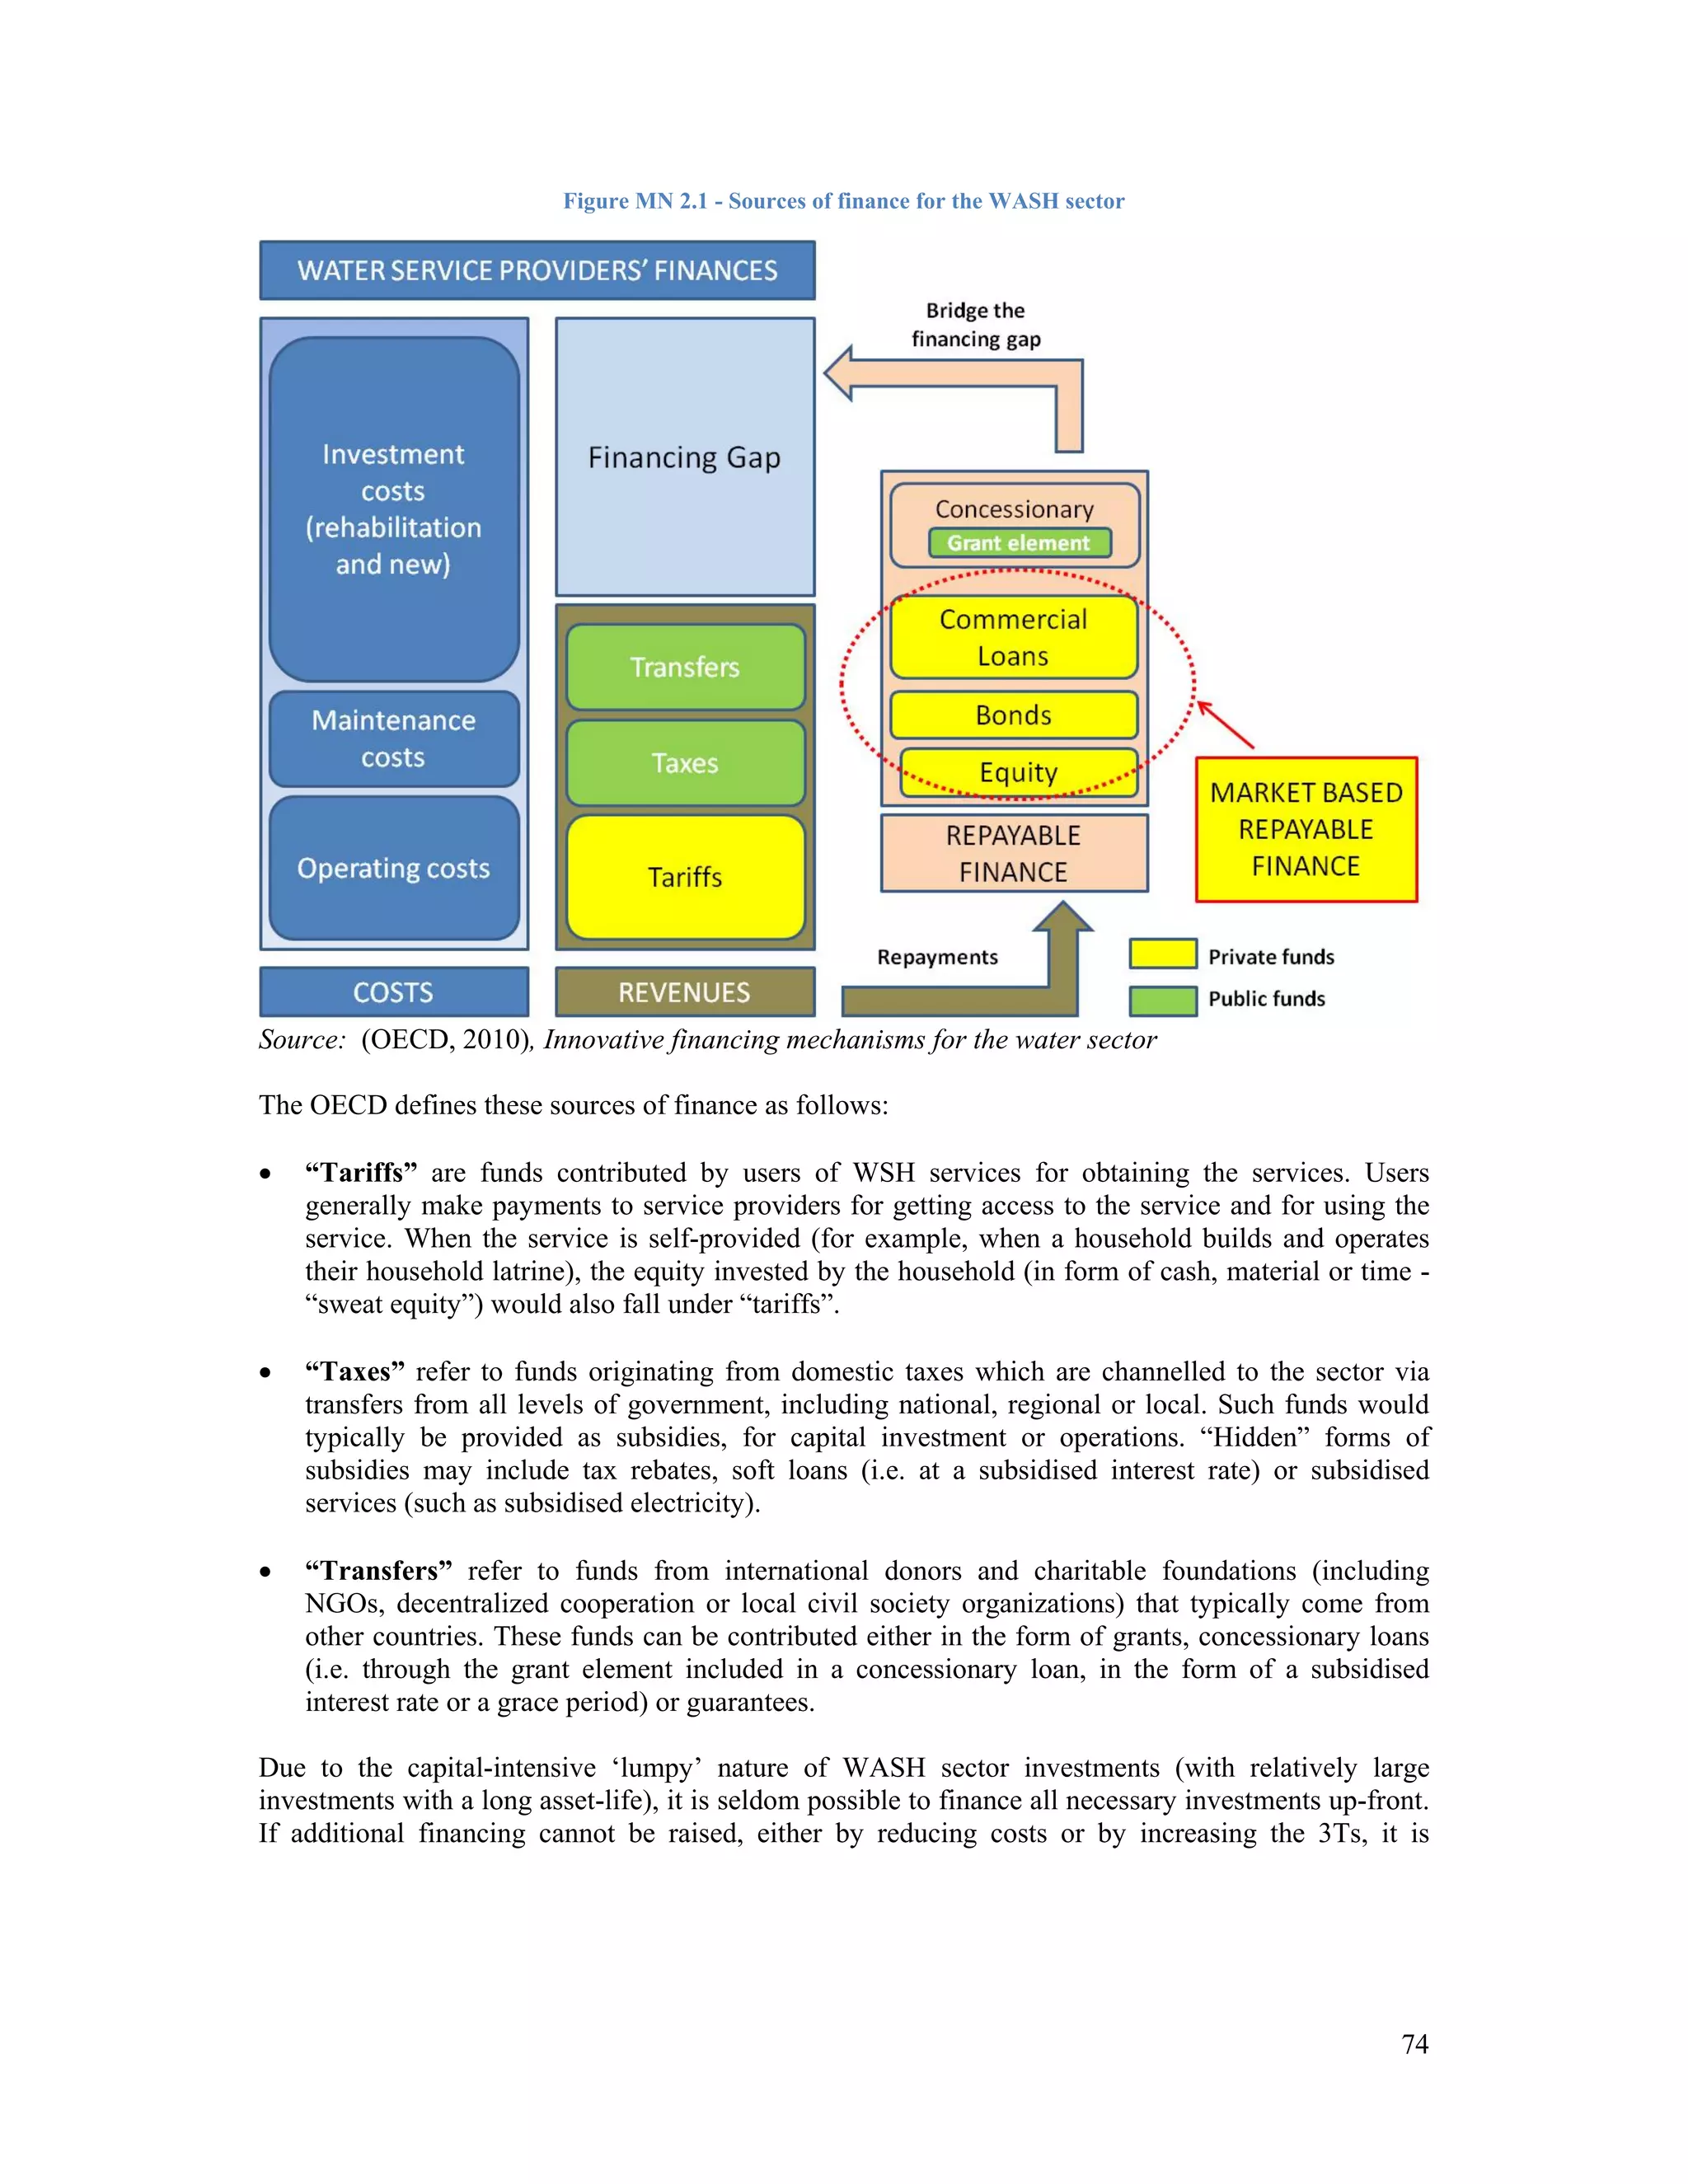
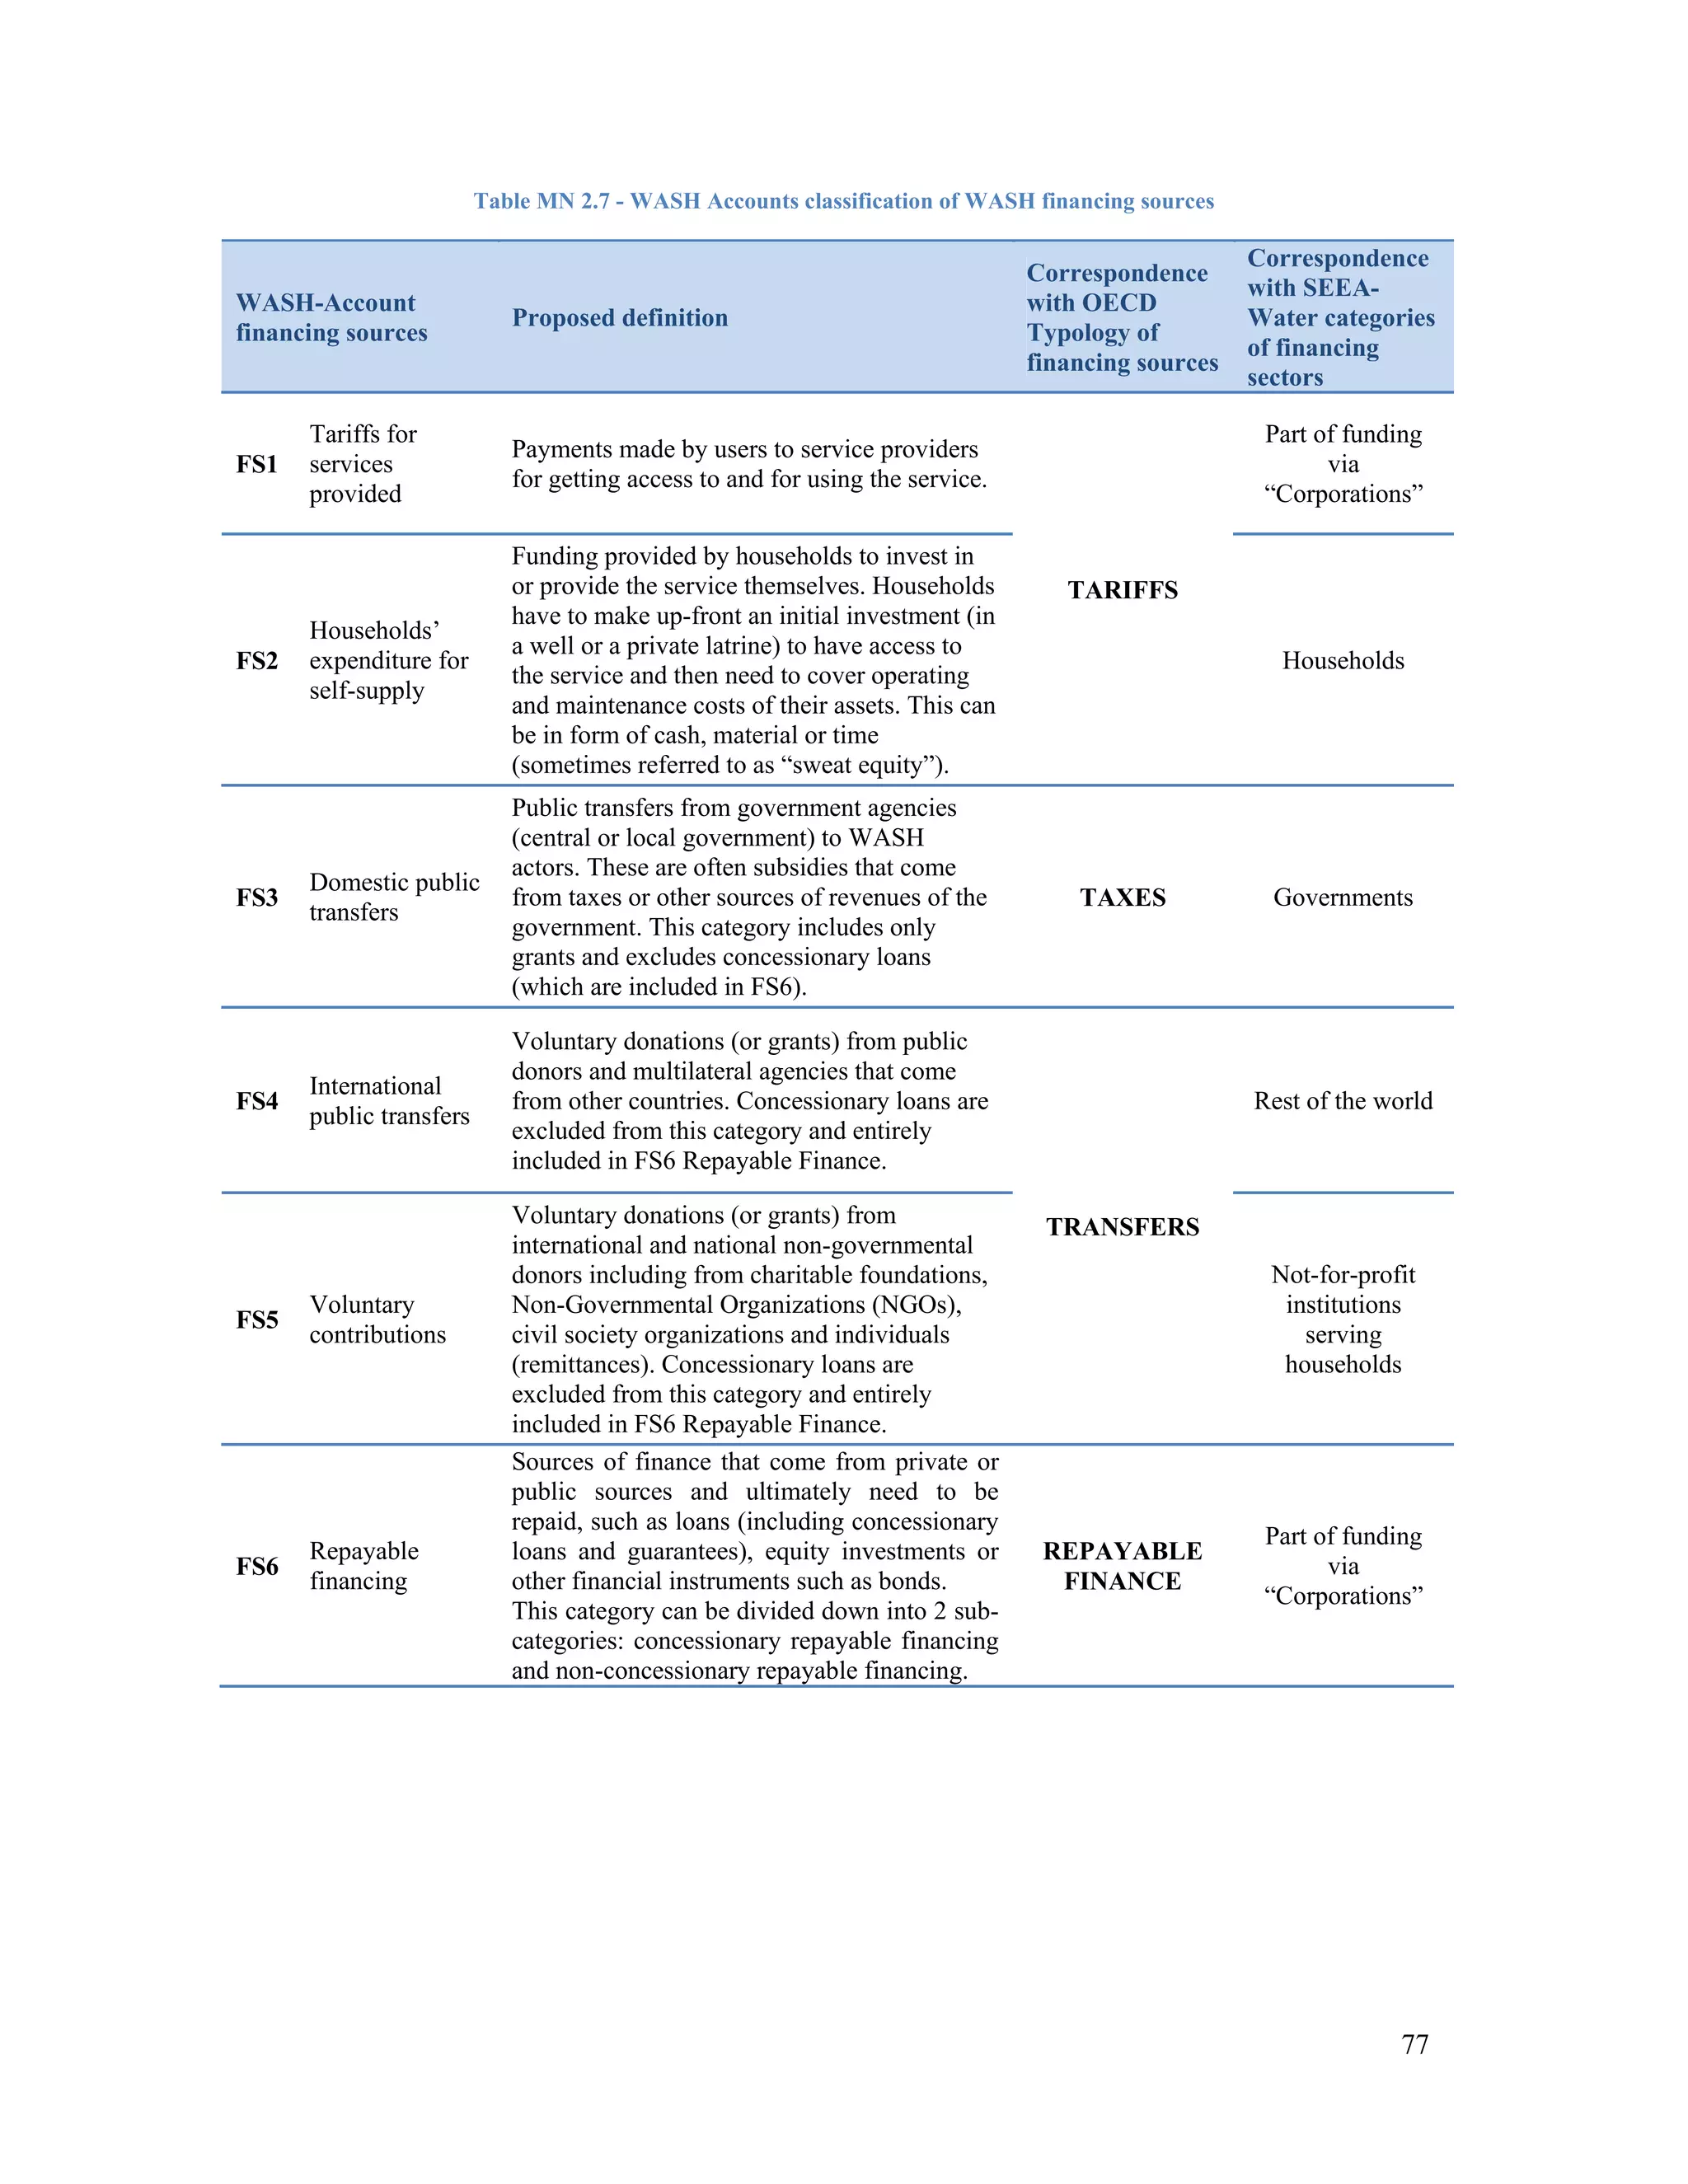
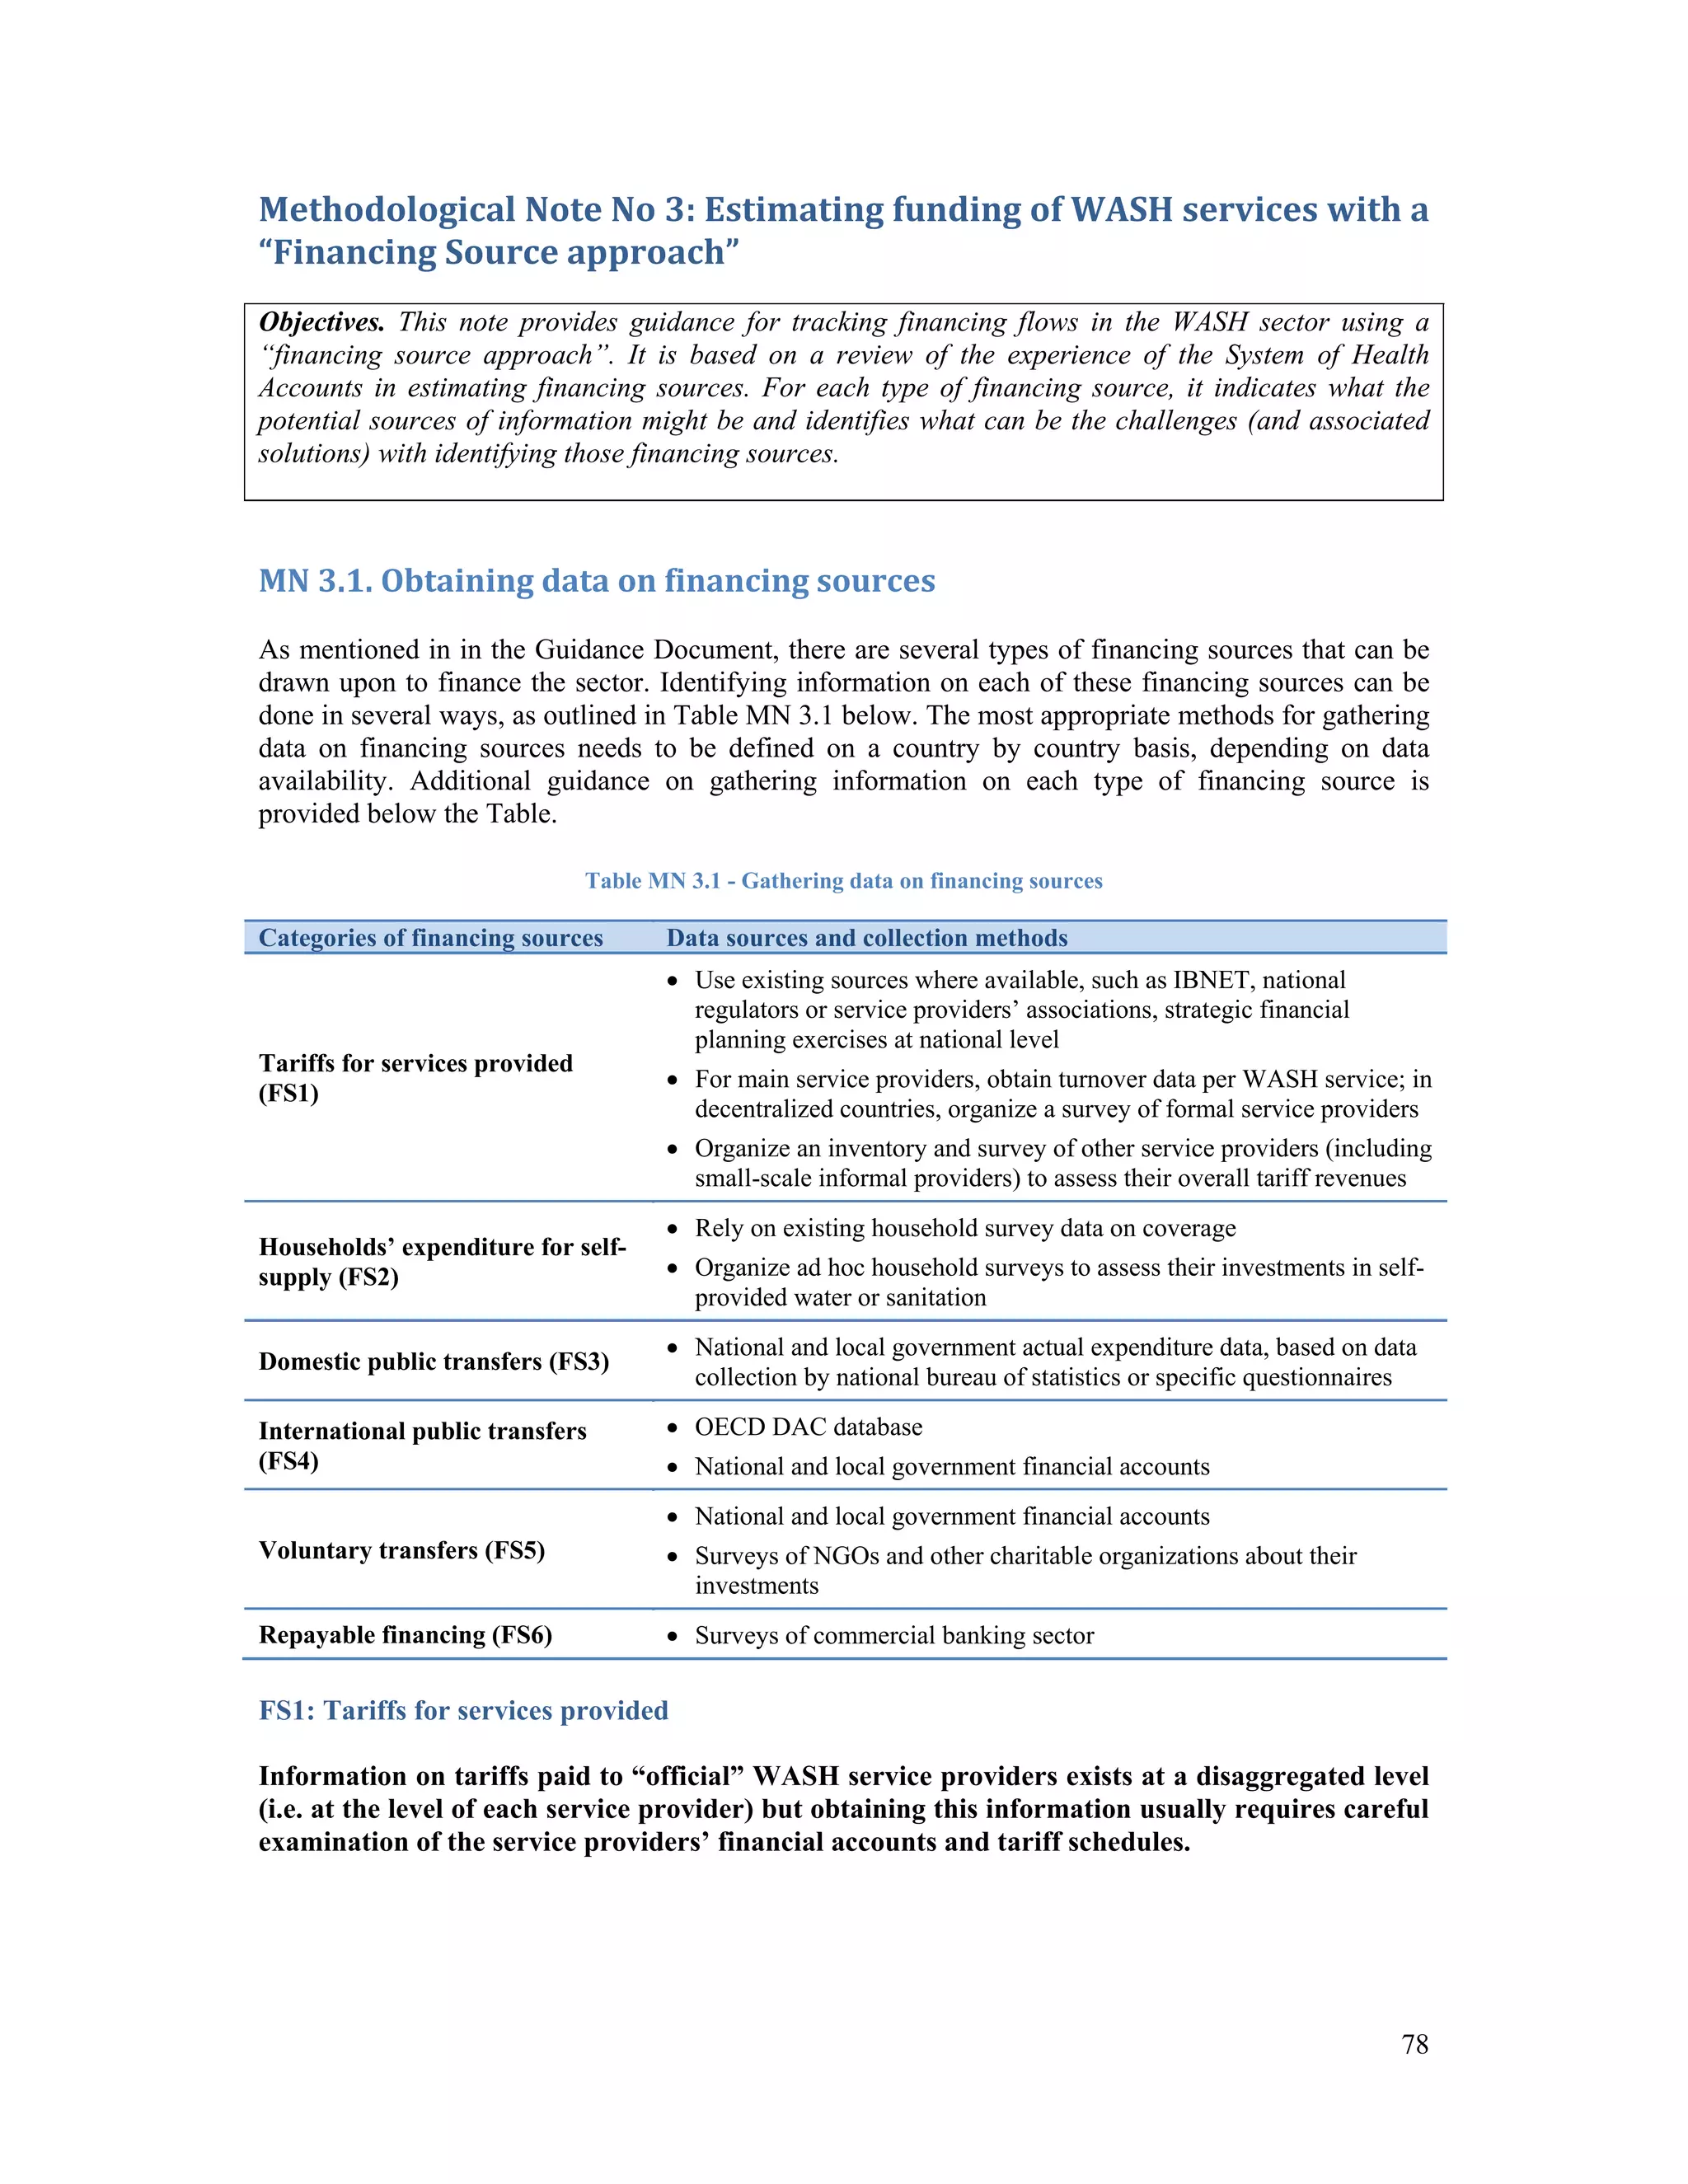
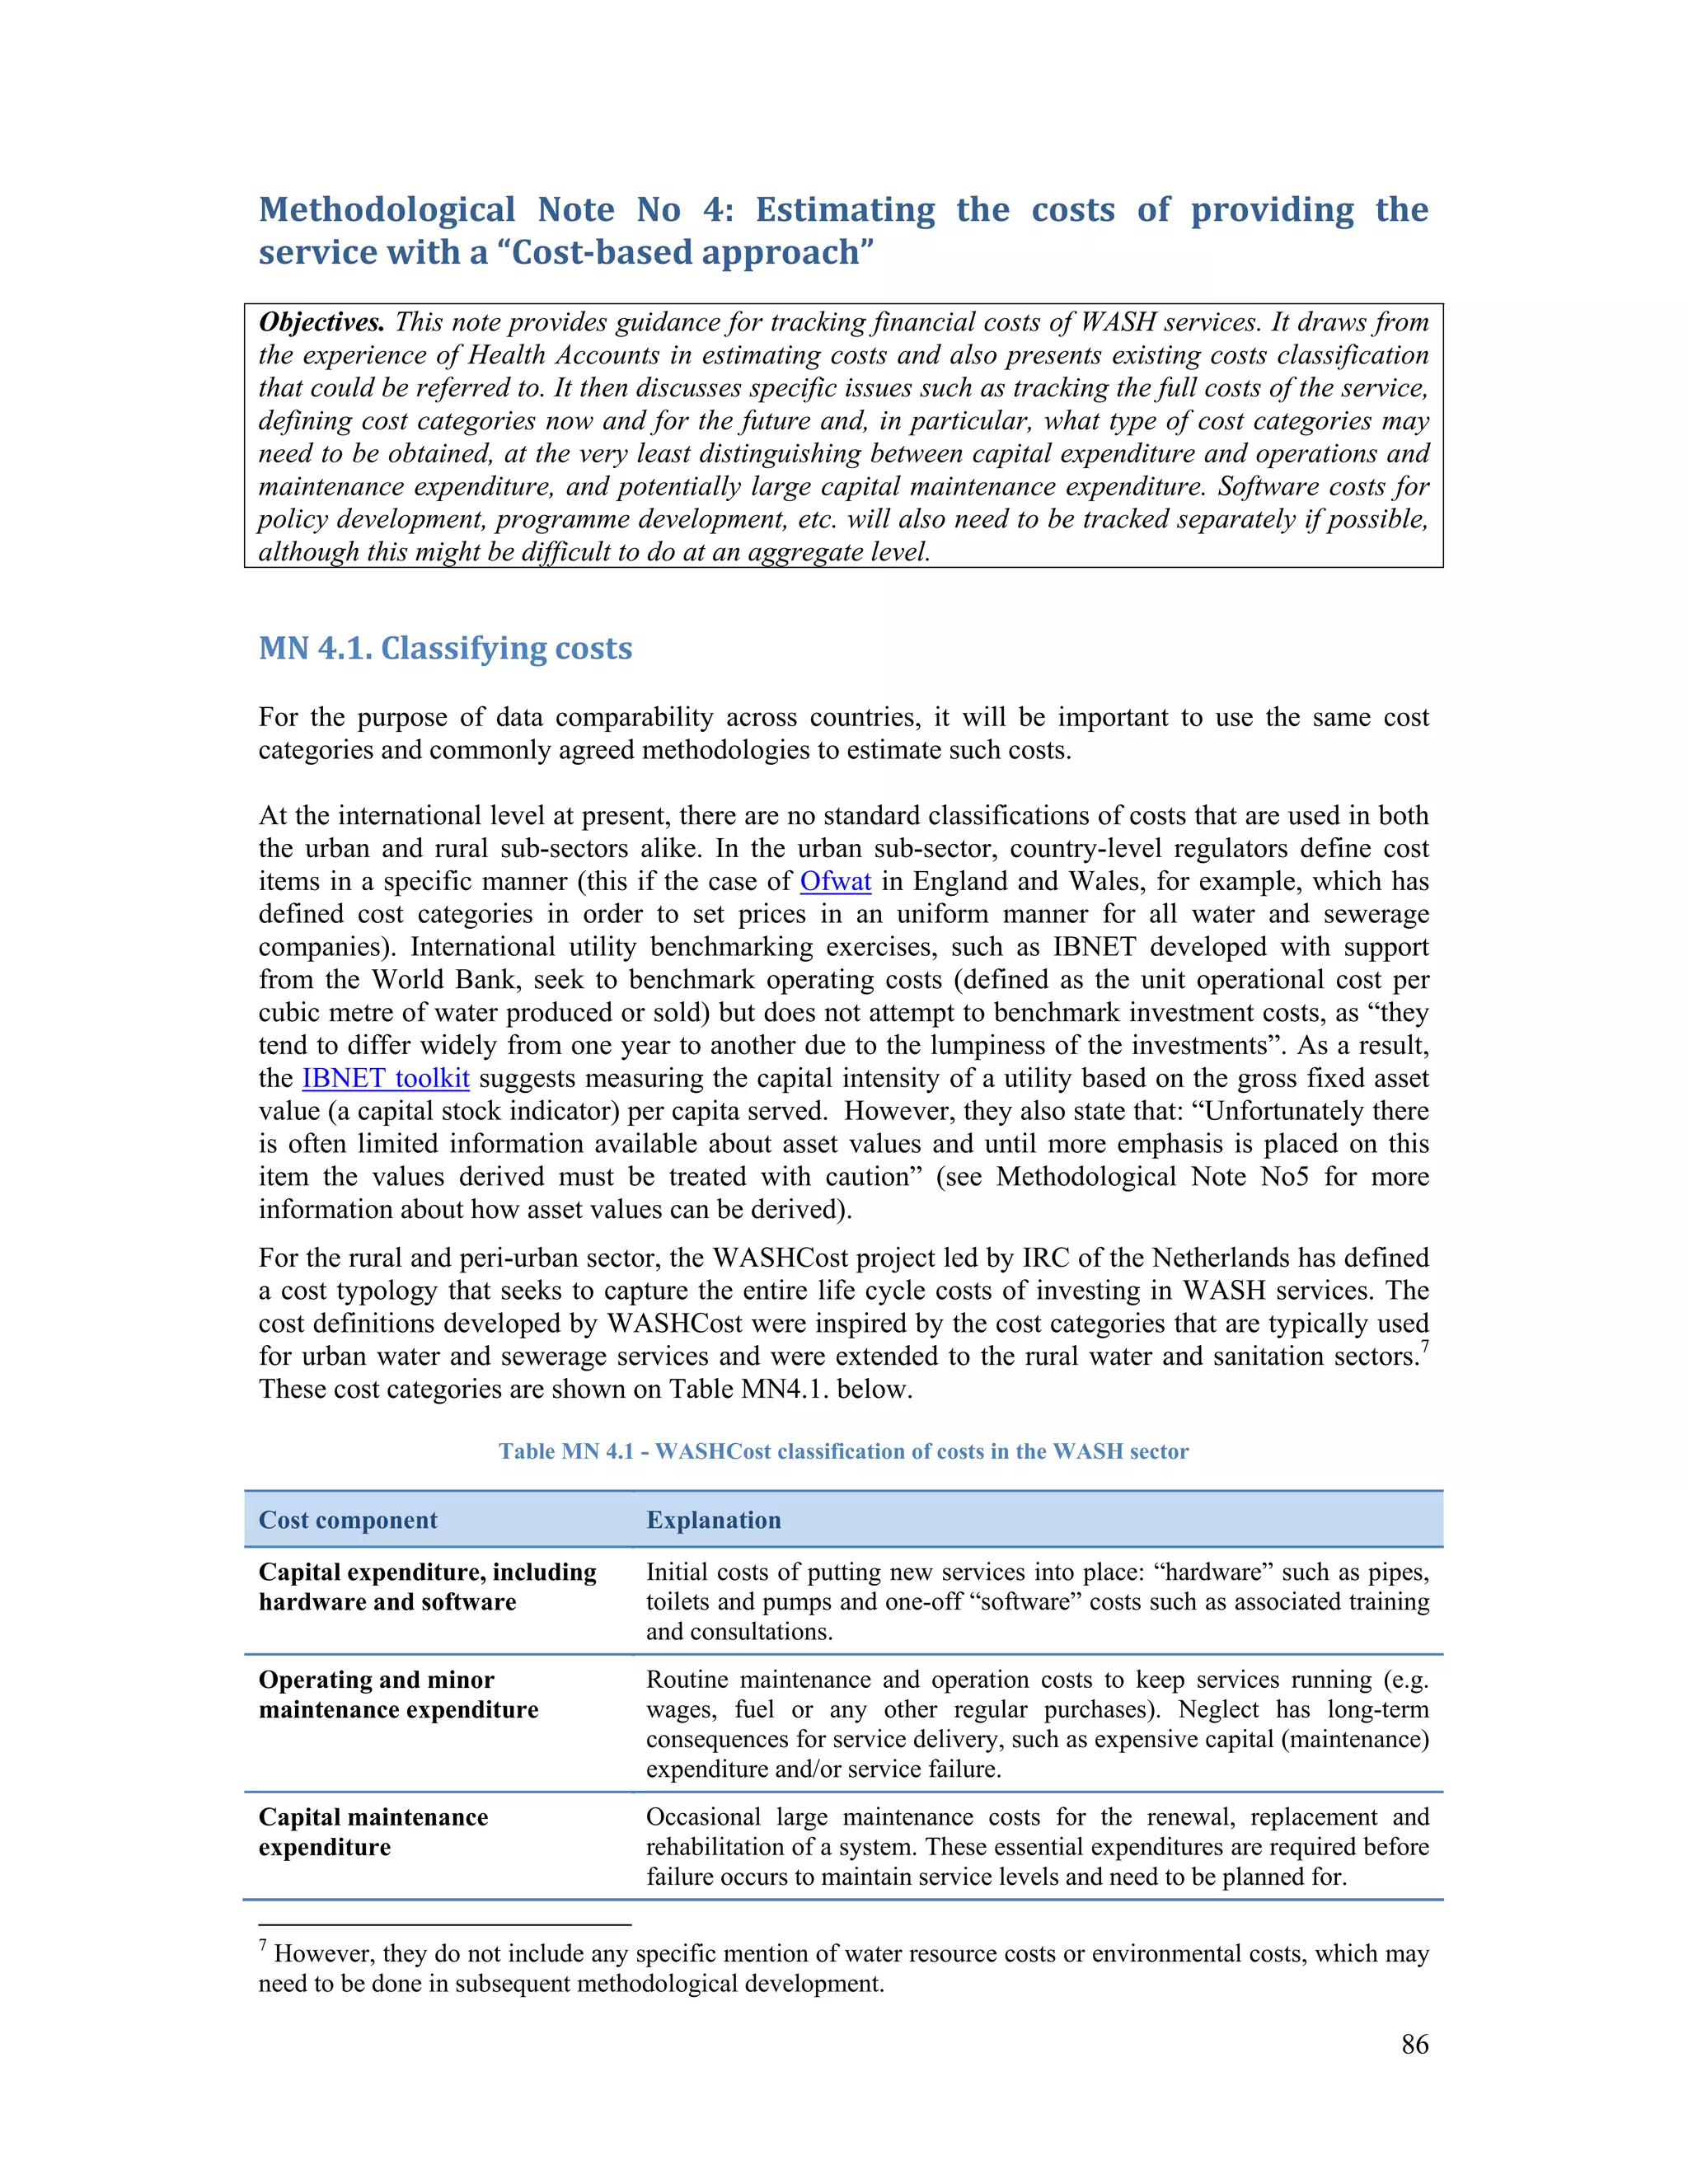
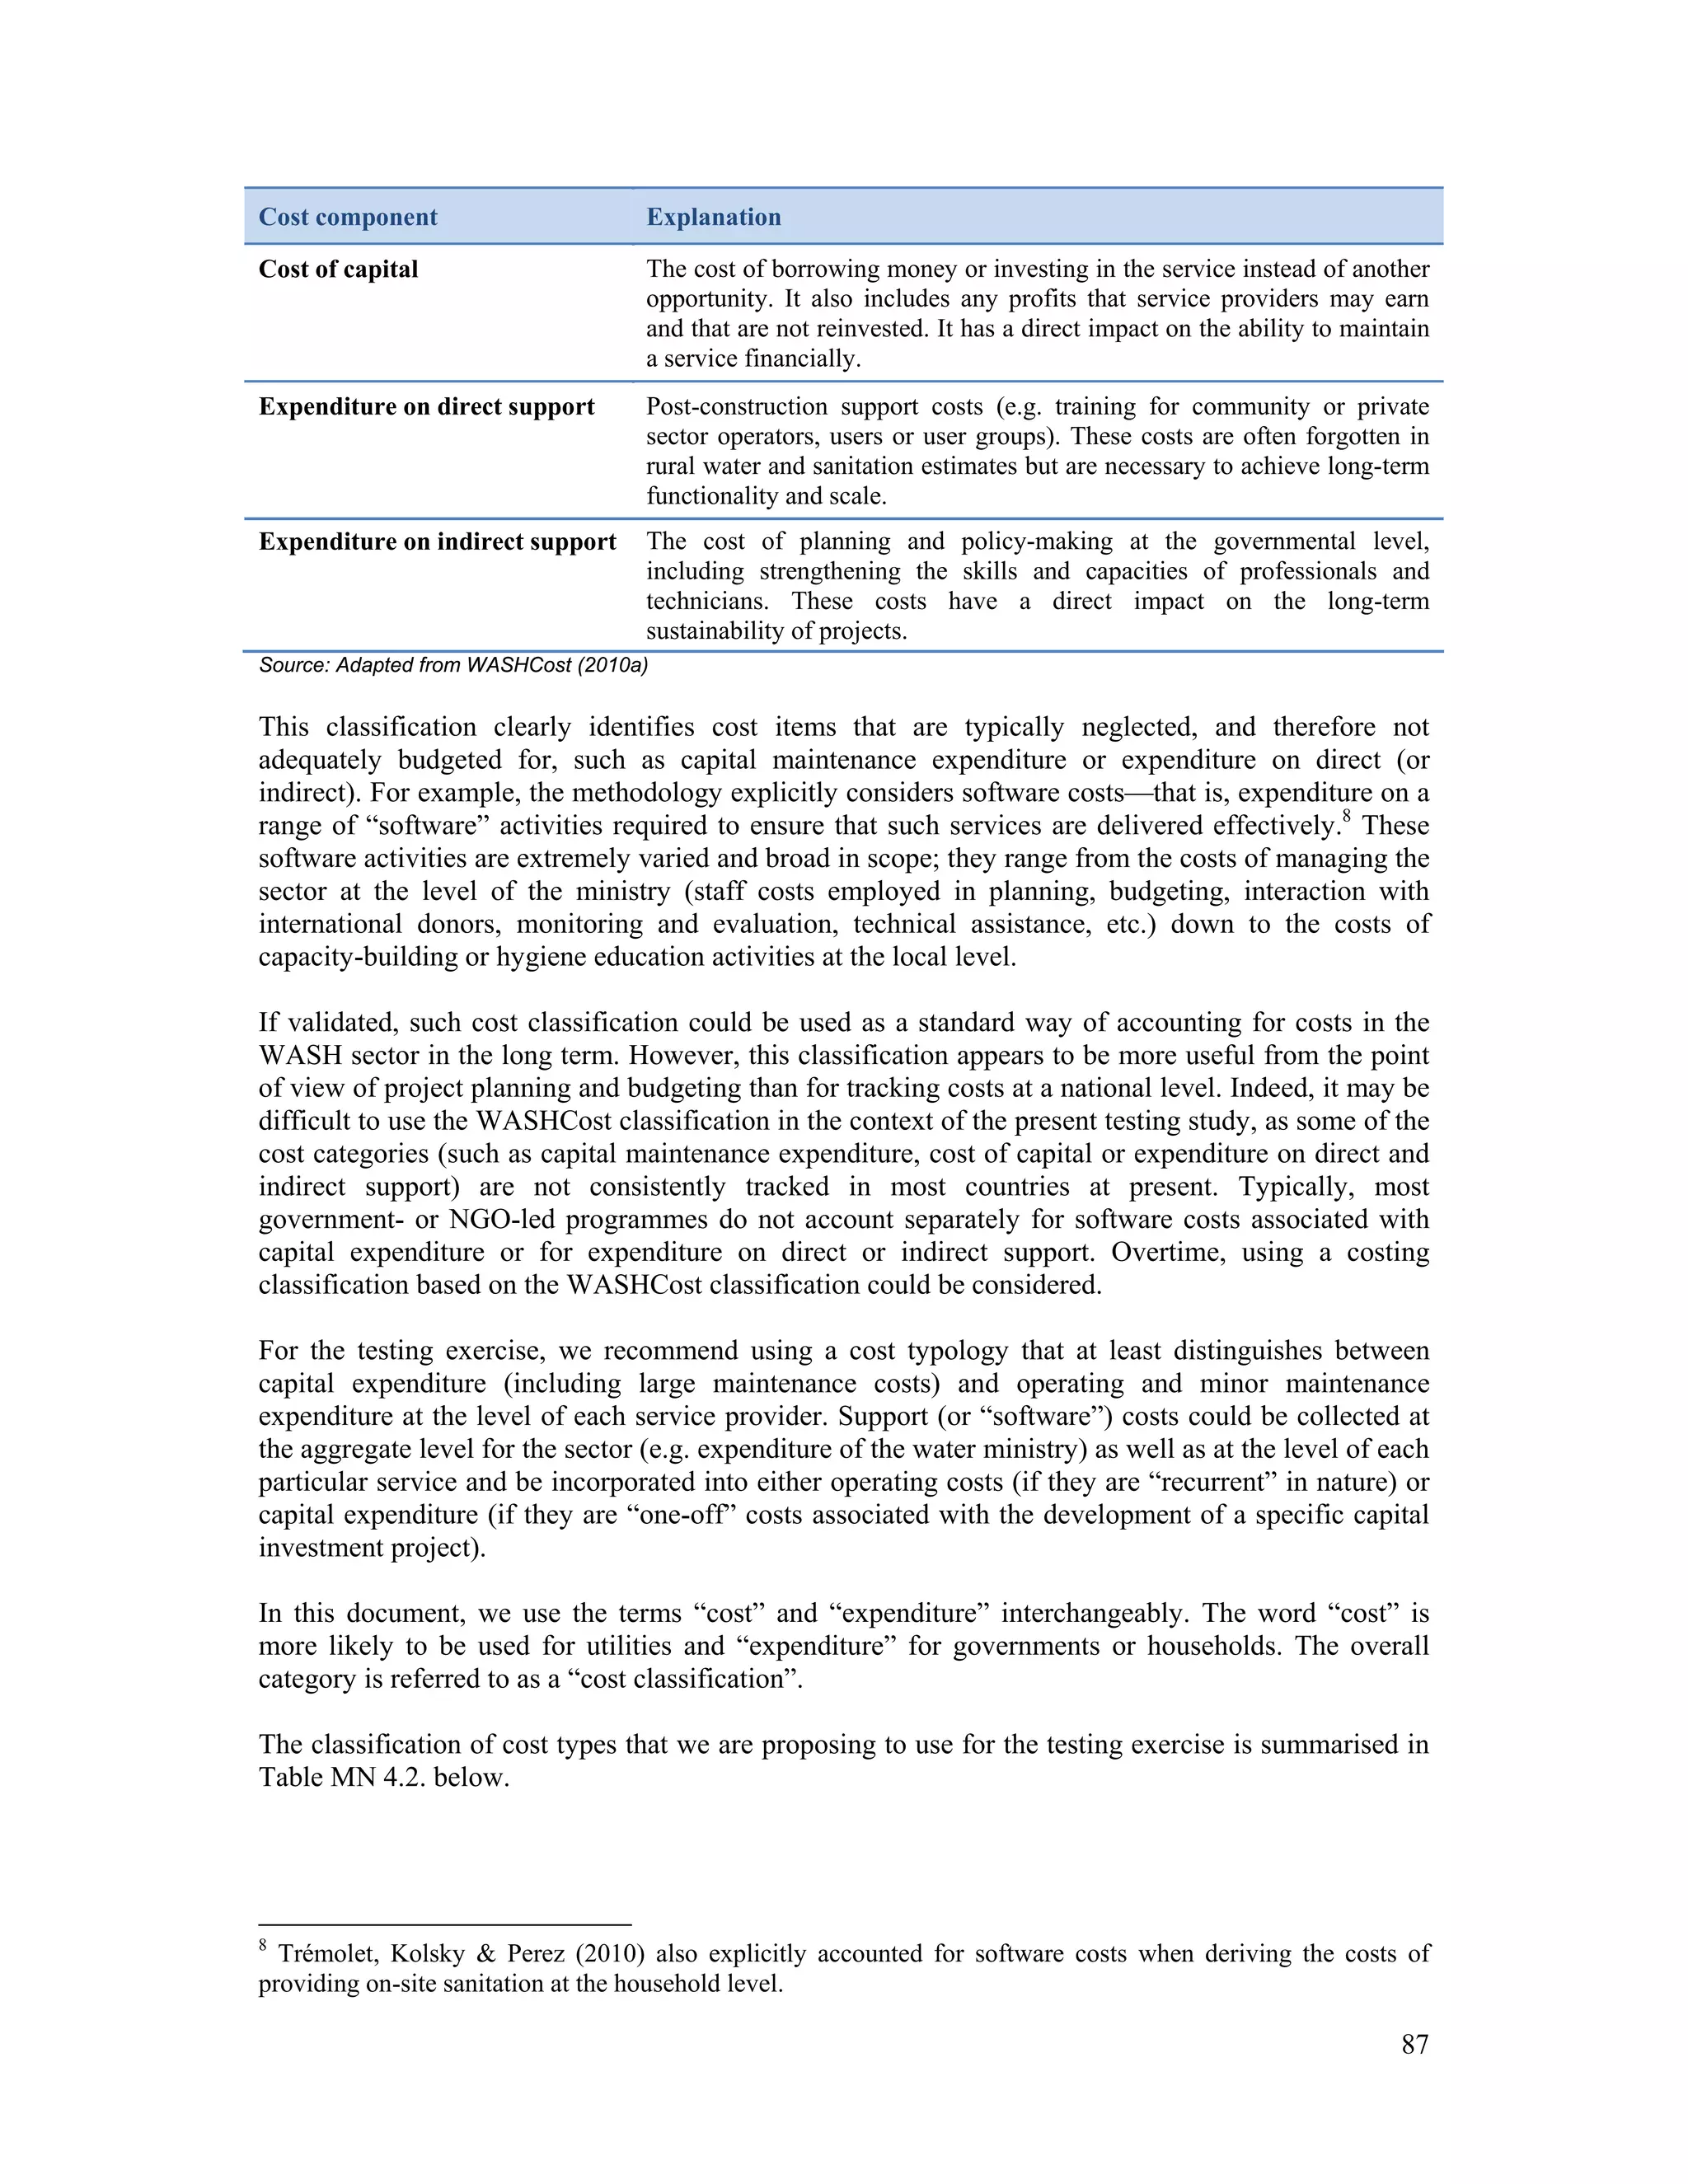
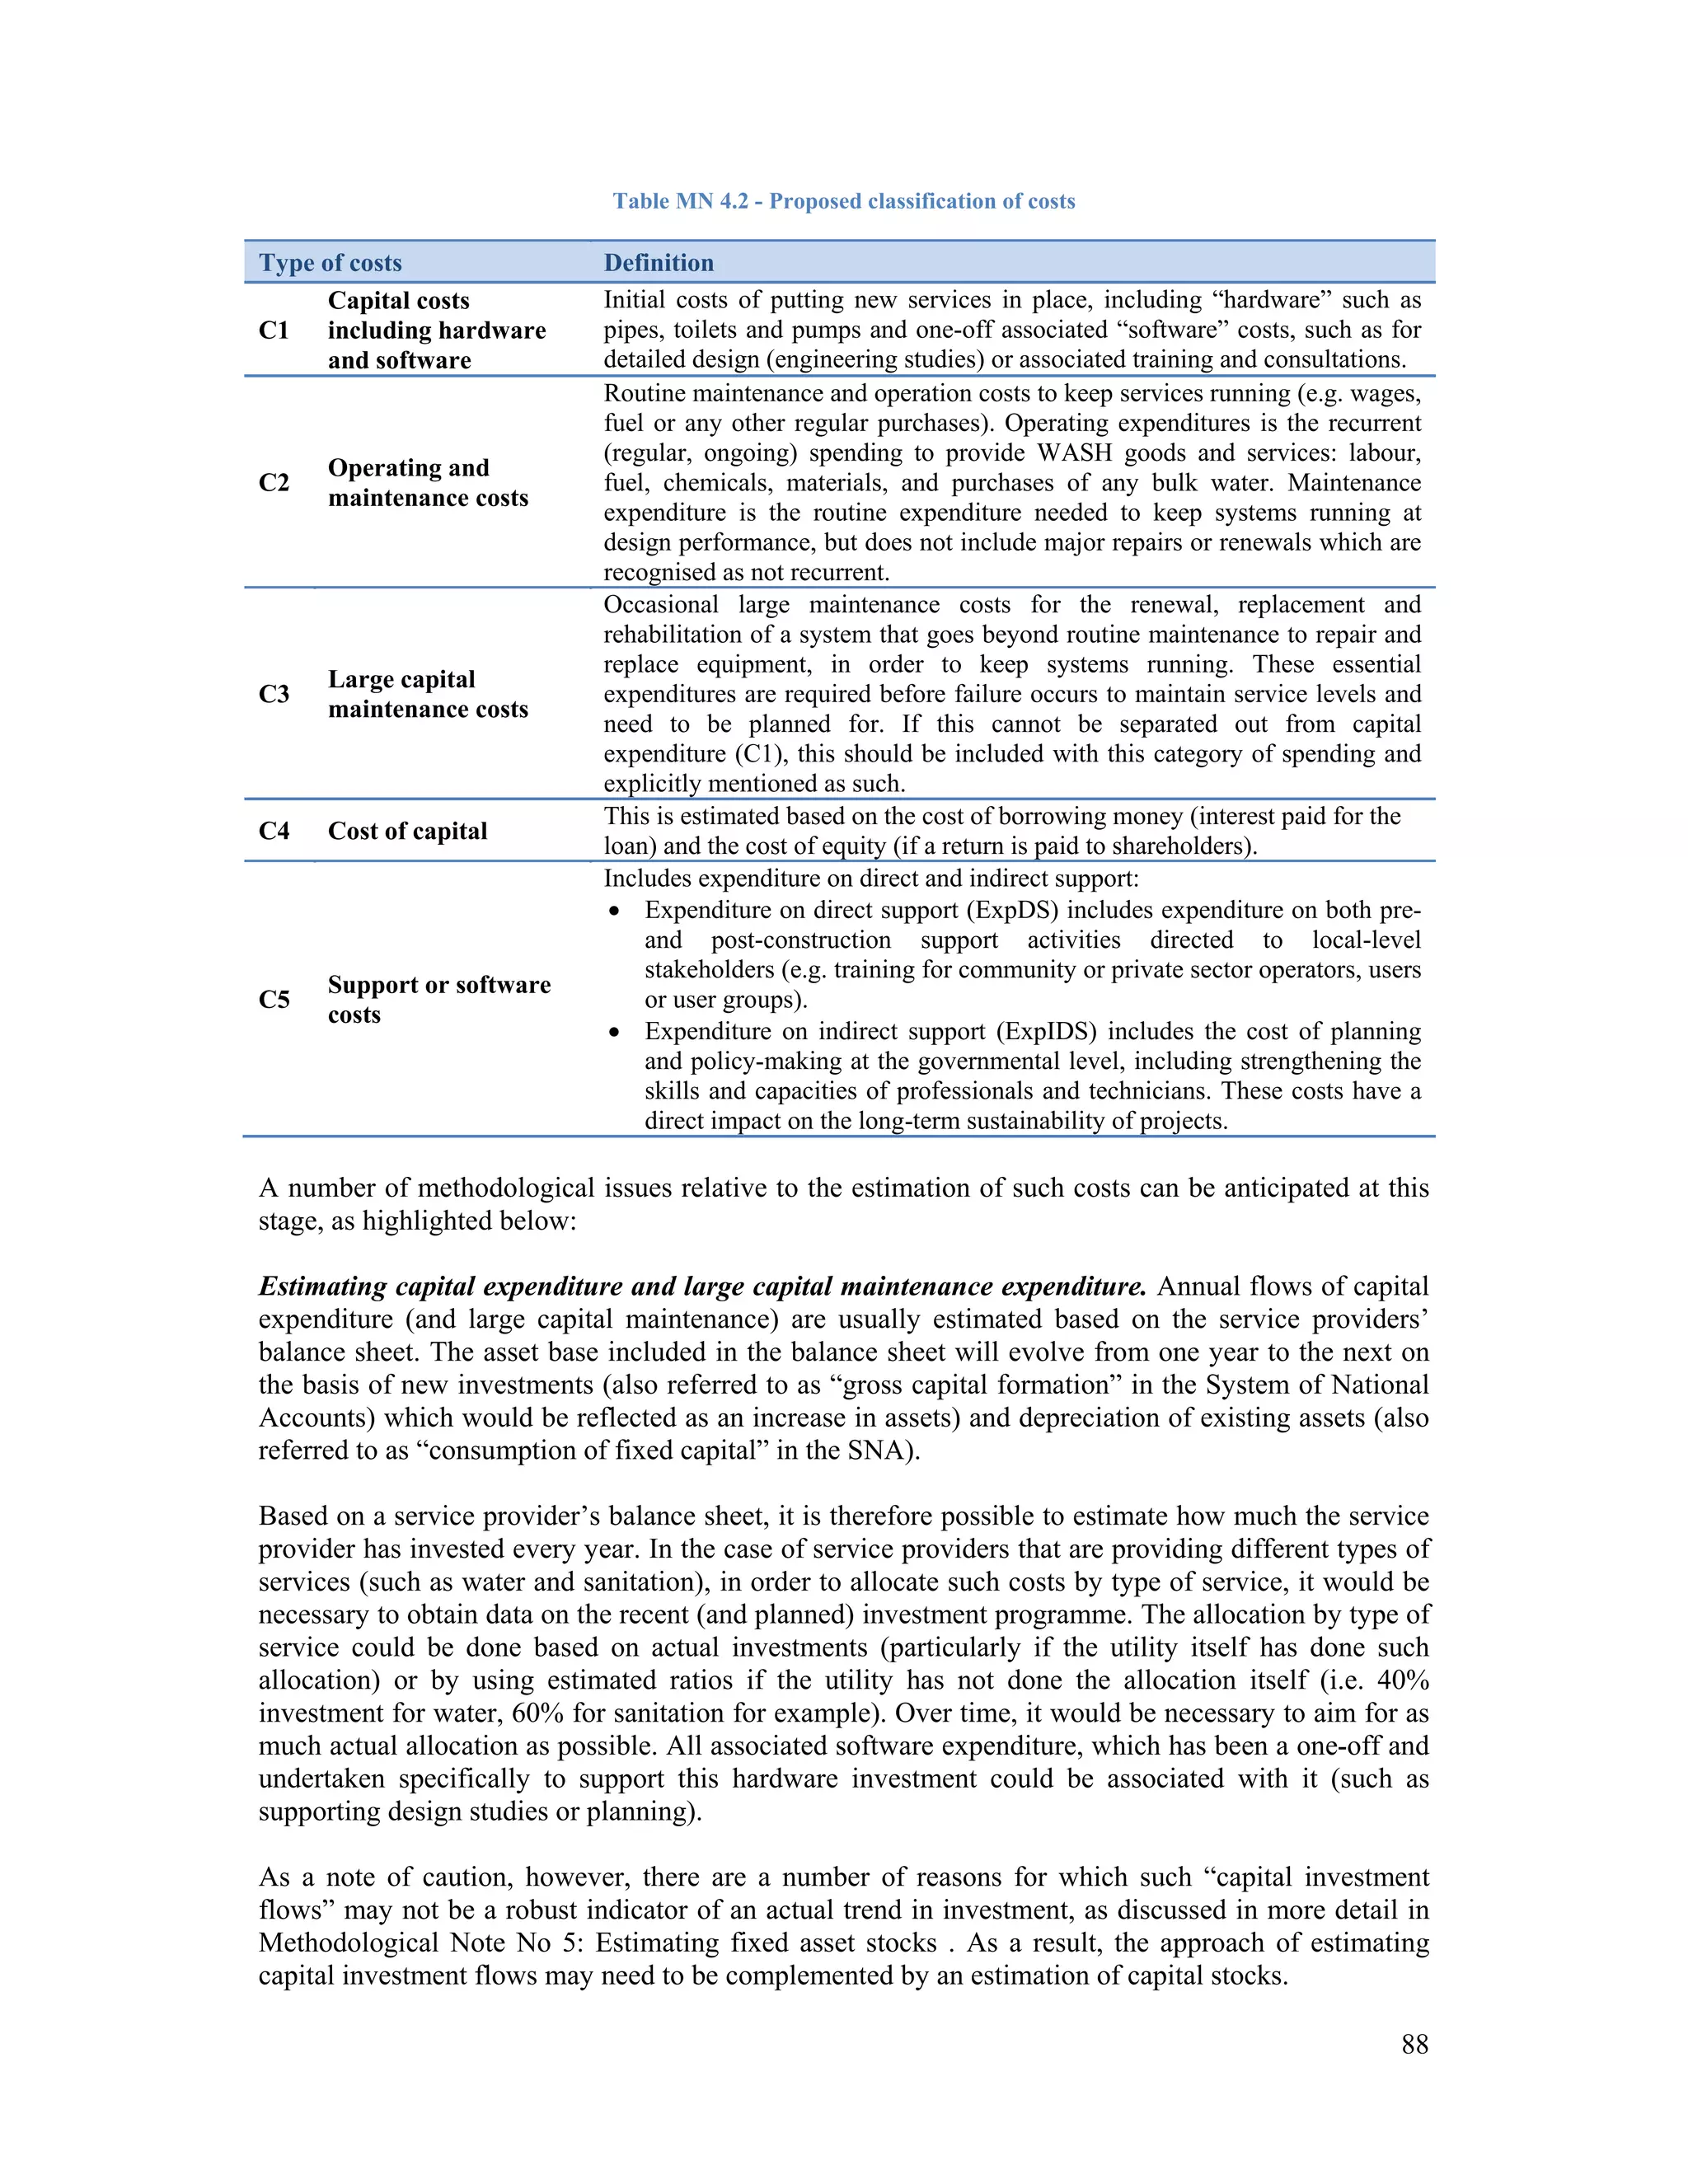
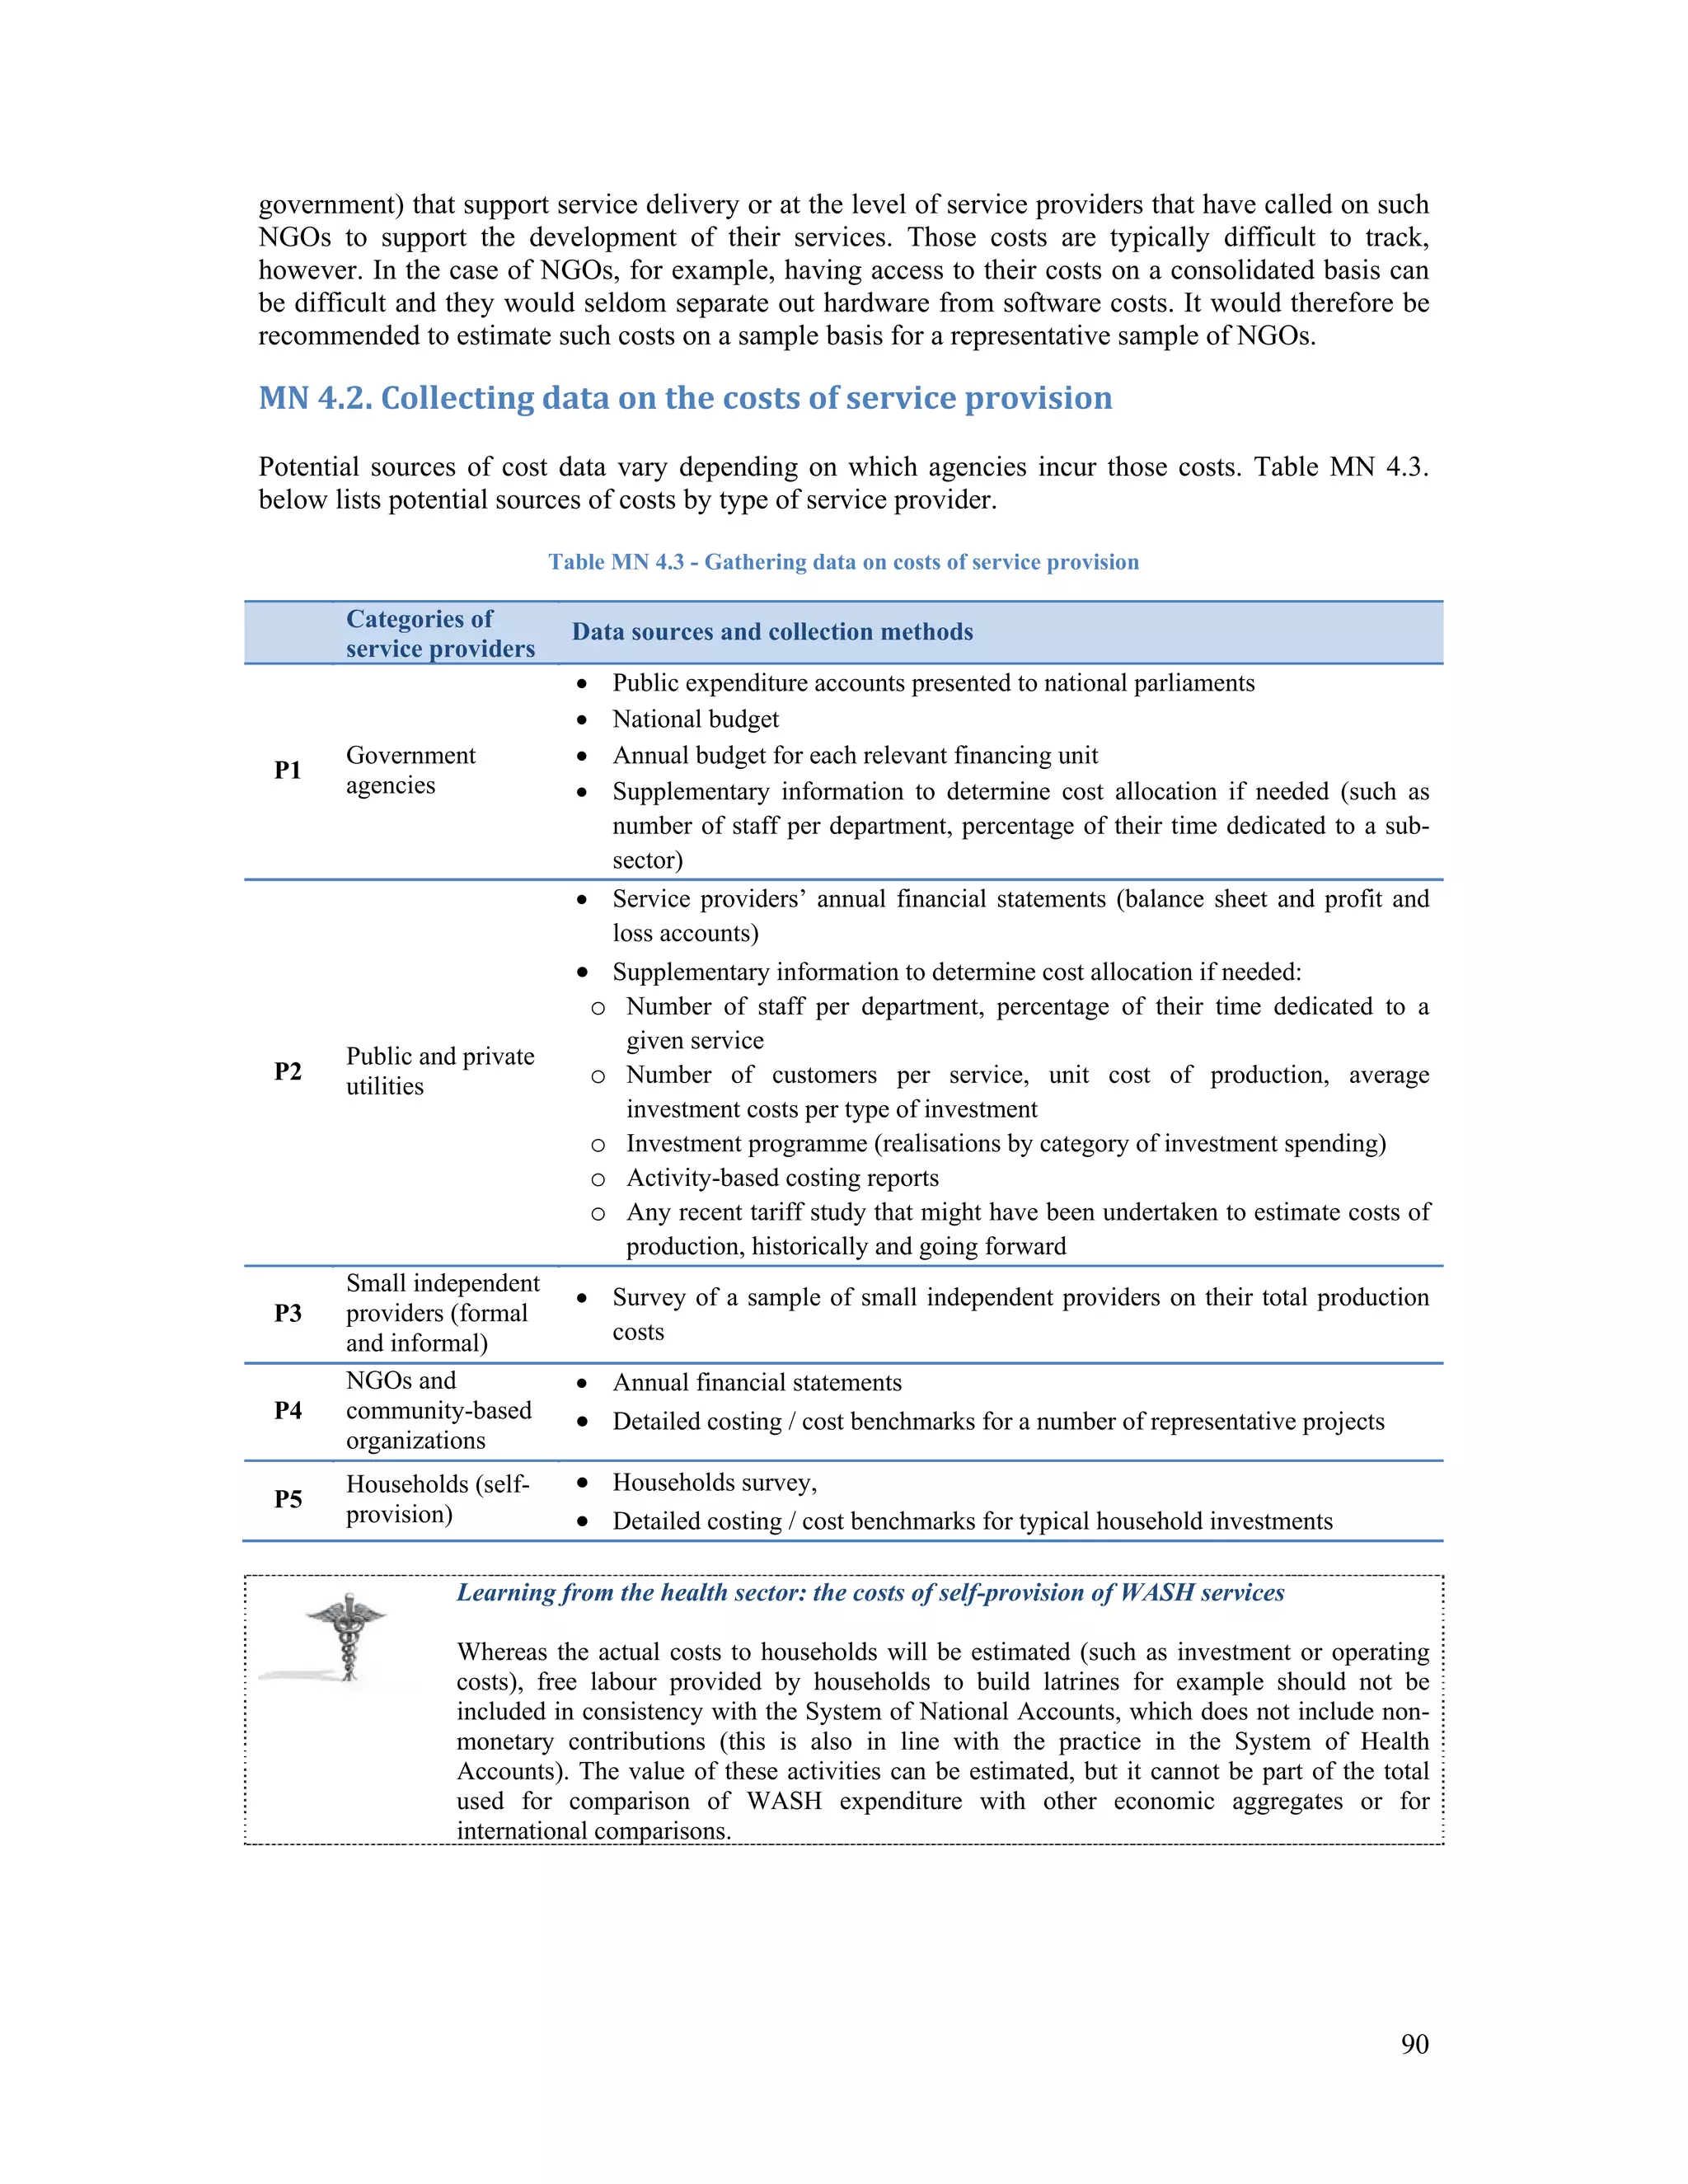
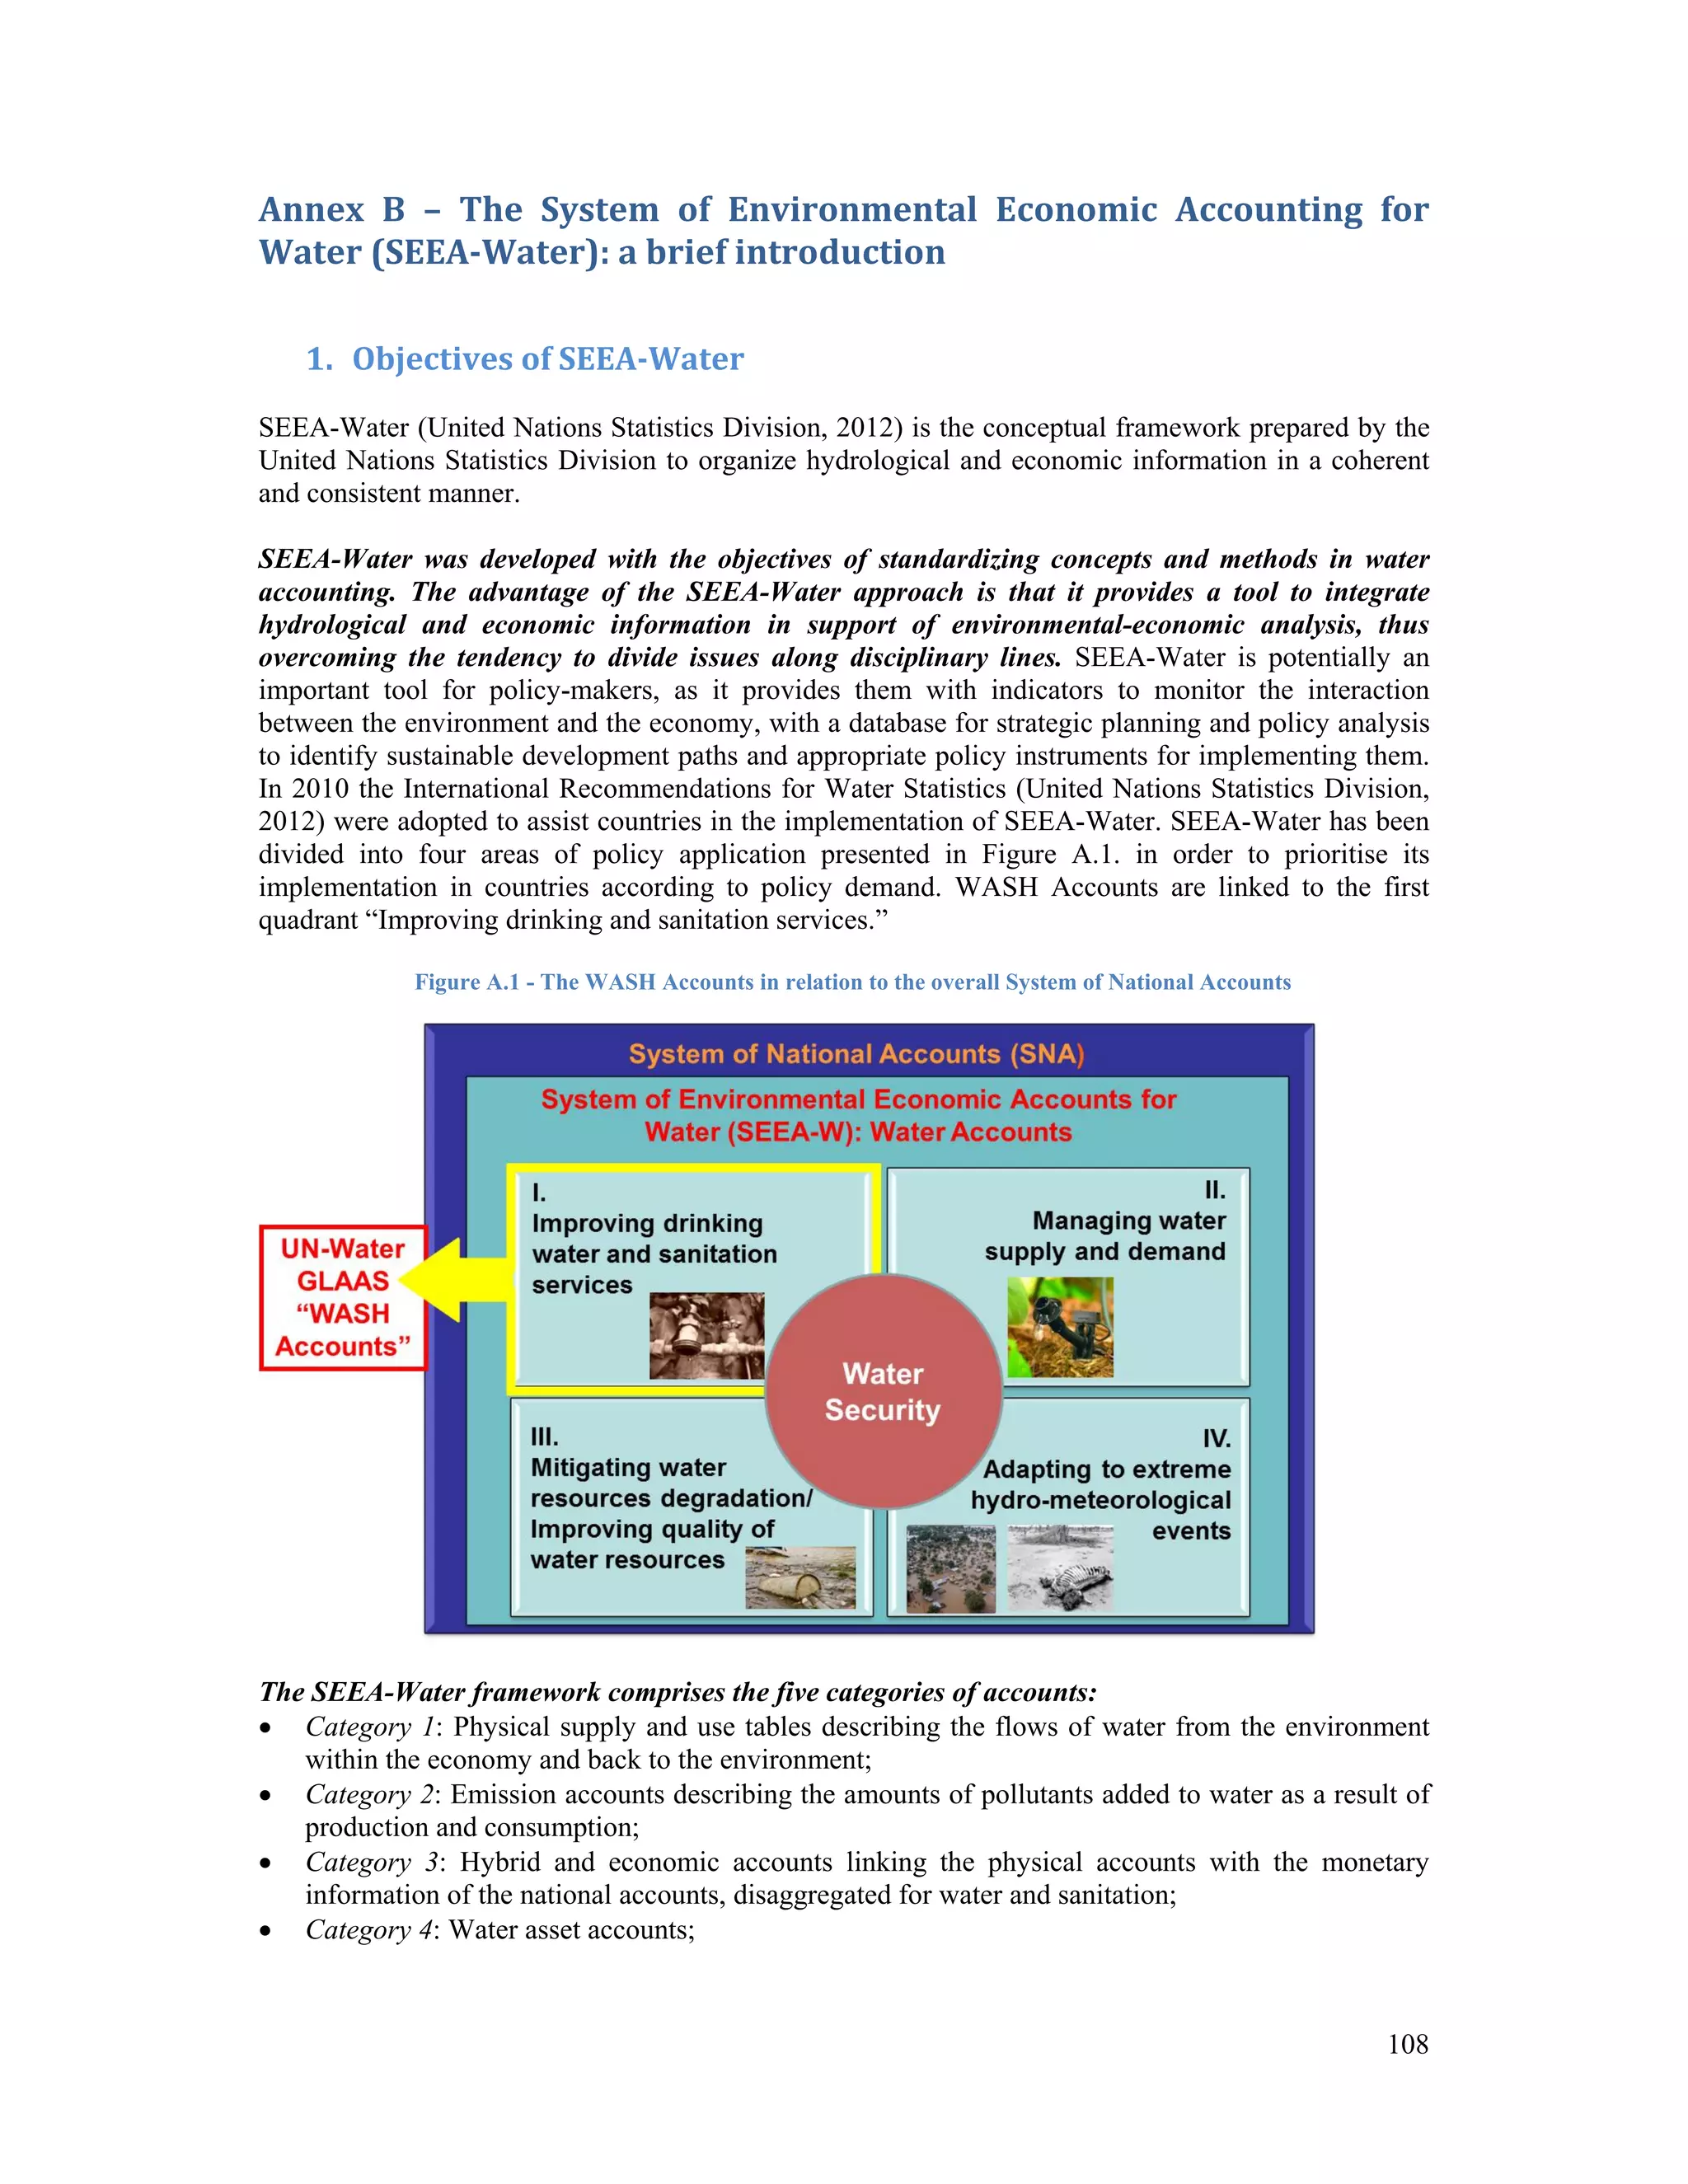
UN-Water Global Analysis and Assessment 
of Sanitation and Drinking-Water 
UN-Water GLAAS TrackFin Initiative 
Tracking financing to sanitation, hygiene and 
drinking-water at national level 
WHO/ FWC/WSH/ 14.02 January 2014
1 
© World Health Organization 2014 
All rights reserved. Publications of the World Health Organization are available on the WHO 
web site (http://www.who.int) or can be purchased from WHO Press, World Health 
Organization, 20 Avenue Appia, 1211 Geneva 27, Switzerland (tel.: +41 22 791 3264; fax: 
+41 22 791 4857; e-mail: bookorders@who.int). 
Requests for permission to reproduce or translate WHO publications – whether for sale or for 
noncommercial distribution – should be addressed to WHO Press through the WHO web site 
(http://www.who.int/about/licensing/copyright_form/en/index.html). 
The designations employed and the presentation of the material in this publication do not 
imply the expression of any opinion whatsoever on the part of the World Health Organization 
concerning the legal status of any country, territory, city or area or of its authorities, or 
concerning the delimitation of its frontiers or boundaries. Dotted lines on maps represent 
approximate border lines for which there may not yet be full agreement. 
The mention of specific companies or of certain manufacturers’ products does not imply that 
they are endorsed or recommended by the World Health Organization in preference to others 
of a similar nature that are not mentioned. Errors and omissions excepted, the names of 
proprietary products are distinguished by initial capital letters. 
All reasonable precautions have been taken by the World Health Organization to verify the 
information contained in this publication. However, the published material is being distributed 
without warranty of any kind, either expressed or implied. The responsibility for the 
interpretation and use of the material lies with the reader. In no event shall the World Health 
Organization be liable for damages arising from its use. 
The named authors alone are responsible for the views expressed in this publication. 
Printed by the WHO Document Production Services, Geneva, Switzerland
Table of Contents 
Table of Contents .................................................................................................................................... 2 
List of Figures ......................................................................................................................................... 3 
List of Boxes ........................................................................................................................................... 3 
List of Tables .......................................................................................................................................... 4 
Acknowledgements ................................................................................................................................. 5 
Objectives and planning of the testing exercise ...................................................................................... 5 
List of acronyms and abbreviations ........................................................................................................ 6 
Introduction ............................................................................................................................................. 7 
Overview ............................................................................................................................................. 7 
Structure of the guidance document .................................................................................................. 11 
1 Step 1 – Getting started .................................................................................................................. 13 
1.1 Create political buy-in ............................................................................................................. 13 
1.2 Identify policy questions ......................................................................................................... 14 
1.3 Set-up the team in charge of data collection and analysis ....................................................... 15 
1.3.1 Build a strong WASH Accounts team backed up by institutions ..................................... 15 
1.3.2 Identify available data and define a data collection plan .................................................. 15 
1.3.3 Develop a detailed budget and work plan ......................................................................... 17 
2 Step 2 – Collect financial data ........................................................................................................ 18 
2.1 Define WASH sector boundaries in terms of services ............................................................ 20 
2.2 Identify the main WASH sector actors, map service provision and financial flows ............... 26 
2.3 Estimate financial flows and capital assets stocks ................................................................... 34 
3 Step 3 – Analyse financial data ...................................................................................................... 39 
4 Step 4 – Interpret and disseminate findings .................................................................................... 42 
4.1 Analyse and interpret WASH Accounts data to answer policy questions ............................... 42 
4.2 Disseminate the policy analysis ............................................................................................... 49 
5 Step 5 – Provide feedback on methodological development .......................................................... 50 
Methodological Note No 1: Developing WASH services classifications ............................................. 52 
MN 1.1. Existing classifications of WASH services ........................................................................ 52 
MN 1.2. Summary evaluation: the potential use of existing classifications for the development of 
WASH Accounts ............................................................................................................................... 65 
Methodological Note No 2: Developing classifications of WASH actors and financing sources ........ 68 
MN 2.1. Classifying WASH service uses ......................................................................................... 68 
MN 2.2. Classifying WASH service providers ................................................................................. 70 
MN 2.3. Classifying WASH financing units .................................................................................... 71 
MN 2.4. Classifying WASH financing sources ................................................................................ 73 
Methodological Note No 3: Estimating funding of WASH services with a “Financing Source 
approach” .............................................................................................................................................. 78 
MN 3.1. Obtaining data on financing sources................................................................................... 78 
MN 3.2. Potential challenges and how to address them ................................................................... 84 
2
Methodological Note No 4: Estimating the costs of providing the service with a “Cost-based 
approach” .............................................................................................................................................. 86 
MN 4.1. Classifying costs ................................................................................................................. 86 
MN 4.2. Collecting data on the costs of service provision ............................................................... 90 
Methodological Note No 5: Estimating fixed asset stocks ................................................................... 91 
MN 5.1. How does estimating fixed asset stocks differ from evaluating investment flows? ........... 91 
MN 5.2. Potential methodological challenges with this approach and ways to overcome them ...... 92 
MN 5.3. Valuing fixed asset stocks in the testing exercise and next steps ....................................... 94 
Methodological Note No 6: Preparing WASH accounts’ tables and indicators ................................... 95 
MN 6.1 What are the WASH Accounts tables? ................................................................................ 95 
MN 6.2 What are the WASH Accounts indicators? ....................................................................... 103 
Annex A – Summary of key steps under the methodology ................................................................ 105 
Annex B – The System of Environmental Economic Accounting for Water (SEEA-Water): a brief 
introduction ......................................................................................................................................... 108 
Annex C - Glossary ............................................................................................................................. 116 
Annex D - References ......................................................................................................................... 122 
Relevant websites ................................................................................................................................ 123 
3 
List of Figures 
Figure 1 - Overview of proposed methodology to track financing to WASH at national level .............. 9 
Figure 2 - Financing flows in the WASH sector: mapping the sector based on consumption, 
production & financing ......................................................................................................................... 19 
Figure 3 - The value chain of WASH services ..................................................................................... 23 
Figure 4 – Mapping financial flows for WASH service provision: illustrative example ...................... 30 
Figure 5 - Methodology to estimate WASH Accounts ......................................................................... 36 
Figure 6 - Government expenditure on health, education and WASH ................................................. 46 
Figure MN 2.1 - Sources of finance for the WASH sector ................................................................... 74 
Figure A.1 - The WASH Accounts in relation to the overall System of National Accounts .............. 108 
List of Boxes 
Box 1 - The System of National Accounts (SNA) .................................................................................. 8 
Box 2 - The System of Environmental-Economic Accounting for water (SEEA-Water) .................... 14 
Box 3 - Examples of pre-existing information to be collected (as appropriate) ................................... 15 
Box 4 - Types of service providers: the example of Burkina Faso ....................................................... 33 
Box 5 - Data sources and collection methods ....................................................................................... 37 
Box 6 - Filling in data gaps: making assumptions and using keys ....................................................... 38 
Box MN 3.1 - Regulatory data on tariffs of service provision from national regulators ...................... 79 
Box MN 5.1 - Alternative methodologies for valuing fixed asset stocks ............................................. 93
4 
List of Tables 
Table 1 – Proposed classification of WASH goods and services ......................................................... 24 
Table 2 – Definitions: uses of WASH services, WASH sector actors and financing sources .............. 27 
Table 3 – WASH Accounts tables recommended for use ..................................................................... 40 
Table 4 - Potential WASH Accounts indicators ................................................................................... 41 
Table 5 - Link between WASH Accounts information and policy questions ....................................... 43 
Table MN 1.1. Summary of main international systems of classification of goods and services ......... 52 
Table MN 1.2- CPC- Central Product Classification ............................................................................ 54 
Table MN 1.3 - ISIC- International Standard Industrial Classification ................................................ 60 
Table MN 1.4 - COFOG (Classification of the Functions of Government) ......................................... 63 
Table MN 1.5 - WASH sector support activities .................................................................................. 65 
Table MN 1.6 - Correspondences between CPC, ISIC and COFOG classifications along the water and 
sanitation value chain ............................................................................................................................ 66 
Table MN 2.1- Classifications of WASH uses, actors and financing sources ...................................... 68 
Table MN 2.2 - Proposed WASH Accounts classification of WASH Service uses ............................. 69 
Table MN 2.4 - Classification of Water service providers in SEEA-Water ......................................... 70 
Table MN 2.5 - WASH Accounts classification of WASH service providers ..................................... 71 
Table MN 2.6 - Classification of Water financing sectors in SEEA-Water ......................................... 72 
Table MN 2.7 - WASH Accounts classification of WASH financing units ......................................... 72 
Table MN 2.8 - WASH Accounts classification of WASH financing sources ..................................... 77 
Table MN 3.1 - Gathering data on financing sources ........................................................................... 78 
Table MN 4.1 - WASHCost classification of costs in the WASH sector ............................................. 86 
Table MN 4.2 - Proposed classification of costs .................................................................................. 88 
Table MN 4.3 - Gathering data on costs of service provision .............................................................. 90 
Table MN 5.1 - Terminology used in SNAs to evaluate changes in capital asset stocks ..................... 92 
Table MN 6.1 - Classifications used in the WASH Accounts .............................................................. 95 
Table MN 6.2 - WASH Accounts indicators ...................................................................................... 104 
Table WA 1 (SxR) - WASH expenditure by main WASH service and geographical region ............... 96 
Table WA 2 (SxU) - WASH expenditure by type of WASH users and service ................................... 96 
Table WA 3 (SxP) - WASH expenditure by type of WASH provider and service .............................. 97 
Table WA 4 (PxFS) - WASH expenditure by type of financing source and WASH provider ............. 97 
Table WA 5 (SxFS)- WASH expenditure by type of financing source and WASH service ................ 98 
Table WA 6 (SxFU)- WASH expenditure by financing unit and WASH service ................................ 99 
Table WA 7 (PxFU)- WASH expenditure by WASH provider and financing unit ............................ 100 
Table WA 8 (PxFU)- WASH expenditure by financing source and financing unit............................ 101 
Table WA 9 (CxP)- WASH expenditure by type of cost and WASH provider .................................. 102 
Table WA 10 (CxS)- WASH expenditure by type of cost and main WASH service ......................... 102 
Table WA 11 (ASxP)- Fixed asset stocks by type of WASH provider ............................................. 103 
Table A.1 - Summary of SEEA-Water Accounts ............................................................................... 109 
Table A.2 - Hybrid account for supply and use of water .................................................................... 111 
Table A.3 - Hybrid Account for water supply and sewerage carried out for Own Use ...................... 112 
Table A.4 - Government accounts for water-related collective consumption services ....................... 113 
Table A.5 - National Expenditure Account for wastewater management (billions of currency units)114 
Table A.6 - Financing Account for waste water management (millions of currency units) ............... 114 
Table A.7 - Classification of financing sectors used in the SEEA-Water Financing Accounts .......... 115
5 
Acknowledgements 
This report has been prepared by Sophie Trémolet and Marie-Alix Prat of Trémolet Consulting 
Limited (London), under the leadership and guidance of Bruce Gordon and Didier Allély-Fermé 
(WHO-Geneva). This is the second version of the guidance document, which incorporates comments 
received from the Technical Advisory Group (TAG) for the TrackFin initiative on the initial version. 
We are very grateful for comments provided by all TAG members, including Gérard Payen (United 
Nations Secretary General’s Advisory Board on Water - UNSGAB), Dominick de Waal and Guy 
Hutton (Water and Sanitation Program - WSP), Véronique Verdeil (World Bank), Patricia Hernandez 
(World Health Organisation), Meera Mehta (CEPT – India), Catarina Fonseca (IRC), Richard 
Franceys (Cranfield University), Xavier Leflaive (Organisation for Economic Cooperation and 
Development), Ricardo Martinez-Lagunes (United Nations Department of Statistics). 
Objectives and planning of the testing exercise 
The present version of this document is going to be developed following testing activities at country 
level in Brazil, Morocco, Ghana and Burkina Faso. 
The objectives of the testing exercise are as follows: 
 Prepare WASH-Accounts for a small set of countries and extract lessons from those findings; 
 Verify data availability and define strategies to deal with lack of data where it occurs; 
 Help identify the extent to which statistical data (as opposed to sector data) can be relied upon; 
 Contribute to develop the methodology further, particularly where several options have been 
identified; 
 Provide a basis for revising the guidance document, with concrete examples from the WASH 
sector. 
Further comments are invited on this document from interested parties at any stage of the process. 
These comments, together with findings from the testing phase, will be reflected in the next version of 
the document to be released in Autumn 2014.
List of acronyms and abbreviations 
3Ts, Tariffs, Taxes and Transfers (sources of finance) 
AICD Africa Infrastructure Country Diagnostic 
AMCOW African Ministers’ Council on Water 
CLTS Community-Led Total Sanitation 
CRS Creditor Reporting System 
CSO Country Status Overview 
DAC Development Assistance Committee (OECD) 
EFA Education for All 
GDP Gross Domestic Product 
GLAAS UN-Water Global Analysis and Assessment of Sanitation and Drinking- 
Water 
IBNET International Benchmarking Network for Water and Sanitation Utilities 
IRC IRC International Water and Sanitation Centre 
ISIC International Standard Industrial Classification of All Economic Activities 
JMP WHO/UNICEF Joint Monitoring Programme for Water Supply and 
Sanitation 
MDG Millennium Development Goal 
MFI Micro Finance Institution 
MTEF Medium-term Expenditure Framework 
NEA National Education Account 
NGO Non-Governmental Organization 
NHA National Health Accounts 
NSO National Statistical Office 
ODA Official Development Assistance 
OECD Organisation for Economic Co-operation and Development 
PER Public Expenditure Review 
POC National level Point of Contact 
PPP Purchasing Power Parity 
PRSP Poverty Reduction Strategy Paper 
SEEA System of Environmental and Economic Accounting 
SEEA-Water System of Environmental and Economic Accounting for Water 
SFP Strategic Financial Planning 
SHA System of Health Accounts 
SNA System of National Accounts 
UIS UNESCO Institute of Statistics 
UN United Nations 
UNSD United Nations Statistics Division 
UNESCO United Nations Educational, Scientific and Cultural Organization 
UNICEF United Nations Children’s Fund 
UOE UNESCO/OECD/Eurostat 
USAID United States Agency for International Development 
WASH Water, Sanitation and Hygiene 
WASH Accounts Water, Sanitation and Hygiene Accounts 
WHO World Health Organization 
WSP Water and Sanitation Program (World Bank) 
WSS Water Supply and Sanitation
7 
Introduction 
Overview 
This guidance document sets out a proposed methodology to identify and track financing to the 
WASH sector in a coherent and consistent manner across several countries. It is designed to help 
countries track financing to the WASH sector on a regular and comparable basis and analyse this 
information to support evidence-based policymaking based on useful indicators. 
For ease of reference, the output of this exercise is referred to as WASH-Accounts (WASH-A). 
Between November 2013 and June 2014, the proposed methodology for the development of WASH-Accounts 
will be tested in countries that have expressed an interest in doing so. Based on the findings 
of this exercise, a refined methodology will be developed and disseminated widely so as to assist 
countries with the provision of sound and reliable financial information for future GLAAS reports. 
This will then form the basis for further methodological development and country-level applications 
in subsequent years. The long-term aspiration of the TrackFin initiative is to develop a common 
approach so that data produced at country level can be used for benchmarking, within and across 
countries and as a reference to guide key policy decisions. 
Rationale for the development of a shared methodology 
This methodology has been developed based on the findings of the WHO and UN-Water GLAAS 
Working Paper “Tracking national financial flows into sanitation, hygiene and drinking water” 
(Trémolet & Rama, 2012) published in July 2012. The working paper stressed that effective financing 
for water, sanitation and hygiene is essential to accelerate and sustain services that could ultimately 
save two million lives per year. However, limited availability of financial data and inadequate 
monitoring impedes the ability of countries to assess progress and improve performance. The working 
paper concluded that our current understanding of financial flows to the water, sanitation and hygiene 
(WASH) sector at the national level is limited, with numerous gaps. 
Based on these findings, there was a common agreement that a better understanding of financing to 
the WASH sector at the national level is critical to support policy development and implementation, 
as well as to encourage better and more equitable utilization of existing funds and attract additional 
financing to the sector. However, there was also a consensus that this is a difficult and challenging 
task, especially considering the poor state of current financial data in the sector. When the data is 
available, indicators often do not allow breaking down the information. The working paper therefore 
concluded that a multi-year initiative, thereby referred to as the UN-Water GLAAS TrackFin 
Initiative would need to be launched in order to gradually develop a methodology that could be used 
by a broad range of countries in order to produce comparable financial data on their WASH sector, 
that would enable policy makers to make the appropriate analysis. 
Demand for sound financial information for the sector was confirmed at the highest political level, 
including at the High-Level Meeting organised by Sanitation and Water for All in Washington DC in 
April 2012. An evaluation of the UN-Water GLAAS report identified that improved tracking of 
financing to the sector is essential and that the GLAAS report has a leading role to play in this area. 
These calls for action have provided the basis for the launch of the WASH “TrackFin” initiative (as in 
“tracking financing” to WASH) by WHO on behalf of UN-Water. 
The development of the present methodology seeks to learn and build upon existing systems for 
tracking expenditure, including the System of National Accounts (SNA) (see Box 1 below) and 
sector-specific systems, such as the System of Health Accounts (SHA) for the health sector or the 
Water Accounts that are to be prepared for the water sector as a whole, in application of the SEEA-Water 
framework (System of Environmental-Economic Accounting for Water) designed by the 
United Nations Department of Statistics (UNSD) (Annex B provides more detail on this system).
8 
Box 1 - The System of National Accounts (SNA) 
The system of national accounts (SNA) is a broad structure for national economic accounting. This system was 
first adopted by the United Nations in 1952 and revised and updated since. The rules and structure of the SNA 
are contained in a manual called System of national accounts 2008. It is the internationally agreed standard set 
of recommendations on how to compile measures of economic activity. 
The SNA describes a coherent, consistent and integrated set of macroeconomic accounts in the context of a set 
of internationally agreed concepts, definitions, classifications and accounting rules. It provides an overview of 
economic processes, recording how production is distributed among consumers, businesses, government and 
foreign nations. It shows how income originating in production, modified by taxes and transfers, flows to these 
groups and how they allocate these flows to consumption, saving and investment. It provides the definitions that 
underlie such concepts as gross domestic product (GDP). 
Specific areas of learning from the SHA or from the SEEA-Water framework are highlighted 
throughout the text with the following symbols. 
Learning from the health sector 
Learning / aligning with SEEA-Water framework 
Objectives of the methodology 
The methodology aims to track all financing expenditure made in the WASH sector by all type of 
entities in the economy, including governments and public institutions, public and private 
organizations, NGOs, foundations, international and national donors, investors and households. 
It will enable countries answer five key questions: 
1. What is the total expenditure in the WASH sector? 
2. Who pays for WASH services and how much do they pay? 
3. Which entities are the main funding channels for the WASH sector? 
4. How are funds distributed to the different WASH services and expenditure types? 
Additional questions may be answered depending on the level of detail that can be reached for 
collecting the information and in order to help answer more specific policy questions. At this 
relatively early stage, however, the methodology is not encouraging countries to capture every single 
financing flow (or capital stock) in the smallest detail but rather to identify ballpark financing 
allocations, based on a combination of real data and a number of transparent assumptions (for the 
cases where the information base is non-existent or very poor). Early identification of questions that 
policy-makers want to address based on WASH Accounts data will be essential so as to ensure that 
the data being produced is policy-relevant. 
To generate and analyse data in order to answer those questions, the methodology proposes to follow 
a series of steps, as outlined in Figure 1 below. Step 5 (“Provide feedback for methodological 
development”) has been included so that the results of the testing exercise can be used in order to 
improve the methodology used at a global level (including for the GLAAS 2014 report).
Figure 1 - Overview of proposed methodology to track financing to WASH at national level 
Source: authors. 
The development of WASH-Accounts is likely to give rise to a number of specific 
challenges. These challenges (and potential solutions) are highlighted in boxes with the 
sign to the left. 
Target Audience 
This methodology has been developed for the use of governments, especially in lower income and 
middle-income countries. It is designed to guide the preparation of WASH Accounts in countries so 
that they can be used for policymaking, as well as for international reporting, such as for the GLAAS 
report. It would also be of interest for bilateral donors, multilateral institutions, NGOs and 
philanthropic organisation looking for financial data to support their decisions regarding the design of 
their programs, both at international and country levels.
Testing the methodology and providing feedback 
This version of the guidance document has been prepared with the view that it would be tested in 
about up to four participating countries. The objectives of the testing “exercise” are as follows: 
 To evaluate the feasibility of collecting financing data on the WASH sector at national or regional 
10 
level in a way that is comparable and consistent; 
 To assess the extent to which national statistical offices are able to provide financial information 
on the WASH sector in a way that can be used by sector policy-makers and on reverse, the extent 
to which sector policy-makers could express their demands to statistical offices so that 
information can be provided in a reliable and standardised manner; 
 To identify challenges and potential solutions when applying this methodology, including the 
conceptual framework developed to identify and track the financing flows as well as the tools 
developed to present the information; 
 To get feedback on the long-term feasibility of national WASH-Accounts and on methodological 
developments that may be required over the long-term. 
Overall organisation arrangements of the testing 
The TrackFin initiative is managed by a small secretariat hosted by WHO. In addition to WHO staff 
member, the Lead international Consultant (Trémolet Consulting) will provide overall methodological 
guidance for the work at international and country level and the Country-level Consultants will 
provide guidance and management support to conduct the testing studies at country-level. National 
stakeholder groups will be established in each country where the testing will take place, based, where 
possible, on existing sector coordination mechanisms. 
The approach to the testing exercise will be the same in all countries as described in this document. 
 The testing exercise will start by identifying key points of contact at national level, and where 
appropriate based on previous contacts established by GLAAS; 
 The national level points of contact (which are likely to be within one or several of the lead 
Ministries for the sector) will be requested in each country to convey a national level stakeholder 
group to oversee the testing exercise and provide feedback. These groups would ideally build on 
existing country-level WASH sector coordination platforms (with representatives of the 
Ministries in charge of Water, Sanitation and Hygiene and the Ministries of Finance) to which the 
Department of Statistics should be invited. The national level point of contact should chair this 
national level stakeholder group and be in charge of getting agreement of a country-level 
workplan; 
 Testing at country level will be carried out by national consultants selected by national authorities 
in coordination with WHO, with the support of the Country Consultant. The national level point 
of contact, in coordination with WHO team, will prepare terms of reference to reflect country 
context, data availability and specific study questions that can be tested in this particular country 
so as to engage a local consultant to assist with the data collection and analysis based on the 
methodology. These consultants will be funded by WHO. The final selection should be based on a 
consensus decision with respect to the team leading the initiative, based on a short-list of potential 
consultants that were recommended by key national contact points, the GLAAS secretariat, 
national-level WHO offices or the international consultancy team. Based on these ToRs, WHO in 
coordination with national authorities will procure the national consultants, who will be briefed by 
the national level contact point and the Country Consultant. The latter will also be responsible for 
ongoing quality control and providing assistance with the implementation of the methodology;
 The national consultants will conduct preliminary work to collect available information and 
identify key issues for the application of the proposed Guidance Document to their proposed 
country context. They will then identify potential options to address such issues and present those 
to a national-level workshop to which all members of the national stakeholder group will be 
invited, together with a broader range of actors if available (such as decentralised governments); 
 Based on methodological choices formulated at the national-level launch workshop, the national 
level consultant will gather necessary data, conduct rapid surveys if necessary, analyse the 
information and submit a draft report to the Country Consultant. Following incorporation of 
comments and questions from the Country Consultant, this report will then be submitted to the 
national stakeholder group for review via the national contact point; 
 The national consultants and the national contact point will then organise a final workshop, at 
which the results from the analysis will be presented, together with methodological issues 
encountered and recommendations for mainstreaming into the national processes and 
methodological developments (both at the national level and international level, via revisions to 
the international methodology as a result of the testing exercise). 
In each country, the aim will be to use as much recent and original work as possible, liaising as 
necessary with key experts in WHO regional and country offices, INGOs, NGOs, consultants, 
governments, research/academic institutions and multilateral bodies such as the World Bank's Water 
and Sanitation Program. 
The national-level reports will be developed based on a common format which will be specified in the 
national level Terms of Reference. In each country, the national consultants will prepare a maximum 
of a 60-page long report (with any additional relevant detail presented in Annexes) and an Executive 
Summary. This report will cover three main aspects: 
 Results of the analysis for the specific country; 
 Policy recommendations that can be inferred from the results of the analysis; 
 Recommendations to the WHO secretariat and expert group with respect to how the global 
11 
methodology could be improved / modified. 
Based on the results of the testing exercise, this guidance document will be revised and circulated to 
all countries willing to participate to the GLAAS financial data collection exercise. 
Structure of the guidance document 
This guidance document takes the reader through each of the steps for applying the proposed 
methodology. It is structured as follows: 
 “Step 1 – Getting started” sets out the initial steps that countries should take in order to get the 
exercise of building WASH Accounts going. 
 “Step 2- Collect financial data” is the “heart” of this guidance document as it includes guidance 
on collecting and organising the data as the input into the WASH Accounts. It recommends 
alternative methodologies for such data collection to reflect different circumstances. 
 “Step 3 – Analyse financial data” proposes a set of tables that constitute the “WASH Accounts” 
(the “output”) and from which a number of standard indicators can be extracted to analyse the 
sector. Depending on the policy questions that they want to answer, countries can choose to 
prepare only a sub-set of these tables or to drill down on particular aspects by adding more tables. 
 “Step 4 – Interpret and disseminate findings” contains guidance with respect to how the data 
can be interpreted and used for policy-making, highlighting potential pitfalls and future 
methodological developments.
 “Step 5 – Provide feedback for methodological development” summarises what is expected 
from countries participating in the testing exercise in terms of feedback to be provided on the 
objectives and nature of the testing exercise. 
The sections are presented in the order in which the activities will need to be conducted. However, it 
is important that the teams in charge of carrying the exercise read through the entire guidance 
document prior to initiating the exercise. 
To complement this guidance, a series of notes has been developed to provide additional background 
on the methodology and set out alternative methodologies for specific areas. These notes have been 
designed to be stand-alone notes so that they can be used in different circumstances and feedback can 
be obtained from different sets of stakeholders and experts depending on their thematic area. During 
the testing exercise, each country will be encouraged to use those to firm up their approach and to 
provide feedback on the methodology that appears most suitable to meet their needs. 
Methodological notes 
 No 1: Developing a classification of WASH services 
 No 2: Developing a classification of WASH sector actors 
 No 3: Estimating funding of WASH services with a “financing source approach” 
 No 4: Estimating the costs of providing the service with a “cost-based approach” 
 No 5: Estimating capital stocks for WASH using a “fixed asset stock approach” 
 No 6: Preparing WASH Accounts tables and indicators 
In addition: 
 Annex A provides a summary of actions to be undertaken at national level under each step; 
 Annex B contains a brief description of the System of Economic and Environmental Accounting 
12 
for Water (SEEA-Water), with which the WASH Accounts are looking to align over time; 
 Annex C includes a glossary of key terms employed in this guide 
 Annex D contains a list of useful references and relevant websites.
1 Step 1 – Getting started 
A number of preliminary steps need to be completed so as to start the process prior to data collection. 
For optimal success, countries should start the preparation of WASH accounts in response to a clearly 
expressed policy demand. The construction of WASH Accounts will most benefit countries if the 
results are ultimately used by policymakers and sector stakeholders. 
13 
Step 1 - Summary of tasks to be undertaken 
 Create political buy-in: 
- Identify a country champion to be the national point of contact (POC) 
- Convene a national level stakeholder group to oversee compilation of data and provide 
political support to the project 
 Identify policy questions: 
- Organise an initial kick-off meeting with members of the national level stakeholder group 
- Agree on a list of priority policy questions that the data collected will aim to answer 
 Set up the team in charge of data collection and analysis: 
1. Build a strong WASH Accounts team backed up by institutions 
2. Identify available data and define a data collection plan 
3. Develop a detailed budget and work plan for data collection and analysis 
1.1 Create political buy‐in 
The first step will consist of generating political buy-in from high-level members of the 
government, within the ministries in charge of WASH services or at the level of the Ministry of 
Finance. Creating political will is key to ensure the success of the exercise and to overcome potential 
technical difficulties (including limited availability of information, weak information systems or 
internal barriers to greater transparency). To that end, a political champion will need to be identified 
in the country to lead the exercise, and to appoint a national level point of contact. The latter will 
receive a package of information to be disseminated amongst high level government members and 
key sector stakeholders to raise awareness on the benefits of gaining a better understanding of 
financing to the WASH sector and on the potential policy uses of WASH Accounts. 
Once a country expresses interest in preparing WASH accounts, the national level point of 
contact (POC) will be requested to convene a national level stakeholder group to oversee their 
compilation. This group will be responsible for identifying policy questions and providing feedback 
at critical moments when the analysis is being developed. The group will ideally include 
representatives of the Ministries in charge of water, sanitation and hygiene and of the Ministry of 
Finance, as well as from main utilities, regulators, donors, NGOs and Foundations active in the 
country. To the extent possible, the group will build on existing country-level WASH sector 
coordination platforms, to which the Department of Statistics should be added (as it may not take part 
on a regular basis to WASH sector-level groups). The national level point of contact (POC) will chair 
this national level stakeholder group. The chair will also take the lead to establish and manage the 
WASH Accounts team responsible for the data collection exercise (see Section 1.3 below). 
The national level stakeholder group will provide key political support for the testing exercise. 
This is not only important to link the production of WASH Accounts to the policy process and 
institutionalise it later on, but also to conduct the present exercise. They can leverage their network to 
gather key politicians to formulate the policy questions that WASH Accounts will aim to answer, to 
connect a wide range of skills to form the WASH Accounts team and to disseminate the results.
14 
1.2 Identify policy questions 
To ensure that WASH Accounts are useful for the country and will be used by policymakers to 
make decisions based on evidence, WASH Accounts need to be designed to answer policy questions 
expressed by policymakers. Although it is expected that countries collect the common basic indicators 
on the WASH sector, these policy questions will drive the level of detail that needs to be reached for 
data gathering, as well as the selection of complementary indicators that will be calculated in this 
exercise. For instance, Ministries might be looking for data on the total expenditure for the WASH 
sector to compare it with other countries or sectors, and use this data to advocate for mobilising more 
resources for the WASH sector. Policymakers may also wish to know more precisely the exact 
financing potential of households to decide how much public support is needed and how household 
investments could be better supported. 
 Examples of possible policy questions that can be addressed through WASH Accounts can be found in 
Section 4.2 “Turning data into policy - Interpreting and disseminating the data”. Methodological Note No 
6 contains a list of WASH Account tables and indicators that can be built in order to provide information 
to address these policy questions. The national level stakeholder group and the subsequent WASH 
Accounts team should therefore familiarise themselves with these Tables prior to starting. 
These policy questions will drive the level of detail that countries want to reach with specific aspects 
of the analysis, which is why it will be important to agree on these questions prior to defining a data 
collection plan. To that end, it is proposed that the national point of contact will gather members 
of the national level stakeholder group for a kick-off meeting, in order to agree on a list of 
priority policy questions. On this basis, the national level point of contact (POC) will then agree on 
tailored Terms of Reference for the testing exercise with WHO secretariat. Those Terms of Reference 
will reflect the country’s context, data availability, policy questions that are relevant to the country 
and specific methodological questions that can be tested in the country. 
Some of the participating countries might be in the process of preparing Water Accounts based on the 
SEEA-Water methodology. In those cases, testing the UN-Water GLAAS TrackFin methodology in 
parallel with the preparation of Water Accounts will enable to draw conclusions on the extent to 
which there are economies of scale relative to data collection and on the compatibility of the 
approaches. Box 2 below provides summary information on this methodology. 
Box 2 - The System of Environmental-Economic Accounting for water (SEEA-Water) 
The System of Environmental-Economic Accounting for Water (SEEA-Water), prepared by the UN Statistics 
Division, provides a conceptual framework for organizing hydrological and economic information in a coherent 
and consistent manner thus overcoming the tendency to divide issues along disciplinary lines. It is based on the 
2003 System of Environmental and Economic Accounting (SEEA) and was further elaborated to reflect the 
2008 System of National Accounts (SNA). SEEA-Water provides the framework for developing Water 
Accounts, which share a similar structure, definitions and classifications with the SNA. In 2007, the SEEA-Water 
framework was adopted as an international standard by the UN Statistical Commission, which encourages 
countries to implement it. To date, more than 50 countries have expressed interest in compiling national 
environmental-economic accounting for water following the SEEA-Water framework. These are mostly 
developed countries (mainly European Union countries, along with Australia), but some developing countries 
from different regions of the world are also starting to adopt the framework, including Algeria, Bolivia, 
Botswana, Brazil, Colombia, Dominican Republic, Ecuador, Egypt, Jordan, Lebanon, Mauritania, Mauritius, 
Mexico, Morocco, Namibia, Palestine, Panama, South Africa, Tunisia and Zimbabwe. At the national level, 
SEEA-Water is being implemented gradually, as a step-by-step process. Only a few countries have been able to 
develop a complete set of Water Accounts, including for both physical and monetary data. The UN Statistics 
Division is encouraging countries to use this system of accounts by organizing regional workshops and 
delivering capacity-building activities. Other institutions, such as the World Bank are providing financial 
support to countries that wish to adopt this system, in particular through the WAVES partnership. 
Source: (United Nations Statistics Division, 2012). See also Annex B.
15 
1.3 Set‐up the team in charge of data collection and analysis 
1.3.1 Build a strong WASH Accounts team backed up by institutions 
Based on these ToRs, the national level point of contact (POC) will set up a WASH Accounts 
team to carry out the testing exercise at country level. The WASH Accounts team should ideally 
be composed of people with a diverse range of expertise, technical and policy experts from the 
WASH sector as well as representatives from the National Statistics Office, and good analytical and 
communication skills. The WASH Accounts team will be briefed by the POC and the International 
Consultants appointed by WHO. The latter will also be responsible for on-going quality control and 
providing assistance with the implementation of the methodology. 
To the extent possible, team members should belong to government’s administration, to ensure 
capacity building at national level and appropriation of the exercise by the country, regardless of the 
fact that the work is then be done through national consultants. For the testing exercise, if national 
consultants are funded by WHO, the consultants would be selected and hired by WHO. The selection 
will be done at country level based on a short-list of potential consultants, assembled based on 
recommendations from the key national contact point, GLAAS secretariat, national-level WHO 
offices and the international consultancy team. 
Hiring external national consultants would spare financial and human resources from the 
national governments and avoid diverting employees away from their ongoing regular 
work, in particular given the short time frame for this project. By contrast, if the personnel 
conducting the WASH Accounts study are completely external to the government, it may 
create the risk that the testing exercise would be a one-off exercise and that skills and 
expertise developed along the way are lost. 
The WASH Accounts team will conduct preliminary work to collect available information and 
identify key issues for the application of the proposed methodology to their proposed country context. 
They will then identify potential options to address such issues and present those to a national-level 
workshop to which all members of the national stakeholder group will be invited, together with a 
broader range of actors if available (such as decentralised governments). 
1.3.2 Identify available data and define a data collection plan 
The WASH Accounts team will start by identifying available sources of information so as to support 
data collection, based on three core principles: 
 Use all suitable existing data; 
 Adjust existing data to match the objectives of the WASH Accounts; 
 Arrange for the collection or generation of the “missing” data. 
To keep the costs of the exercise down, countries should identify which data is already available 
in previously existing reports. Examples of potential documentation appear in Box 3 below. 
Box 3 - Examples of pre-existing information to be collected (as appropriate) 
 Household surveys (e.g. Multi Indicator Cluster Surveys) 
 Access data from the Joint Monitoring Programme 
 The GLAAS Report and survey responses 
 Information on the water sector at the level of the National Statistical Offices 
 WSP’s Country Status Overviews (in Sub-Saharan Africa only) 
 PRSP documents and planned poverty reduction expenditure 
 Medium Term Expenditure Frameworks 
 National sector plans and policies
 National budgets 
 Local government budgets (for decentralised WASH sectors, for a sample of localities) 
 Utilities’ financial accounts 
 Sector financing reports produced by the sector regulator (where they exist) 
 OECD Creditor Reporting System and data from the DAC database 
 SWA Aid Effectiveness Working Group and Country Processes Working Group documentation 
 Data from the IBNET database 
 UN-Water Country Briefs 
 World Bank Public Expenditure Reviews (PERs) 
 United Nations Economic Commissions' relevant studies 
 Africa Infrastructure Country Diagnostic studies 
 WASH sector reports 
 Project-specific documentation 
 Reports on decentralisation processes 
 Benchmarking reports from utility associations, governments (e.g. Brazil, India) or regulators (e.g. Kenya, 
16 
Mozambique etc.) 
In countries where there has already been some analysis of the WASH financing system, country 
profiles and reports on different segments of the system may indicate other data sources. The WASH 
Accounts team will also need to interview key informants at stakeholder institutions to identify the 
extent to which data is available within those organizations. With respect to private operators and 
non-profit organisations, it will be important to seek out umbrella organizations, such as NGOs and 
industrial associations, in order to make it easier to find data sources and to ensure that those sources 
can be made public. It will also be useful to contact international organizations that may have 
database that can complement national sources. 
Aligning with National Statistical Offices (NSO) systems. A key area to explore up-stream 
of testing the methodology will be to assess the extent to which National Statistical 
Offices (NSOs) collect financial data from the WASH sector at a level of detail that allows 
drawing conclusions for policy definition. Different types of situations may be identified: 
 If NSOs do collect data on WASH, it will be important to work with them to identify 
how this data can be extracted and used by sector actors. This would be the best way to 
ensure that the data collection exercise is embedded in national systems and can be repeated 
over time at least cost. A key area of coordination will also be to identify how NSOs and 
sector stakeholders can work together to translate WASH sector policy needs and produce 
data at the most appropriate level of disaggregation. WASH sector stakeholders can also 
learn from NSOs on data collection methods. 
 If the level of detail of WASH statistical data is insufficient (either because NSOs are 
poorly performing or they do not collect data from a comprehensive set of WASH service 
providers), it will be necessary to initiate a specific sector-level data collection process. It 
will be preferable to align with the statistical office’s classification in order to facilitate 
integration further down the line. 
The type of data that will be needed and potential sources for this data is set out in more detail in 
Section 2, which gives a step-by-step guide on how to collect the information. In some cases, it will 
be necessary to collect primary data, particularly for the costs of certain service providers (e.g. 
informal service providers) or certain financing sources (e.g. household investment in on-site 
sanitation) that are unlikely to be routinely collected by NGOs. When such surveys are not possible or 
too expensive, it will be necessary to formulate assumptions to derive initial estimates, even if these 
are approximate. The exercise will necessarily be limited by data availability. Therefore, the WASH 
Accounts team should initially be aiming at a reasonable but optimal level of accuracy, searching for 
the 20% of sources that will provide 80% of the needed data.
Section 2 of this guidance document proposes a way forward on specific issues depending on the type 
of data to be collected: it will therefore be important that the WASH Accounts team reviews this 
Section in detail prior to defining its work plan. Conducting additional data collection will clearly 
have budgetary implications, which should be identified from the start: it will be important to consider 
trade-offs between different types of data collection as well. 
1.3.3 Develop a detailed budget and work plan 
Once policy questions have been identified and available information has been mapped out, the 
WASH Accounts team will be responsible for defining a work plan and detailed budget. These 
documents should be approved by the national level stakeholder group. It will be important to start 
with reasonable expectations in terms of level of detail and complexity for the information, and to 
improve it over time. The WASH Accounts team, in conjunction with the national level stakeholder 
group, will need to define the space and time boundaries of the accounts, taking account of the 
potential challenges indicated below. 
Potential challenges to consider when defining a budget and workplan 
 WASH Accounts would preferably cover the entire national territory but could 
include detailed information for specific regions only, with data for other regions 
based on extrapolations. If there are substantial discrepancies between geographic 
areas, regions should be classified into types and data should be obtained from at 
least one region from each type, so as to allow a more representative extrapolation of 
regional-level data. 
 Depending on the organisation of the WASH sector in the country, data 
collection will likely be conducted separately in each sub-sector. Typically, in a 
developing country, the service provision and financing arrangements for urban 
water, urban sanitation, rural water and rural sanitation tend to differ, hence the need 
to consider each of the four “sub-sectors” separately. As a result, the analysis may 
need to be repeated for each of the four sub-sectors, even though the methodological 
tools and approaches for each of the sub-sectors will be the same. 
Providing feedback on the methodology 
Countries participating to the testing exercise will be invited to comment on the process proposed in 
Step 1 to initiate the exercise and create political buy-in within Ministries. Views are sought on 
whether it would be useful to gather simplified indicators on the sector (as “Quick Wins”) in Step 1 to 
demonstrate to decisions makers that the exercise will be useful so as to show them how the data can 
be used. This would aim to create more political support to the team collecting the data. 
17
2 Step 2 – Collect financial data 
This section sets out the framework for developing WASH Accounts in more detail: it is intended to 
serve as a practical guide for the collection of financial data under Step 2. 
The WASH Accounts team will need to answer three basic questions in order to collect the data: 
 Which WASH services are consumed? 
 How are services provided and by whom? 
 How much do these services cost and how are they financed? 
This framework of analysis is based on the basic premise that all services that are consumed are also 
provided and financed in some way, which means that conducting the analysis alongside these three 
axes should ultimately yield the same results. 
Taking account of “financing losses” in the system 
In some cases, financing allocated to the sector may not translate into actual services 
consumed, due to various losses along the way. Ideally, these “losses” would need to be 
quantified and it could be a long-term objective of the TrackFin initiative to help quantify 
how much financing is “budgeted” or “allocated” but does not actually result in service 
delivery. This kind of analysis, although important, will most likely be difficult to 
conduct in the initial stages of applying the methodology, as it requires keeping track of 
many complex datasets simultaneously. At this stage of methodological development, it is 
preferable to obtain actual expenditure amounts for all types of flows. This would allow 
comparisons between different sources of funding and would provide a more accurate 
representation of actual expenditure in the sector. If obtaining actual expenditure 
information is proving challenging, it could be possible to estimate it based on budgeted 
amounts and estimated percentages of realisation (based on past experiences). (See the 
Challenge Box “Identifying which financing flows can be tracked in Section 2.3). In 
addition, it could also be useful to complement this with qualitative and quantitative 
assessments of the difference between budgeted amounts and actual spending. 
Figure 2 below (based on a similar figure for the SHA) presents the main dimensions that need to be 
examined in order to track financing to the WASH sector at the national level in a comprehensive and 
reliable manner. The following sections provide more detail about what to do to generate this data. 
18
Figure 2 - Financing flows in the WASH sector: mapping the sector based on consumption, production & financing 
19 
FINANCING SOURCES 
 Tariffs for services provided 
 Households’ expenditure for self-supply 
 Domestic public transfers 
 International public transfers 
 Voluntary contributions 
 Repayable financing 
What is being 
financed by whom? 
FINANCING UNITS 
 National authorities 
 Regional authorities 
 Local authorities 
 Network corporate providers 
 Non-network corporate providers 
 Economic and quality regulators 
 Bilateral and multilateral donors 
 Banks and Financial Institutions 
 NGOs and community-based 
organizations 
 Households 
COSTS 
 Capital costs including hardware and 
software 
 Operating and minor maintenance costs 
 Large capital maintenance costs 
 Cost of capital 
 Support or software costs 
What is being 
produced by whom 
and at which cost? 
SERVICE PROVIDERS 
 Government agencies 
 Network corporate providers 
 Non-network corporate providers 
 NGOs and community-based 
organizations 
 Households (self-provision) 
SERVICES 
Water supply services 
 Water supply through large network 
systems 
 Basic drinking water supply 
Sanitation services 
 Sanitation though large network systems 
 Basic sanitation 
Support services to the WASH sector 
 Administration of water and sanitation 
programmes 
 Regulation of these sector of activities 
 Governance and legislation 
 Education and capacity building 
Water resources Management 
 Services in relation to water supply and 
sanitation services 
What is being 
consumed by whom? 
TYPES OF USES 
 Served domestic use 
 Self-provided domestic use 
 Served institutional use 
 Self-provided institutional use 
 Served industrial and commercial use 
 Self-provided industrial and commercial 
use
20 
2.1 Define WASH sector boundaries in terms of services 
Step 2.1 - Summary of tasks to be undertaken 
 Define a classification of WASH services that will be used for the testing exercise: 
- Identify the classifications and categories of WASH services that are being used in the 
country. 
- Analyse similarities and differences with available international classifications (see Table MN 
1.6): can the same categories be used? Is data collected on this basis in the country? 
- State very clearly which activities are included in the WASH sector definition, preferably by 
reference to international classifications 
- Collect data according to these categories if possible or based on aggregate categories (e.g. 
water supply services, sanitation services, construction services, support services) 
 Specific task for the testing exercise: Provide feedback on the following questions: 
- Is the proposed list (see Table 1.) usable and useful in your country to define sector 
boundaries? 
- What would be the ideal level of aggregation of data that would answer policy questions and 
be easily collected at the same time? 
- Can WASH data based on international classifications be found in your country? 
- Would it be necessary, in your opinion, to refine existing classifications in order to better 
match WASH sector needs? 
Why is it important to define the WASH sector in terms of services? 
The WASH Accounts team will need to start by defining the “boundaries” of the WASH sector 
in the country based on a list of potential services to be included. 
Adopting and using a common classification of products, services and activities relevant to the 
WASH sector is essential in order to ensure that the information produced for the GLAAS exercise 
(and beyond) is consistent, comprehensive and comparable. This applies to the collection of financial 
information as well as to any other type of information collected through the GLAAS report. Such a 
definition often varies from one country to another, and it is therefore essential to clarify what is 
included in the sector in the country where the analysis is conducted. 
There are several specific objectives (and associated challenges) when defining sector boundaries: 
 To identify the list of products and services for which costs and financing sources are to be 
tracked through the WASH accounts. Such products and services may be produced jointly with 
other water services by certain actors. For example, some water companies that distribute water 
may also be involved with managing water resources up-stream or managing irrigation schemes 
for agricultural purposes. Other services may be seen by some as going “hand-in-hand” with the 
provision of WASH services, such as solid waste management, whereas other countries would not 
typically include solid waste management in their sanitation definition. Some countries might 
have difficulties including hygiene, as they would not track this on a regular basis. Making 
reference to a common list will help countries identify which services should be included (such as 
downstream sludge management) and which should be excluded (e.g. building of dams which are 
mostly for hydropower generation). 
 To define categories of services for which financing should be tracked separately. This could 
be done in order to be in a position to draw policy conclusions on whether financing is allocated 
to the right type of services or products. In the early stages of implementing the methodology, it 
might only be possible to disaggregate based on a few types of services (at the very least, between
water and sanitation services). However, the long-term objective for methodological development 
is to allocate financing to different service categories so as to improve the detail of the analysis. 
To the extent possible, all countries reporting to GLAAS should do so based on a common 
definition of the WASH sector. If this is not possible (because of the way in which their water sector 
is organised), reporting countries should be explicit about which services are included (or not) in their 
definition so that sources of difference can be clearly attributed and understood. 
Learning from the health sector – The System of Health Accounts (OECD, 2011) defines the 
boundaries of health care activities from an international perspective based on the functions of 
health care. Health expenditures are included in Health Accounts based on the following four 
elements. To be accounted for, they should involve: 
a) A transaction; 
b) Which is linked to the consumption of a resident; 
c) Whose primary purpose is health (the “purpose” of the spending determines the 
health care functions. This is defined as “the type of need that the transaction aims to 
satisfy or the kind of objective pursued ”); 
d) Which involves the application of a qualified health knowledge (direct or through 
21 
supervision). 
Are included in the boundary of HA, activities which aim to “improve, maintain and prevent 
the deterioration of the health status of persons and mitigating the consequences of ill-health 
through the application of qualified health knowledge. Based on this criteria, health activities 
are classified in 7 main categories of health care functions sub-divided in a total of 36 
categories (Health promotion and prevention; Diagnosis, treatment, cure and rehabilitation of 
illness; Caring for persons affected by chronic illness; Caring for persons with health-related 
impairment and disability; Palliative care; Providing community health programmes and 
Governance and administration of the health system). Countries chose what they can classify 
based on the nature of their national health statistical systems, the data available and the 
ability to implement an accounting framework based on a classification based on health 
purpose. 
What do we mean by the WASH sector? 
Broadly defined, the “WASH sector” refers to the provision of water, sanitation and hygiene 
services. These services may be purchased from WASH service providers or self-provided. 
The fact that the GLAAS report has been defined in the global monitoring architecture as the report 
that enables tracking inputs whilst the JMP tracks outputs and outcomes (particularly in terms of 
attaining the MDGs) has a number of implications for the definition of the WASH sector for the 
present exercise. The MDGs aim at halving the number of people that do not have access to water and 
sanitation. Specific emphasis is placed on the provision of services in or near the home (as opposed to 
in working spaces or institutions). This means that for the purpose of tracking financing (i.e. the 
“inputs”), it would be preferable to include information from service providers that serve households 
(i.e. commonly referred to as “domestic water providers”) and institutions (administrations, schools, 
hospitals, etc.) as opposed to commercial, industrial or agricultural users. This can raise challenges as 
most municipal service providers serve households and institutions but also other types of customers 
(see the box below on typical challenges). 
Potential challenges involved with defining the WASH sector and ways to address 
such challenges 
 WASH service providers serve a wide range of different types of users, including 
industrial, commercial and institutional users). This is a key difference with the health 
sector, for example, where services are basically consumed by individuals. 
Disaggregating financial data to separate out services received by households only is 
likely to be time-consuming and in some cases impossible to achieve. In the first
instance, we recommend tracking financing for service providers that primarily serve 
domestic and institutional users, noting if possible the proportion of revenues (and costs) 
that relate to other types of users (such as commercial or industrial). 
 Not all WASH services are “provided”: many households or industrial users self-provide 
water and sanitation services, particularly when network services are too 
expensive or not accessible (households) or network service quality is not satisfactory 
(unreliable service hours, inadequate quality, which mean that industrial users develop 
their own water supply). These “own-use” activities need to be included (as they are in 
the Water Accounts) in order to capture the whole range of services. 
 WASH service providers need to carry out other activities up-stream and 
downstream of providing services to households in order to contribute to managing 
the water cycle sustainably. Boundaries with water resource management are 
sometimes difficult to draw. We recommend including the water resource management 
activities that a water service provider should undertake as part of its normal activities to 
protect water sources but to exclude, to the extent possible, water resource management 
for other types of uses, such as irrigation schemes or hydro-energy production. 
 None of the existing international classifications has identified hygiene relating to 
water and sanitation as a specific product or service category. If hygiene financing is 
going to be adequately tracked, this would require developing, adopting and 
mainstreaming specific classifications (for products, service providers and functions). 
This is not a priority during the first phase of methodological development but would 
need to be explored in subsequent stages. 
 Water resource management activities do not strictly speaking fall under the 
definition of WASH services. However, some of these activities are implemented by 
water service providers and are essential for the sustainable provision of such services. It 
is therefore recommended, if possible, to take into account financing going to the water 
resource management activities that are directly relevant to water and sanitation service 
provision but exclude broader water resource management activities, such as the 
construction of dams for irrigation purposes for example. 
Providing access to water and sanitation is only a subset of the services that are needed in order to 
manage the water and sanitation cycle in a sustainable manner whilst serving the needs of all users. 
These other activities can be referred to as the WASH services “value chain”, as presented in Figure 3 
below. 
22
23 
Figure 3 - The value chain of WASH services 
Source: “Benefits of investing in water and sanitation: An OECD Perspective” (OECD, 2011), p.31 
In addition, to ensure that the overall WASH sector is functioning adequately, additional functions 
need to be carried out typically at the national ministry level (or regional level, in the case of federal 
systems), such as sector planning, management and coordination functions. 
 Methodological Note No 1: Developing WASH services classifications provides additional detail on 
existing international classifications (with a particular focus on CPC, ISIC and COFOG), how they can be 
used to support the analysis of the WASH sector and what modifications might be necessary in order to 
enable a more detailed analysis of the sector. Table MN1.4 in Methodological Note No 1 contains a list of 
those services and support functions according to existing international classifications (mainly CPC, ISIC 
and COFOG). To ease understanding, we have reordered these classifications to match the value chain 
presented in Figure 3 above. The classification of WASH goods and services proposed for this exercise is 
presented in Figure 1below. As these classes are commonly accepted and used, we recommend using them 
to identify the boundaries of the WASH sector and identify which activities should be included or excluded 
when tracking transactions to WASH. 
Whether or not these services are provided depends on the level of development of the water 
sector in a given country. In most developing countries, these services are unlikely to be provided in 
a comprehensive manner. For example, where providing access is a priority, wastewater collection 
and treatment services are often very limited. However, for the purpose of the testing exercise and to 
ensure its global applicability, the classification includes all critical services that would ideally need to 
be provided, from which countries can select as appropriate. To the extent possible, we recommend 
collecting data according to the categories presented on Table 1 below.
24 
Table 1 – Proposed classification of WASH goods and services 
Code Category Activities included Included 
in 
S1 Water supply 
services 
Water supply 
through large 
network systems 
 Collection of rain water and water from various 
sources (from rivers, lakes, wells); 
 Purification of water for water supply purposes, 
desalting of sea/groundwater by treatment plants; 
 Storage of water; 
 Large scale transmission / conveyance of water in 
pipelines; 
 Distribution of water through mains (includes water 
pumping and transport in local water networks); 
 Management of water connections and consumer 
support activities. 
ISIC: 36 
Basic drinking 
water supply 
 Collection of rain water and water from various 
sources (rivers, lakes, wells) using handpumps, 
spring catchments, gravity-fed systems, rainwater 
collection and fog harvesting; 
 Point-of-use water treatment for drinking purpose; 
 Storage of water in tanks; 
 Distribution of water through small distribution 
systems (pipes, wells or trucks) or local 
neighbourhood networks typically with shared 
connections/points of use; 
 Management of water access points and consumer 
support activities, 
S2 Sanitation 
services 
Sanitation though 
large network 
systems 
 Construction of sanitation facilities in households 
and communities and connection to large sewage 
systems; 
 Collection of sewage by large scale sewer systems 
including trunk sewers and sewage pumping 
stations and drains; 
 Sewage treatment and disposal, including residual 
sludge disposal; 
ISIC 37 
Basic sanitation 
 Promotion of sanitation, including demand 
promotion and sanitation marketing; 
 Construction of basic sanitation facilities in 
households and communities (latrines, septic 
systems, etc.); 
 Collection and transport of sludge from onsite 
facilities (pits emptying and cleaning services); 
 Treatment and disposal of sludge by faecal sludge 
treatment facilities; 
S3 
Support 
services to the 
WASH sector 
 Water and sanitation sector policy making and 
governance, including: 
o Development of sector policies 
o Legislation : Definition and enforcement of 
drinking-water and discharge standards for 
municipal wastewater 
o Regulation of water and sanitation supply 
activities and service providers 
o Sector planning, including estimating future 
sector financial needs 
ISIC 
8412
Code Category Activities included Included 
in 
25 
o Administration of water and sanitation 
programmes; 
 Education & capacity building in water supply and 
sanitation 
S4 
Water 
resources 
Management 
(linked to 
water and 
sanitation 
services) 
Water resources 
protection 
 Collection and usage of quantitative and qualitative 
data on water resources; 
 Creation and sharing of water knowledge; 
 Conservation and rehabilitation of inland surface 
waters (rivers, lakes etc.), ground water and coastal 
waters; 
 Prevention of water contamination. 
River basin 
development 
Integrated river basin projects and related institutional 
activities; river flow control; dams and reservoirs. 
What needs to be done under this step? 
The WASH Accounts team will need to identify the list of WASH products and services that fall 
under the definition of WASH in their own country. In the first instance, it is unlikely that 
countries will be able to report financial information for each of those services separately. However, 
setting out a clear definition of what is included in their WASH sector will help when examining 
potential differences in funding across countries. To the extent possible (i.e. if data is available), 
countries should report on financing to different types of WASH services, so as to be able to evaluate 
financing allocations between different types of services. 
To the extent possible, we recommend collecting data according to existing classifications so as 
to ease the collection process and facilitate comparisons. To this end, countries can refer to existing 
classifications, which have been developed internationally (as summarised in Table MN1.4. and 
discussed in Methodological Note No1). These international classifications do not necessarily reflect 
adequately the realities of the WASH sector but they are currently the best available. Over time, the 
TrackFin initiative may be in a position to identify areas of weakness and recommend modifications 
to existing international classifications if those are likely to be needed. 
Countries may want to introduce further disaggregation for certain categories to reflect their 
own policy needs. For example, a country with a significant investment backlog for rural sanitation 
may want to adopt a higher level of disaggregation for these specific services. Each testing study will 
need to define which classification(s) can be used depending on the classifications used in the country 
and the amount of data that can reasonably be collected in the given timeframe. 
Providing feedback on the methodology 
Given that the ultimate goal of the exercise is to embed this data collection in national statistical 
processes, feedback will be sought on the appropriateness of existing classifications for the 
WASH sector and on the extent to which these classifications may need to be modified. One key 
objective of the testing exercise will be to better understand how existing classifications (CPC, ISIC 
and COFOG in particular) capture information on financing to WASH and how they are used and 
applied in the targeted countries. The WASH Accounts team will be asked to report on the 
appropriateness of the presented classifications of WASH services and suggest any modifications to 
contribute to the development of a list of WASH services that could be used later. 
 Methodological Note No 1: Developing WASH services classifications sets out potential issues with 
existing classifications and formulates initiate recommendations as to how these classifications may need to 
be amended in order to meet the policy needs of the WASH sector.
2.2 Identify the main WASH sector actors, map service provision and 
26 
financial flows 
Step 2.2 - Summary of tasks to be undertaken 
1. Identify and classify WASH actors, financing sources and uses of WASH services 
 On the basis of data already gathered in Step 1.3.2, identify the classifications of WASH 
actors, financing sources and uses that are being used at country level 
 Analyse similarities and differences with the proposed classifications: can some categories be 
used? Can collected data fit into the proposed classifications? 
 State clearly the classifications of WASH actors, financing sources and uses that will be used 
 Organise actors and financing sources into categories using the proposed classification. 
2. Map out the financing of the WASH sector (actors and financing flows schematised by 
categories) 
 Represent the WASH sector actors and financing sources for each of the four sub-sectors (if 
necessary, i.e. if there are substantial differences between them) 
3. Provide feedback on the methodology: 
 Assess if the proposed global classification covers all identified actors and financing sources 
at country level and whether it needs to be modified to better adjust to the country’s context. 
 Indicate whether a common classification of WASH actors, financing sources and uses is 
useful 
 Report on any difficulties encountered in carrying out the exercise and ways to address them. 
Why is it important to identify WASH actors and financial flows in the sector using a 
common methodology? 
Identifying the main actors of the WASH sector and the financial flows between them is 
essential to understand what type of data needs to be obtained and where it can be obtained. 
Building a graphical representation (as shown on Figure 4 below) of financing flows will facilitate 
this process, to ensure that all actors and flows and recorded and to communicate the results. 
To allow international comparisons and to ensure that the information produced is consistent, it 
is preferable that all countries participating in the exercise use the same (or similar) 
classification of WASH sector actors and of the financing flows circulating between them. 
At present there is no standard classification for actors in the WASH sector. Country-level statistical 
offices and WASH sector officials use their own classifications, which vary depending on the 
structure of the WASH sector in their country. The present methodology proposes a classification of 
WASH sector actors that could be adopted for this purpose and that is sufficiently broad to capture 
most (if not all) sector organisations. The proposed classification distinguishes between actors 
(service providers and financing units), financing sources (characterised by the origin of the funding), 
and the type of use to which the funding is allocated. This proposed classification was developed so as 
to align with existing classifications used at an international level, whilst proposing improvements to 
overcome certain identified weaknesses with existing classifications. If possible, it should be used 
across countries so as to present data on a comparable basis. Table 2 below presents this classification 
in a synthetic manner and contains all definitions for WASH sector actors, financing sources and uses 
of WASH services used in the present methodology. 
 Methodological Note No 2: Developing classifications of WASH actors and financing sources proposes 
and justifies a system of classification for the various types of sector actors and financing sources based on a 
thorough review of existing classifications. This system is summarised in Table 2 below.
27 
Table 2 – Definitions: uses of WASH services, WASH sector actors and financing sources 
Code Category Definition 
U: Uses of WASH services Type of use of WASH goods and services 
U1 Served domestic use Consumption of served water and sanitation services by households that are served by service providers and pay for the service via a 
tariff. This would include water supply to households that are connected to the water and/or sewerage network, but also water fetched 
from a public standpipe or other providers (e.g. water tankers). 
U2 Self-provided domestic 
use 
Consumption of self-provided water and sanitation services by households. Households have to pay up-front an initial investment (in a 
well or private latrine) to have access to the service and then need to cover operating and maintenance costs of their assets. 
U3 Served institutional use Consumption of served water and sanitation services by government agencies (such as Ministries, hospitals, schools) and voluntary 
organisations such as NGOs, CBOs or foundations. They are served by service providers and pay for the service via a tariff. 
U4 Self-provided 
institutional use 
Consumption of self-provided water and sanitation services by government agencies (such as Ministries, hospitals, schools, etc.) 
and voluntary organisations such as NGOs, CBOs or foundations. They make an up-front initial investment to have access to the 
service and then need to cover operating and maintenance costs of their assets. 
U5 Served industrial and 
commercial use 
Services used by commercial entities that are purchasing water and sanitation services from a service provider at the industrial or 
commercial tariff. 
U6 Self-provided industrial 
and commercial use 
Consumption of self-provided water and sanitation services by industrial or commercial entities. 
P: WASH service providers Actors engaged in the production and delivery of WASH services. These would include government institutions providing 
support services to the sector. 
P1 Government agencies Providers that are integrated in government. This would also include government agencies (such as Ministries, hospitals, schools, etc) 
and as well as self-provided municipalities (operating the service directly rather than through a corporatized entity). 
P2 Network corporate 
providers 
Utilities that own and/or operate facilities for production and distribution of water and sanitation services through network systems for 
the public, as well as for bulk services. They can be either privately or publicly owned, mandated or independent, large, medium or 
small-sized, providing a public service or self-providing the service for their own use. 
P3 Non-network corporate 
providers 
Corporations that provide any WASH good or service along the value chain at a small scale through non-network systems. They 
usually involve low skilled labour and small level of initial investments. They can take various organisational forms from cooperatives 
to private ventures, and be formal or informal. 
P4 NGOs and community-based 
organizations 
Non-profit making organisations that seek to complement WASH public services. They usually have a formal structure and offer 
services to people other than their members, and are, in most cases, registered with national authorities. Community-based 
organizations (CBOs) are a type of small NGOs that aim to mobilize, organize or empower their members, usually in a local area. 
P5 Households (self-provision) 
Households that self-provide the service. They have to pay up-front an initial investment (in a well or private latrine) to have access to 
the service and then need to cover operating and maintenance costs of their assets.
Code Category Definition 
FU: Financing units Institutional entities that provide funding to the sector. They mobilise funding to pay for WASH services. They may allocate 
28 
funds directly to service providers or channel them through intermediary institutions. 
FU1 National authorities Public authority at central government level, including Ministries (ministry of finance, ministry of water or other ministries) or 
national institutions 
FU2 Regional authorities Public authority operating at the regional level 
FU3 Local authorities Public body operating at the level of a smaller geographic area, such as a city, a town, or a district. 
FU4 Network corporate 
providers 
Utilities that own and/or operate facilities for production and distribution of water and sanitation services through network systems for 
the public, as well as for bulk services. They can be either privately or publicly owned, mandated or independent, large, medium or 
small-sized, providing a public service or self-providing the service for their own use. 
FU5 Non-network corporate 
providers 
Corporations that provide any WASH good or service along the value chain at a small scale through non-network systems. They 
usually involve low skilled labour and small level of initial investments. They can take various organisational forms from cooperatives 
to private ventures, and be formal or informal. 
FU6 Economic and quality 
Regulators 
Public authority responsible for the overall supervising of the WASH sector in the country (control of tariffs, quality of water, 
competition in the sector etc.) 
FU7 Bilateral and multilateral 
donors 
Governments providing official development assistance directly to a country or through multilateral international institutions (UN, 
World Bank or regional development banks) 
FU8 Banks and Financial 
Institutions 
A financial institution that provides banking services, such as taking deposits and providing credit facilities and loans to individuals 
and/or small businesses and corporations. 
FU9 NGOs and community-based 
organizations 
Non-profit making organisations that seek to complement WASH public services. They usually have a formal structure and offer 
services to people other than their members, and are, in most cases, registered with national authorities. Community-based 
organizations (CBOs) are a type of small NGOs that aim to mobilize, organize or empower their members, usually in a local area. 
FU10 Households Households that self-provide the service (such as on-site sanitation). They either pay up-front through initial investments (in a well or 
private latrine) or purchase services from a variety of providers (e.g. water tankers). 
FS: Financing sources Where funding originates from. This is what the OECD commonly refers to as the 3Ts (as tariffs, taxes and transfers) for 
which we are proposing a slightly amended classification. 
FS1 Tariffs for services 
provided Payments made by users to service providers for getting access to and for using the service. 
FS2 Households’ expenditure 
for self-supply 
Funding provided by households to invest in or provide the service themselves. Households have to pay up-front an initial investment 
(in a well or private latrine) to have access to the service and then need to cover operating and maintenance costs of their assets. This 
can be in form of cash, material or time. 
FS3 Domestic public 
transfers 
Public transfers from government agencies (central or local government) to WASH actors. These are often subsidies that come from 
taxes or other sources of revenues of the government. This category includes only grants and excludes concessionary loans (which are 
included in FS6). 
FS4 International public 
transfers 
Voluntary donations (or grants) from public donors and multilateral agencies that come from other countries. Concessionary loans are 
excluded from this category and entirely included in FS6 Repayable Finance.
29 
Code Category Definition 
FS5 Voluntary contributions 
Voluntary donations (or grants) from international and national non-governmental donors including from charitable foundations, Non- 
Governmental Organizations (NGOs), civil society organizations and individuals (remittances). Concessionary loans are excluded 
from this category and entirely included in FS6 Repayable Finance. 
FS6 Repayable financing 
Sources of finance that come from private or public sources and ultimately need to be repaid, such as loans (including concessionary 
loans and guarantees), equity investments or other financial instruments such as bonds. 
This category can be divided down into 2 sub-categories: concessionary repayable financing and non-concessionary repayable 
financing.
What needs to be done under this step? 
The first activity under this step entails identifying and listing all potential actors in the WASH 
sector, and gathering basic information on these actors (such as number of entities, legal status 
(formal or informal, publicly or privately owned) and geographical coverage). To conduct this 
exercise, it will be important to identify whether existing classifications of WASH actors and 
financing sources are being used at country level, either at the level of the NSO or by the WASH 
sector itself. If such classifications exist and are being used, it will be necessary to analyse similarities 
and differences with the classification proposed in the present methodology. It will then be necessary 
to state clearly the classifications of WASH actors and financing sources that will be used and to 
organise actors and financing sources into categories using the proposed classification. 
Once the bulk of this information is collected, the second activity will consist of mapping out how 
the sector is organised and financed, as presented schematically in Figure 4 below for a 
hypothetical WASH sector. This figure is purely illustrative for an imaginary sector and does not 
intend to exhaustively map out all possible financial flows. Mapping out financial flows needs to be 
distinguished (and kept separate) from mapping out institutional arrangements. The latter show lines 
of responsibilities and allocation of powers and functions (including policy-making, regulation, asset 
ownership, service provision, etc…) whereas financial mapping mainly focuses on tracking where the 
money comes from, how it travels and who it goes to. 
30 
Figure 4 – Mapping financial flows for WASH service provision: illustrative example 
Source: adapted from (Trémolet & Rama, 2012). 
The exercise needs to include and differentiate service providers from all four main subsectors of the 
WASH sector, i.e. urban water, urban sanitation, rural water and rural sanitation and most likely map 
them out separately. This is because the organisation of each of these four subsectors often varies 
substantially. For example, sanitation services may be provided jointly with water services or 
separately. In a large number of cases, there is no formal sanitation service provider and households 
are required to invest in on-site sanitation and maintain the installations themselves (this is referred to 
as “self-supply”).
WASH sector actors will be characterised according to the role they play in the financing and 
provision of WASH services. Actors will be identified mainly as: 
 “service providers” engaged in the production and delivery of WASH services. 
 “financing units”, i.e. as actors collecting funds and transferring them to service providers, 
(potentially via other financing units who pool and distribute the funding). Typically, these 
would include households, domestic and international governments, private corporations and 
non-profit organisations; 
Potential challenges involved with identifying and mapping WASH sector actors and ways to 
address such challenges 
 Informal service providers need to be included in the mapping to the extent possible. 
Even though the economic activities of informal actors may not be accounted for by 
statistical offices, they often represent a large proportion of WASH service provision in 
developing countries and need to be taken into account in the classification and 
mapping. 
 Actors can play different but simultaneous roles in the WASH sector, which means that 
it may be difficult to allocate them to a single category. For example, households may be 
financing units and self-service providers at the same time. They may be using their own 
resources for investing in WASH whilst also receiving government subsidies. All 
financing flow information need to be recorded and coded appropriately: a single flow 
might needs to be recorded in different ways to reflect this multiplicity of roles. 
 Avoiding double-counting of financial flows. Some financing units allocate funds to the 
sector from their own resources (such as central government institutions) whilst others 
are merely channelling funds provided to them by other institutions (typically, local 
governments may act as financial channels particularly when they do not have their own 
funds to allocate to the sector). When resources are channelled through several financing 
units (for instance from an international donor to a national government and then from 
the national government to a local government) , it is important to ensure that funds are 
not counted twice i.e. at source and at the point where funds are disbursed to service 
providers. We recommend that flows be tracked at the level that is closest to service 
provision (in this case the local government), so as to enable maximum disaggregation 
of the funding flows. Indeed, any allocation that takes place at the national level is likely 
to be much more aggregated. The feasibility of this recommendation needs to be 
assessed during the testing exercise. 
 Users can also be represented in this figurative mapping. However as users will have 
several uses (served or self-provided) and thus can be allocated to several categories, we 
prefer using the concept of “use of WASH services” to track the service and level of 
service on which the funding is spent (See Methodological Note 2 “MN 2.1. Classifying 
WASH service uses”). 
Financing flows will be characterised according to the origin of the funding. “Financing sources” 
are defined as the flows that are channelled to the service providers and which are differentiated based 
on the origin of those funds. Funds for the sector can come from either private sources (including 
households via tariffs and own investments or charitable donations or private investments) or public 
sources (from taxes, which are either managed by national governments or international governments, 
in the form of public transfers through official development assistance). The way in which these 
financing sources are described can vary significantly from one sector to another: this is an area where 
reaching an agreement on definitions for the WASH sector as a whole would be beneficial. In 
addition, as financing sources are not actors per se, it is also important to identify the “financing 
units” separately (as described in the box above 
31
Potential challenges in defining financing sources 
Different classification systems refer to “financing sources” in slightly different ways. In the 
OECD 3T terminology, “financing sources” refers to where the funding comes from and the 
types of funds that can be mobilised to finance the sector. The SEEA-Water terminology 
refers to financing units (actors grouped by financing sectors), which are covering the costs. 
To add to the confusion, the SHA terminology refers to these “financing units” as “financing 
sources”. In the classification recommended in this document, the terminology “financing 
sources” has been kept as per the OECD definition and complemented with a reference to 
“financing units”, as the actors from which the funds are mobilised. 
To the extent possible, we recommend collecting data according to the proposed classifications 
to ensure comparability between countries. Countries might not need to use all categories, 
depending on the structure of their WASH sector. Countries may want to adapt those categories 
and introduce further disaggregation for certain categories to reflect their own policy needs. For 
example, a country with a significant investment backlog for rural sanitation may want to adopt a 
higher level of disaggregation for these specific services. Each testing study will need to define which 
classification(s) can be used depending on the classifications used in the country and the amount of 
data that can reasonably be collected in the given timeframe. 
The following sections provide guidance on carrying out the data collection for each category. 
Identifying the uses of WASH services 
The WASH Accounts team will need to identify the types of uses of WASH services. We 
recommend using the classification proposed in Table 2. Countries can also use additional criteria 
to classify uses depending on the policy questions they wish to answer. For instance domestic uses 
can be classified by: 
 Demographic groups (ethnicities, urban or rural); 
 Socioeconomic strata (level of income, tariff scale); 
 Geopolitical entities (regions, districts etc.). 
Countries would need to assess the feasibility of collecting data according to these additional 
categories, depending on the policy questions they want to answer. 
Identifying service providers 
The WASH Accounts team will need to identify the entities that are in charge of providing the 
services from all four subsectors and the services they are providing. 
In order to understand the supply market, assess its dynamics and level of fragmentation, the WASH 
Accounts team collect initial data on main providers or type of provider to get an idea of: 
 their characteristics and status (ownership, enterprise or non-enterprise, formal or informal); 
 WASH services they produce; 
 the users covered (type and number); 
 external funding they receive; 
 their geographical distribution and human resources; 
 expenditure reports produced about their activity; 
32
33 
Box 4 - Types of service providers: the example of Burkina Faso 
In Burkina Faso, a public urban utility, ONEA, is in charge of providing water services in the main urban 
centres (as well as sanitation services in the big cities). By contrast, service provision in rural areas is 
decentralised, with rural communities being responsible for the delivery of water services. While boreholes in 
rural areas are managed by water committees or by users’ associations, rural municipalities with a water 
network are supposed to sign contracts with private operators. To date, about 70 of such municipalities (30%) 
have signed contracts with four official private providers. In the remaining municipalities, the network is either 
managed by a recognized community association (20%), by the municipality itself, or by an informal provider. 
Informal providers are also found in peri-urban areas. Concerning sanitation, in rural areas, services are 
typically self-provided. As a result, the five service providers categories would be used for this exercise: Public 
and private utilities (ONEA), NGOs and community-based organizations (in rural areas), Small independent 
providers (formal and informal operators in municipalities), Government agencies (municipalities) and 
Households (self-provision). 
To the extent possible, the WASH Accounts team will classify them in the pre-defined “service 
provider” categories presented in Table 2 and differentiate between actors from all four main 
subsectors of the WASH sector (urban water services, urban sanitation services, rural water services 
and rural sanitation services). To align with SEEA-Water, when a provider operates in several sub-sectors, 
it should be categorised in the subsector of its primary activity (i.e. for which its output is 
highest). 
Identifying financing units 
The WASH Accounts team will need to identify relevant financing units providing and/or 
allocating funds to the WASH sector. It will collect data on the characteristics and status of these 
entities and on the structure they finance, in order to understand whether they act as primary or 
secondary source of the funding (i.e. only channelling funds. To the extent of possible they will 
classify relevant entities in the pre-defined “financing units” categories presented in Table 2. 
Identify financing sources and how funding circulates between WASH sector actors 
The WASH Accounts team will then identify the financing sources and how these funding flows 
circulate between the previously identified actors. To the extent possible, we recommend collecting 
data on financing sources according to the proposed classification presented in Table 2. This 
classification has been developed based on existing standards classifications, namely a slightly 
modified version of the OECD’s 3 T (“tariffs, taxes and transfers”) approach and SEEA-Water. Such 
areas are discussed in Methodological Note No 2: Developing classifications of WASH actors and 
financing sources. 
Providing feedback on the methodology 
Given that the ultimate goal for this data collection is to be embedded in national statistical 
processes, feedback will be sought on the appropriateness of the proposed classification of 
WASH actors and financing sources and the extent to which this classification may need to be 
modified to reflect other existing classifications. The testing exercise will contribute to better 
understand how these existing classifications capture information on financing to WASH and how 
they are used and applied in the type of countries that we are targeting. It will also help to know 
whether data categorised under these classifications can actually be found in developing countries. 
The WASH Accounts team will provide comments on the proposed classifications based on the 
methodological discussion included in “Methodological Note No 2: Developing classifications of 
WASH actors and financing sources”. It will suggest any modifications to contribute to the 
development of a shared list of WASH uses, service providers, financing units and sources that could 
be used for subsequent GLAAS data collection exercises.
34 
2.3 Estimate financial flows and capital assets stocks 
Step 2.3 - Summary of tasks to be undertaken 
 Identify data required to answer policy questions set out in Step 1.2. 
 Identify whether the National Statistics Office already collects data on financing to WASH and if 
so, understand their methodology for doing so; 
 For financing flows, gather financing data at source, starting with the approach that allows 
generating the most comprehensive data set (i.e. either “Financing Source Approach” or “Cost-based 
Approach”): 
 For financing flows, define a time period over which to gather information (2-3 years); 
 Note that both approaches will need to be applied in parallel as they provide complementary 
information, particularly needed to allocate costs to types of services; 
 Gather data on capital assets using the “Fixed asset stocks approach” 
 Collect the data and create a WASH Accounts database: 
o Define the structure of the database and the data-records so that it can be maintained on 
an ongoing basis; 
o Decide which data to acquire; 
o Enter existing data into the database; 
o Allocate WASH Accounts classification codes to all data entries; 
o Identify data gaps and undertake further analysis / surveys to plug in data gaps; and 
o Prepare the WASH- Accounts tables. 
 Reconcile the data, identify gaps in the information and recommend (and conduct) any 
supplementary primary data gathering (such as additional surveys). 
 Provide feedback on methodological issues: 
o Appropriateness of the categories of costs proposed 
o Identify a list of costs and financing sources that are difficult to value and will require 
additional methodological development 
o Appropriateness of using a Fixed Asset Stocks approach 
o When using a Fixed Asset Stocks approach: on methods for asset valuation and on 
whether to deal with liabilities alongside assets 
Why is it important? 
Collecting financial information is the core objective of the TrackFin methodology. Two main types 
of financial information can be collected: 
 Information on financing flows. This can be used to estimate the "inflows and revenue" into the 
sector each year (tariffs, households’ expenditure for self-supply, domestic public transfers, 
international public transfers, voluntary transfers and repayable financing) and how much is 
“spent” every year on providing different types of services, to cover different types of costs, such 
as operating expenditure, small maintenance, capital expenditure or capital maintenance 
expenditure.1 
1 An indicator such as GDP (Gross Domestic Product) is also a financing flow indicator, as GDP estimates the 
total value of goods and services produced in a country from the expenditure on consumption and production. It 
indicates the total monetary value of all the finished goods and services produced within a country's borders in a 
specific time period (usually in a year). It includes all of private and public consumption, government outlays, 
investments and exports less imports that occur within a defined territory. It is calculated based on expenditure 
figures reported in the National Accounts.
 Information on fixed asset stocks. Alternatively, and in complement, it is important to gather 
information on capital stocks, to estimate how much has been invested by economic actors in 
building WASH assets over the years. This can also provide the basis for "asset management 
planning" which is critical for future financial planning. 
So far, most existing financial tracking initiatives have focused on tracking financing flows. Such 
methodologies often stem from an emphasis on tracking public financial flows, as public budgets 
typically distinguish between “recurrent” expenditure and “development” expenditure (i.e. capital 
investment). It is therefore assumed that collecting data on development budgets from public 
agencies’ accounts will give a good indication of capital investments. In the present methodology, we 
argue that it would be important for the WASH sector to get a better grip on the overall value of its 
assets, which means that collecting data on capital stocks, alongside data on financing flows, is 
important. The testing exercise gives an opportunity to test the proposed methodology for this. 
Collecting information on financing flows can itself be done based on two approaches: 
 The “Financing Source Approach” consists of tracking revenues from each financing source to 
35 
estimate “how much money is allocated to the sector” and aggregate those estimates; and 
 The “Cost-based Approach” consists of tracking the costs of different services for service 
providers to estimate “what is being spent” and aggregate those expenses to derive total 
expenditure figures. 
The Financing Source Approach aims at answering questions such as “who are the main sources 
of finance for the sector” and “what is being spent” from the point of view of financing sources 
and units. In most cases, it is likely to be the most straightforward approach for tracking public 
financing flows, as most public entities have a budget allocation for the sector and should be able to 
report on this. The WASH Accounts team will seek to collect data on financing units’ budgeted 
allocation of resources and expenditures from their financial reports and data sources mentioned 
above. However such an approach is often not sufficient when seeking to track how the money is 
spent (i.e. how it is distributed between water and sanitation for example) or to gather information on 
certain sources of finance, such as households spending for instance. 
For this reason, it is often necessary to combine this analysis with a “Cost-based approach” to 
evaluate the costs of providing the services. This needs to be done based on a commonly agreed 
typology of costs, which would at least distinguish between capital expenditure (including large 
maintenance costs, which should be accounted for as a separate item), operating costs and minor 
maintenance expenditure. 
Finally, the approach that aims at collecting data on fixed assets stocks is referred to as the “Fixed 
asset stocks approach”. Information for this approach also needs to be obtained at the level of service 
providers, by focusing on obtaining data on their assets (and potentially liabilities) rather than on their 
revenues and expenditures. This methodology would allow estimating the value of existing asset 
stocks in the sector and is in line with the System of National Accounts. Estimating such values raises 
methodological difficulties. However, it would be important to attempt this methodology at least in 
some of the countries where the testing exercise is going to be undertaken.
These approaches and the way they may be combined to derive meaningful data on WASH financing 
are presented schematically on . 
Figure 5. 
36 
Figure 5 - Methodology to estimate expenditure in the WASH sector 
See additional methodological notes on how to apply those approaches and data needs: 
 Methodological Note No 3: Estimating funding of WASH services with a “Financing Source 
approach” 
 Methodological Note No 4: Estimating the costs of providing the service with a “Cost-based 
approach” 
 Methodological Note No 5: Estimating fixed asset stocks 
It will also be important to adopt a common terminology for the different categories of costs and 
financing sources, and to use the same accounting principles so as to ensure data comparability. 
Not only will this permit valid comparisons across activities in the accounts, across the years shown in 
the accounts and across countries, it will also permit comparison of national expenditure on WASH 
with other economic aggregates, such as gross domestic product. For this reason, it would be 
preferable to employ an internationally accepted definition of the term “expenditure”, such as that 
used in the system of national accounts (paragraphs 2.63 to 2.79 and Chapter VI of the SNA93 
manual for a description of these concepts and definitions). However, aligning and reconciling with 
the SNA terminology is likely to take time and to generate difficulties as most WASH sector actors 
are not familiar with this terminology. This is a key area where feedback from the testing exercise will 
be important, to assess the extent to which the WASH sector should develop its own concepts and 
standards or seek to align with standard concepts and terminology as per the SNA. 
What needs to be done under this step?
The first activity under this step consists of identifying which data needs to be collected and 
whether the National Statistics Office already collects data on financing to WASH (what the SHA 
refers to as the “top-down approach”) and if so, understand their methodology for doing so. 
Information gathered by NSOs can provide useful background and indicate whether or not the NSO 
has established systems to gather data from the WASH sector. However, information gathered by the 
NSO will have its limitations. First, the SNA focuses on one main aspect of national expenditure, 
which is the creation of value in production processes. Therefore this information can mainly be used 
to estimate service providers’ costs and revenues. Second, the information gathered through the 
National Accounts system is likely to be difficult to understand and interpret by sector actors. This is 
because it uses a terminology and concepts that WASH sector actors may not be familiar with and 
because this information is unlikely to be at the level of detail that would be required in order to 
support policy-making at sector level. Engaging the NSO is important, however, in order to better 
understand their current methodologies for gathering data and seek to involve them in the recurrent 
preparation of WASH accounts. 
The second activity will entail gathering financing data at source, starting with the approach that 
allows generating the most comprehensive data set. Initially, it will be necessary to identify the main 
data sources from which information on WASH expenditure can be extracted. Making an inventory of 
data sources will help keep track of the core data sets which are available and identify where 
information is missing and extra investigation needs to be conducted (such as household surveys etc.). 
For each type of data, it would be useful to collect the type of information indicated in Box 5 below. 
37 
Box 5 - Data sources and collection methods 
For each data source, it would be important to gather the following type of data: 
 Name of data source 
 Administration/Institution/ Origin of the source 
 Type of data source (registers, business surveys etc.) 
 Method of collection (e.g. administrative source, statistical full-scope or sample survey; national source 
versus standardised international survey) 
 Availability of data (years of data available) 
 Concept of the measuring units (costs, expenditures, turnover) 
 Variation in the methodology used to estimate data over time 
 WASH actors coverage, i.e. can expenditure can be assigned to categories of providers or financing 
sources and units? 
 WASH service coverage, i.e. can expenditure be assigned to categories of WASH services? 
 Configuration of data, i.e. what dimensions of data are available, level of details, by WASH services, uses, 
service providers, financing sources, financing units, factors of provision, expenditure type etc. 
 Data reliability bands, i.e. how reliable the data is? Is the methodology to compile the data traceable? This 
can be assessed with a scoring system. 
Based on an initial assessment of the availability of data at the level of financing sources and at the 
level of service providers, the WASH Accounts team will start by gathering information using the 
approach for which data availability is the greatest and access is easier. The other approaches will 
then be introduced in order to fill in gaps and to gather complementary information where more detail 
is needed for the purpose of policy analysis. To estimate financing flows, it will be important to apply 
both approaches in parallel as some data may only be collected at the level of service providers based 
on costs (for example, households’ investment in sanitation) whereas for other data, information 
might be more readily available at the level of the source and be expressed as an expenditure. 
Ideally, the WASH Accounts team will try to collect those costs at the level of each service provider. 
If this is not possible, for instance, in countries with a large number of service providers, they 
might need to collect the data from a sample and then extrapolate the results. The WASH Accounts 
team will also need to define the timeframe for this analysis. With respect to financing flow data, it 
would be preferable to gather data for a period of at least 2 to 3 full financial years, instead of 
capturing data for a single year as the latter would risk yielding non-comparable data. Depending on
data availability, it will be essential to define what types of financial flows are going to be tracked, as 
discussed below. 
Identifying which financing flows can be tracked 
For a given transaction, different types of financial flows are usually recorded, including: 
amounts budgeted and actual expenditure. Although budgetary information is likely to be 
easier to collect (particularly for transfers from public institutions), it is preferable to obtain 
actual expenditure amounts for all types of flows. This would allow comparisons between 
different sources of funding (including with funding provided by households, for which only 
actual figures are likely to be available) and would provide a more accurate representation of 
actual expenditure in the sector. If obtaining actual expenditure information is proving 
challenging, it could be possible to estimate it based on budgeted amounts and estimated 
percentages of realisation (based on past experiences). It is essential to clearly record what 
types of financing flows are being tracked in order to allow comparisons. 
The third activity entails building a database of WASH financial data, based on the initial investigation 
conducted. Once the list of data source and WASH actors are complete and the methodologies to be 
applied are clearer, the WASH Accounts team will create a WASH Accounts database in which they will 
compile all data collected as it becomes available. The structure of this database should be defined so that 
it can be maintained on an ongoing basis. The data collection process will be iterative as to refine initial 
estimates. The database will be progressively completed through successive estimations, in order to 
address remaining data gaps and reconcile estimates from different data sources. Data collection needs to 
be carefully planned, so as to avoid burdening data providers with overwhelming data requests in order to 
build a cooperative process with them. When filling information into the database, it will be important to 
allocate WASH Accounts classification codes to all data entries. The first round of data entry will help to 
quickly identify missing information, as well as potential questions arising on data sources (how data have 
been estimated, to which category they should be allocated, etc.). 
The final activity will consist in trying to reconcile all sets of data, by combining them to refine the 
allocation of spending to different categories. If significant gaps are found between the results from 
the two approaches to capture financing flow information, further investigation will be required to 
identify estimation errors or missing flows. This may require gathering supplementary information 
(from primary data sources) or applying estimates or using cost allocation keys to estimate data, as set 
out in Box 6 below. If additional data gathering is required, the WASH Accounts team would need to 
present this to the national level stakeholder group as this may require additional budget. 
38 
Box 6 - Filling in data gaps: making assumptions and using keys 
There will be some cases where data is not available to estimate comprehensively a category of WASH Accounts. 
In this case it will be necessary to resort to other estimation means using other information available. Using “keys” 
or pro-rata estimations refers to using the distribution of a proxy variable as a substitute for an actual distribution. 
For example, if there is no information on the distribution of expenditure across WASH services for a particular 
actor, that distribution of activities might be used as the "key" for allocating the expenditure by service distribution. 
Making assumptions might be necessary where insufficient information is available. For instance, if we want to 
measure the allocation of “software costs”, (i.e. costs associated with infrastructure development, such as for project 
preparation, capacity building, training, community mobilization and behavioural change activities) by activity of a 
service provider when we only know the total expenditure of this provider for the provision of WASH goods and 
services, it might be necessary to make an assumption on how much support costs can be associated to each of these 
activities. Support costs may not be directly linked to the overall expenditure on a service, however. Typically, for a 
public provider, support costs represent a higher percentage of the total costs of delivering sustainable sanitation services 
than of delivering sustainable water services. This is because households are expected to mostly invest in sanitation, 
which means that the support costs committed by the public party may represent a higher share of their total investment 
than for water (where public investment, particularly for capital expenditure, is still very much the norm). 
These assumptions, once formulated, would need to be tested, possibly by enquiring further into the cost structure of the 
service provider. All estimation methods and assumptions should be clearly presented in metadata attached to the final
results; they should be justified and well documented. This transparency is a key part of WASH Accounts development 
as it provides users of the results with a better understanding of how the data was compiled and assists compilers in 
subsequent compilation rounds. 
Using small-scale studies and applying results to the population. In some cases, the results of a small-scale 
study can be used to estimate the data for a particular component. For example, a survey on the allocation of 
expenditure of NGOs can be used to deal with the treatment of NGOs expenditure in WASH Accounts, given 
that NGO expenditure (and its allocation) is very often not known to a great level of detail. This approach does 
have its risks, however, as the selected sample might not be representative of all NGOs in the country. Thus it is 
important to document the methods employed and the potential biases from such methods. This approach can be 
used in a variety of areas where there is no separate accounting for WASH expenditure, or for particularly 
difficult components (households, NGOs, CBOs etc.). 
Providing feedback on the methodology 
The methodology for tracking financial costs of WASH services will need to be refined based on the 
findings from the testing exercise. Specific issues that will need to be addressed include defining cost 
categories (at present, what is proposed is to distinguish at least between capital expenditure and 
operations and maintenance expenditure, and potentially separate out large capital maintenance 
expenditure as well as tracking separately software costs for policy development and programme 
development). If the proposed cost categories are too detailed or difficult to use for extracting 
information at source, they might need to be refined and adjusted. 
Therefore the WASH Accounts team will be asked to develop and test a cost typology and to 
contribute to the discussion on this methodological point. 
The testing exercise should bring out key methodological issues that need to be tackled in order to 
produce comparable cost information and to ascertain the level of detail on costs that can reasonably 
be expected to be collected given the complexity of the sector. Feedback would also be needed on 
whether additional guidance is needed (or not) on defining common rules for gathering specific data 
items so as to ensure comparability. 
Finally, the WASH Accounts team is also asked to contribute to the discussion on tracking financial 
flows versus tracking capital stocks. Only certain countries will be expected to measure capital stocks 
(also referred to as “gross capital formation” in the SNA language) for WASH and test the application 
of this approach at country level to evaluate and report on their feasibility. 
39 
3 Step 3 – Analyse financial data 
Step 3 - Summary of tasks to be undertaken 
 Identify the tables and indicators from the list presented in this guidance document, based on 
which are most relevant to answer the country’s policy questions; 
 Undertake background calculation and compile WASH Accounts Tables; 
 Calculate the WASH Accounts indicators; 
 Document the compilation process; 
 Verify the coherence of the tables; 
 Provide feedback on the use of suggested tables. 
Why is it important? 
In order to conduct analysis and inform policy-making, the WASH Accounts team will need to 
build a number of tables to present the information collected in a way that can be analysed and
used by policy-makers. These tables are what is referred to collectively as the “WASH 
Accounts”. It is on the basis of such tables that comparable indicators can also be derived. 
The present methodology proposes a number of standard tables that can be developed to address most 
policy needs. The main objective of building these tables is to answer the policy questions identified 
at the beginning of the process, including the following questions: 
 What is the total expenditure in the sector? 
 How are the funds distributed to the different WASH services and expenditure types? 
 Who pays for WASH services, and how much? 
 Which entities are the main channels of funding for the WASH sector, and what is their share of 
40 
total spending? 
It is important that all participating countries use a basic set of common WASH Accounts tables and 
indicators on a similar format, so as to enable international comparisons. Depending on their policy 
needs and information availability, countries may choose to prepare a smaller set of tables or to 
present more detailed information on certain aspects to address their own priorities. 
Table 3 below presents the set of tables we are recommending that countries prepare in order to get a 
comprehensive picture of WASH financing in their country. 
Table 3 – WASH Accounts tables recommended for use 
Table WA 1 (SxR)- WASH expenditure by main WASH service and regional subdivision 
Table WA 2 (SxU)- WASH expenditure by type of WASH service and use 
Table WA 3 (SxP)- WASH expenditure by type of WASH service and provider 
Table WA 4 (PxFS)- WASH expenditure by type of WASH provider and financing source 
Table WA 5 (SxFS)- WASH expenditure by type of WASH service and financing source 
Table WA 6 (SxFU)- WASH expenditure by WASH service and financing unit 
Table WA 7 (PxFU)- WASH expenditure by WASH provider and financing unit 
Table WA 8 (FSxFU)- WASH expenditure by financing source and financing unit 
Table WA 9 (CxP)- WASH expenditure by type of cost and WASH provider 
Table WA 10 (CxS)- WASH expenditure by type of cost and main WASH service 
Table WA 11 (ASxP)- Asset stocks by type of WASH provider 
 “Methodological Note No 6: Preparing WASH accounts’ tables and indicators” presents in more detail the 
proposed WASH account tables and indicators. It contains the actual tables, explains how they are built and 
what they can be used for. 
In addition, the WASH Accounts indicators are a set of key figures that can be derived from the 
WASH Accounts tables. They can be a quicker and more digestible way of presenting the information 
as a set of headline figures for dissemination of the results. 
Table 4 below presents the set of WASH Accounts indicators that can be calculated from the tables. 
They refer to the total expenditure to the sector and the allocation of the expenditure according to the 
different classifications presented above (per WASH service, provider, financing source) and as a 
percentage of total expenditure. Countries would need to select from this long-list of indicators those 
that are most useful to their needs. In addition, a set of internationally accepted common indicators 
should also be estimated to ensure comparability.
41 
Table 4 - Potential WASH Accounts indicators 
Indicator (I) 
 Total expenditure on the WASH sector at the national level 
 Total expenditure on WASH in the country as share of GDP 
 Total expenditure on WASH per capita 
 Total expenditure on WASH as a % of total public spending 
 Total expenditure on urban and on rural drinking-water as a % of total WASH expenditure 
 Total expenditure on urban and on rural sanitation as a % of total WASH expenditure 
 Total expenditure per type of use as a % of total WASH expenditure 
 Total expenditure per type of WASH service as a % of total WASH expenditure 
 Total expenditure per type of WASH provider as a % of total WASH expenditure 
 Total expenditure per type of financing source as a % of total WASH expenditure 
 Total government domestic transfers expenditure and as a % of WASH expenditure 
 Total international transfers expenditure and as a % of WASH expenditure 
 Total household expenditure as a % of WASH expenditure 
 Total expenditure channelled through regional and local authorities/ government agencies as a % of WASH 
public expenditure 
 Total capital costs as a % of total WASH expenditure 
 Total operating and maintenance costs as a % of total WASH expenditure 
 Total large capital maintenance costs as a % of total WASH expenditure 
 Capital costs as a % of total water supply expenditure 
 Operating and maintenance costs as a % of total water expenditure 
 Large capital maintenance costs as a % of total water expenditure 
 Capital costs as a % of total sanitation expenditure 
 Operating and maintenance costs as a % of total sanitation expenditure 
 Large capital maintenance as a % of total sanitation expenditure 
 Total WASH fixed asset stocks per capita 
What needs to be done under this step? 
As a first activity, the WASH Accounts team will need to determine the tables to construct from 
the proposed list depending on their usefulness for national policy-making and data availability. 
International benchmarking should also be a key consideration when deciding which table to 
construct. 
In a second sub-step, data from the database built in Step 2.3. will need to be extracted to fill in 
the tables. It might be useful to start building background tables first, i.e. starting from the most 
disaggregated ones and building up to more aggregated ones. 
Throughout this process, it will be important to report on the compilation process and methods used to 
estimate the figures appearing in those tables, so as to be able to assess the quality of the data. WASH 
Accounts team will need to state very clearly in an accompanying report how they collected and 
constructed the tables. Documenting the metadata behind the data in the annex of the tables will 
enable to obtain solid and comprehensive data and will ensure that it is appropriately interpreted and 
used. At a minimum, background data should include the sources of data, how data were validated 
(especially when there are multiple sources of data), the hypothesis used when evaluating data (e.g. 
method of accounting chosen), the reasoning behind the selection of data used in the estimation and 
the procedures applied to make data usable.
In a last sub-step, the WASH Accounts team will need to verify that the data presented in the 
tables is robust and internally consistent. It will be important to check that: 
 Totals are consistent across all tables. The same total expenditures observed for consumption also 
42 
hold for provision and financing; 
 Totals reported should be equal to the sum of the constituent parts; 
 Values of similar expense items from the same classification should be consistent across tables; 
The various indicators in relation to the totals, related to the population (per capita value), related 
to GDP and related to historical values when there are several times series of WASH Accounts 
(percentage change from year to year, growth rates) are plausible. 
Providing feedback on the methodology 
Countries participating to the testing exercise will be invited to comment on the feasibility of the 
approach and of constructing those tables. Following testing, we recommend that a “minimum 
common set of WASH Accounts tables” and a minimum common set of indicators be developed and 
agreed at international level. These might include additional tables that were not included in the 
original set proposed in this draft guidance document (as we have deliberately tried to maintain the 
number of tables to a manageable number). 
4 Step 4 – Interpret and disseminate findings 
Step 4 - Summary of tasks to be undertaken 
 Analyse and interpret WASH Accounts data to answer policy questions 
 Disseminate the WASH Accounts findings by communicating on the indicators, presenting the 
main results and findings of WASH Accounts in a summary report (including key WASH 
Accounts tables) 
 Write short policy briefs for decision makers focused on a specific policy question 
 Provide feedback on ways to disseminate findings 
4.1 Analyse and interpret WASH Accounts data to answer policy questions 
Why is it important? 
Data is not information. In addition to producing tables and indicators, it is important to analyse the 
data based on background information on the WASH sector in the country in order to correctly 
interpret what the figures are showing. In order to be effectively used by policymakers, this 
information needs to be concise, directly meaningful and relevant to them. 
Table 5 below summarizes how WASH Accounts tables and indicators can provide elements to 
address policy questions and support policy development. It is followed by a discussion of how this 
data can be used and interpreted to answer a number of key policy questions, including: 
 What is the total expenditure in the sector? 
 How are funds distributed? 
 Who pays for WASH services? 
 How is funding channelled in the WASH sector?
43 
Table 5 - Link between WASH Accounts information and policy questions 
WASH Accounts Tables (T) WASH Accounts Indicators (I) Policy questions that data can help answer 
Table WA 1 (SxR)- WASH 
expenditure by main WASH 
service and regional subdivision 
Total expenditure on the WASH sector at the national level 
Total expenditure on WASH in the country as share of GDP 
Total expenditure on WASH per capita 
Total expenditure on WASH as a % of total public spending 
Total expenditure on urban and on rural drinking-water as a % of 
total WASH expenditure 
Total expenditure on urban and on rural sanitation as a % of total 
WASH expenditure 
 What is total funding to WASH? Is current funding sufficient? 
 What is the trend in funding? Is it increasing or decreasing? 
 How does the level of funding compare to countries with a 
similar level of income? With neighbouring countries? 
 How does the level of funding compare with other social 
sectors (health, education)? 
 What is the urban/ rural, water/sanitation split in spending? 
 Is spending allocated to WASH subsectors that need it most? 
 Is funding going to regions/areas that need it most? 
Table WA 2 (SxU)- WASH 
expenditure by type of WASH 
service and use Total expenditure per type of service use  Which type of use is benefitting from the financial resources 
allocated to the WASH sector? 
Table WA 3 (SxP)- WASH 
expenditure by type of WASH 
service and provider 
Total expenditure per type of WASH service 
Total expenditure per type of WASH provider 
 Is spending going to services that need it most? 
 Which services do providers allocate funds to? 
Table WA 4 (PxFS)- WASH 
expenditure by type of WASH 
provider and financing source Total expenditure per type of financing source 
 Which services and type of providers are funds allocated to? 
 By whom is each type of service financed? 
 What is the financial burden on households? Are policies and 
utilisation of public funds effective at leveraging private 
investment, including from households? 
 What is the share of public vs. private expenditure? 
What is the share of donor’s contribution? How much is donor 
spending out of the total government’s budget? 
Are government and donors’ commitments on WASH 
financing respected? 
Table WA 5 (SxFS)- WASH 
expenditure by type of WASH 
service and financing source 
Total government domestic transfers expenditure and as a % of 
WASH expenditure 
Total international transfers expenditure and as a % of WASH 
expenditure 
Total household expenditure as a % of WASH expenditure 
Table WA 6 (SxFU)- WASH 
expenditure by WASH service 
and financing unit 
Table WA 7 (PxFU)- WASH 
expenditure by WASH provider 
Total expenditure channelled through regional and local authorities 
as a % of WASH public expenditure 
 How is funding in the WASH sector channelled? 
 What % of WASH public expenditure is channelled via local 
governments and how can they be supported?
44 
WASH Accounts Tables (T) WASH Accounts Indicators (I) Policy questions that data can help answer 
and financing unit 
Table WA 8 (FSxFU)- WASH 
expenditure by financing source 
and financing unit 
Table WA 9 (CxP)- WASH 
expenditure by type of cost and 
WASH provider 
Table WA 10 (CxS)- WASH 
expenditure by type of cost and 
main WASH service 
Total capital costs as a % of total WASH expenditure 
Total operating and maintenance costs as a % of total WASH 
expenditure 
Total large capital maintenance costs as a % of total WASH 
expenditure 
Capital costs as a % of total water supply expenditure 
Operating and maintenance costs as a % of total water expenditure 
Large capital maintenance costs as a % of total water expenditure 
Capital costs as a % of total sanitation expenditure 
Operating and maintenance costs as a % of total sanitation 
expenditure 
Large capital maintenance as a % of total sanitation expenditure 
 Is sufficient spending allocated to operations and maintenance 
as opposed to investment? 
 Are tariffs/ subsidies/international transfers dedicated to 
investment or O&M? 
Table WA 11 (ASxP)- Asset 
stocks by type of WASH 
provider 
Total WASH asset stocks per capita 
 What is the stock of fixed assets for WASH services and for 
each subsector? 
 Is the capital stock being increased or run down?
What is the total expenditure in the sector? 
Information on total WASH expenditure (as a monetary value or as a share of GDP) can provide 
elements to answer the following policy questions: 
 Is current funding sufficient? 
 What is the trend in funding? Is it increasing or decreasing? 
 How does the level of funding compare to countries with a similar level of income? With 
45 
neighbouring countries? 
 How does the level of funding compare with other social sectors (health, education)? 
Answers to these questions could be used to do the following: 
Monitor funding trends over time. The country’s level of WASH expenditure could be tracked over 
time to evaluate whether the overall financing effort (i.e. coming from all financing sources, rather 
than only from government) has increased or decreased. It could be compared with access rates to 
WASH services to see how the variation in WASH expenditure over time is correlated to access to 
WASH services. This information could be used to raise awareness on the need to attract more 
financing to the WASH sector in order to meet agreed physical targets and objectives and inform the 
debate about the appropriate mix of public and private financing in the sector. 
Benchmark funding to the WASH sector, against other countries or other sectors. If the data is 
collected on a comparable, comprehensive and consistent manner, the country’s level of WASH 
expenditure could be benchmarked against that in countries with similar income levels or in 
neighbouring countries. Total expenditure on WASH could also be compared to expenditure on other 
social sectors, such as education and health. 
At a later stage of methodological development, this financial data could also be related to outputs and 
outcomes in order to estimate value-for-money. This would request having a good monitoring 
framework for WASH sector outputs and outcomes in place. It could be used to assess the efficiency 
of funding to produce outputs (such as numbers of schemes, facilities and hygiene programmes) and 
outcomes (such as access to sustained WASH services). This analysis could be compared across 
countries to see how variation in WASH expenditure across countries is correlated with variation in 
access to WASH services. If similar countries have similar initial level of WASH services and have 
been spending the same amount on WASH for several years with a large discrepancy in outcomes, it 
would be useful to investigate the reasons for such a difference, to understand whether this might be 
due to a difference in policies, financing strategy, implementation capacity or any other factor. 
For instance the latest GLAAS 2012 report (WHO, 2012) collected data on Government expenditure 
on health, education and WASH as a share of GDP across 13 countries (see Figure 6 below). It 
indicates that median government expenditure on sanitation and drinking-water is one third of that for 
health and one sixth of that for education. However, as noted in Trémolet and Rama (2012), this 
analysis was based on a small and somewhat unreliable dataset. Once it is based on a broader and 
more robust dataset, this analysis could eventually be used to set benchmarks for the level of funding 
that should be allocated to deliver sustainable WASH services and used as a reference point in order 
to mobilise additional financial resources.
46 
Figure 6 - Government expenditure on health, education and WASH 
How are funds distributed? 
Matrices of WASH expenditure per region/area and of WASH expenditure per subsector, service, 
type of providers and expenditure type could provide data to address the following policy questions: 
 Is funding going to regions/areas that need it most? 
 What is the urban/ rural, water/sanitation split in spending? Is spending allocated to WASH 
subsectors that need it most? 
 Which services and type of providers are funds allocated to? Is spending going to services that 
need it most? 
 Is sufficient spending allocated to operations and maintenance as opposed to investment? 
The answers to these questions could be used by policymakers for budgeting and planning in order to 
perform the following types of analysis: 
Identify inequities in spending distribution across regions and population groups. Depending on 
countries’ requirements, WASH Accounts could show data on the share of WASH expenditure by 
regions or by population groups with the greatest needs (i.e. at a level of disaggregation below the 
national level). This could help countries evaluate whether enough financial resources are allocated in 
areas where access to WASH services is lower. In turn, such analysis could be used to reduce 
inequities across population groups and regions by relocating transfers (both domestic and 
international) to those regions and groups that need them most through targeted pro-poor policies. 
Allocate funds to sub-sectors, services, providers and programmes. WASH Accounts could provide 
information on the share of spending allocated to the different subsectors (urban water, rural water, 
urban sanitation and rural sanitation), services (on-site sanitation or piped sewerage, etc.) and types of 
providers (public, private, community-based, small or large scale). This would help evaluating 
whether funding is currently allocated to services and providers that need it most in order to allocate 
budget more efficiently based on evidence.
For instance a study on public finance for household sanitation in Dar Es Salaam conducted for 
WaterAid revealed that in the period 2006-2010, 99% of public finance was allocated to sewerage and 
to wastewater treatment whereas only 10% of the population was connected to the sewer network and 
only a mere 3% of the population benefited from wastewater treatment (Trémolet & Binder, 2010). 
This kind of information could help enhance the comprehensiveness of public financing, target 
funding gaps and allocate funds in a way that would allow all services along the cycle of WASH 
activities to function in a sustainable manner. It is also important to track funding to software 
activities such as hygiene education and support to community management so as to ensure that these 
hardware expenditure on infrastructure development reach maximum impact. 
Allocate funds between capital investments and operations and maintenance. The matrix of WASH 
expenditure per subsectors, services and types of providers could also indicate whether funds are 
spent on capital investments, capital maintenance or operations (and small maintenance). It is 
important to check that operation and maintenance activities receive adequate funding so as to be able 
to sustain the services delivered via capital investments. 
For instance a WASHCost study on the costing of sustainable sanitation service delivery in the state 
of Andhra Pradesh in India revealed that in 2009-2011 86% of the Government investments for 
sanitation were spent on capital costs, largely on household and institutional toilets. Operation and 
maintenance costs only accounted for 8% of the total government investment, and only 2% were used 
for direct support costs such as sanitation promotion or training programs, which are usually 
considered to be essential to ensure consistent use and maintenance. These findings imply low priority 
given to regular maintenance and management (Snehalatha & al, 2011). 
A regular tracking of these types of expenditure could help better allocate funding by planning 
expenditure on a long term in order to enhance the long-term sustainability of WASH services. 
Plan national WASH policies and strategies. By providing a complete picture of current spending, 
WASH Accounts could contribute to identifying funding needs and priorities and designing a national 
WASH strategy to plan expenditure at a national level according based on such priorities. 
Monitor policies’ outcomes and effectiveness. Regular tracking of actual spending to WASH services 
overtime could help monitor the efficiency of policies and reallocate budgeted funds based on 
evidence. For instance this could be used to evaluate the efficiency of a new policy supporting small 
scale sanitation entrepreneurs in a region by looking at outcomes on access to sanitation facilities and 
compare trends over time. This could assess the benefits for the population and cost effectiveness and 
equity of the policy and whether the government should continue to support it or not. 
Who pays for WASH services? 
The matrix of WASH expenditure per financing source, per service and per expenditure type could 
provide information on financing sources of WASH and help define a financing strategy. It could 
provide data to address the following policy questions: 
 What is the share of public versus private expenditure? 
 What is the financial burden on households? Are policies and utilisation of public funds effective 
47 
at leveraging private investment, including from households? 
 What is the share of donor’s contributions? How much is donor spending out of the total 
government’s budget? 
 Are governments and donors’ commitments expressed in terms of WASH expenditure respected? 
 How/by whom is each type of service financed? 
 Are tariffs/ subsidies/international transfers dedicated to investment or Operations and 
Maintenance?
The answers to these questions could be used by policymakers for budgeting and planning to: 
Define a financing strategy. WASH Accounts could provide data on the actual distribution of 
financing sources in order to build a full picture of sector financing, something that is not available as 
yet in many countries. They would take into account public as well as private (including households) 
and donors’ expenditure. This information could be broken down by type of service, so as to build a 
better understanding of the sources of finance for on-site sanitation vs. sewerage services for example. 
This data could be used to identify whether alternative financing structures are more or less effective 
at leveraging investments from private sources (for example, evaluating the amount of public funding 
and uses of public funding that might be necessary in order to encourage households to invest in on-site 
sanitation). In terms of financing strategy, this data could be used to set maximum level of 
household contributions for certain given services for example. 
Monitor trends and outcomes of financing strategies over time. WASH Accounts could be used to 
compare the outcomes of financing strategies and assess the performance of policies designed to 
leverage investment over time. For instance if a country finds that households’ investment in 
sanitation facilities is lower than in similar countries, it could set up a policy to leverage private 
investment through micro finance schemes that can help households invest in their own facilities. A 
regular tracking of household expenditure in sanitation facilities could help monitor the outcome of 
this policy and evaluate if it actually increases households investments. 
Coordinate donor aid and international transfers. A substantial part of aid transfers to developing 
countries is often channelled through NGOs and therefore is not part of a governments’ budget, 
making it difficult to evaluate total spending in the sector. WASH Accounts could enable building a 
more complete picture of expenditures and thus facilitate greater coordination of WASH financing at 
a national level. This would help to better allocate funds according to priorities identified by 
governments. WASH accounts data could be used to advocate for joint planning between the 
government and development partners. 
Track commitments and targets expressed in financial terms. Data on actual spending to WASH 
could be used to track governments’ and donors’ commitments with respect to sector financing. 
Several governments have made commitments at the international level that have been formulated 
with reference to monetary amounts allocated to the WASH sector. For example, the eThekwini 
declaration in 2008 committed signatory African countries to establish specific public sector budget 
allocations for sanitation and hygiene programs. The stated aspiration was that these allocations 
should be a minimum of 0.5% of GDP for sanitation and hygiene. Compiling such an indicator in a 
consistent, comprehensive and comparable basis would be essential in order to track the 
implementation of such a commitment. 
At the 2012 High Level Meeting organised by Sanitation and Water for All, SWA countries made 
several commitments that were expressed in monetary terms: 
 Some countries committed to invest a specific amount in the sector, totalling approximately 1.6 
48 
billion USD over the next four years (Afghanistan, Burkina Faso, Niger, Senegal, Sri Lanka); 
 Others committed to “increase investments as a specific percentage of their GDP (Bangladesh, 
Benin, Cote D’Ivoire, Liberia, Niger, Nigeria, Sierra Leone), of their current sector budget 
(Kenya Zimbabwe) or their national budget (Nigeria and Togo)”. 
WASH Accounts could be used to see whether such financial commitments have been respected. 
They could also be used to estimate the additional financing efforts that would be required to reach 
the number of new users they committed to reach in output terms.
How is funding channelled in the WASH sector? 
The matrix on WASH expenditure per financing unit and per service would help answer policy 
questions such as: 
 How is funding in the WASH sector channelled? 
 What share of WASH public expenditure is channelled via local governments? 
 How can financing units be supported? 
Answers to these questions could be used by policymakers to: 
Define and monitor financing strategies. Local governments often play an important role in 
channelling funds to local levels. Data on WASH expenditure per financing units could be used to 
evaluate the performance of decentralized financing policies. It could help identify ways to support 
local governments that channel such budgets. This data could also be used to study the consequences 
of using basket funds to channel financing to local levels. 
4.2 Disseminate the policy analysis 
This information and analysis can be used at the following stages of the policy process: 
 Advocacy / attracting funds; 
 Defining financing strategies; 
 Budgeting and planning; 
 Monitoring; 
 Regular tracking of funding, tracking commitments and targets; 
 Benchmarking against other sectors or other countries; 
 Coordinating donor aid. 
There are three main ways in which WASH Accounts findings can be disseminated: 
 Produce a consolidated report on the WASH accounts, presenting the WASH Accounts results in 
49 
a systematic manner in a manner that aims to provide elements to answer key policy questions; 
 Publish key indicators from the WASH Accounts on a periodic basis, either via national, regional 
and international databases; 
 Prepare policy briefs based on results from the WASH Accounts focused on a specific policy 
question. 
WASH Accounts reports should provide careful documentation of sources and methodological 
information so that the observed differences between countries or for one country over time can be 
understood and put in proper context. 
To the extent possible, these reports should be developed along similar lines and format across 
countries to facilitate comparisons and use of the data at both the national and international level. To 
the extent possible, the WASH Accounts consolidated reports should contain the following elements: 
 Country background information to provide context for understanding the WASH Accounts 
findings; 
 The tables and indicators proposed above, plus extra ones if need be, that will inform the GLASS 
report and national policy; 
 Information on data collection and estimation methods (in an Annex); and 
 Documentation of the WASH Accounts data sources and any methodological information that is 
important to properly interpret the WASH Accounts results. 
Country background information in the report will ensure that WASH Accounts data is interpreted in 
their proper context. It will briefly describe the WASH sector in the country: the actors involved, the 
main financing flows, some contextual elements (e.g. the role of NGOs and the private sector) and
major policy issues (e.g. recent reforms, current policies and institutional framework, reforms 
required etc.). This country background information could be collected via the broader GLAAS 
exercise, on a format that could be referred to as a “mini-CSO” (based on the Country Status 
Overview reports that have been prepared for Sub-Saharan Africa). Other data like price index data, 
GDP, access rate of access to improved water and sanitation facilities etc. could also be very useful to 
interpret the statistics. 
In addition to the WASH Accounts summary report, the WASH Accounts team will extract the key 
information to answer to the main policy issues expressed in step1 and produce short policy brief on 
the specific issues. 
The WASH Accounts team will present the WASH Accounts summary report and key 
indicators to the national stakeholder group and circulate these policy briefs and the WASH 
Accounts findings as widely as possible across WASH policymakers, high level members of the 
government, WASH advocates, NGOs and international organizations in the country. This is crucial, 
not only to share the findings of the WASH Accounts, but also to raise awareness, gain support and 
create future demand for such financial information. 
50 
5 Step 5 – Provide feedback on methodological development 
Step 5 - Summary of tasks to be undertaken 
 Produce a synthesis report evaluating your experience using this guidance document; 
 Assess and comment upon the appropriateness of the proposed classifications to define the 
WASH sector and the way it is financed; 
 Assess and comment upon the feasibility to collect such data in the country; 
 Assess the methodology proposed to value the financing flows and capital stocks; 
 Suggest modifications to improve both the classifications and the methodology; 
 Provide feedback on the overall process from an organisational point of view and give indications 
about the cost and resource requirements of the exercise 
Why is it important? 
This guidance document has been designed to provide the basis for a testing exercise to be carried out 
in different countries, with a mix of WASH sector organisation and access to information. As part of 
the testing exercise, a feedback process will be organised so that the results of the testing can be fed 
into the on-going development of the methodology. 
What needs to be done under this step? 
Below we summarise key areas where feedback is sought from the countries where the testing is 
going to be conducted and what might be expected of them, in the context of the preparation of the 
GLAAS report 2014 and beyond. 
Implementation of the current methodology at national level: 
 Appropriateness of the proposed classifications of sector products and services, actors and 
financing flows to describe the WASH sector in the country of study, completeness of these 
classifications; 
 Feasibility of collecting data following these classifications and levels of disaggregation; 
 Assessment of the need for a common classification of WASH actors and financing sources; 
 Appropriateness of the proposed classification of costs and feasibility to collect data using it;
 Assessment of the overall need to modify the proposed classifications to better adjust of the 
country’s context and reporting of difficulties encountered to classify data according to the 
proposed categories; 
 Feasibility of using the proposed approaches to estimate financing flows (the “financing source 
approach” and the ”Cost-based approach”), reporting of difficulties encountered when valuing 
financing flows and suggestions of solutions to overcome these issues; 
 Assessment of the need and feasibility to collect data on capital stocks; 
 Appropriateness and feasibility of using the “Fixed Asset Stocks approach” to value assets and 
51 
whether to deal with liabilities alongside assets; 
 Feasibility of obtaining data from National Statistical Offices which is relevant for policy-making 
in the WASH sector; 
 Feasibility of obtaining data according to the other proposed data sources and suggestion of 
additional sources; 
 Appropriateness of the proposed tables and indicators to answer the country’s policy questions 
and feasibility to collect data to inform them, suggestions of modifications to enhance reporting 
tables; 
 Appropriateness of the suggested methods to disseminate findings on the WASH Accounts and 
suggestions on other ways to do so; 
 Assessment of the organisational process to conduct the exercise; 
 Assessment of the process to create political buy-in and of the need to gather simplified indicators 
or “Quick Wins” in Step 1 to demonstrate to decisions makers that the exercise is useful by 
showing them how results can be used. 
Future methodological developments 
 Need and feasibility of defining additional product codes in order to track financial flows to 
WASH; 
 Need and feasibility of defining additional cost categories in order to value financial flows; 
The WASH Accounts team will produce a synthesis report (20 pages) on their experience with 
conducting the testing exercise. They will address the issues presented above and assess the 
feasibility to conduct the different steps of this exercise. They will suggest modifications to improve 
the methodology and classifications proposed. Finally they will provide feedback on the overall 
process of conducting the exercise from an organisational point of view (team composition, process to 
collect data, costs and resource requirements, timing, etc.)
52 
Methodological Note No 1: Developing WASH services classifications 
Objectives. This note provides additional information on existing internationally-accepted methods of 
classification for water-related products, services and activities. These classification methods have 
been integrated into the SEEA-Water, with which the UN-Water GLAAS TrackFin methodology is 
proposing to coordinate. The note also highlights areas for long-term methodological development 
where additional international standard classifications may need to be developed in order to better 
capture the nature of WASH activities to the level of detail that is relevant for policy-making. The 
health sector has adopted a similar process as it has developed its own policy-relevant system of 
classification. 
MN 1.1. Existing classifications of WASH services 
This section presents a list of the main existing international classification systems and identifies how 
they are capturing water, sanitation and hygiene activities. There are three main international systems 
of classification that can be used to categorise industries, activities, goods and services, as follows: 
Table MN 1.1. Summary of main international systems of classification of goods and services 
Classification Purpose Reference 
CPC Ver.2 
Classifies goods and services to help answer the question: 
Table MN 1.2 
(Central Product 
“what is being consumed?” 
Classification) 
ISIC REV.4 
(International Standard 
Industrial Classification of 
All Economic Activities) 
Classifies service providers to help answer the question: 
“who provides those goods and services?” 
Table MN 1.3 
COFOG (Classification of 
the Functions of 
Government) 
Classifies functions performed to ensure that these products 
are provided. There are also other functional classifications 
such as CEPA (Classification of environment protection 
activities), but they are less used. 
Table MN 1.4 
The nature of these classifications is explained below, followed by an explanation of the codes that 
are most relevant to the WASH sector. 
CPC (Central Product Classification) is a system used in national accounts to classify all goods and 
services, based on their physical properties and intrinsic nature and on their industrial origin. A 
full list of CPCs that could potentially apply to WASH services is provided in Table MN 1.2 below. 
The main CPC codes that relate to water and sanitation are CPC 18000 (natural water) and CPC 
94100 (Sewerage, sewage treatment and septic tank cleaning services). These are the water and 
sanitation-related CPCs which are directly consumed and produced by water and sanitation service 
providers (those that fall under the service provider categories of ISIC 36 and ISIC 37, as defined 
further below). They have been included on the first page of Table MN 1.2. 
In addition, however, other products need to be produced to enable service delivery to take place. 
These relate to construction industry-related products, such as sub-categories CPC 53200 (engineering 
works), CPC 54200 (general construction services of civil engineering works) or CPC 54340 (water 
well drilling and septic system installation services). In SEEA-Water, these products are not 
considered to be produced by the water and sanitation industry, but are still a crucial component of the 
activities that need to be undertaken to deliver sustainable water and sanitation services.
Learning from SEEA-Water. SEEA-Water simplified standard tables identify only two of 
the products related to Water: CPC 18000 (natural water) and CPC 94100 (sewerage, sewage 
treatment and septic tank cleaning services). This might be because they track products that are 
produced by water and sanitation industries (ISIC 36 and 37) and deem that other products are 
produced by the construction industry. However, to track expenditure related to capital 
investments, it is essential to track water and sanitation-related construction services as well. 
The CPC classification identifies other water distribution related products that are important to track, 
such as water distribution on own account (CPC 69200) or the distribution of water not through mains 
(such as via trucks, as in CPC 86530). Finally, CPC 91123 is a very aggregated category that includes 
public administrative services related to housing and community amenities, which includes among 
many other services, public administrative services for water supply and sewage system operation. 
In sum, CPC is the internationally recognised classification of products and services. It is 
comprehensive and includes all economic activities, but the breakdown of activities in categories is 
not always adapted to the needs of WASH Accounts. For instance, sanitation and hygiene promotion 
are not clearly identified in separated categories (there is no CPC linked to those services in 
particular), although they may be aggregated in another “public service” categories with other non- 
WASH education activities. In addition, services provided by the government (i.e. public 
administrative functions) are classified on a very aggregated basis, which does not allow identifying 
specific functions of government. This classification provides the underlying basis for all 
classifications but needs to be complemented in some places by more specific classifications. For 
example, COFOG (the Classification of Functions of Government) goes into more detail in 
classifying government functions by purpose as its name indicates. 
In Table MN 1.2 below, we provide a list of CPC codes that directly relate to the provision of water 
and sanitation services. The description of what the code includes is directly extracted from the UN 
Statistics definition, whereas the column on the right includes our comments and potential issues 
regarding the applicability of these classifications for the development of WASH Accounts. 
53
54 
Table MN 1.2- CPC- Central Product Classification 
(Source: http://unstats.un.org/unsd/cr/registry/regcst.asp?Cl=25) 
CPC code Title What it includes Comments and issues about applicability for 
WASH Accounts 
18000 Natural water This subclass includes: 
- potable and non-potable water, suitable for further use, including: 
· treated water (e.g., from desalination plants, water treatment plants) 
· untreated water (e.g., obtained directly from natural sources) 
This subclass also includes: 
- used water suitable for further use 
This subclass does not include: 
- sea water, cf. 16200 
- steam and hot water, cf. 17300 
- mineral waters containing added carbon dioxide, cf. 24410 
- waters individually bottled as beverages, cf. 24410 
- distilled water, cf. 34250 
- sewage and other wastewater, i.e. water not suitable for further use, cf. 39990 
 This category does not allow distinguishing 
between potable and non-potable water 
 This category tracks water as a “product” but 
does not include the related distribution services, 
which are tracked through separate codes (such 
as CPC 86330 or CPC 86350) 
94100 Sewerage, sewage treatment and septic tank cleaning services 
94110 Sewerage and 
sewage 
treatment 
services 
This subclass includes: 
- sewage removal services usually provided using equipment such as waste pipes, 
sewers or drains 
- sewage treatment services using dilution, screening and filtering, sedimentation, 
chemical precipitation, etc. 
This subclass does not include: 
- collection or purification of water, cf. 18000 
- construction, repair and alteration of sewers and sewer pipelines, cf. 54241, 
54251 
- distribution of water through mains on own account, cf. 69210 
- distribution of water through mains on a fee or contract basis, cf. 86330 
94120 Septic tank 
emptying and 
cleaning 
services 
This subclass includes: 
- emptying and cleaning of cesspools and septic tanks 
- servicing of chemical toilets 
53200 - Civil engineering works
55 
CPC code Title What it includes Comments and issues about applicability for 
WASH Accounts 
53231 Aqueducts and 
other water 
supply 
conduits, 
except 
pipelines 
This subclass includes: 
- aqueducts, water conduits and similar waterways designed to convey water for the 
purpose of water supply, except pipelines 
This subclass does not include: 
- waterworks for irrigation or flood control, cf. 53234 
- long-distance pipelines, cf. 53241 
- local pipelines, cf. 53251 
This code corresponds to ISIC Rev.4 code(s) 4220 
53233 Dams This subclass includes: 
- dams and similar water-retaining structures 
- embankments for coastal and other waterside areas 
This code corresponds to ISIC Rev.4 code(s) 4290 
 Expenditure related to dams should only be 
included to the extent that dams are mostly for 
water supply or expenditure could be apportioned 
relative to use. 
53251 Local pipelines This subclass includes: 
- local gas pipelines and water and sewer mains 
- local hot-water and steam pipelines 
This code corresponds to ISIC Rev.4 code 4220 
53253 Sewage and 
water treatment 
plants 
This subclass includes: 
- sewer systems 
- sewage disposal plants 
- water treatment and purification plants 
This subclass does not include: 
- pipelines and water and sewer mains, cf. 54241 (long-distance) and 54251 
(local), respectively 
This code corresponds to ISIC Rev.4 code(s) 4220
56 
CPC code Title What it includes Comments and issues about applicability for 
WASH Accounts 
54200 - General construction services of civil engineering works 
54241 General 
construction 
services of 
long-distance 
pipelines 
This subclass includes: 
- construction, repair, alteration and restoration services for: 
· long-distance overland, underground and submarine pipelines for the conveyance 
of petroleum products, gas, water or other products 
· pumping stations and similar related structures 
This subclass does not include: 
- urban gas or water distribution systems through mains, cf. 53251 
- trenching services, cf. 54330 
This code corresponds to ISIC Rev.4 code 4220 
54251 General 
construction 
services of 
local pipelines 
This subclass includes: 
- construction, repair and alteration services for: 
· local gas pipelines and water and sewer mains 
· local hot-water and steam pipelines 
This subclass does not include: 
- trenching services, cf. 54330 
This code corresponds to ISIC Rev.4 code 4220 
54253 General 
construction 
services of 
sewage and 
water treatment 
plants 
This subclass includes: 
- construction, repair, alteration and restoration services for: 
· sewage disposal plants 
· water treatment and purification plants 
This subclass does not include: 
- construction services of pipelines and of water and sewer mains, cf. 54241 (long-distance) 
and 54251 (local), respectively 
This code corresponds to ISIC Rev.4 code(s) 4220
57 
CPC code Title What it includes Comments and issues about applicability for 
WASH Accounts 
54340- Water well drilling and septic system installation services 
54341 Water well 
drilling 
services 
This subclass includes: 
- special trade construction services involving drilling or digging water wells 
- installation services of water well pumps and well piping systems 
This code corresponds to ISIC Rev.4 code(s) 4220 
54342 Septic system 
installation 
services 
This subclass includes: 
- installation services of septic systems, including: 
· aerobic septic systems 
· evaporation-transpiration (ET) septic systems 
· greywater systems 
· holding tank septic systems 
· pressure dosing septic systems 
· septic disinfection systems 
· chemical, composting, incinerating & waterless toilets 
This subclass also includes: 
- construction services of leach fields or drainfields 
This code corresponds to ISIC Rev.4 code(s) 4220 
69200- Water distribution (on own account) 
69210 Water 
distribution 
through mains, 
except steam 
and hot water 
(on own 
account) 
This subclass includes: 
- own-account distribution of water through mains 
- maintenance of water meters 
This subclass does not include: 
- installation of water meters, cf. 54611 
- reading of water meters, cf. 85999 
- operation of irrigation systems for agricultural purposes, cf. 86119 
- water distribution services through mains (on a fee or contract basis), cf. 86330 
 It is not clear whether this applies mostly to 
industrial own uses or whether it would also 
include own provision by households or by 
communities to community members. For 
example, if a community sets up a piped 
community water scheme, it would be important 
to clarify whether those services would be 
included in here. 
69230 Water 
distribution, 
except through 
mains (on own 
account) 
This subclass includes: 
- own-account distribution of water by trucks and other means 
This subclass does not include: 
- operation of irrigation systems for agricultural purposes, cf. 86119 
- water distribution services, except through mains (on a fee or contract basis), cf. 
86350 - This code corresponds to ISIC Rev.4 code(s) 3600
58 
CPC code Title What it includes Comments and issues about applicability for 
WASH Accounts 
86300- Support services to electricity, gas and water distribution 
86330 Water 
distribution 
services 
through mains 
(on a fee or 
contract basis) 
This subclass does not include: 
- water distribution services through mains on own account, cf. 69210 
- operation of irrigation systems for agricultural purposes, cf. 86119  The content of this category is not entirely clear 
86350 Water 
distribution 
services, 
except through 
mains (on a fee 
or contract 
basis) 
This subclass includes: 
- water distribution services except through mains, e.g., distribution by trucks 
This subclass does not include: 
- transport of water by trucks (without distribution), cf. 65119 
- water distribution services by trucks etc. on own account, cf. 69230 
- operation of irrigation systems for agricultural purposes, cf. 86119 
 It would be important to clarify whether small-scale 
private delivery of water to households by 
trucks would be included in this category. 
91123 Public 
administrative 
services related 
to housing and 
community 
amenities 
This subclass includes: 
- public administrative services related to housing and overall community 
development, water supply, sanitation and street lighting 
- public administrative services related to the development, monitoring and 
evaluation of housing and housing standards (other than construction standards) 
- public administrative services related to rent control and eligibility standards for 
state-subsidized housing 
- public administrative services related to housing for the general public or for 
people with special needs 
- dissemination of public information about housing 
- services provided by government offices, bureaux, departments and programme 
units involved in developing and administering regulations concerning water 
supply 
- public administrative services related to refuse collection and disposal, sewage 
system operation and street cleaning 
- public administrative services related to pollution standards, including the 
dissemination of information regarding pollution 
This subclass does not include: 
- waste collection and disposal services, cf. 942, 943 
- sewerage and sewage treatment services, cf. 94110 
 This category of public administrative services 
does include services related to water and sewage 
but this category is very aggregated. It would 
therefore need to be disaggregated through 
combining with other statistical classification 
systems.
ISIC (International Standard Industrial Classification of All Economic Activities) is a United 
Nations system for classifying economic data according to types of economic activities. The activity 
carried out by a unit is the type of production in which it engages. An “industry” is defined as a set of 
production units engaged primarily in the same or similar kind of productive economic activity. This 
classification examines only the type of activities undertaken and does not distinguish who performs 
them by legal status (i.e. whether the producers are governmental, non-governmental or private). 
Two main categories relate to WASH activities: 
 ISIC class 36 (collection, treatment and supply of water); and 
 ISIC class 37 (sewerage). 
These two categories of activities are the ones that are used by SEEA-Water in their Economic 
Accounts. However, they do not capture the full range of activities involved in providing access to 
water and sanitation services. ISIC 36 and 37 are service oriented: they do not include activities 
related to: 
 The construction of WASH infrastructure and equipment such as pipelines and sewerage network, 
water abstraction and storage facilities, sanitation facilities, water utilities, and sewerage and 
waste water treatment plants (ISIC 42); 
 Water resources management; 
 Activities linked to government collective activities (ISIC 84). 
These are considered as goods and services required for delivering water and sanitation services (ISIC 
36 and 37). As such, they are taken into account in the SEEA-Water Economic Accounts as 
intermediate consumption or fixed capital formation, as appropriate. 
In addition, the activities linked to government collective activities are all aggregated in ISIC 84. As a 
result, government activities that specifically relate to the water and sanitation sector cannot be 
separated out. 
There are a number of issues with these classifications. ISIC 36 does not allow separating water 
provided for domestic use from water provided for industrial use or for irrigation canals. In addition, 
ISIC 37 does not explicitly include faecal sludge management or hygiene promotion. Finally, whereas 
ISIC 84 refers to the management of water supply programmes, it specifically excludes the 
management of sanitation programmes, even though these would need to be clearly identified 
separately from the provision of sewerage and sewage treatment services. 
Table MN 1.3 below presents a summary of the ISIC codes that are likely to be relevant for the 
elaboration of WASH Accounts, with a summary of the main comments on these categories. 
59
60 
Table MN 1.3 - ISIC- International Standard Industrial Classification 
Source: http://unstats.un.org/unsd/cr/registry/regcst.asp?Cl=27&Lg=1 
ISIC 
code 
Title What it includes Comments and issues about applicability for WASH 
Accounts 
3600 Water 
collection, 
treatment and 
supply 
This class includes water collection, treatment and distribution activities for 
domestic and industrial needs. Collection of water from various sources, as 
well as distribution by various means is included. The operation of irrigation 
canals is also included. However the provision of irrigation services through 
sprinklers, and similar agricultural support services, is not included. 
This class includes: 
‐ collection of water from rivers, lakes, wells etc. 
‐ collection of rain water 
‐ purification of water for water supply purposes 
‐ treatment of water for industrial and other purposes 
‐ desalting of sea or ground water to produce water as the principal 
product of interest 
‐ distribution of water through mains, by trucks or other means 
‐ operation of irrigation canals 
This class excludes: 
‐ operation of irrigation equipment for agricultural purposes, see ISIC 
0161 
treatment of wastewater in order to prevent pollution, see ISIC 3700 
(long-distance) transport of water via pipelines, see ISIC 4930 
This class does not allow separating out water supply for 
domestic uses (at least at an aggregate level). Doing so would 
require excluding: 
- treatment of water for industrial and other purposes 
- operation of irrigation canals. 
This class is focused on activities relating to service provision 
but does not include the construction of the infrastructure 
necessary to provide those services. This is because, in the ISIC 
logic, the construction of water and sewerage infrastructure is 
assumed to be the responsibility of construction companies (for 
which construction is the primary purpose) and not of the 
industries in charge of providing water and sanitation services. 
There are limitations to this approach, however: 
 Water and sewerage service providers may choose to build 
at least part of the infrastructure themselves; 
 Infrastructure building costs (gross capital formation) need 
to be included in the WASH Account exercise, as they 
represent a significant proportion of costs. 
3700 Sewerage 
This class includes: 
- Operation of sewer systems or sewer treatment facilities 
- Collecting and transporting of human or industrial wastewater from one 
or several users, as well as rain water by means of sewerage networks, 
collectors, tanks and other means of transport (sewage vehicles etc.) 
- emptying and cleaning of cesspools and septic tanks, sinks and pits from 
sewage; servicing of chemical toilets 
- treatment of wastewater (including human and industrial wastewater, 
water from swimming pools etc.) by means of physical, chemical and 
biological processes like dilution, screening, filtering, sedimentation etc. 
- maintenance and cleaning of sewers and drains, including sewer rodding 
 Although this class is called “sewerage", it does include on-site 
sanitation activities (emptying and cleaning of 
cesspools and septic tanks). 
 Although there is a clear reference to transport of faecal 
sludge, it is not clear whether treatment of faecal sludge is 
also included 
 Hygiene services are not explicitly included in here
61 
ISIC 
code 
Title What it includes Comments and issues about applicability for WASH 
Accounts 
4220 Construction of 
utility projects 
This class includes the construction of distribution lines and related buildings 
and structures that are integral part of these systems. 
This class includes: 
- construction of civil engineering constructions for: 
· long-distance pipelines, communication and power lines 
· urban pipelines, urban communication and power lines; ancillary 
urban works 
· water main and line construction 
· irrigation systems (canals) 
· reservoirs 
- construction of: 
· sewer systems, including repair 
· sewage disposal plants 
· pumping stations 
· power plants 
- water well drilling 
This class excludes 
- project management activities related to civil engineering works, see 
ISIC 7110 
8412 Regulation of 
the activities of 
providing 
health care, 
education, 
cultural 
services and 
other social 
services, 
excluding 
social security 
This class includes public administration of programmes aimed to increase 
personal well-being: health, education, culture, sport, recreation, 
environment, housing, social services. 
This class specifically includes: 
‐ administration of potable water supply programmes 
- administration of waste collection and disposal operations 
- administration of environmental protection programmes 
- administration of housing programmes 
This class excludes: 
- sewage, refuse disposal and remediation activities, see ISIC 37, 38, 39 
- compulsory social security activities, see ISIC 8430 
human health-related activities, see ISIC division 86 
 This class aggregates the administration of very different 
public programmes, including the administration of potable 
water supply programmes but excluding sewage activities. 
As such, it is unlikely to provide sufficient detail on support 
functions carried out by Governments, which is where using 
the COFOG classification can provide additional detail. In 
countries where a COFOG classification is not applied, 
using this broader category might be considered for 
constructing WASH Accounts. 
 This class excludes the administration of sewage and 
sanitation programmes, even though public programmes 
need to be developed independently from the provision of 
the services themselves.
COFOG (Classification of the Functions of Government) is a classification of expenditure by the 
Government according to purpose. It classifies transactions, such as outlays on final consumption 
expenditure, intermediate consumption, gross capital formation and capital and current transfers by 
the Government according to the function that the transaction serves. These COFOG categories allow 
breaking down further the broad ISIC category in which water supply and sewage administration are 
included, i.e. ISIC 8412 (Public Administration). 
Four COFOG categories relate to water management in general and are used as such in SEEA-Water: 
waste water management, soil and ground water protection, environmental protection not elsewhere 
classified, and water supply. These COFOG categories refer to collective services of government 
(formulation and administration of government policy, the setting and enforcement of public 
standards, the regulation, licensing or supervision of producers, etc., as in the case of education and 
health). The categories COFOG 05.2 and 06.3 should not be confused with activities of “sewerage” 
and “water collection, treatment and supply”, classified under ISIC divisions 37 and 36, respectively, 
which are considered to be individual services as opposed to collective services. Table MN 1.4. below 
presents a summary of the COFOG codes that are likely to be relevant for the elaboration of WASH 
Accounts, with a summary of the main comments on these categories. 
Other classifications of government activities for environmental protection have been developed 
and could potentially be referred to. For example, CEPA (Classification of Environmental Protection 
Activities) was developed by Eurostat in cooperation with the United Nations to classify 
environmental protection activities, environmental protection products and expenditures for 
environmental protection. These environmental protection activities are production activities in the 
sense of the SNA as they combine resources, such as equipment, labour, manufacturing techniques 
and information network or products in order to create an output of goods or services. In the case of 
water, CEPA includes “waste water management” and “protection and remediation of soil, ground 
water and surface water”. SEEA-Water uses the CEPA definition of wastewater management to 
classify expenditure for activities and measures aimed at preventing the pollution and protection of 
water through reductions in the release of wastewater into inland surface water and seawater. As a 
CEPA category does not exist for water management and exploitation, SEEA-Water has created this 
classification, which corresponds to ISIC 36 and part of ISIC 84. However, according to the UN 
department of statistics, this classification is not really used in developing countries. We therefore do 
not recommend that specific references be made to this classification. 
Finally, “Classifications of Expenditure According to Purpose” might be useful in some cases (and 
are referred to by the System of Health Accounts). These are primarily designed to classify 
transactions undertaken by households, non-profit institutions serving households (NPISHs), 
government and producers that result in payables. They are used in the System of Health Account to 
define the classifications of the functions of health care (ICHA-HC), health providers (ICHA-HP) and 
the factors of provision (ICHA-FP). 
COICOP is used to classify only a single kind of outlay, which is the individual consumption 
expenditures of households, NPISHs and general government. Three classes of purposes relate to the 
WASH sector: 
62 
 Class 01.2.2: Mineral waters, soft drinks, fruit and vegetable juices 
 Class 04.4.1: Water supply 
 Class 04.4.3: Sewage collection 
COPP is used to classify intermediate consumption and capital outlays of mainly non-financial and 
financial corporate enterprises. Only one class is related to the WASH sector: 
 Class 03.2.0: Outlays on wastewater management (as defined in CEPA Class 2) 
COPNI is used to classify a range of transactions, including outlays on final consumption expenditure, 
intermediate consumption, gross capital formation and capital and current transfers, by NPISHs. 
There are no classes relates to water.
63 
Table MN 1.4 - COFOG (Classification of the Functions of Government) 
Source: http://unstats.un.org/unsd/cr/registry/regcst.asp?Cl=4 
COFOG 
code Title What it includes Issues about applicability for WASH accounts 
5 Environmental protection 
5.2 Waste water 
management 
This group covers sewage system operation and waste water treatment. 
Sewage system operation includes management and construction of the 
system of collectors, pipelines, conduits and pumps to evacuate any waste 
water (rainwater, domestic and other available waste water) from the points 
of generation to either a sewage treatment plant or to a point where waste 
water is discharged to surface water. 
Wastewater treatment includes any mechanical, biological or advanced 
process to render waste water fit to meet applicable environment standards 
or other quality norms. 
 This category includes both construction and management 
of the sewage system operation and wastewater treatment. 
5.3 Pollution 
abatement 
This group covers activities relating to ambient air and climate protection, 
soil and groundwater protection, noise and vibration abatement and 
protection against radiation. 
These activities include construction, maintenance and operation of 
monitoring systems and stations (other than weather stations); construction 
of noise embankments, hedges and other anti-noise facilities including the 
resurfacing of sections of urban highways or railways with noise reducing 
surfaces; measures to clean pollution in water bodies; measures to control or 
prevent the emissions of greenhouse gases and pollutants that adversely 
affect the quality of the air; construction, maintenance and operation of 
installations for the decontamination of polluted soils and for the storage of 
pollutant products; transportation of pollutant products. 
It includes : 
-Administration, supervision, inspection, operation or support of activities 
relating to pollution abatement and control; 
- grants, loans or subsidies to support activities relating to pollution 
abatement and control. 
 The component relative to cleaning pollution in water 
bodies is only a small sub-set of this broader category.
64 
COFOG 
code Title What it includes Issues about applicability for WASH accounts 
5.6 Environmental 
protection (not 
elsewhere 
classified) 
This group includes : 
- Administration, management, regulation, supervision, operation and 
support of activities such as formulation, administration, coordination and 
monitoring of overall policies, plans, programmes and budgets for the 
promotion of environmental protection; preparation and enforcement of 
legislation and standards for the provision of environmental protection 
services; production and dissemination of general information, technical 
documentation and statistics on environmental protection. 
Includes: environmental protection affairs and services that cannot be 
assigned to (05.1), (05.2), (05.3), (05.4) or (05.5). 
 This is a very broad category which might make it difficult 
to specifically identify activities that relate to water and 
sanitation. 
6 Housing and community amenities 
6.3 Water supply This group includes : 
-Administration of water supply affairs; assessment of future needs and 
determination of availability in terms of such assessment; supervision and 
regulation of all facets of potable water supply including water purity, price 
and quantity controls; 
- construction or operation of non-enterprise-type of water supply systems; 
- production and dissemination of general information, technical 
documentation and statistics on water supply affairs and services; 
- grants, loans or subsidies to support the operation, construction, 
maintenance or upgrading of water supply systems. 
It excludes: irrigation systems (04.2.1); multi-purpose projects (04.7.4); 
collection and treatment of waste water (05.2.0). 
 The category "construction or operation of non-enterprise-type 
of water supply systems" is not necessarily clear 
 With regard to grants, loans or subsidies, it is not clear 
whether the amounts included include only the 
administration charges or the grants and subsidies 
themselves
MN 1.2. Summary evaluation: the potential use of existing classifications for 
65 
the development of WASH Accounts 
Existing classifications are not always adequate to capture the reality of the WASH sector and answer 
policy questions. CPC categories are too infrastructure based and ISIC categories do not explicitly 
include some services that are essential in developing countries such as faecal sludge management. 
Therefore in the short term, we recommend using a list of water and sanitation services as 
proposed in this methodology for the purpose of tracking financing to WASH (See Table 1). It 
reflects the main activities alongside the WASH value chain, with the main caveat that these activities 
primarily relate to water and sanitation and do not adequately reflect hygiene. 
However, we recognise that there is an important advantage in relying on existing international 
classifications: It may ease data collection and allow greater comparability of data across countries, 
assuming that countries apply those classifications in a standard manner. Table MN 1.6. below 
presents the categories proposed in this methodology to build WASH Accounts and the 
correspondences with international classifications. Water Resource Management activities that are 
directly relevant to water and sanitation services provision (S4 as per our proposed classification) are 
not explicitly mentioned as a separate category in CPC, ISIC, and COFOG, which is why no 
correspondence is proposed on Table MN 1.6. below. 
In the longer term, we would encourage the WASH international community to examine 
whether a revised and more disaggregated international standard classification of WASH 
services would be needed in order to more closely match the sector’s analytical and policy 
needs. A long-term objective may entail setting up a more disaggregated international classification 
of WASH sector functions and services that can be aggregate up to the existing ISIC classification. 
If this long-term objective was pursued, we have identified the following issues with the existing 
classifications that would need to be addressed: 
 Some countries have developed their own classifications based on the international ones and 
coherence between those different classifications is not always guaranteed; 
 Some categories aggregate several services and it may difficult to separate out data; 
 The detail on support services (usually provided by the Government) is rather limited. Usually, 
the following types of sector support activities need to be provided, as shown on the Table below. 
These activities are alluded to in international classifications but not specifically identified. 
Table MN 1.5 - WASH sector support activities 
 Develop sector policies and programmes 
 Sector planning, including estimating future sector financial needs 
 Reform water sector management 
 Mobilize financial resources and structure investment projects 
 Carry out tariff reforms 
 Regulate service providers 
 Protect water resources necessary for drinking-water supply (e.g. establish catchment protection 
zones, establish and enforce voluntary agreements, establish regulations) 
 Define and enforce drinking-water and discharge standards for municipal wastewater 
 Conduct sanitation promotion and hygiene promotion campaigns 
Feedback from the testing studies will be essential to identify how data is classified at country level 
(particularly at the level of statistical offices), whether it is possible to use the classification proposed 
in this document or whether it would be preferable to use international standard classifications (ISIC, 
CPC etc.). Feedback will also be sought on whether modifications to the existing international 
classifications might be needed. To this end, we have included in the steps of the methodology 
specific questions where feedback from the national WASH Account teams will be sought.
66 
Table MN 1.6 - Correspondences between CPC, ISIC and COFOG classifications along the water and sanitation value chain 
Value chain CPC (Central Products Classification) ISIC (International Standard Industrial Classification) COFOG 
Products and Services ISIC code and description What it includes Purpose of the 
expenditure 
Water supply 
services (S1) 
53233 Dams 4290 
Construction of other 
civil engineering 
projects 
53231 Aqueducts and other water supply 
conduits, except pipelines 4220 Construction of utility 
projects 
54341 Water well drilling services Water well drilling and septic system 
installation services 
18000 Natural water 
3600 Water collection, 
treatment and supply 
Collection of rain water and water 
from various sources, from rivers, 
lakes, wells 
Purification of water for water 
supply purposes 
Desalting of sea or ground water to 
produce water as the principal 
product of interest 
69210 
Water distribution through mains, 
except steam and hot water (on own 
account) Distribution of water through mains 
86330 Water distribution services through 
mains (on a fee or contract basis) 
69230 Water distribution, except through 
mains (on own account) Distribution of water by trucks or 
other means 
86350 
Water distribution services, except 
through mains (on a fee or contract 
basis) 
Sanitation 
services (S2) 
54342 Septic system installation services 4220 Construction of utility 
projects 
Water well drilling and septic system 
installation services 
94120 Septic tank emptying and cleaning 
services 3700 Sewerage 
Collection of sewage by sewer 
systems or sewage treatment 
facilities
67 
Value chain CPC (Central Products Classification) ISIC (International Standard Industrial Classification) COFOG 
Products and Services ISIC code and description What it includes Purpose of the 
expenditure 
94110 Sewerage and sewage treatment 
services 
Treatment and disposal of sewage by 
sewer systems or sewage treatment 
facilities 
Unallocated 
construction 
activities (for 
both water 
and sanitation 
services) ( S1 
and S2) 
53251 Local pipelines (water and sewerage) 
4220 Construction of utility 
projects 
Construction of pipelines and long 
distance transport of water and 
sewage 
53253 Sewage and water treatment plants Construction of sewage disposal 
plants 
54241 General construction services of 
long-distance pipelines 
Construction of pipelines and long 
distance transport of water and 
sewage 
54251 General construction services of 
local pipelines 
Construction of pipelines and long 
distance transport of water and 
sewage 
54253 General construction services of 
sewage and water treatment plants 
Support 
services (S3) 91123 Public administrative services related 
to housing and community amenities 8412 
Regulation of the 
activities of providing 
health care, 
education, cultural 
services and other 
social services, 
excluding social 
security 
Public administration of programmes 
aimed to increase personal well-being: 
health, education, culture, 
sport, recreation, environment, 
housing, social services 
This class includes: 
- administration of potable water 
supply programmes 
- administration of waste collection 
and disposal operations 
5.2 Waste water 
management 
6.3 Water supply
Methodological Note No 2: Developing classifications of WASH actors 
and financing sources 
Objectives. This note complements and provides the rationale for the guidance provided in Section 
2.2. of the main guidance document. The note highlights the importance to clearly define and identify 
WASH sector actors (including WASH uses, service providers and financing units) and the main 
financing sources. Some of these categories warrant a full classification that can be used across 
countries in a comparable manner and later on used by statistical offices in order to compile the 
necessary data on an ongoing basis. Others (such as financing units) do not as they would vary 
substantially from country to country. 
This note is based on information on existing internationally-accepted methods of classification for 
water actors and financing sources. It especially looks at the classifications used by SEEA-Water on 
which the UN-Water GLAAS TrackFin methodology is proposing to build upon and at the OECD 3Ts 
classification of financing sources. The note highlights potential issues with existing classification and 
formulates recommendations on the classifications that can be used across countries for the 
development of WASH Accounts. 
This note provides additional rationale for definitions underlying the classifications of WASH actors 
and financing sources as briefly defined in the table below. 
68 
Table MN 2.1- Classifications of WASH uses, actors and financing sources 
Classifications Definition 
Uses Types of use of WASH goods and services (domestic served or self-provided, 
industrial and commercial, institutional etc.) 
WASH sector actors: 
Service providers Actors engaged in the production and delivery of WASH services. These 
would include government institutions providing support services to the 
sector. 
Financing units Institutional entities that provide funding to the sector. They mobilise 
funding to pay for WASH services. They may allocate funds directly to 
service providers or channel them through intermediary institutions. 
Financing sources Where funding originates from: what the OECD commonly refers to as 
the 3Ts (as tariffs, taxes and transfers) and for which we are proposing a 
modified classification (see Table MN 2.7) 
MN 2.1. Classifying WASH service uses 
Classifying WASH service uses is important because, although the GLAAS report (and this WASH 
Accounts methodology) is proposing to focus on domestic use, separating out information that relates 
to domestic uses from the rest (i.e. use of water and sanitation services for industrial, commercial, 
institutional and in some cases, agricultural purposes) might be challenging. 
Therefore a classification of WASH service uses can provide a useful tool for conducting this type of 
analysis. The proposed WASH Accounts classification of WASH service uses is set out in Table MN 
2.3. Countries can also define their own sub-categories of WASH service uses with an added level of 
detail in order to meet their own policy needs.
69 
Table MN 2.2 - Proposed WASH Accounts classification of WASH Service uses 
WASH service uses Proposed definition 
U1 Served domestic use Consumption of served water and sanitation services by households 
that are served by service providers and pay for the service via a tariff. 
This would include water supply to households that are connected to 
the water and/or sewerage network, but also water fetched from a 
public stand pipe or other providers (e.g. water tankers). 
U2 Self-provided domestic use Consumption of self-provided water and sanitation services by 
households. Households have to pay up-front an initial investment (in a 
well or private latrine) to have access to the service and then need to 
cover operating and maintenance costs of their assets. 
U3 Served institutional use Consumption of served water and sanitation services by government 
agencies (such as Ministries, hospitals, schools, etc.) and voluntary 
organisations such as NGOs, CBOs or foundations. They are served by 
service providers and pay for the service via a tariff. 
U4 Self-provided institutional use Consumption of self-provided water and sanitation services by 
government agencies (such as Ministries, hospitals, schools, etc.) 
and voluntary organisations such as NGOs, CBOs or foundations. They 
pay up-front an initial investment to have access to the service and then 
need to cover operating and maintenance costs of their assets. 
U5 Served industrial and 
commercial use 
Services used by commercial entities that are purchasing water and 
sanitation services from a service provider at the industrial or 
commercial tariff. 
U6 Self-provided industrial and 
commercial use 
Consumption of self-provided water and sanitation services by 
industrial or commercial entities 
Focusing on “uses” rather than “users” 
We are proposing to track financing by types of uses rather than users. The main reason for 
this is that users cannot always be attributed to a single category. For example, domestic 
users might get water from multiple sources, including through self-provided sources or 
different types of providers (networked or non-networked). As a result, those users would 
invest in their own systems (e.g. a water well) but also pay a tariff to obtain piped water 
supplies. It is therefore difficult to define “user categories” that can capture such multiple 
modes of access to water services. However, it is essential for the WASH Accounts to 
capture information relative to different financial allocations to these types of uses. 
Defining categories of “uses” rather than of users allows overcoming such difficulties. The 
key criteria to distinguish “uses” will be to rely on the types of tariff applied to them based 
on each country's system. If a use is paid for based on the “institutional tariff” then it would 
be counted under “institutional use”. In order to interpret the data, it would be useful to 
complement it with coverage data showing how many households are concerned by 
different types of uses. 
Distinguishing between “served” and “self-provided” domestic uses 
An important distinction is between services used by domestic users that are connected to 
network supplies and those that need to self-provide the services (calling on the services 
from a range of non-networked service providers). This is because it would be useful to 
track the extent to which costs and expenditures are different for these types of uses. 
However, data may be difficult to disaggregate in order to make that distinction in practice.
Learning from SEEA-Water classification of WASH service users 
In order to define a relevant classification, it is useful to refer to the way in which SEEA-Water 
classifies water users, as set out below, based on the ISIC classification system (see Table MN1.3. 
for more detail on the ISIC classification system). SEEA-Water defines service users rather than 
uses. Table MN2.1. below presents a summary of how WASH service users are classified in the 
SEEA-Water methodology. 
70 
Table MN 2.3 - Classification of water services users in SEEA-Water 
Categories of water services users in SEEA-Water Explanation and correspondence 
 Specialized producers: (intermediate consumption) 
- ISIC 36 water Producers 
- ISIC 37 sewerage services Producers 
 ISIC 36 and ISIC 37 producers may 
those services for their own use 
 Other Producers (ISIC 1-3, 5-33,41-43, 35, 38, 39, 
45-99) (intermediate consumption) 
 These would include producers invo 
types of activities which consume w 
sanitation for industrial or commerc 
 Households  Domestic use 
 General Government 
- can be disaggregated into central and local 
government 
 Institutional use 
 Rest of the world  International users: with respect to w 
and sanitation, these would not be r 
MN 2.2. Classifying WASH service providers 
Classifying WASH service providers is important to analyse which type of providers receive funding 
(and from where) and how they spend these funds. In addition, WASH service providers often hold 
information on costs of water services, so identifying WASH service providers is key to identifying 
where cost data might be held. 
SEEA-Water classifies producers “into relevant ISIC categories, regardless of the kind of ownership, 
type of legal organization and mode of operation. Therefore even when activities for water collection 
treatment and supply (ISIC 36) and sewerage (ISIC 37) are carried out by the government, they are 
classified to the extent possible in the specific division (ISIC 36 and 37).” It also presents in separate 
tables the production of water and sewerage services self-provided by households and water related 
collective consumption services by the general government. Table MN 2.4. presents the different 
categories of water service providers used in SEEA-Water. 
Table MN 2.3 - Classification of Water service providers in SEEA-Water 
Categories of water service providers 
 Specialized producers: 
- ISIC 36 water Producers 
- ISIC 37 sewerage services Producers 
 Other Producers (ISIC 1-3, 5-33,41-43, 35, 38, 39, 45-99) 
 Households (as producers for own use) 
 General Government (as producer of water related collective consumption services) 
- can be disaggregated into central and local government 
This classification of service providers was used as a basis for the definition of categories of WASH 
service providers for the purpose of the WASH accounts, as set out in Table MN 2.4 below. This 
classification can be used for both water and sanitation providers in two separate tables.
71 
Table MN 2.4 - WASH Accounts classification of WASH service providers 
WASH service providers Definition 
P1 Government agencies 
Providers that are integrated in government. This would 
include government agencies (such as Ministries, hospitals, 
schools, etc) as well as municipalities (operating the service 
directly rather than through a corporatized entity). 
P2 Network corporate providers 
Utilities that own and/or operate facilities for production and 
distribution of water and sanitation services through network 
systems for the public, as well as for bulk services. They can 
be either privately or publicly owned, mandated or 
independent, large, medium or small-sized, providing a public 
service or self-providing the service for their own use. 
P3 Non-network corporate providers 
Corporations that provide any WASH good or service through 
non-network systems. They usually involve low skilled labour 
and small level of initial investments. They can take various 
organisational forms, from cooperatives to private ventures, 
and be formal or informal. 
P4 NGOs and community-based 
organizations 
Non-profit making organisations that seek to complement 
WASH public services. They usually have a formal structure 
and offer services to people other than their members, and are, 
in most cases, registered with national authorities. 
Community-based organizations (CBOs) are a type of small 
NGOs that aim to mobilize, organize or empower their 
members, usually in a local area. 
P5 Households (self-provision) 
Households that self-provide the service. They have to pay up-front 
an initial investment (in a well or private latrine) to have 
access to the service and then need to cover operating and 
maintenance costs of their assets. 
The classification focuses on the type of institutional sector that owns them (government, corporation 
or household). Depending on policy needs, countries could introduce additional criteria to characterise 
service providers such as: public or private, formal or informal, size of the utility, mandated or 
independent etc. Where corporate providers are self-providing and not serving domestic customers, 
this should be noted specifically and potentially excluded from overall figures. 
It is critical to include households as self-providers. In a large number of cases for instance, there is 
no formal sanitation service provider. As a result, households invest in on-site sanitation solutions and 
maintain those installations themselves (“self-supply”). Thus, households’ expenditures on self-supplied 
sanitation in particular accounts for a large part of sanitation services and therefore need to 
be clearly identified in the classification. 
Countries are encouraged to use the proposed classification to the extent that it is possible even 
though it might be difficult to obtain data on certain categories of producers (such as self-supply from 
households). They could prioritize data collection for the more relevant types of providers depending 
on their importance and weight in the WASH services supply market. 
MN 2.3. Classifying WASH financing units 
It is important to identify where the money is ultimately coming from, i.e. from which type of actor. 
Financing units are defined as the institutional entities that provide funding to the sector. They 
mobilise funding to pay for WASH services. They may allocate such funding directly to service 
providers or channel it to the sector through other financing units, who act as intermediary institutions 
by pooling and distributing funding to the sector.
To identify sources of financing, SEEA-Water identifies the “financing sectors” (as the entities 
actually bearing the cost) and characterises them by type of ownership, including: General 
Government (which can be disaggregated between central and local government); Non-for-profit 
institutions serving households; Corporations; Households; Rest of the world. These financing sectors 
are shown in Table MN2.6. below.2 
72 
Table MN 2.5 - Classification of Water financing sectors in SEEA-Water 
Categories of Financing sectors 
 General Government 
- It can be disaggregated into central and local government 
 Not-for-profit institutions serving households 
 Corporations 
- Specialized producers: (ISIC 36 water Producers; ISIC 37 sewerage services Producers) 
- Other Producers (ISIC 1-3, 5-33,41-43, 35, 38, 39, 45-99) 
 Households 
 Rest of the world 
In the same way, we propose classifying financing units by type of institutional sectors as this might 
be the most relevant information to answer policy questions on the origins and channels of funds 
received by service providers. The proposed classification for WASH financing units is presented in 
Table MN 2.6 below. 
Table MN 2.6 - WASH Accounts classification of WASH financing units 
Financing units Definition 
FU1 National authorities 
Public authority at central government level, including Ministries 
(ministry of finance, ministry of water or other ministries) or national 
institutions 
FU2 Regional authorities Public authority operating at the regional level (or any other 
intermediary level between national and local government) 
FU3 Local authorities 
Public body operating at the level of a smaller geographic area, such 
as a city, town, or a district, depending on the country’s 
administrative structure 
FU4 Network corporate 
providers 
Utilities that own and/or operate facilities for production and 
distribution of water and sanitation services through network systems 
for the public, as well as for bulk services. They can be either 
privately or publicly owned, mandated or independent, large, medium 
or small-sized, providing a public service or self-providing the 
service for their own use. 
FU5 Non-network corporate 
providers 
Corporations that provide any WASH good or service along the value 
chain at a small scale through non-network systems. They usually 
involve low skilled labour and small level of initial investments. They 
can take various organisational forms from cooperatives to private 
ventures, and be formal or informal. 
FU7 Bilateral and multilateral 
donors 
Governments providing official development assistance directly to a 
country or through multilateral international institutions (UN, World 
Bank or regional development banks) 
FU8 Banks and financial 
Institutions 
A financial institution that provides banking services, such as taking 
deposits and providing credit facilities and loans to individuals and/or 
2 Additional detail on how this data is used in the SEEA-Water accounts is provided in Annex B.
73 
Financing units Definition 
small businesses and corporations. 
FU9 NGOs and community-based 
organizations 
Non-profit making organisations that seek to complement WASH 
public services. They usually have a formal structure and offer 
services to people other than their members, and are, in most cases, 
registered with national authorities. Community-based organizations 
(CBOs) are a type of small NGOs that aim to mobilize, organize or 
empower their members, usually in a local area. 
FU10 
Households (for 
investments in self-provided 
services) 
Households that self-provide the service (such as on-site sanitation). 
They either pay up-front through initial investments (in a well or 
private latrine) or purchase services from a variety of providers (e.g. 
water tankers). 
MN 2.4. Classifying WASH financing sources 
Next, it is important to identify what the “financing sources” for the sector are, i.e. the type of 
financial flows that are mobilised to fund the sector and where they are coming from. To identify 
typologies of financing sources, it is useful to refer to previous work in this area, from within the 
water sector and based on the SNA. Existing classification systems have their strengths and 
weaknesses, which is why we have proposed a consolidated classification of WASH financing 
sources to be used for WASH accounts, as set out below. 
WASH sector financing sources according to the OECD: the 3Ts 
Since the Camdessus report on water financing (Winpenny, 2003), the water sector has been referring 
to three main sources of finance for the water sector as the “3Ts”, i.e. tariffs, taxes and transfers, to 
which must be added repayable financing sources. The way in which these sources of finance can be 
combined to cover the costs of water service provision has been summarised by the OECD in the 
Figure MN 2.1. below (OECD, 2010).
74 
Figure MN 2.1 - Sources of finance for the WASH sector 
Source: (OECD, 2010), Innovative financing mechanisms for the water sector 
The OECD defines these sources of finance as follows: 
 “Tariffs” are funds contributed by users of WSH services for obtaining the services. Users 
generally make payments to service providers for getting access to the service and for using the 
service. When the service is self-provided (for example, when a household builds and operates 
their household latrine), the equity invested by the household (in form of cash, material or time - 
“sweat equity”) would also fall under “tariffs”. 
 “Taxes” refer to funds originating from domestic taxes which are channelled to the sector via 
transfers from all levels of government, including national, regional or local. Such funds would 
typically be provided as subsidies, for capital investment or operations. “Hidden” forms of 
subsidies may include tax rebates, soft loans (i.e. at a subsidised interest rate) or subsidised 
services (such as subsidised electricity). 
 “Transfers” refer to funds from international donors and charitable foundations (including 
NGOs, decentralized cooperation or local civil society organizations) that typically come from 
other countries. These funds can be contributed either in the form of grants, concessionary loans 
(i.e. through the grant element included in a concessionary loan, in the form of a subsidised 
interest rate or a grace period) or guarantees. 
Due to the capital-intensive ‘lumpy’ nature of WASH sector investments (with relatively large 
investments with a long asset-life), it is seldom possible to finance all necessary investments up-front. 
If additional financing cannot be raised, either by reducing costs or by increasing the 3Ts, it is
standard practice for the financing gap to be “bridged” via a mix of repayable financing sources, 
which may include the following:3 
- Bank loans, including commercial finance, microfinance and concessionary loans (i.e. loans from 
donors that would include a grant or transfer element in the form of an interest rate below market 
rate or a grace period, for example); 
- Equity provided by investors with the expectation that such equity can be repaid and would earn a 
rate of return on the capital invested. In going concerns, equity may be provided over very long 
periods of time and may therefore not be repaid. A hidden form of public subsidy (or transfer) 
may consist of making an equity investment with no expectation of a repayment or a return; 
- Other financial instruments, such as bonds, whereby a debt title is sold in the market to a large 
group of bond investors. Bond issuers may include municipalities (i.e. “municipal bonds”) or 
public and private companies (“corporate bonds”). 
Evaluation of the relevance of the OECD 3T typology for the WASH Accounts 
The OECD 3T typology is relevant to WASH Accounts in the sense that it categorises the flows of 
funding according to their origin and to their nature (for example, distinguishing between revenues 
from the service and external subsidies). Referring to this terminology can be an advantage as it has 
become well known and accepted in the sector over the recent years, where it has been useful to 
convey in simple terms a number of key concepts about WASH sector financing, such as the idea that 
full-cost recovery from tariffs should not be the only objective and that sustainable cost recovery from 
a mix of the 3Ts could be a good alternative objective. 
However, concerns regarding this typology have been raised in previous consultations with sector 
stakeholders, as summarised below: 
 Some have expressed that this typology is mainly known amongst international organizations and 
External Support Agencies (donors, NGOs etc.); its appropriation by developing country actors is 
still in progress. 
 The terminology used can be confusing in the context of some developing countries. As the 
WASH Accounts are meant to be used by policy makers it would be important that the 
terminology of the classifications is straight forward and easily understood without allowing for 
any interpretation. 
Specific concerns have been raised about the 3T terminology and how it may introduce confusion. 
These concerns are set out below: 
 The term “Tariff” is understood in common language as the tariff paid by users to utilities. 
However the OECD typology includes in this category payments made by households for self-provision. 
These two types of funds are substantially different, with different data sources. Thus 
we would recommend separating the two types of financing sources out if possible, under the 
overall category of tariffs (which could be renamed as “household expenditure for self-supply”). 
 The OECD typology includes under the item “Transfer” “funds from international donors and 
charitable foundations (including NGOs, decentralized cooperation or local civil society 
organizations) that typically come from other countries”. However, in several countries (such as 
India or many Latin American countries), the term “transfer” is often used to refer to central 
government budget that is allocated to local governments in decentralised settings. This is part of 
what the OECD’s terminology refers to as “taxes”, although this term is relatively vague and may 
be misunderstood by developing countries’ governments. 
Therefore given the interpretations that could arise around the terminology we recommend adapting 
the terminology of the OECD typology of financing sources for the purpose of preparing the WASH 
Accounts. A revised classification is suggested in Table MN2.7. below. To derive this revised 
3 For large, capital intensive service providers individual loans may be repaid but the total debt level may not reduce as loans 
are 'rolled-over' or renewed to maintain the same balance between debt and equity finance. 
75
classification, it was also useful to examine in detail and learn from the SEEA-Water typology of 
financing sectors, as set out below. 
WASH sector financing sources according to SEEA-Water: financing units and sectors 
Analysis of the financing sectors identified by SEEA-Water (Table MN 2.5 above) have helped us 
identify categories of financing sources that are not explicitly considered by the OECD 3T 
terminology, such as transfers from Not-for-profit institutions serving households (which might be in 
kind or in cash, and may originate from domestic voluntary sources as opposed to only international 
transfers) as well as international transfers from the rest of the world which might not be described as 
Official Development Assistance (such as transfers from non-OECD donors, including from the 
BRICS). 
WASH Accounts proposed classification of financial sources 
In summary, we are recommending the adoption of a classification of financial sources that would 
broadly align with the 3T terminology but provide additional disaggregation and reconcile with the 
SEEA-Water terminology. The proposed classification of financing sources is shown on Table MN 2.7 
below, with relevant definitions. 
76
77 
Table MN 2.7 - WASH Accounts classification of WASH financing sources 
WASH-Account 
financing sources Proposed definition 
Correspondence 
with OECD 
Typology of 
financing sources 
Correspondence 
with SEEA-Water 
categories 
of financing 
sectors 
FS1 
Tariffs for 
services 
provided 
Payments made by users to service providers 
for getting access to and for using the service. 
TARIFFS 
Part of funding 
via 
“Corporations” 
FS2 
Households’ 
expenditure for 
self-supply 
Funding provided by households to invest in 
or provide the service themselves. Households 
have to make up-front an initial investment (in 
a well or a private latrine) to have access to 
the service and then need to cover operating 
and maintenance costs of their assets. This can 
be in form of cash, material or time 
(sometimes referred to as “sweat equity”). 
Households 
FS3 Domestic public 
transfers 
Public transfers from government agencies 
(central or local government) to WASH 
actors. These are often subsidies that come 
from taxes or other sources of revenues of the 
government. This category includes only 
grants and excludes concessionary loans 
(which are included in FS6). 
TAXES Governments 
FS4 International 
public transfers 
Voluntary donations (or grants) from public 
donors and multilateral agencies that come 
from other countries. Concessionary loans are 
excluded from this category and entirely 
included in FS6 Repayable Finance. 
TRANSFERS 
Rest of the world 
FS5 Voluntary 
contributions 
Voluntary donations (or grants) from 
international and national non-governmental 
donors including from charitable foundations, 
Non-Governmental Organizations (NGOs), 
civil society organizations and individuals 
(remittances). Concessionary loans are 
excluded from this category and entirely 
included in FS6 Repayable Finance. 
Not-for-profit 
institutions 
serving 
households 
FS6 Repayable 
financing 
Sources of finance that come from private or 
public sources and ultimately need to be 
repaid, such as loans (including concessionary 
loans and guarantees), equity investments or 
other financial instruments such as bonds. 
This category can be divided down into 2 sub-categories: 
concessionary repayable financing 
and non-concessionary repayable financing. 
REPAYABLE 
FINANCE 
Part of funding 
via 
“Corporations”
Methodological Note No 3: Estimating funding of WASH services with a 
“Financing Source approach” 
Objectives. This note provides guidance for tracking financing flows in the WASH sector using a 
“financing source approach”. It is based on a review of the experience of the System of Health 
Accounts in estimating financing sources. For each type of financing source, it indicates what the 
potential sources of information might be and identifies what can be the challenges (and associated 
solutions) with identifying those financing sources. 
MN 3.1. Obtaining data on financing sources 
As mentioned in in the Guidance Document, there are several types of financing sources that can be 
drawn upon to finance the sector. Identifying information on each of these financing sources can be 
done in several ways, as outlined in Table MN 3.1 below. The most appropriate methods for gathering 
data on financing sources needs to be defined on a country by country basis, depending on data 
availability. Additional guidance on gathering information on each type of financing source is 
provided below the Table. 
78 
Table MN 3.1 - Gathering data on financing sources 
Categories of financing sources Data sources and collection methods 
Tariffs for services provided 
(FS1) 
 Use existing sources where available, such as IBNET, national 
regulators or service providers’ associations, strategic financial 
planning exercises at national level 
 For main service providers, obtain turnover data per WASH service; in 
decentralized countries, organize a survey of formal service providers 
 Organize an inventory and survey of other service providers (including 
small-scale informal providers) to assess their overall tariff revenues 
Households’ expenditure for self-supply 
(FS2) 
 Rely on existing household survey data on coverage 
 Organize ad hoc household surveys to assess their investments in self-provided 
water or sanitation 
Domestic public transfers (FS3)  National and local government actual expenditure data, based on data 
collection by national bureau of statistics or specific questionnaires 
International public transfers 
(FS4) 
 OECD DAC database 
 National and local government financial accounts 
Voluntary transfers (FS5) 
 National and local government financial accounts 
 Surveys of NGOs and other charitable organizations about their 
investments 
Repayable financing (FS6)  Surveys of commercial banking sector 
FS1: Tariffs for services provided 
Information on tariffs paid to “official” WASH service providers exists at a disaggregated level 
(i.e. at the level of each service provider) but obtaining this information usually requires careful 
examination of the service providers’ financial accounts and tariff schedules.
Some countries or organisations have gathered data on average tariffs in a given country or in 
different cities,4 whilst other organisations gather and present data on tariff structures at country level. 
However, few (if any) countries collect data on a consistent and regular basis on the total amounts of 
revenues that are generated through tariffs paid by users for services provided. 
The present methodology requires gathering such data, both at an aggregate and at a disaggregated 
level: 
 Aggregate information on revenues from tariffs: this is the aggregate of all revenues generated 
from all types of services at the level of service providers, based on what is usually referred to as 
“turnover from sales of water / sanitation services”, as extracted from the profit and loss accounts 
of service providers; 
 Disaggregated information on revenues from tariffs: in most cases, obtaining disaggregated 
information on the distribution of revenues from tariffs between various services (water, 
sanitation and other services) or various regions would need to be obtained based on commercial 
data. This requires a specific visit (or sending a questionnaire) to each service provider. 
Collecting this type of data is likely to be difficult when the provision of WASH services is highly 
decentralized, resulting in a large number of service providers and when informal service providers 
play an important role i.e. serve a large share of the market. 
To overcome these potential difficulties, the WASH Accounts team can try to obtain data from: 
 National water sector regulators (e.g. NWASCO, the National Water Supply and Sanitation 
79 
Council in Zambia, or PURC in Ghana, WASREB in Kenya, etc.); 
 National utility associations (e.g. ABCON5 in Brazil); 
 Global surveys and databases that collect information on tariffs, such as the International 
Benchmarking Network for Water and Sanitation Utilities (IBNET) benchmarking platform 
managed by the World Bank; 
 Strategic Financial Planning exercises for the sector, which might have been conducted under 
the leadership of international organisations such as the OECD or the World Bank. 
Box MN 3.1 - Regulatory data on tariffs of service provision from national regulators 
Data on tariff structures can be available from the national regulator of water and sewerage. For example, Ofwat 
(the Office of Water Services) is the economic regulator of the water industry in England and Wales. 
Ofwat monitors and approves every year each company’s water and sewerage charges to check that they respect 
the price limits set. It used to publish results in yearly charges reports. These price limits are set by the regulator 
every 5 years by assessing in detail the operators business and financial models. To conduct such price reviews, 
they rely on financial models that capture all financial flows, including revenues (from tariffs and other sources) 
and sources of repayable finance. The regulator builds into the price limits, and therefore the tariffs charged to 
customers, the cost of servicing the debt and equity by estimating the value of the regulatory capital asset base. 
All this information is made publically available online, except where any information is deemed commercially 
sensitive. 
As mentioned above, tariff surveys are unlikely to estimate total revenues from tariffs but are more 
likely to include data on average tariffs or tariff structures. The WASH Accounts team would 
therefore need to process this data, using complementary datasets on the number of customers and 
their respective consumption (this could become a somewhat complex exercise when tariffs are 
structured based on consumption blocks, in which case, some approximation are likely to be 
necessary). 
4 For example, the OECD data for a set of cities and countries around the world (OECD, 2009. Managing Water for All - An 
OECD perspective on pricing and financing. Paris: OECD Publications.) 
5 Associação Brasileira das Concessionárias Privadas de Serviços Públicos de Água e Esgoto.
In the case of informal service providers, it is unlikely that information will be readily available on 
their revenues from tariffs. Where such informal service providers are serving a substantial share of 
the market, surveys based on a representative number of informal service providers (and their 
customers) will therefore need to be conducted in order to obtain data on the revenues from tariffs that 
they perceive. The tariffs they charge from their customers are likely to be higher than the tariffs 
applied by formal operators but the volumes consumed will inevitably be lower, so information on 
tariffs as well as volumes consumed will need to be collected for a representative sample. This data 
would then need to be extrapolated based on information on the average number (and size) of 
informal service providers (but excluding households, which are covered in the next category). 
FS2: Households’ expenditure for self-supply 
The second type of financing source coming directly from households relates to what we are 
referring to as “households’ out-of-pocket expenditure for self-supply”.6 This financing source is 
most relevant for household investments in water self-supply solutions (such as private or community 
wells, water tanks, etc.) and household level sanitation. It is an important financing source to track as 
it can represent a substantial portion of investments made by households but also by the country as a 
whole in water and sanitation. Yet, it is the financing source that is typically tracked the less or in the 
less reliable manner. 
In order to assess financing flows from households, the WASH Accounts team can use existing 
household surveys to obtain information on coverage rates, as these would indicate how many 
households have invested in household-level on-site sanitation. When such coverage data is updated 
on a regular basis (for example, the WHO-UNICEF Joint Monitoring Program is currently conducting 
surveys every two years but is considering carrying them out every year), it would be possible to track 
the amount of investments carried out by households over time. In many countries, however, coverage 
information is not gathered on an annual basis in a reliable manner. Given this, it would not be 
possible (or even necessary) to try and track annual levels of expenditure made by households on self-supply. 
This means that estimating these expenditures lends itself better to a “capital stock” approach 
rather than to a “financing source approach (see “Methodological Note No5). 
In order to generate a comprehensive picture of financing sources for the sector, however, it would be 
useful to derive estimated investment flows from households. This could be done by taking coverage 
estimates for two available dates (which might be 5, 10 or 15 years apart if the best reliable 
information is the census) and estimating the trend in coverage between those two dates to derive 
annual investment flows. To enhance accuracy, these coverage estimates would need to reflect the 
type of investments that households have made (for example, the type of latrines). Coverage estimates 
then need to be combined with information on the average household investment by type of 
investment category, based on existing surveys or project-related information. 
If reliable coverage information is not available, it would be necessary to conduct ad-hoc household 
surveys to assess their investments. Such surveys are likely to be necessary in any case to estimate the 
value of household investment for different types of investments, such as types of latrines. 
Conducting this type of surveys would be greatly facilitated by the use of mobile phone technologies 
to reduce the cost of data gathering and minimise the risk of error. Such mobile phone technologies 
have been used extensively already to gather information on water points (what is referred to as 
“water point mapping”), including information on the geographical location, related investment costs 
and functionality of rural hand-pumps for example. This information (particularly that on investment 
costs) will be of critical interest to fill in the data gap on household investments in self-supply. 
6 Note that in the OECD 3T terminology, these are included in “tariffs”. We are proposing to separate them out, partly 
because the methodology for their estimation is likely to be different. 
80
FS3: Domestic public transfers 
Domestic public transfers are public funds transferred by government agencies (either at 
central or decentralised government level) to WASH sector actors. Such funds would typically be 
provided as subsidies, for capital investment or operations. This category includes only pure grants 
and excludes repayable finance, even concessionary loans (which are included in FS6 – Repayable 
Finance). “Hidden” forms of subsidies may include tax rebates or subsidised services (such as 
subsidised electricity). Explicit subsidies are a priority for the tracking exercise. In the first stage of 
methodological development, it would be sufficient to simply mention the existence of hidden 
subsidies rather than to seek to quantify them (such quantification could be the subject of 
methodological development later down the line). In addition, in this first stage, we are 
recommending focusing on “budgeted public transfers”, complemented by spot checks to evaluate the 
extent to which “budgeted amounts” differ from effective spend. 
Public transfers: distinguishing between “budgeted” and effectively spent 
One important distinction when it comes to public transfers (for domestic and international 
public transfers alike) is that there might be a substantial difference between what is 
“budgeted” and what is effectively spent. In some countries effective spent might 
systematically be under what has been budgeted. This can be linked to a number of 
reasons, including political obstacles, low management and “absorptive” capacity, or 
difficulties with planning and implementing investment projects. At this stage of 
methodological development, it will be easier to obtain information on budgeted public 
transfers so it is recommended to focus on this type of data gathering. However, 
particularly in countries where there is a substantial gap between budgeted amounts and 
effective spending, it would be necessary to complement this with qualitative and 
quantitative assessments of the difference between budgeted amounts and actual spending. 
Data on public transfers channelled to the WASH sector need to be collected from a wide range of 
stakeholders and sources, including national and local governments or other public financing units, 
such as, for example, common funding baskets which are set up when a sector-wide approach to pool 
funding is adopted for the sector. This will need to be based on the sector financial flow mapping 
exercise conducted in Step 2.2. 
In some cases, aggregated data at a national level can be found in some countries in established tools 
for tracking and planning financial resources. For example, the Total Sanitation Campaign in India 
had a solid system of reporting, both for public financial flows and for achievements, which can be 
used to some extent for this purpose (although independent spot-check verifications might be needed). 
FS4: International public transfers 
In this category we only include voluntary donations from public donors and multilateral agencies 
that come from other countries. These funds can be contributed either in the form of grants or 
guarantees. Other forms of repayable finance from international donors, such as concessionary loans, 
are excluded from this category and entirely included in FS6 Repayable Finance. 
To obtain data on international public transfers, the WASH Accounts team can consult: 
 The OECD-CRS and OECD DAC databases: it tracks most transfers in the form of official 
development assistance (ODA) from donor countries and international organizations (bilateral and 
multilateral cooperation). It is the best database available at this stage and gives the ability to 
track separately grants and (concessionary) loans. However, there are a number of caveats with 
this database. First, data does not always match detailed data that can be obtained at national 
level. Therefore, some degree of triangulation is likely to be needed. In addition, it is only 
recently that the OECD DAC database started differentiating spending on water from spending on 
sanitation, and no further disaggregation is available at this stage. Finally, the database covers 
81
only international public transfers from OECD countries and does not currently include important 
non- OECD aid flows such as those coming from China, Arab states or India. 
 National and local government financial accounts: They can be used to complement and refine 
data from OECD database at a national level. In case of conflicting information, however, it 
would be essential to state which source has been given priority (depending on reliability). 
Collecting data on ODA and the issue of concessionality 
The OCDE database tracks official development assistance (ODA) from donor countries 
and international organizations, according to the following definition: 
“Financial flows to countries and territories on the DAC which are: 
- provided by official agencies, including state and local governments, or by their 
82 
executive agencies; and 
- each transaction of which: 
a) is administered with the promotion of the economic development and welfare of 
developing countries as its main objective; and 
b) is concessional in character and conveys a grant element of at least 25%, 
calculated at a rate of discount of 10 per cent (except for capitalised interest 
included in re-schedulings of ODA loans which is recorded as ODA, regardless of 
the grant element of the rescheduling.)” 
Therefore to allocate the expenditure between FS4 (International public transfers) and FS6 
(Repayable Finance), it is necessary to distinguish repayable loans from pure concessional 
finance (100% of grant element). Details on the conditionality of the financing flows can 
be found on the OECD databases and corroborated with national level information. 
Source: http://www.oecd.org/dac/38429349.pdf 
FS5: Voluntary transfers 
Voluntary donations may come from international and national non-governmental donors including 
from charitable foundations, Non-Governmental Organizations (NGOs), civil society organizations 
and individuals (remittances). Only donations that are 100% pure grants are included in this category. 
All forms of repayable finance (including concessionary loans and guarantees) are included in the 
category FS6 Repayable Finance. In many developing countries, there are frequently many voluntary 
organisations contributing funding to the water and sanitation sector in-cash or in-kind (for example, 
by digging a well or providing equipment). In most countries, such transfers are not recorded in a 
reliable fashion and there is therefore little transparency about their actual contribution to sector 
financing. 
To obtain data on such transfers, the WASH Accounts team could consult: 
 National and local government financial accounts: some governments have started collecting 
information on voluntary transfers to the water and sanitation sector, with the objective of 
ensuring better coordination of such financial flows. This is the case in Bangladesh, for example, 
where NGO financing needs to be recorded in the public sector budget, thereby greatly 
simplifying the task of collecting financial information on their contribution. This type of 
initiative, if deemed successful, could be replicated in other countries in order to improve 
coordination and facilitate the task of obtaining and recording information on such flows. 
 Surveys of NGOs and other charitable organizations about their investments: given the 
current lack of transparency on spending on WASH by the voluntary sector, some international 
NGOs have taken the initiative to record such flows in a more reliable manner, for example, as 
undertaken by Washfunders. Other initiatives, such as that developed by Interaction, the largest 
coalition of US-based NGOs, seek to map NGO-funded projects at country level (see an example 
for Haiti here). However, this information is not specifically gathered for water and sanitation and 
is only available for a very small number of countries at present.
FS6: Repayable financing 
This category includes all types of repayable finance, including concessionary loans or guarantees. 
Information on repayable financing to the sector is very limited, but some can be found in existing 
data bases: 
 The OECD-CRS database contains information on concessionary lending; 
 The International Financing Review compiles data on commercial loans or bonds; 
 The World Bank Private Participation in Infrastructure database reports the amount of 
capital investments that is committed by private operators at the start of the contract. It is 
commonly used to track private investment in infrastructure. Although private operators are not 
financing sources as such, they can “bridge” the financing gap temporarily. 
Separating “concessional” from “non-concessional” repayable finance 
The FS6 category can be further broken down in two sub-categories: Concessionary 
Repayable Finance and Non-concessionary Repayable Finance. 
The allocation of repayable finance flows between these two sub-categories can be done in 
two ways: 
- In a first instance, we can start by bluntly characterising the flows as “concessional” or 
“non-concessional” based on the ownership status of the lender. A repayable flow 
coming from a public sector agency could be characterised as “concessional” and a 
repayable flow coming from a private sector agency will be characterised as “non-concessional”. 
However, some public sector agencies can themselves be involved in 
83 
providing loans at market rates. 
- To obtain a more refined estimation of these flows, we would recommend obtaining 
data on the lending conditions for specific loans where there are doubts about the 
category in which they fall. Concessional loans include a grant element, in the form of 
a subsidised interest rate or a grace period. We recommend using the OECD definition 
of ”concessional” to allocate the flows to the sub-categories. “Concessionary 
Repayable Finance” would include repayable flows that convey a grant element of a 
least 25 per cent, calculated at a rate of discount of 10 per cent (except for capitalised 
interest included in reschedulings of ODA loans which is recorded as concessional, 
regardless of the grant element of the rescheduling.) 
Source: http://www.oecd.org/dac/38429349.pdf 
However, the WASH Accounts team might need to complement this information with surveys of the 
commercial banking sector, to better understand the extent to which they are currently financing the 
water and sanitation sector and through which kind of instrument (commercial loans, bonds, equity 
issuance, guarantees, etc.). 
Given that such financial flows are by definition “repayable”, reflecting such flows into the WASH 
accounts is not straightforward: the box below indicates how the System of Health Accounts is 
handling the treatment of loans, for example. We are proposing to use a similar methodology in the 
case of the WASH Accounts. 
Lessons from the health sector: handling of loans in the System of Health Accounts 
Loans increase the funds available to a provider or financing agent. In the health accounts, 
financing agents are defined as the units that channel finance to the sector by pooling funds 
together from different sources and re-distributing them to service providers. 
Loans are not included directly in the health accounts, because they affect the balance sheet 
(assets and liabilities) of the financing agent. What does appear in the SHA is the money that
the financing agent releases into the health care system. Since most loans are spent as soon as 
they are disbursed, the distinction matters more for the purposes of attributing the funds to a 
financing source than for the level of health expenditure. 
Loan repayments do not appear in the health accounts because they represent a change in 
assets rather than a current expenditure for health. In effect, they are funds that were already 
registered in the health accounts when the disbursement was spent. 
On the other hand, it is appropriate to include interest payments made on outstanding debt as 
part of health spending, provided that the debt was directly related to the financing agent’s 
health activity. Most accounting systems separate loans and loan repayment from other 
transactions, so this treatment is not difficult to implement in practice. In systems where such 
a separation is not made, health accountants should be on the lookout for budget line items 
that indicate the infusion of new capital or the repayment of loans or retirement of other debt, 
and eliminate those entries from the total for the financing agent. 
From a policy perspective, it is important to show the effect of new loans or of loan 
repayments on a given financing agent or class of financing agents, this can be done in an 
exhibit table. This type of exhibit can inform policy-makers without detracting from the 
presentation of the current state of the health care system's ability to deliver care. 
MN 3.2. Potential challenges and how to address them 
Collecting information on revenue sources will give rise to a number of challenges and, as a result, 
cannot be relied upon as the sole methodology for data collection. 
Allocating resources from financing sources to different financing units is likely to be problematic. 
For example, domestic public transfers are not systematically allocated to different types of services, 
84
particularly when funding for water and sanitation is part of overall transfers from central to 
municipal governments. 
To overcome this challenge, it might be necessary to estimate “revenue allocation keys” in order to 
reconstruct the portion of such funding flows that is allocated to WASH services. Such allocation 
keys can be more or less precise, based on the level of information available. One potential method 
would be to estimate the costs relative to different uses or different services (based on a “Cost-based 
Approach” as described in 2.3 and Methodological Note No 4: Estimating the costs of providing the 
service with a “Cost-based approach”) and to use these to derive allocation keys to be applied to 
revenue sources. 
Another potential difficulty is to avoid double-counting, particularly when resources are allocated 
from international donors to national governments and from national governments to local 
governments. In that case, it is important not to count a financial flow twice, i.e. at source (such as the 
national government as the financing unit) and at the point where funds are disbursed to service 
providers (i.e. at the level of the financing unit through which funds are channelled which in this case 
would be the local government). 
Depending on what makes more sense given the country’s institutional set-up, it would be important 
to define where the flows are going to be tracked and stick to that specific rule. We recommend that 
flows be tracked at the level that is closest to service provision, so as to enable maximum 
disaggregation of the funding flows. 
85
Methodological Note No 4: Estimating the costs of providing the 
service with a “Cost‐based approach” 
Objectives. This note provides guidance for tracking financial costs of WASH services. It draws from 
the experience of Health Accounts in estimating costs and also presents existing costs classification 
that could be referred to. It then discusses specific issues such as tracking the full costs of the service, 
defining cost categories now and for the future and, in particular, what type of cost categories may 
need to be obtained, at the very least distinguishing between capital expenditure and operations and 
maintenance expenditure, and potentially large capital maintenance expenditure. Software costs for 
policy development, programme development, etc. will also need to be tracked separately if possible, 
although this might be difficult to do at an aggregate level. 
MN 4.1. Classifying costs 
For the purpose of data comparability across countries, it will be important to use the same cost 
categories and commonly agreed methodologies to estimate such costs. 
At the international level at present, there are no standard classifications of costs that are used in both 
the urban and rural sub-sectors alike. In the urban sub-sector, country-level regulators define cost 
items in a specific manner (this if the case of Ofwat in England and Wales, for example, which has 
defined cost categories in order to set prices in an uniform manner for all water and sewerage 
companies). International utility benchmarking exercises, such as IBNET developed with support 
from the World Bank, seek to benchmark operating costs (defined as the unit operational cost per 
cubic metre of water produced or sold) but does not attempt to benchmark investment costs, as “they 
tend to differ widely from one year to another due to the lumpiness of the investments”. As a result, 
the IBNET toolkit suggests measuring the capital intensity of a utility based on the gross fixed asset 
value (a capital stock indicator) per capita served. However, they also state that: “Unfortunately there 
is often limited information available about asset values and until more emphasis is placed on this 
item the values derived must be treated with caution” (see Methodological Note No5 for more 
information about how asset values can be derived). 
For the rural and peri-urban sector, the WASHCost project led by IRC of the Netherlands has defined 
a cost typology that seeks to capture the entire life cycle costs of investing in WASH services. The 
cost definitions developed by WASHCost were inspired by the cost categories that are typically used 
for urban water and sewerage services and were extended to the rural water and sanitation sectors.7 
These cost categories are shown on Table MN4.1. below. 
86 
Table MN 4.1 - WASHCost classification of costs in the WASH sector 
Cost component Explanation 
Capital expenditure, including 
hardware and software 
Initial costs of putting new services into place: “hardware” such as pipes, 
toilets and pumps and one-off “software” costs such as associated training 
and consultations. 
Operating and minor 
maintenance expenditure 
Routine maintenance and operation costs to keep services running (e.g. 
wages, fuel or any other regular purchases). Neglect has long-term 
consequences for service delivery, such as expensive capital (maintenance) 
expenditure and/or service failure. 
Capital maintenance 
expenditure 
Occasional large maintenance costs for the renewal, replacement and 
rehabilitation of a system. These essential expenditures are required before 
failure occurs to maintain service levels and need to be planned for. 
7 However, they do not include any specific mention of water resource costs or environmental costs, which may 
need to be done in subsequent methodological development.
Cost component Explanation 
Cost of capital The cost of borrowing money or investing in the service instead of another 
opportunity. It also includes any profits that service providers may earn 
and that are not reinvested. It has a direct impact on the ability to maintain 
a service financially. 
Expenditure on direct support Post-construction support costs (e.g. training for community or private 
sector operators, users or user groups). These costs are often forgotten in 
rural water and sanitation estimates but are necessary to achieve long-term 
functionality and scale. 
Expenditure on indirect support The cost of planning and policy-making at the governmental level, 
including strengthening the skills and capacities of professionals and 
technicians. These costs have a direct impact on the long-term 
sustainability of projects. 
Source: Adapted from WASHCost (2010a) 
This classification clearly identifies cost items that are typically neglected, and therefore not 
adequately budgeted for, such as capital maintenance expenditure or expenditure on direct (or 
indirect). For example, the methodology explicitly considers software costs—that is, expenditure on a 
range of “software” activities required to ensure that such services are delivered effectively.8 These 
software activities are extremely varied and broad in scope; they range from the costs of managing the 
sector at the level of the ministry (staff costs employed in planning, budgeting, interaction with 
international donors, monitoring and evaluation, technical assistance, etc.) down to the costs of 
capacity-building or hygiene education activities at the local level. 
If validated, such cost classification could be used as a standard way of accounting for costs in the 
WASH sector in the long term. However, this classification appears to be more useful from the point 
of view of project planning and budgeting than for tracking costs at a national level. Indeed, it may be 
difficult to use the WASHCost classification in the context of the present testing study, as some of the 
cost categories (such as capital maintenance expenditure, cost of capital or expenditure on direct and 
indirect support) are not consistently tracked in most countries at present. Typically, most 
government- or NGO-led programmes do not account separately for software costs associated with 
capital expenditure or for expenditure on direct or indirect support. Overtime, using a costing 
classification based on the WASHCost classification could be considered. 
For the testing exercise, we recommend using a cost typology that at least distinguishes between 
capital expenditure (including large maintenance costs) and operating and minor maintenance 
expenditure at the level of each service provider. Support (or “software”) costs could be collected at 
the aggregate level for the sector (e.g. expenditure of the water ministry) as well as at the level of each 
particular service and be incorporated into either operating costs (if they are “recurrent” in nature) or 
capital expenditure (if they are “one-off” costs associated with the development of a specific capital 
investment project). 
In this document, we use the terms “cost” and “expenditure” interchangeably. The word “cost” is 
more likely to be used for utilities and “expenditure” for governments or households. The overall 
category is referred to as a “cost classification”. 
The classification of cost types that we are proposing to use for the testing exercise is summarised in 
Table MN 4.2. below. 
8 Trémolet, Kolsky & Perez (2010) also explicitly accounted for software costs when deriving the costs of 
providing on-site sanitation at the household level. 
87
88 
Table MN 4.2 - Proposed classification of costs 
Type of costs Definition 
C1 
Capital costs 
including hardware 
and software 
Initial costs of putting new services in place, including “hardware” such as 
pipes, toilets and pumps and one-off associated “software” costs, such as for 
detailed design (engineering studies) or associated training and consultations. 
C2 Operating and 
maintenance costs 
Routine maintenance and operation costs to keep services running (e.g. wages, 
fuel or any other regular purchases). Operating expenditures is the recurrent 
(regular, ongoing) spending to provide WASH goods and services: labour, 
fuel, chemicals, materials, and purchases of any bulk water. Maintenance 
expenditure is the routine expenditure needed to keep systems running at 
design performance, but does not include major repairs or renewals which are 
recognised as not recurrent. 
C3 Large capital 
maintenance costs 
Occasional large maintenance costs for the renewal, replacement and 
rehabilitation of a system that goes beyond routine maintenance to repair and 
replace equipment, in order to keep systems running. These essential 
expenditures are required before failure occurs to maintain service levels and 
need to be planned for. If this cannot be separated out from capital 
expenditure (C1), this should be included with this category of spending and 
explicitly mentioned as such. 
C4 Cost of capital This is estimated based on the cost of borrowing money (interest paid for the 
loan) and the cost of equity (if a return is paid to shareholders). 
C5 Support or software 
costs 
Includes expenditure on direct and indirect support: 
 Expenditure on direct support (ExpDS) includes expenditure on both pre-and 
post-construction support activities directed to local-level 
stakeholders (e.g. training for community or private sector operators, users 
or user groups). 
 Expenditure on indirect support (ExpIDS) includes the cost of planning 
and policy-making at the governmental level, including strengthening the 
skills and capacities of professionals and technicians. These costs have a 
direct impact on the long-term sustainability of projects. 
A number of methodological issues relative to the estimation of such costs can be anticipated at this 
stage, as highlighted below: 
Estimating capital expenditure and large capital maintenance expenditure. Annual flows of capital 
expenditure (and large capital maintenance) are usually estimated based on the service providers’ 
balance sheet. The asset base included in the balance sheet will evolve from one year to the next on 
the basis of new investments (also referred to as “gross capital formation” in the System of National 
Accounts) which would be reflected as an increase in assets) and depreciation of existing assets (also 
referred to as “consumption of fixed capital” in the SNA). 
Based on a service provider’s balance sheet, it is therefore possible to estimate how much the service 
provider has invested every year. In the case of service providers that are providing different types of 
services (such as water and sanitation), in order to allocate such costs by type of service, it would be 
necessary to obtain data on the recent (and planned) investment programme. The allocation by type of 
service could be done based on actual investments (particularly if the utility itself has done such 
allocation) or by using estimated ratios if the utility has not done the allocation itself (i.e. 40% 
investment for water, 60% for sanitation for example). Over time, it would be necessary to aim for as 
much actual allocation as possible. All associated software expenditure, which has been a one-off and 
undertaken specifically to support this hardware investment could be associated with it (such as 
supporting design studies or planning). 
As a note of caution, however, there are a number of reasons for which such “capital investment 
flows” may not be a robust indicator of an actual trend in investment, as discussed in more detail in 
Methodological Note No 5: Estimating fixed asset stocks . As a result, the approach of estimating 
capital investment flows may need to be complemented by an estimation of capital stocks.
The cost of capital will need to be estimated based on financial accounts. Typically, the cost of 
capital is made up of two main elements: financial costs, which correspond to the costs of repaying 
the interest of the debt associated with capital investment (this is the cost of renting the capital and 
can usually be identified separately in financial accounts); and the return on equity capital, which is 
paid out as dividends to shareholders (or other benefits) in the event of profit-making companies. 
Given the potential difficulties in estimating the return on equity capital and the profit element for 
not-for-profit companies, the System of Health Accounts uses different approaches to capture costs 
and expenditure for for-profit and non-profit / government providers, as discussed in the box below. 
Learning from the health sector: distinguishing between for-profit and non-profit/ 
89 
government providers. 
The System of National Accounts (as well as the System of Health Accounts) establishes a 
distinction for evaluating costs of market and non-market providers. In the case of market 
(for-profit) providers, the value of goods and services they produce is estimated based on the 
revenue they receive from the sale of these goods. As a result, this can be done by compiling 
information on the total amount paid for these goods and services at the point of 
consumption. As a result, data valuing their output from the country’s national accounts may 
be very useful for these kinds of providers. 
In the case of non-market (non-profit or government) providers, the value would be estimated 
based on the cost of production, as these goods and services are not necessarily sold or sold 
at a price that reflects the true cost of production. Costs would be typically calculated as the 
actual expenditure on inputs such as staff remuneration (including all benefits) and supplies. 
This would include budgetary expenditures on salaries, supplies, and other inputs. It may also 
include goods and services (such as free electricity) provided to those facilities by other 
government agencies. 
Estimating operating and maintenance expenditure. Operating and minor maintenance expenditure 
can be derived from the income and expenditure statement (profit and loss account) of the service 
providers. In the event of joint service provision (water and sanitation), it will be necessary to allocate 
such costs to these respective services. If the utility does not already do it based on actual costs, 
allocation keys will need to be used, which means that additional information will need to be 
collected, including on the individual cost factors (such as energy, chemicals, spare parts, etc.) and on 
the number of staff per service. 
Using the share of revenues by service as an allocation key is unlikely to be helpful and could 
introduce distortions, as there are frequently cross-subsidies between water and sanitation, which 
means that tariff revenues from sanitation for example may actually be much lower than the actual 
costs generating by those services. When applying a “Cost-based approach”, it would be necessary to 
analyse costs in order to identify what are the actual costs of each service. To do so, it would be 
necessary to rely on recent tariff studies or pre-existing information or to do it only for a small sample 
of utilities, as it can be a time-consuming exercise. 
Estimating support or software costs. Software costs can be included in two main ways: expenditure 
on indirect support (such as for policy development, sector planning, budgeting, etc…) can be 
estimated at a national level. It might be possible to extract those costs directly from the National 
Accounts, as there are categories in the National Accounts that capture information on “support 
services to the water and sanitation sector” (see Table MN 1.4 which contains our recommended 
classification of WASH services). 
Regarding those costs that are directly related to the provision of a particular service, those costs 
might either be elicited based on the costs of NGOs and other support organisations (including
government) that support service delivery or at the level of service providers that have called on such 
NGOs to support the development of their services. Those costs are typically difficult to track, 
however. In the case of NGOs, for example, having access to their costs on a consolidated basis can 
be difficult and they would seldom separate out hardware from software costs. It would therefore be 
recommended to estimate such costs on a sample basis for a representative sample of NGOs. 
MN 4.2. Collecting data on the costs of service provision 
Potential sources of cost data vary depending on which agencies incur those costs. Table MN 4.3. 
below lists potential sources of costs by type of service provider. 
90 
Table MN 4.3 - Gathering data on costs of service provision 
Categories of 
service providers Data sources and collection methods 
P1 Government 
agencies 
 Public expenditure accounts presented to national parliaments 
 National budget 
 Annual budget for each relevant financing unit 
 Supplementary information to determine cost allocation if needed (such as 
number of staff per department, percentage of their time dedicated to a sub-sector) 
P2 Public and private 
utilities 
 Service providers’ annual financial statements (balance sheet and profit and 
loss accounts) 
 Supplementary information to determine cost allocation if needed: 
o Number of staff per department, percentage of their time dedicated to a 
given service 
o Number of customers per service, unit cost of production, average 
investment costs per type of investment 
o Investment programme (realisations by category of investment spending) 
o Activity-based costing reports 
o Any recent tariff study that might have been undertaken to estimate costs of 
production, historically and going forward 
P3 
Small independent 
providers (formal 
and informal) 
 Survey of a sample of small independent providers on their total production 
costs 
P4 
NGOs and 
community-based 
organizations 
 Annual financial statements 
 Detailed costing / cost benchmarks for a number of representative projects 
P5 Households (self-provision) 
 Households survey, 
 Detailed costing / cost benchmarks for typical household investments 
Learning from the health sector: the costs of self-provision of WASH services 
Whereas the actual costs to households will be estimated (such as investment or operating 
costs), free labour provided by households to build latrines for example should not be 
included in consistency with the System of National Accounts, which does not include non-monetary 
contributions (this is also in line with the practice in the System of Health 
Accounts). The value of these activities can be estimated, but it cannot be part of the total 
used for comparison of WASH expenditure with other economic aggregates or for 
international comparisons.
Methodological Note No 5: Estimating fixed asset stocks 
Objectives. This note indicates why it is important to estimate fixed asset stocks for the sector, as well 
as estimating financial flows. It indicates how this would allow linking with existing accounting 
conventions (such as in the System of National Accounts) and highlights potential methodological 
challenges for doing so (and ways to address those). 
MN 5.1. How does estimating fixed asset stocks differ from evaluating 
91 
investment flows? 
Methodological Note No 4: Estimating the costs of providing the service with a “Cost-based 
approach” indicated how to track financing flows to the sector, including investment flows (capital 
expenditure). There are several limitations with tracking investment flows, however: 
 Tracking investment flows can potentially generate misleading results, as investment flows 
typically vary from year to year due to capital programming and realization. For example, if a 
country is building a large asset at a national scale (e.g. a dam or a transmission pipe), capturing 
the nominal value of that investment in each year as the asset is being built would show up as an 
investment peak followed by much lower levels of investment. At a global level, this may be 
interpreted as the country having “deprioritized” investment once this large asset has been built, 
when in fact the asset would be producing benefits and investment needs are subsequently lower. 
 Capturing the entire value of an investment in a given year does not allow differences in the 
asset lives of such investments to be reflected. Following on the example mentioned above, 
taking into account the entire value of a new asset with an asset life of, say, 50 years in the year in 
which such investment is made ignores the fact that such an asset delivers benefits over a long 
period. 
 Some very important investments (e.g. households’ out-of-pocket expenditure for self-supply) 
cannot be tracked in such a way because no data is available on annual investment flows for 
this type of expenditure. What is available is information (mostly from household surveys) on 
service coverage at different points in time (i.e. when the household surveys are conducted) rather 
than annual investment flows. 
To complement tracking investment flows, it can be useful to estimate the value of existing fixed 
asset stocks and track how such value evolves over time. Such a methodology has numerous 
advantages, as follows: 
 It would allow tracking all sources of investment on a comparable basis, thereby overcoming 
the problem of a lack of data on annual capital investment flows for significant investors, such as 
households for on-site sanitation. This was the approach taken by the World Bank-led AICD 
report (Africa Infrastructure Country Diagnostic) when estimating current investments in the 
sector, for example. On the basis of this kind of approach, they found that households are the most 
significant investors in the WASH sector in sub-Saharan Africa. 
 It would allow reflecting whether existing assets are providing a service or not. For example, at 
a subsequent stage of methodological development, it would be possible to exclude from the 
“asset base” the value of assets that are not functioning, bearing in mind that such proportion can 
be significant (for example, several estimates indicate that 50% of all manual hand-pumps in sub- 
Saharan Africa are non-functional at any given time). 
 It would provide a sounder basis for estimating future costs—in particular, the costs of 
attaining the MDGs. For example, the WHO global costing exercise (first produced in 2004 and 
updated in 2012, see (Hutton, 2012)) is currently based on a relatively “crude” estimate of the 
total asset stock by combining JMP figures on coverage with the best available estimates of unit 
costs, based on the service ladder. Based on the value of this stock of assets, the authors apply a 
ratio to derive projected operations and maintenance costs. However, good unit cost values are not
always available at the national level. These estimates would therefore be strengthened if more 
reliable estimates for asset stocks were available. 
 It is in line with the United Nations System of National Accounts, the standard methodology 
used by governments to compile and track information on economic activity. According to the 
UN Statistics Division, statistics bureaux in each country should already be compiling 
information on asset stocks for all economic activities, including for water and sanitation. 
Concepts such as “gross fixed capital formation” and “stocks of fixed assets” are already defined 
in a standard manner in SNA 2008. Table MN 5.1. below summarises the definitions used by the 
SNA and could therefore be referred to or used in the WASH Accounts. 
92 
Table MN 5.1 - Terminology used in SNAs to evaluate changes in capital asset stocks 
Definition 
Consumption of fixed capital 
Cost of the decline in value of the producer's stock of fixed assets as a result 
of physical deterioration, foreseen obsolescence or normal or accidental 
damage in the accounting period. It corresponds to “depreciation” in the 
business management terminology. It should reflect the use of capital as a 
factor of production. It includes the use of buildings, equipment and other 
capital goods such as vehicles. It excludes the rentals paid on the use of 
equipment or buildings, and fees, commissions, royalties, etc., payable under 
licensing arrangements, which are included as the purchase of services. 
Gross fixed capital formation 
Total value of the fixed assets that service providers have acquired during the 
accounting period (less the value of the disposal of these assets) and that are 
used repeatedly or continuously for more than one year in the production of 
services and goods. This is what corresponds to investments made in that year. 
Opening stocks of fixed assets Value of fixed assets at the start of the period (usually an accounting year). 
Closing stocks of fixed assets 
Closing stocks = opening stocks + gross fixed capital formation – 
consumption of fixed capital + other changes in volume of asset + holding 
gains/losses on assets 
Where: 
 Other changes in the volume of the asset are those that are not due to 
transactions, such as changes in classification, discoveries and natural 
disasters. 
 Holding gains/losses on assets are the changes in the price of assets. 
Source: System of National Accounts (2008). 
MN 5.2. Potential methodological challenges with this approach and ways 
to overcome them 
This type of methodology has not been explicitly adopted in previous exercises that have sought to 
track financial flows to the WASH sector, however. 
This is probably due to the fact that there are a number of methodological difficulties with adopting 
a “fixed asset stock” approach, which would require further consideration, including the 
following: 
Existing information on fixed assets is often very poor in the WASH sector, for a number of 
reasons. Few entities have developed a comprehensive and reliable asset register. The ownership of 
the assets is frequently unclear, and there is frequent confusion about who has paid for the assets and 
who effectively owns the assets. If such a methodology was adopted on a large scale, however, it 
could provide added incentives to WASH service providers for improving asset registries, which are 
useful tools for improved asset management. 
Existing information may not always distinguish between water and wastewater. Some utilities 
currently split the valuation of their assets between water and wastewater but this is by no means
universal. Again, the adoption of a more systematic approach to valuing capital stocks could give 
incentives for utilities to split the values of water and wastewater in their balance sheets. 
Most importantly, to obtain comparable capital asset stock values, it would be necessary to agree on 
a common methodology for valuing assets across the sector. There are a number of existing 
methodologies for valuing assets, which can produce very different values, especially if the asset base 
combines assets that have been built at different times. Alternative methodologies for valuing fixed 
asset stocks are presented in the Box below. Different service providers may be using different rules, 
even within the same country. 
93 
Box MN 5.1 - Alternative methodologies for valuing fixed asset stocks 
Valuing assets at their current book value, i.e. as they are recorded in the service providers’ balance sheet. This 
is likely to be the simplest method for asset valuation, at least in the first instance, as these values can be directly 
extracted from companies’ balance sheets. The book value is based on the original expenditure of the asset less 
any depreciation incurred since the asset was purchased plus any capital maintenance expenditure since incurred 
on that asset. Applying this method can lead to distortions, however, as different service providers may use 
different conventions for valuing assets in their balance sheets. Some may value assets at their historical costs 
(adjusted for depreciation and in some case, for inflation), whilst others would have adjusted the value of assets 
based on their replacement value. 
Valuing assets at their historical cost: this methodology estimates how much it cost to build when it was built, 
adjusted for depreciation and inflation. In the case of many utilities, water and sewerage assets have been 
acquired a long time ago, although they are still delivering benefits. Their historical value would therefore be 
very low (as the assets have been or almost been depreciated) despite the fact that they are still providing 
services. Other utilities might have updated the value of assets in their books. 
Valuing assets at their replacement value, also referred to as the Modern Equivalent Asset value. This is 
equivalent to how much it would cost to replace the given asset by its modern equivalent at today’s cost, i.e. by 
an investment using the latest technologies but providing the same level of service. This kind of valuation can 
provide values that are closer to actual values but conducting such a “revaluation” exercise can be complicated, 
costly and time-consuming which means that it is seldom done, unless there is a clear motivation for doing it 
(such as the introduction of private sector participation, which would call for valuing the asset base before 
letting a contract). 
Asset valuation methods vary from one country to another. For example, Ofwat (2005), compared methods for 
valuing capital bases in six different countries for which they were comparing the regulatory systems as a 
whole. In England and Wales, values for capital employed are based on an initial value estimated at the time of 
privatisation in 1989, adjusted for subsequent depreciation and new investment. Companies also report MEA 
values: the estimated cost of assets of equivalent productive capability to satisfy the remaining service potential 
of the asset, less accumulated current cost depreciation. Australian companies report the current replacement 
cost of the asset in a similar way to the companies in England and Wales. 
Source: Ofwat (2005), “International comparison of water and sewerage service”, March 2005. 
The System of National Accounts (2008) also formulates recommendations as to how valuing assets 
and reflect those in the balance sheets, which can be used for reference. 
A few points of caution when valuing assets: 
It would be important to obtain information about who invested in such an asset in the first place. 
If this information is going to be used in order to track financial sources to the sector, it will be 
important to know who financed its construction in the first place. For water utilities, for example, 
investment funds may come from internally generated revenues, government subsidies or 
international transfers.
For investments carried out by households, it will be necessary to formulate a number of 
assumptions. Deriving the value of the capital stock in which households have invested over time can 
be done based on the number of existing facilities multiplied by the unit costs of these facilities, 
minus government subsidies.9 Given the typical lack of information about when the investments have 
been made by households, this is equivalent to valuing household assets based on an MEA approach 
(Modern Equivalent Asset). In order to be consistent, it might therefore be preferable to use an MEA 
approach for all other types of assets as well, although this might be difficult to achieve if no prior 
valuation of assets using this method has been adopted in the country or for the utility. 
MN 5.3. Valuing fixed asset stocks in the testing exercise and next steps 
In conclusion, given the methodological difficulties entailed with estimating fixed asset stocks, the 
testing exercise will need to test the feasibility of alternative methods for estimating fixed asset 
values and potential errors or biases in doing so. Countries that take on the exercise of valuing asset 
stocks will need to state clearly which method has been used for valuing assets and whether this 
method has been used consistently across service providers or asset types. It might be possible to do 
so only on a sample basis. 
Valuing fixed asset stocks may be more complex the first time round (when the initial value of the 
asset base needs to be determined) but would become comparatively easier for subsequent iterations. 
It would require identifying existing assets for each service provider and valuing those assets. It 
would also help with defining reference values for other types of costs, such as operating costs and 
capital maintenance costs, which can be estimated as a percentage of asset values (if no other reliable 
estimate can be gathered at a reasonable cost). 
A next step in the refinement of the methodology could be to adopt a full “Fixed Asset Stock” 
approach for the sector, by tracking not only assets, but also liabilities (i.e. the loans that have been 
provided to finance such assets), so as to derive a value for the net capital stock. Such a “Fixed Asset 
Stock” approach at the sector level is recommended, for example, by the International Monetary Fund 
(2001) in its Government finance statistics manual. 
9 An additional complication is that in national accounts, households are not considered to be “investors”; instead, they 
purchase consumer durables (which would be classified as investments if purchased by an establishment). As a result, for 
households, the consumer durable is recorded as consumed the moment it is purchased. It is therefore important to record the 
purchase of consumer durables by households and estimate the lifetime of the equipment. The treatment of these household 
investments will need to be discussed and agreed with experts in System of National Accounts and statistics. 
94
Methodological Note No 6: Preparing WASH accounts’ tables and 
indicators 
Objectives of this note. This note sets out the proposed tables for the WASH Accounts. A summary list 
of the proposed Tables is presented in Step 3 of the main document. Preparing all these tables would 
enable countries to build a full picture of their WASH sector financing for policy uses (as detailed in 
Section 4.1. Analyse and interpret WASH Accounts data to answer policy questions). This 
Methodological Note contains the structure of the proposed tables together with a justification for 
putting them forward and the list of indicators that can be calculated based on those tables. 
MN 6.1 What are the WASH Accounts tables? 
WASH Accounts tables are a means of displaying information on the consumption, production and 
financing activities for a country’s WASH sector. Reporting the data and estimates in a comparative 
way, using standard tables, allows carrying out comparisons across countries and is thus useful for 
international comparisons. 
The rows and columns of the WASH Accounts are based on the classifications presented elsewhere in 
this methodology, including: 
 Table 1 – Proposed classification of WASH goods and servicess; 
 Table 2 – Definitions: uses of WASH services, WASH sector actors and financing sources; 
 Table MN 4.2 - Proposed classification of costs. 
In addition, some of the proposed WASH Account tables include a breakdown by region or service 
areas, which is why we have included this in the table below, which summarizes all the different types 
of classifications (and labels) used in the WASH Accounts. 
95 
Table MN 6.1 - Classifications used in the WASH Accounts 
Classifications Definition 
WASH services (S) WASH services and products provided by WASH service providers and 
consumed by the users. See Table 1 for more the classification. 
Uses of WASH services (U) Type of use of WASH goods and services. See Table 2. 
WASH providers (P) Actors that are engaged in the production of WASH goods and services. See 
Table 2. 
Financing sources (FS) Where funding originates from before being channelled by financing entities. 
See Table 2. 
Financing units (FU) 
Institutional entities that provide funding to the sector. They mobilise funding 
to pay for WASH services. They may allocate funds directly to service 
providers or channel them through intermediary institutions.. See Table 2. 
Costs (C) Type of costs (or expenditure type) borne by service providers for providing 
WASH services. See Table MN 4.2. 
Service areas (R) Regions where WASH services are provided and consumed. Would vary from 
one country to another. 
WASH Accounts tables are constructed in a way to track the flows of financing between these 
dimensions. The classifications can be applied to WASH costs individually to produce expenditure 
tables for a single dimension (Expenditure by type of WASH uses, service providers, financing 
sources etc.). Additional information can be gained from cross-classifications that use two or more 
dimensions. Many combinations of two and three dimensions tables can be created. The choice of 
tables will depend on their usefulness and the feasibility to construct them. A selection of main two 
dimensions tables is presented in the present methodology.
Recommended common WASH Accounts tables 
Below, we provide additional explanation about each proposed WASH Accounts table and the 
type of information they allow analysing. For ease of reference and to facilitate comparisons, 
each of these tables is referred to with a number and a code indicating which information it 
contains. The convention used is that the labels for the WASH Accounts tables refer first to the row 
classification and then to the column classification. For example, Table WA 1 presenting the 
allocation of WASH expenditure by main WASH service (S) and regional subdivision (R) is referred 
to as the SxR table, with WASH services (S) appearing in rows and regional subdivisions (R) in 
columns. 
Table WA 1 (SxR) - WASH expenditure by main WASH service and regional subdivision. This 
table shows the total expenditure on each main type of WASH service by main geographical areas. To 
respond to country-specific policy needs, countries can choose the level of regional disaggregation 
(i.e. overall, urban/rural, by region etc...) and the level of service disaggregation below the main 
service categories presented in MN1. 
96 
Table WA 1 (SxR) - WASH expenditure by main WASH service and geographical region 
Areas Urban Rural 
R1 R2 R3 R4 
Main WASH 
services millions of currency units Regional sub-division 
1 
Regional sub-division 
2 
Regional Sub-division 
3 
Regional Sub-division 
4 Total 
S1 Water supply services 
S2 Sanitation services 
S3 Support services to the 
WASH sector 
S4 Water resources 
Management 
Total 
Table WA 2 (SxU) -WASH expenditure by type of WASH service and use. This table shows the 
expenditure of financing units on the different type of WASH services and uses. It tells us “who 
consumes what”. This is not done by types of users but rather by types of uses. This table provides a 
summary presentation of the demand for WASH services in the country, i.e. who is consuming what 
type of WASH service. 
Table WA 2 (SxU) - WASH expenditure by type of WASH uses and service 
WASH uses (U) U1 U2 U3 U4 U5 U6 
Main 
WASH 
services 
millions of 
currency units 
Served 
domestic 
use 
Self-provided 
domestic use 
Served 
institutional 
use 
Self-provided 
institutional 
use 
Served 
industrial and 
commercial 
use 
Self-provided 
industrial 
and 
commercial 
use 
Total 
S1 Water supply 
services 
S2 Sanitation services 
S3 Support services to 
the WASH sector 
S4 Water resources 
Management 
Total 
Table WA 3 (SxP) - WASH expenditure by type of WASH service and provider. This table shows 
the expenditure of service providers on the different types of WASH services. It tells us “who
provides what”. This table provides a summary presentation of the WASH supply market in the 
country, i.e. who are the providers involved and how spending to the sector is channelled through 
different providers. It displays the relative importance of each type of provider on the market. 
97 
Table WA 3 (SxP) - WASH expenditure by type of WASH provider and service 
WASH providers P1 P2 P3 P4 P5 
Main 
WASH 
services 
millions of currency 
units 
Government 
agencies 
Network 
corporate 
providers 
Non-network 
corporate 
providers 
NGOs and 
community-based 
organizations 
Households 
(self-provision) 
Total 
S1 Water supply 
services 
S2 Sanitation services 
S3 Support services to 
the WASH sector 
S4 Water resources 
Management 
Total 
Table WA 4 (PxFS) - WASH expenditure by type of WASH provider and financing source. It 
addresses the question “where does the money come from” by presenting the different sources of 
revenue for each type of service provider. It enables to follow the resource flows in the WASH sector, 
from the columns displaying the origin of the funds to the rows displaying the recipients and users of 
these funds. The table also shows the relative importance of each type of revenue stream in financing 
the activity of each type of provider and the sector overall. 
Table WA 4 (PxFS) - WASH expenditure by type of financing source and WASH provider 
Financing sources FS1 FS2 FS3 FS4 FS5 FS6 
WASH 
providers 
millions of 
currency units 
Tariffs for 
services 
provided 
Households’ 
expenditure 
for self-supply 
Domestic 
public 
transfers 
International 
public 
transfers 
Voluntary 
contributions 
Repayable 
financing Total 
P1 Government 
agencies 
P2 
Network 
corporate 
providers 
P3 
Non-network 
corporate 
providers 
P4 
NGOs and 
community-based 
organizations 
P5 Households (self-provision) 
Total 
Table WA 5 (SxFS) - WASH expenditure by type of WASH service and financing source. This 
table shows the financing path to fund the provision of WASH services. It addresses the question 
“who finances what” by presenting the different sources of revenue for each type of WASH service.
This table enables to follow the resource flow to the WASH sector from the columns displaying the 
origin of the funds to the rows displaying the activities on which they are spent. 
98 
Table WA 5 (SxFS)- WASH expenditure by type of financing source and WASH service 
Financing 
sources FS1 FS2 FS3 FS4 FS5 FS6 
Main 
WASH 
services 
millions of 
currency units 
Tariffs for 
services 
provided 
Households’ 
expenditure 
for self-supply 
Domestic 
public 
transfers 
International 
public 
transfers 
Voluntary 
contributions 
Repayable 
financing Total 
S1 Water supply 
services 
S2 Sanitation 
services 
S3 
Support services 
to the WASH 
sector 
S4 Water resources 
Management 
Total 
Table WA 6 (SxFU) - WASH expenditure by WASH service and financing unit. This table (see 
next page) shows how much is spent by each financing unit on which WASH service. It describes 
how overall financing units allocate their resources to the main types of WASH services. It addresses 
the question “who funds what”. 
Table WA 7 (PxFU)- WASH expenditure by WASH provider and financing unit. This table (see 
next page) shows how much is spent by each financing unit on which type of WASH service provider. 
It shows the financing path to fund the provision of WASH services. It addresses the question “who 
funds who”. 
Table WA 8 (FSxFU)- WASH expenditure by financing source and financing unit. This table 
(see next page) shows how overall financing units allocate their financial resources to the sector, i.e. 
through which type of financial sources.
99 
Table WA 6 (SxFU)- WASH expenditure by financing unit and WASH service 
Financing 
Units FU1 FU2 FU3 FU4 FU5 FU6 FU7 FU8 FU9 FU10 
Main 
WASH 
services 
millions of 
currency units 
National 
authorities 
Regional 
authorities 
Local 
authorities 
Network 
corporate 
providers 
Non-network 
corporate 
providers 
Economic 
and quality 
Regulators 
Bilateral and 
multilateral 
donors 
Banks and 
Financial 
Institutions 
NGOs and 
community-based 
organizations 
Households Total 
S1 Water supply 
services 
S2 Sanitation 
services 
S3 
Support 
services to the 
WASH sector 
S4 
Water 
resources 
Management 
Total
100 
Table WA 7 (PxFU)- WASH expenditure by WASH provider and financing unit 
Financing 
Units FU1 FU2 FU3 FU4 FU5 FU6 FU7 FU8 FU9 FU10 
WASH 
providers 
millions of 
currency units 
National 
authorities 
Regional 
authorities 
Local 
authorities 
Network 
corporate 
providers 
Non-network 
corporate 
providers 
Economic 
and quality 
Regulators 
Bilateral 
and 
multilateral 
donors 
Banks and 
Financial 
Institutions 
NGOs and 
community-based 
organizations 
Households Total 
P1 Government 
agencies 
P2 
Network 
corporate 
providers 
P3 
Non-network 
corporate 
providers 
P4 
NGOs and 
community-based 
organizations 
P5 
Households 
(self-provision) 
Total
101 
Table WA 8 (PxFU)- WASH expenditure by financing source and financing unit 
Financing 
Units FU1 FU2 FU3 FU4 FU5 FU6 FU7 FU8 FU9 FU10 
Financing 
Sources 
millions of 
currency units 
National 
authorities 
Regional 
authorities 
Local 
authorities 
Network 
corporate 
providers 
Non-network 
corporate 
providers 
Economic 
and quality 
Regulators 
Bilateral 
and 
multilateral 
donors 
Banks and 
Financial 
Institutions 
NGOs and 
community-based 
organizations 
Households Total 
FS1 
Tariffs for 
services 
provided 
FS2 
Households’ 
expenditure 
for self-supply 
FS3 
Domestic 
public 
transfers 
FS4 
International 
public 
transfers 
FS5 Voluntary 
contributions 
FS6 Repayable 
financing 
Total
Table WA 9 (CxP) - WASH expenditure by type of cost and WASH provider. This table shows 
how different types of providers allocate their resources to cover the different types of costs. It 
answers the question “what type of costs are funded and by whom”. 
102 
Table WA 9 (CxP)- WASH expenditure by type of cost and WASH provider 
WASH 
providers P1 P2 P3 P4 P5 
Cost type millions of 
currency units 
Government 
agencies 
Network 
corporate 
providers 
Non-network 
corporate 
providers 
NGOs and 
community-based 
organizations 
Households 
(self-provision) 
Total 
C1 
Capital costs 
including 
hardware and 
software 
C2 
Operating and 
maintenance 
costs 
C3 
Large capital 
maintenance 
costs 
C4 Cost of capital 
C5 Support or 
software costs 
Total 
Table WA 10 (CxS) - WASH expenditure by type of cost and WASH service. This table shows on 
which type of costs resources are spent to provide each WASH service. 
Table WA 10 (CxS)- WASH expenditure by type of cost and main WASH service 
Main WASH 
services S1 S2 S3 S4 
Cost type millions of currency 
units 
Water supply 
services 
Sanitation 
services 
Support services 
to the WASH 
sector 
Water 
resources 
Management 
Total 
C1 
Capital costs 
including hardware 
and software 
C2 Operating and 
maintenance costs 
C3 Large capital 
maintenance costs 
C4 Cost of capital 
C5 Support or software 
costs 
Total 
Table WA 11 (ASxP) - Asset stocks by type of WASH provider. This table presents the stock of 
assets for each type of WASH provider. This enables to evaluate the stock of assets for the sector as a 
whole, reflecting what has been invested over time by each type of service provider (including 
households for self-service).
103 
Table WA 11 (ASxP)- Fixed asset stocks by type of WASH provider 
WASH providers P1 P2 P3 P4 P5 
Asset 
stocks 
millions of 
currency units 
Government 
agencies 
Network 
corporate 
providers 
Non-network 
corporate 
providers 
NGOs and 
community-based 
organizations 
Households 
(self-provision) 
Total 
AS1 Closing stocks of 
fixed assets 
MN 6.2 What are the WASH Accounts indicators? 
The WASH Accounts indicators are key figures on WASH sector expenditure that can be derived 
directly from the WASH Accounts tables. These indicators are meant to be directly relevant to 
national policy makers and for international reporting. The outcome of the testing will be to agree on 
an international common set of indicators, that countries could complement with their own indicators. 
Due to difficulties with comparing national currency units, it is recommended to use ratios (such as 
ratio of WASH spending to GDP) to the extent possible, rather than currency amounts, in order to 
avoid the distorting impact of exchange rates. However some indicators such as the Total expenditure 
on the WASH sector at the national level and Total expenditure on WASH per capita will be 
presented in currency units. The conversion from local currency amounts into international dollar 
amounts using a current exchange rate or a PPP exchange rate will need to be considered and 
documented. 
Table MN 6.2 below presents the main indicators that can be used depending on the country’s policy 
questions. 
Benchmarking and presenting indicators in context 
Certain indicators would benefit from being presented by comparison with actual levels of 
GDP. For example, the figure that shows the percentage of WASH sector expenditure as a 
percentage of GDP (Figure 9 in the 2010 GLAAS report) does not give an indication of the 
relative sizes of GDP from one country to the next. It would be preferable to chart the 
percentage of WASH expenditure on the x-axis and show GDP per capita on the y-axis. 
This would enable seeing whether there is any type of “GDP impact” on WASH sector 
spending.
104 
Table MN 6.2 - WASH Accounts indicators 
Table (T) Indicator (I) that can be derived 
Table WA 1 (SxR)- WASH expenditure by main WASH service and 
regional subdivision 
Total expenditure on the WASH sector at the national level 
Total expenditure on WASH in the country as share of GDP 
Total expenditure on WASH per capita 
Total expenditure on WASH as a % of total public spending 
Total expenditure on urban and on rural drinking-water as a % of total WASH expenditure 
Total expenditure on urban and on rural sanitation as a % of total WASH expenditure 
Table WA 2 (SxU)- WASH expenditure by type of WASH service and 
use 
Total expenditure per type of service use 
Table WA 3 (SxP)- WASH expenditure by type of WASH service and 
provider 
Total expenditure per type of WASH service 
Total expenditure per type of WASH provider 
Table WA 4 (PxFS)- WASH expenditure by type of WASH provider 
and financing source 
Total expenditure per type of financing source 
Table WA 5 (SxFS)- WASH expenditure by type of WASH service and 
financing source 
Total government domestic transfer expenditure and as a % of WASH expenditure 
Total international transfer expenditure and as a % of WASH expenditure 
Total household expenditure as a % of WASH expenditure 
Table WA 6 (SxFU)- WASH expenditure by WASH service and 
financing unit 
Table WA 7 (PxFU)- WASH expenditure by WASH provider and 
financing unit 
Table WA 8 (FSxFU)- WASH expenditure by financing source and 
financing unit 
Total expenditure channelled through regional and local authorities as a % of WASH public 
expenditure 
Table WA 9 (CxP)- WASH expenditure by type of cost and WASH 
provider 
Table WA 10 (CxS)- WASH expenditure by type of cost and main 
WASH service 
Total capital costs as a % of total WASH expenditure 
Total operating and maintenance costs as a % of total WASH expenditure 
Total large capital maintenance costs as a % of total WASH expenditure 
Capital costs as a % of total water supply expenditure 
Operating and maintenance costs as a % of total water expenditure 
Large capital maintenance costs as a % of total water expenditure 
Capital costs as a % of total sanitation expenditure 
Operating and maintenance costs as a % of total sanitation expenditure 
Large capital maintenance as a % of total sanitation expenditure 
Table WA 11 (ASxP)- Fixed asset stocks by type of WASH provider Total WASH fixed asset stocks per capita
Annex A – Summary of key steps under the methodology 
Objective. This Annex provides a summary of the different steps outlined in this methodology, It will 
provide the basis for preparing the Terms of Reference for conducting the exercise at national level. 
105 
Step 1 – Getting started Summary of tasks to be undertaken 
 Create political buy-in: 
o Identify a country champion to be the national point of contact (POC) 
o Convene a national level stakeholder group to oversee compilation of data and provide 
political support to the project 
 Identify policy questions: 
o Organise an initial kick-off meeting with members of the national level stakeholder group 
o Agree on a list of priority policy questions that the data collected will aim to answer 
 Set up the team in charge of data collection and analysis: 
o Build a strong WASH Accounts team backed up by institutions 
o Identify available data and define a data collection plan 
o Develop a detailed budget and work plan for data collection and analysis 
Step 2 – Collect financial data 
Step 2.1 - Define WASH sector boundaries in terms of services 
 Define a classification of WASH services that will be used for the testing exercise: 
o Identify the classifications and categories of WASH services that are being used in the 
country. 
o Analyse similarities and differences with available international classifications (see Table 
MN1.4): can the same categories be used? Is data collected on this basis in the country? 
o State very clearly which activities are included in the WASH sector definition, preferably by 
reference to international classifications 
o Collect data according to these categories if possible or based on aggregate categories (e.g. 
water supply services, sanitation services, construction services, support services) 
 Provide feedback on the following questions: 
o Is the proposed list (see Table MN1.4.) usable and useful in your country to define sector 
boundaries? 
o What would be the ideal level of aggregation of data that would answer policy questions and 
be easily collected at the same time? 
o Can WASH data based on international classifications be found in your country? 
o Would it be necessary, in your opinion, to refine existing classifications in order to better 
match WASH sector needs? 
Step 2.2 - Identify the main WASH sector actors, map service provision and financial flows 
 Identify and classify WASH actors, financing sources and uses of WASH services 
o On the basis of data already gathered in Step 1.3.2, identify the classifications of WASH 
actors, financing sources and uses that are being used at country level 
o Analyse similarities and differences with the proposed classifications: can some categories 
be used? Can collected data fit into the proposed classifications? 
o State clearly the classifications of WASH actors, financing sources and uses that will be 
used 
o Organise actors and financing sources into categories using the proposed classification. 
 Map out the financing of the WASH sector (actors and financing flows schematised by 
categories) 
o Represent the WASH sector actors and financing sources for each of the four sub-sectors (if 
necessary, i.e. if there are substantial differences between them) 
 Provide feedback on the methodology:
o Assess if the proposed global classification covers all identified actors and financing sources 
at country level and whether it needs to be modified to better adjust to the country’s context. 
o Indicate whether a common classification of WASH actors, financing sources and uses is 
106 
useful 
o Report on any difficulties encountered in carrying out the exercise and ways to address 
them. 
Step 2.3 - Estimate financial flows and capital assets stocks 
 Identify data required to answer policy questions set out in Step 1.2. 
 Identify whether the National Statistics Office already collects data on financing to WASH and if 
so, understand their methodology for doing so; 
 For financing flows, gather financing data at source, starting with the approach that allows 
generating the most comprehensive data set (i.e. either “Financing Source Approach” or “Cost-based 
Approach”): 
 For financing flows, define a time period over which to gather information (2-3 years); 
 Note that both approaches will need to be applied in parallel as they provide complementary 
information, particularly needed to allocate costs to types of services; 
 Gather data on capital assets using the “Fixed Asset Stock Approach” 
 Collect the data and create a WASH Accounts database: 
o Define the structure of the database and the data-records so that it can be maintained on 
an ongoing basis; 
o Decide which data to acquire; 
o Enter existing data into the database; 
o Allocate WASH Accounts classification codes to all data entries; 
o Identify data gaps and undertake further analysis / surveys to plug in data gaps; and 
o Prepare the WASH- Accounts tables. 
 Reconcile the data, identify gaps in the information and recommend (and conduct) any 
supplementary primary data gathering (such as additional surveys). 
 Provide feedback on methodological issues: 
o Appropriateness of the categories of costs proposed 
o Identify a list of costs and financing sources that are difficult to value and will require 
additional methodological development 
o Appropriateness of using a Fixed Asset Stock approach 
o When using a Fixed Asset Stock approach: on methods for asset valuation and on whether 
to deal with liabilities alongside assets 
Step 3 - Analyse financial data 
 Identify the tables and indicators from the list presented in this guidance document, based on 
which are most relevant to answer the country’s policy questions; 
 Undertake background calculation and compile the WASH Accounts Tables; 
 Calculate the WASH Accounts indicators; 
 Document the compilation process; 
 Verify the coherence of the tables; 
 Provide feedback on the use of suggested tables. 
Step 4 - Interpret and disseminate findings 
 Analyse and interpret WASH Accounts data to answer policy questions 
 Disseminate the WASH Accounts findings by communicating on the indicators, presenting the 
main results and findings of WASH Accounts in a summary report (including key WASH 
Accounts tables) 
 Write short policy briefs for decision makers focused on a specific policy question 
 Provide feedback on ways to disseminate findings
Step 5 - Provide feedback on methodological development 
 Produce a synthetic report evaluating your experience using this guidance document; 
 Produce a synthesis report evaluating your experience using this guidance document; 
 Assess and comment upon the appropriateness of the proposed classifications to define the 
107 
WASH sector and the way it is financed; 
 Assess and comment upon the feasibility to collect such data in the country; 
 Assess the methodology proposed to value the financing flows and capital stocks; 
 Suggest modifications to improve both the classifications and the methodology; 
 Provide feedback on the overall process from an organisational point of view and give indications 
about the cost and resource requirements of the exercise
Annex B – The System of Environmental Economic Accounting for 
Water (SEEA‐Water): a brief introduction 
108 
1. Objectives of SEEA‐Water 
SEEA-Water (United Nations Statistics Division, 2012) is the conceptual framework prepared by the 
United Nations Statistics Division to organize hydrological and economic information in a coherent 
and consistent manner. 
SEEA-Water was developed with the objectives of standardizing concepts and methods in water 
accounting. The advantage of the SEEA-Water approach is that it provides a tool to integrate 
hydrological and economic information in support of environmental-economic analysis, thus 
overcoming the tendency to divide issues along disciplinary lines. SEEA-Water is potentially an 
important tool for policy-makers, as it provides them with indicators to monitor the interaction 
between the environment and the economy, with a database for strategic planning and policy analysis 
to identify sustainable development paths and appropriate policy instruments for implementing them. 
In 2010 the International Recommendations for Water Statistics (United Nations Statistics Division, 
2012) were adopted to assist countries in the implementation of SEEA-Water. SEEA-Water has been 
divided into four areas of policy application presented in Figure A.1. in order to prioritise its 
implementation in countries according to policy demand. WASH Accounts are linked to the first 
quadrant “Improving drinking and sanitation services.” 
Figure A.1 - The WASH Accounts in relation to the overall System of National Accounts 
The SEEA-Water framework comprises the five categories of accounts: 
 Category 1: Physical supply and use tables describing the flows of water from the environment 
within the economy and back to the environment; 
 Category 2: Emission accounts describing the amounts of pollutants added to water as a result of 
production and consumption; 
 Category 3: Hybrid and economic accounts linking the physical accounts with the monetary 
information of the national accounts, disaggregated for water and sanitation; 
 Category 4: Water asset accounts;
 Category 5: Quality accounts describing the quality of water and the changes in quality; these 
109 
accounts are still experimental. 
Of these, category 3 (hybrid and economic accounts) is particularly interesting in terms of tracking 
national financial flows to water and sanitation services. This category of accounts aligns physical 
information with monetary information on supply and use. These accounts are referred to as 
“hybrid” because they combine different types of measurement units. In these accounts, physical 
quantities can be compared with the matching economic flows. This category of accounts includes 
information on the costs associated with water use and supply, such as water abstraction, purification, 
distribution and wastewater treatment. It also provides information on financing - for example, the 
amount users pay for the services of wastewater treatment, and the extent to which these services are 
subsidized by the government and other units. These accounts can help governments take decisions in 
terms of cost recovery policies and water allocation policies and can be used in economic models to 
evaluate potential costs and benefits of putting in place new infrastructure. 
Hybrid and economic accounts describe in monetary terms the use and supply of water-related 
products to identify: 
1. the costs associated with the production of these products; 
2. the income generated by their production; 
3. the investment in water-related infrastructure and the costs to maintain them ; 
4. the fees paid by the users for water-related services as well as the subsidies received. 
2. SEEA‐Water tables purpose and content 
Hybrid and economic accounts are composed of three types of tables: 
1. The Hybrid Supply and Use Tables, consolidated in the Hybrid Account for Supply and Use 
of Water; 
2. The Economic Accounts that expand the “hybrid accounts” for (a) water‐related activities 
carried out for own use (Hybrid Accounts for water supply and sewerage for Own Use) and 
(b) government expenditures for water‐related services (Government Accounts for water-related 
collective consumption services); 
3. The National Expenditure Accounts and Financing Accounts for water-related activities 
classified by purpose. 
Figure A.1 summarises the tables and data that comprises SEEA-Water. 
Table A.1 - Summary of SEEA-Water Accounts 
Tables Information Water Sanitation W&S 
Hybrid supply Table 
Water and sewerage services output of 
(HST) 
industries by ISIC categories x 
Hybrid Use Table 
(HUT) 
Water and sewerage services use and 
consumption by type of users (intermediate and 
final) 
x 
Hybrid Account for 
Supply and Use of 
Water (HASU) 
Output and consumption (intermediary and 
final) of water and sewerage services, by type of 
producers (ISIC) and users (industries, 
households and the government). 
x
110 
Hybrid Accounts for 
water supply and 
sewerage for Own 
Use (HAOU) 
Costs of production of water and sewerage 
supply for own use, for ISIC industries and 
household x 
Government 
Accounts for water-related 
collective 
consumption services 
(GA) 
Costs of production of government water-related 
collective consumption services (by COFOG 
categories) x 
National Expenditure 
Accounts (NEA) 
Expenditure for use of water and sewerage 
services by type of users and beneficiaries (2 
tables) 
Financing Accounts 
(FA) 
Expenditure by financing sectors bearing the 
costs of the water and sewerage services 
consumed by type of users (2 tables) 
a. The supply and use hybrid accounts 
x x 
x x 
The Hybrid Account for Supply and Use of Water juxtapose the standard System of National 
Accounts (SNA) supply and use tables with the corresponding physical tables describing the 
volumes of supplied and used water. 
The Hybrid Account for Supply and Use of Water presented in Table A.2. provides information on 
the output and consumption of water and sewerage services produced by ISIC categories of 
industries. ISIC class 36 and 37 corresponding to the suppliers of water and sewerage services are 
particularly relevant for supply. The account presents data on water-related output, the intermediate 
consumption and use of water and sewerage services, including their costs of purchase, and the total 
value added produced by these industries. Output and consumption are estimated at purchaser’s price. 
It provides also information on gross fixed capital formation for water-related infrastructure by 
industry, which represents the investments in fixed capital related to water (infrastructures). It finally 
shows the closing stocks of fixed assets for water supply and sanitation (e.g. pumps and dams). They 
represent the total value of infrastructure in place and are distinguished between water supply and 
wastewater services assets.
111 
Table A.2 - Hybrid account for supply and use of water 
Source: (United Nations Statistics Division, 2012) 
b. Further disaggregation of hybrid accounts 
To provide a complete picture of the economy of water, the hybrid account is expanded into two 
additional tables: (a) water-related activities carried out for own use and (b) government 
expenditures for water-related services. These activities are not identified explicitly in the SNA and 
their costs are incorporated into those of the principal activity of the entity (industry, household or 
government). The SEEA-Water identifies them to better assess how much is spent by each economic 
activity for the provision of water and sanitation services. 
The “Hybrid Account for water supply and sewerage carried out for Own Use” presented in Table 
A.3. identifies the intermediate costs and outputs of activities carried out by household and 
industries for their own use. Costs are categorised by type of activities (water and sewerage services). 
Since reliable market prices do not generally exist for these activities, the value of the output of these 
activities is by convention equal to the costs of production, that is the sum of intermediate 
consumption, compensation of employees, consumption of fixed capital and other taxes (less 
subsidies) on production.
112 
Table A.3 - Hybrid Account for water supply and sewerage carried out for Own Use 
Source: (United Nations Statistics Division, 2012) 
The Government Accounts for water-related collective consumption services presented in Table 
A.4. identifies governmental expenditures according to the Classification of the Functions of 
Government (COFOG). It classifies expenditures of the government by type of expenditure according 
to the function that the transaction serves. The following functions classified in COFOG are relevant 
for water: 
 Wastewater management 
 Soil and groundwater protection 
 Environmental protection not elsewhere classified (related to water) 
 Water supply 
COFOG categories refer to collective services of the government. The collective consumption 
services are assumed to be produced and used by the government. The value of these activities is 
equal to the costs of their production, namely, the sum of intermediate consumption, compensation of 
employees, consumption of fixed capital and other taxes less subsidies on production. These accounts 
can be further disaggregated for central, state and local governments.
113 
Table A.4 - Government accounts for water-related collective consumption services 
Source: (United Nations Statistics Division, 2012) 
c. The National Expenditure and Financing Accounts for water‐related 
activities classified by purpose 
These accounts are compiled for water-related activities of the Classification of Environmental 
Protection Activities and Expenditure) (CEPA), namely wastewater management and water 
management and exploitation. For each of these two activities, the expenditure is allocated by 
beneficiaries: “producers”, “final consumers” (households and governments) and “rest of the world”. 
Producers are further disaggregated into “specialised producers” and “other producers”. Specialized 
producers are defined as those that carry out an environmental protection activity as their principal 
activity. “Other producers” are those that use environmental protection services (including the use of 
such services for own use) and connected and adapted products for their intermediate consumption, 
invest in the production of environmental protection services for own use and receive specific 
transfers for environmental protection. 
The National Expenditure Accounts disaggregate the expenditure of resident units and financed by 
resident units by type of costs. Table A.5. presents the standard National Expenditure Account for 
wastewater management. The elements of costs are disaggregated in: 
 Use of services by resident unit (except “specialized producers” to avoid double-counting); 
 Use of “adapted and connected products”10 for intermediate and final consumption; 
 Gross capital formation for producing the services; 
 Specific transfers received to contribute to the financing of environmental protection. 
The sum corresponds to the total domestic use of the services. 
10 In the case of wastewater management, adapted products include, for example, phosphate-free washing 
products and highly biodegradable products. Connected products include, for example, septic tanks, biological 
activators of septic tanks and services for collecting septic tank sludge.
114 
Table A.5 - National Expenditure Account for wastewater management (billions of currency units) 
Source: (United Nations Statistics Division, 2012) 
The Financing Account presents how national expenditures on water and wastewater management 
is financed by identifying the financing sector (sector providing the financing) and the 
beneficiaries (the units benefiting from the financing) as well as the amount being financed. Table 
A.6. presents the standard Financing Accounts for waste water management. Financing units are 
classified according to the institutional sectors of national accounts (general government, which can 
be further disaggregated under central and local government, non-profit institutions serving 
households, corporations and households). Entries in the column describe how the expenditures are 
financed. 
Table A.6 - Financing Account for waste water management (millions of currency units) 
Source: (United Nations Statistics Division, 2012) 
Table A.7 provides information on the classification of financing sectors of SEEA-Water used in the 
Financing Accounts and the type of funding included in each category.
115 
Table A.7 - Classification of financing sectors used in the SEEA-Water Financing Accounts 
SEEA-Water classification of 
Financing sectors 
Type of funding included in the SEEA-Water Financing 
Accounts 
General Government (central and 
local government) 
- Subsidies to producers : specific transfers, investment 
grants (that are not earmarked taxes) 
- Transfers to government agencies 
- Social transfer in kind to households 
Not-for-profit institutions serving 
households 
- Social transfer in kind to households 
Corporations - Own funds to finance their production and capital formation 
- Subsidies to other producers 
- Tariff paid as users to utilities 
- Earmarked taxes from corporations 
Households - Tariff paid by users (Households) to utilities 
- Household out-of-pocket expenditure for self-supply 
- Earmarked taxes from households 
Rest of the world - International cooperation funds 
- Other flows received from the rest of the world (not 
specified)
116 
Annex C ‐ Glossary 
Note that terms which appear in Italics are defined elsewhere in the glossary. 
Term Definition Source 
Bond A method of borrowing used by private companies, 
governments or municipalities consisting of the issue of 
fixed interest securities, repayable in a specified date. 
Certain government bonds have no fixed redemption date, 
and can be sold at their prevailing market price. 
Small Scale 
Finance for 
Water and 
Sanitation 
(Trémolet, 
2012) 
Capital expenditure (CapEx), 
including hardware and 
software 
Initial costs of putting new services into place, including 
“hardware” such as pipes, toilets and pumps and one-off 
“software” costs such as associated training and 
consultations. 
WASHCost 
Capital maintenance 
expenditure (CapManEx) 
Occasional large maintenance costs for the renewal, 
replacement and rehabilitation of a system that goes beyond 
routine maintenance to repair and replace equipment, in 
order to keep systems running. These essential expenditures 
are required before failure occurs to maintain service levels 
and need to be planned for. 
WASHCost 
Closing stocks of fixed assets Closing stocks = opening stocks + gross fixed capital 
formation – consumption of fixed capital + other changes in 
volume of asset + holding gains/losses on assets 
Where: 
 Other changes in the volume of the asset are those that 
are not due to transactions, such as changes in 
classification, discoveries and natural disasters. 
 Holding gains/losses on assets are the changes in the 
price of assets. 
SNA (SNA 
2008) 
Commercial loan A loan extended by commercial banks or development 
finance agencies at commercial rates, i.e. interest rates that 
reflect market conditions. 
Compensation of human 
resources (employees and self-employed 
professional 
remuneration) 
Total remuneration paid by an enterprise to an employee in 
return for work performed during the accounting period. It 
includes wages and salaries and all forms of social benefits, 
payments for overtime or night work, bonuses, allowances, 
as well as the value of in-kind payments such as the 
provision of uniforms for medical staff. This category also 
includes the remuneration of the income of non-salaried 
self-employed professionals. 
SNA (SNA 
2008) 
Concessionary loan (or ‘soft 
loan’) 
A loan provided on concessionary lending terms, which may 
include a lower interest rate than the market rate, a longer 
repayment period or a grace period. 
Small Scale 
Finance for 
Water and 
Sanitation 
Consumption of fixed capital Cost of the decline in value of the producer's stock of fixed 
assets as a result of physical deterioration, foreseen 
obsolescence or normal or accidental damage in the 
accounting period. It corresponds to “depreciation” in the 
SNA (SNA 
2008)
117 
Term Definition Source 
business management terminology. It should reflect the use 
of capital as a factor of production. It includes the use of 
buildings, equipment and other capital goods such as 
vehicles. It excludes the rentals paid on the use of 
equipment or buildings, and fees, commissions, royalties, 
etc., payable under licensing arrangements, which are 
included as the purchase of services. 
Domestic public transfers Public transfers from government agencies (central or local 
government) to WASH actors. These are often subsidies that 
come from taxes or other sources of revenues of the 
government. These are referred to as “taxes” in the OECD 
3T terminology. 
WASH 
Accounts 
Equity investments A form of finance in which investors take an ‘equity stake’, 
which means that they purchase shares in an entity. This 
enables them to share the risk of that entity (through 
fluctuations in the share price) in return for the prospect of 
sharing its profits (through dividend payments). The higher 
the investment risk, the higher the expected level of return. 
Small Scale 
Finance for 
Water and 
Sanitation 
Factors of production Factor inputs used by providers to produce the goods 
and services consumed or the activities conducted in the 
system. Are included: 
 the costs of production (intermediary consumption + 
gross valued added + Compensation of human 
resources + Other taxes less subsidies on production + 
Consumption of fixed capital); 
 Gross fixed capital formation; 
 Changes in the stock of assets. 
SNA (SNA 
2008) 
Financing Act of providing funding 
Financing sources Where funding originates from before being channelled by 
financing units. The OECD 3T typology refers to financing 
sources as tariffs, taxes and transfers, to which must be 
added private repayable financing. We are proposing that 
the WASH Accounts classify financing sources as: Tariffs 
for services provided, Household out-of-pocket expenditure 
for self-supply, Domestic public transfers, International 
public transfers, Voluntary transfers, Private repayable 
financing. 
WASH 
Accounts 
Financing units Institutional entities that provide funding to the sector. They 
mobilise funding to pay for WASH services. They may 
allocate funds directly to service providers or channel them 
through intermediary institutions. 
WASH 
Accounts 
Funding Monetary value of the funds provided to support a given 
activity. 
Households’ out-of-pocket 
expenditure for self-supply 
Funding provided by households to invest in or provide the 
service themselves. This can be in form of cash, material or 
time (sometimes referred to as “sweat equity”). This would 
form part of tariffs as per the OECD 3T terminology. 
WASH 
Accounts 
Grant A form of development aid without repayment obligations. 
Grants might be untied or carry explicit or implied political 
and commercial obligations. Grants are usually provided by 
Small Scale 
Finance for 
Water and
118 
Term Definition Source 
IFIs, governments, foundations and specific funds with 
different policies, procedures and technical products. A 
grant can be blended with other kinds of finance to produce 
a suitable financing package for a particular project. 
Sanitation 
Gross Domestic Product GDP derives from the concept of value added. Gross value added 
is the difference between output and intermediate consumption. 
GDP is the sum of gross value added of all resident producer units 
plus that part (possibly the total) of taxes on products, less 
subsidies on products, that is not included in the valuation of 
output. Next, GDP is also equal to the sum of the final uses of 
goods and services (all uses except intermediate consumption) 
measured at purchasers’ prices, less the value of imports of goods 
and services. Finally, GDP is also equal to the sum of primary 
incomes distributed by resident producer units. 
SNA 2008 
2.138 (SNA 
2008) 
Gross fixed capital formation Total value of the fixed assets that service providers have 
acquired during the accounting period (less the value of the 
disposal of assets) and that are used repeatedly or 
continuously for more than one year in the production of 
services and goods. 
SNA (SNA 
2008) 
Gross valued added Gross value added = output – intermediate consumption 
Gross value added is a measure of the contribution to GDP 
made by an individual producer, industry or sector. It is the 
value of output less the value of the goods and services, 
excluding fixed assets, consumed as inputs by a process of 
production (intermediate consumption). 
Once the value added has been generated, it can be 
decomposed in the primary factors for generation of income, 
according to the following formula: 
(Gross) value added = (gross) operating surplus + 
compensation of employees + taxes – subsidies 
SNA (SNA 
2008) 
Guarantees A contract by a third party (C) to underwrite a financial 
commitment entered into by two parties (A and B). 
Guarantees can be used by national governments to reduce 
the risks of borrowing and bond issues by their sub-sovereign 
bodies and by international agencies to increase 
the creditworthiness of developing country institutions and 
support specific projects within them. 
Small Scale 
Finance for 
Water and 
Sanitation 
Intermediate consumption 
(materials and services used) 
Total value of goods and services used for the provision of 
goods and services (not produced in-house) bought in from 
other providers and other industries of the economy. All the 
materials and services are to be fully consumed during the 
production activity period. 
SNA 2008 
6.123 (SNA 
2008) 
International public transfers Funds from public donors and multilateral agencies that 
come from other countries. These funds can be contributed 
either in the form of grants, concessionary loans (i.e. 
through the grant element included in a concessionary loan) 
or guarantees. This category is included in the OECD 3T 
typology as “transfers”. Official Development Assistance 
constitutes a subset of international public transfers as it 
only captures funding originating from countries that are 
part of the OECD Development Assistance Committee. 
WASH 
Accounts
119 
Term Definition Source 
Microfinance institutions Refers to schemes for extending credit, savings, insurance, 
money transfers and other financial products to small 
business, farmers and other low-income borrowers who 
cannot get access to normal bank loans. 
Small Scale 
Finance for 
Water and 
Sanitation 
Net value added Net value added = Gross valued added – consumption of 
fixed capital = output – intermediate consumption – 
consumption of fixed capital 
Net value added is obtained from Gross value added less the 
Consumption of fixed capital that occurs when the reduction 
in the value of the fixed assets used in production during the 
accounting period results from physical deterioration, 
normal obsolescence or normal accidental damage. 
SNA (SNA 
2008) 
Official Development 
Assistance (ODA) 
Grants or loans to countries and territories on the DAC List 
of ODA Recipients (developing countries) and to 
multilateral agencies which are: (a) undertaken by the 
official sector; (b) with promotion of economic development 
and welfare as the main objective; (c) at concessional 
financial terms (if a loan, having a grant element of at least 
25 per cent). The OECD DAC database at present only 
tracks ODA flows from OECD member countries but is 
looking to develop coverage of other non-OECD donors. 
OECD 
Operating and maintenance 
expenditure 
Routine maintenance and operation costs to keep services 
running (e.g. wages, fuel or any other regular purchases). 
Operating expenditures is the recurrent (regular, ongoing) 
spending to provide WASH goods and services: labour, 
fuel, chemicals, materials, and purchases of any bulk water. 
Maintenance expenditure is the routine expenditure needed 
to keep systems running at design performance, but does not 
include major repairs or renewals which are recognised as 
not recurrent. 
WASHCost 
Private repayable financing Refers to sources of finance that come from private sources 
and ultimately need to be repaid, such as loans, equity 
investments or other financial instruments such as bonds. 
WASH 
Accounts 
Service providers Actors that are engaged in the production of WASH goods 
and services. 
WASH 
Accounts 
Software cost Cost of software activities associated with infrastructure 
development, such as for project preparation, capacity 
building, training, community mobilization and behavioural 
change activities 
Subsidies A subsidy is a grant given generally by the government to 
economic actors in various forms, such as a cash transfer, a 
tax reduction or inputs at lower prices (such as free land). A 
subsidy can be given to economic actors as an incentive to 
deliver goods and/ or services that benefit society. A 
subsidy can also be provided to households below the 
poverty line to enable them to access basic goods and 
Small Scale 
Finance for 
Water and 
Sanitation
120 
Term Definition Source 
services. Subsidies are sometimes provided to support utility 
infrastructure projects and may include ‘hardware subsidies’ 
(to reduce the initial capital investment costs), ‘operating 
subsidies’ (to cover losses incurred during service 
operation) or ‘software subsidies’ (to cover the software 
costs associated with the infrastructure development, such 
as for project preparation, capacity building and training). A 
hidden form of public subsidy may consist of making an 
equity investment with no expectation of a repayment or a 
return. 
Support or software costs Includes expenditure on direct and indirect support. 
Expenditure on direct support (ExpDS) includes expenditure 
on both pre- and post-construction support activities 
directed to local-level stakeholders (e.g. training for 
community or private sector operators, users or user 
groups). 
Expenditure on indirect support (ExpIDS) includes the cost 
of planning and policy-making at the governmental level, 
including strengthening the skills and capacities of 
professionals and technicians. These costs have a direct 
impact on the long-term sustainability of projects. 
WASHCost 
Tariffs Funds contributed by users of WASH services for obtaining 
the services. In the OECD 3T typology, tariffs include two 
types of funding: 
 Tariffs for services provided 
 Households’ out-of-pocket expenditure for self-supply 
The WASH Accounts terminology proposes to separate out 
these two types of funds to avoid confusion. 
OECD 3T 
typology 
(OECD, 2009) 
Tariffs for services provided Payments made by users to service providers for getting 
access to and for using the service. 
WASH 
Accounts 
Taxes Funds originating from domestic taxes which are channelled 
to the sector via transfers from all levels of government, 
including national, regional or local. Such funds would 
typically be provided as subsidies, for capital investment or 
operations. “Hidden” forms of subsidies may include tax 
rebates, concessionary loans (i.e. at a subsidised interest 
rate) or subsidised services (such as subsidised electricity). 
OECD 3T 
typology 
(OECD, 2009) 
Transfers Funds from international donors and international charitable 
foundations (including NGOs, decentralized cooperation or 
local civil society organizations) that typically come from 
other countries. These funds can be contributed either in the 
form of grants, concessionary loans (i.e. through the grant 
element included in a concessionary loan, in the form of a 
subsidised interest rate or a grace period) or guarantees. 
The WASH Accounts terminology proposes to separate 
international public transfers and voluntary transfers to 
avoid confusion. 
OECD 3T 
typology 
(OECD, 2009) 
Voluntary transfers Funds from international and national non-governmental 
donors including from charitable foundations, Non-
121 
Term Definition Source 
Governmental Organizations (NGOs) and civil society 
organizations. These funds can be contributed either in the 
form of grants, concessionary loans (i.e. through the grant 
element included in a concessionary loan, in the form of a 
subsidised interest rate or a grace period) or guarantees.
Annex D - References 
Partners for Health Reformplus. (2002). Using NHA to Inform the Policy Process- NHA Global Policy 
Brief. Bethesda, MD: Abt Associates Inc. 
AMCOW, EUWI, UNDP. (2006). Getting Africa on track to meet the MDGs on water and sanitation 
- A status overview of sixteen African countries. AMCOW. 
Barnett, C., & al. (2001). The Application of National Health Accounts Framework to HIV/AIDS in 
Rwanda. Special Initiatives Report No. 31. Bethesda, MD: Partnerships for Health Reform Project, 
Abt Associates Inc. 
De, S., & al. (2003). Has Improved Availability of Health Expenditure Data Contributed to Evidence- 
Based Policymaking? Country Experiences with National Health Accounts. 
Health Systems 20/20. (2011). Mali NHA policy Impact. Health Systems 20/20. 
Hernandez, P. (2012). Health Accounts : a review of 20 years of experience, Presentation for the 2012 
Stockholm World Water Week. 
Maeda, A., & al. (2012). Creating Evidence for Better Health Financing Decisions: A Strategic Guide 
for the Institutionalization of National Health Accounts. The World Bank. 
McIntyre, D., & al. (1995). Health Expenditure and Finance in South Africa. South Africa: Health 
Systems Trust and the World Bank. 
OECD. (2011). A System of Health Accounts. Paris: OECD Publications. 
OECD. (2011). Benefits of Investing in Water and Sanitation: An OECD perspective. Paris: OECD 
Publishing. 
OECD. (2010). Innovative financing mechanisms for the water sector. Paris: OECD Publications. 
OECD. (2009). Managing Water for All - An OECD perspective on pricing and financing. Paris: 
OECD Publications. 
SNA 2008. (2009). System of National Accounts 2008. New York: United Nations. 
Snehalatha, M., & al. (2011). Looking Beyond Capital Costs - Life Cycle Costing for Sustainable 
Service Delivery -A Study from Andhra Pradesh, India. Hyderabad: WASHCost (India) Project, 
Center for economics and social studies. 
The World Bank . (2010). Harnessing National Health Accounts to Strengthen Policymaking - 
Compendium of Case Studies. Washington, DC: The World Bank. 
Trémolet. (2012). Small-scale finance for water and sanitation. Stockholm: EU Water Initiative and 
Share. 
Trémolet, S., & Binder, D. (2010). Evaluating the effectiveness of public finance for household 
sanitation in Dar Es Salaam, Tanzania. 
122
Trémolet, S., & Rama, M. (2012). Tracking national financial flows into sanitation, hygiene and 
drinking water. Geneva: WHO. 
United Nations Statistics Division. (2012). International recommendations for water statistics . New- 
York: United Nations Publications. 
United Nations Statistics Division. (2012). System of Environmental-Economic Accounting for Water. 
New-York: United Nations Publications. 
WHO. (2012). UN-water global annual assessment of sanitation and drinking-water (GLAAS) 2012 
report. Geneva: WHO . 
Winpenny, J. (2003). Financing water for all. World Water Council, Secretariat of the 3rd World 
Water Forum and Global water Partnership. 
123 
Relevant websites 
National Health Accounts 
http://www.who.int/nha/en/ 
UN Statistics Division – International classifications registry 
http://unstats.un.org/unsd/cr/registry/regct.asp?Lg=1 
SEEA-Water 
http://unstats.un.org/unsd/envaccounting/seeaw/

TrackFin Draft Guidance Document (version January 2014)

  • 1.
    UN-Water Global Analysisand Assessment of Sanitation and Drinking-Water UN-Water GLAAS TrackFin Initiative Tracking financing to sanitation, hygiene and drinking-water at national level WHO/ FWC/WSH/ 14.02 January 2014
  • 2.
    1 © WorldHealth Organization 2014 All rights reserved. Publications of the World Health Organization are available on the WHO web site (http://www.who.int) or can be purchased from WHO Press, World Health Organization, 20 Avenue Appia, 1211 Geneva 27, Switzerland (tel.: +41 22 791 3264; fax: +41 22 791 4857; e-mail: bookorders@who.int). Requests for permission to reproduce or translate WHO publications – whether for sale or for noncommercial distribution – should be addressed to WHO Press through the WHO web site (http://www.who.int/about/licensing/copyright_form/en/index.html). The designations employed and the presentation of the material in this publication do not imply the expression of any opinion whatsoever on the part of the World Health Organization concerning the legal status of any country, territory, city or area or of its authorities, or concerning the delimitation of its frontiers or boundaries. Dotted lines on maps represent approximate border lines for which there may not yet be full agreement. The mention of specific companies or of certain manufacturers’ products does not imply that they are endorsed or recommended by the World Health Organization in preference to others of a similar nature that are not mentioned. Errors and omissions excepted, the names of proprietary products are distinguished by initial capital letters. All reasonable precautions have been taken by the World Health Organization to verify the information contained in this publication. However, the published material is being distributed without warranty of any kind, either expressed or implied. The responsibility for the interpretation and use of the material lies with the reader. In no event shall the World Health Organization be liable for damages arising from its use. The named authors alone are responsible for the views expressed in this publication. Printed by the WHO Document Production Services, Geneva, Switzerland
  • 3.
    Table of Contents Table of Contents .................................................................................................................................... 2 List of Figures ......................................................................................................................................... 3 List of Boxes ........................................................................................................................................... 3 List of Tables .......................................................................................................................................... 4 Acknowledgements ................................................................................................................................. 5 Objectives and planning of the testing exercise ...................................................................................... 5 List of acronyms and abbreviations ........................................................................................................ 6 Introduction ............................................................................................................................................. 7 Overview ............................................................................................................................................. 7 Structure of the guidance document .................................................................................................. 11 1 Step 1 – Getting started .................................................................................................................. 13 1.1 Create political buy-in ............................................................................................................. 13 1.2 Identify policy questions ......................................................................................................... 14 1.3 Set-up the team in charge of data collection and analysis ....................................................... 15 1.3.1 Build a strong WASH Accounts team backed up by institutions ..................................... 15 1.3.2 Identify available data and define a data collection plan .................................................. 15 1.3.3 Develop a detailed budget and work plan ......................................................................... 17 2 Step 2 – Collect financial data ........................................................................................................ 18 2.1 Define WASH sector boundaries in terms of services ............................................................ 20 2.2 Identify the main WASH sector actors, map service provision and financial flows ............... 26 2.3 Estimate financial flows and capital assets stocks ................................................................... 34 3 Step 3 – Analyse financial data ...................................................................................................... 39 4 Step 4 – Interpret and disseminate findings .................................................................................... 42 4.1 Analyse and interpret WASH Accounts data to answer policy questions ............................... 42 4.2 Disseminate the policy analysis ............................................................................................... 49 5 Step 5 – Provide feedback on methodological development .......................................................... 50 Methodological Note No 1: Developing WASH services classifications ............................................. 52 MN 1.1. Existing classifications of WASH services ........................................................................ 52 MN 1.2. Summary evaluation: the potential use of existing classifications for the development of WASH Accounts ............................................................................................................................... 65 Methodological Note No 2: Developing classifications of WASH actors and financing sources ........ 68 MN 2.1. Classifying WASH service uses ......................................................................................... 68 MN 2.2. Classifying WASH service providers ................................................................................. 70 MN 2.3. Classifying WASH financing units .................................................................................... 71 MN 2.4. Classifying WASH financing sources ................................................................................ 73 Methodological Note No 3: Estimating funding of WASH services with a “Financing Source approach” .............................................................................................................................................. 78 MN 3.1. Obtaining data on financing sources................................................................................... 78 MN 3.2. Potential challenges and how to address them ................................................................... 84 2
  • 4.
    Methodological Note No4: Estimating the costs of providing the service with a “Cost-based approach” .............................................................................................................................................. 86 MN 4.1. Classifying costs ................................................................................................................. 86 MN 4.2. Collecting data on the costs of service provision ............................................................... 90 Methodological Note No 5: Estimating fixed asset stocks ................................................................... 91 MN 5.1. How does estimating fixed asset stocks differ from evaluating investment flows? ........... 91 MN 5.2. Potential methodological challenges with this approach and ways to overcome them ...... 92 MN 5.3. Valuing fixed asset stocks in the testing exercise and next steps ....................................... 94 Methodological Note No 6: Preparing WASH accounts’ tables and indicators ................................... 95 MN 6.1 What are the WASH Accounts tables? ................................................................................ 95 MN 6.2 What are the WASH Accounts indicators? ....................................................................... 103 Annex A – Summary of key steps under the methodology ................................................................ 105 Annex B – The System of Environmental Economic Accounting for Water (SEEA-Water): a brief introduction ......................................................................................................................................... 108 Annex C - Glossary ............................................................................................................................. 116 Annex D - References ......................................................................................................................... 122 Relevant websites ................................................................................................................................ 123 3 List of Figures Figure 1 - Overview of proposed methodology to track financing to WASH at national level .............. 9 Figure 2 - Financing flows in the WASH sector: mapping the sector based on consumption, production & financing ......................................................................................................................... 19 Figure 3 - The value chain of WASH services ..................................................................................... 23 Figure 4 – Mapping financial flows for WASH service provision: illustrative example ...................... 30 Figure 5 - Methodology to estimate WASH Accounts ......................................................................... 36 Figure 6 - Government expenditure on health, education and WASH ................................................. 46 Figure MN 2.1 - Sources of finance for the WASH sector ................................................................... 74 Figure A.1 - The WASH Accounts in relation to the overall System of National Accounts .............. 108 List of Boxes Box 1 - The System of National Accounts (SNA) .................................................................................. 8 Box 2 - The System of Environmental-Economic Accounting for water (SEEA-Water) .................... 14 Box 3 - Examples of pre-existing information to be collected (as appropriate) ................................... 15 Box 4 - Types of service providers: the example of Burkina Faso ....................................................... 33 Box 5 - Data sources and collection methods ....................................................................................... 37 Box 6 - Filling in data gaps: making assumptions and using keys ....................................................... 38 Box MN 3.1 - Regulatory data on tariffs of service provision from national regulators ...................... 79 Box MN 5.1 - Alternative methodologies for valuing fixed asset stocks ............................................. 93
  • 5.
    4 List ofTables Table 1 – Proposed classification of WASH goods and services ......................................................... 24 Table 2 – Definitions: uses of WASH services, WASH sector actors and financing sources .............. 27 Table 3 – WASH Accounts tables recommended for use ..................................................................... 40 Table 4 - Potential WASH Accounts indicators ................................................................................... 41 Table 5 - Link between WASH Accounts information and policy questions ....................................... 43 Table MN 1.1. Summary of main international systems of classification of goods and services ......... 52 Table MN 1.2- CPC- Central Product Classification ............................................................................ 54 Table MN 1.3 - ISIC- International Standard Industrial Classification ................................................ 60 Table MN 1.4 - COFOG (Classification of the Functions of Government) ......................................... 63 Table MN 1.5 - WASH sector support activities .................................................................................. 65 Table MN 1.6 - Correspondences between CPC, ISIC and COFOG classifications along the water and sanitation value chain ............................................................................................................................ 66 Table MN 2.1- Classifications of WASH uses, actors and financing sources ...................................... 68 Table MN 2.2 - Proposed WASH Accounts classification of WASH Service uses ............................. 69 Table MN 2.4 - Classification of Water service providers in SEEA-Water ......................................... 70 Table MN 2.5 - WASH Accounts classification of WASH service providers ..................................... 71 Table MN 2.6 - Classification of Water financing sectors in SEEA-Water ......................................... 72 Table MN 2.7 - WASH Accounts classification of WASH financing units ......................................... 72 Table MN 2.8 - WASH Accounts classification of WASH financing sources ..................................... 77 Table MN 3.1 - Gathering data on financing sources ........................................................................... 78 Table MN 4.1 - WASHCost classification of costs in the WASH sector ............................................. 86 Table MN 4.2 - Proposed classification of costs .................................................................................. 88 Table MN 4.3 - Gathering data on costs of service provision .............................................................. 90 Table MN 5.1 - Terminology used in SNAs to evaluate changes in capital asset stocks ..................... 92 Table MN 6.1 - Classifications used in the WASH Accounts .............................................................. 95 Table MN 6.2 - WASH Accounts indicators ...................................................................................... 104 Table WA 1 (SxR) - WASH expenditure by main WASH service and geographical region ............... 96 Table WA 2 (SxU) - WASH expenditure by type of WASH users and service ................................... 96 Table WA 3 (SxP) - WASH expenditure by type of WASH provider and service .............................. 97 Table WA 4 (PxFS) - WASH expenditure by type of financing source and WASH provider ............. 97 Table WA 5 (SxFS)- WASH expenditure by type of financing source and WASH service ................ 98 Table WA 6 (SxFU)- WASH expenditure by financing unit and WASH service ................................ 99 Table WA 7 (PxFU)- WASH expenditure by WASH provider and financing unit ............................ 100 Table WA 8 (PxFU)- WASH expenditure by financing source and financing unit............................ 101 Table WA 9 (CxP)- WASH expenditure by type of cost and WASH provider .................................. 102 Table WA 10 (CxS)- WASH expenditure by type of cost and main WASH service ......................... 102 Table WA 11 (ASxP)- Fixed asset stocks by type of WASH provider ............................................. 103 Table A.1 - Summary of SEEA-Water Accounts ............................................................................... 109 Table A.2 - Hybrid account for supply and use of water .................................................................... 111 Table A.3 - Hybrid Account for water supply and sewerage carried out for Own Use ...................... 112 Table A.4 - Government accounts for water-related collective consumption services ....................... 113 Table A.5 - National Expenditure Account for wastewater management (billions of currency units)114 Table A.6 - Financing Account for waste water management (millions of currency units) ............... 114 Table A.7 - Classification of financing sectors used in the SEEA-Water Financing Accounts .......... 115
  • 6.
    5 Acknowledgements Thisreport has been prepared by Sophie Trémolet and Marie-Alix Prat of Trémolet Consulting Limited (London), under the leadership and guidance of Bruce Gordon and Didier Allély-Fermé (WHO-Geneva). This is the second version of the guidance document, which incorporates comments received from the Technical Advisory Group (TAG) for the TrackFin initiative on the initial version. We are very grateful for comments provided by all TAG members, including Gérard Payen (United Nations Secretary General’s Advisory Board on Water - UNSGAB), Dominick de Waal and Guy Hutton (Water and Sanitation Program - WSP), Véronique Verdeil (World Bank), Patricia Hernandez (World Health Organisation), Meera Mehta (CEPT – India), Catarina Fonseca (IRC), Richard Franceys (Cranfield University), Xavier Leflaive (Organisation for Economic Cooperation and Development), Ricardo Martinez-Lagunes (United Nations Department of Statistics). Objectives and planning of the testing exercise The present version of this document is going to be developed following testing activities at country level in Brazil, Morocco, Ghana and Burkina Faso. The objectives of the testing exercise are as follows:  Prepare WASH-Accounts for a small set of countries and extract lessons from those findings;  Verify data availability and define strategies to deal with lack of data where it occurs;  Help identify the extent to which statistical data (as opposed to sector data) can be relied upon;  Contribute to develop the methodology further, particularly where several options have been identified;  Provide a basis for revising the guidance document, with concrete examples from the WASH sector. Further comments are invited on this document from interested parties at any stage of the process. These comments, together with findings from the testing phase, will be reflected in the next version of the document to be released in Autumn 2014.
  • 7.
    List of acronymsand abbreviations 3Ts, Tariffs, Taxes and Transfers (sources of finance) AICD Africa Infrastructure Country Diagnostic AMCOW African Ministers’ Council on Water CLTS Community-Led Total Sanitation CRS Creditor Reporting System CSO Country Status Overview DAC Development Assistance Committee (OECD) EFA Education for All GDP Gross Domestic Product GLAAS UN-Water Global Analysis and Assessment of Sanitation and Drinking- Water IBNET International Benchmarking Network for Water and Sanitation Utilities IRC IRC International Water and Sanitation Centre ISIC International Standard Industrial Classification of All Economic Activities JMP WHO/UNICEF Joint Monitoring Programme for Water Supply and Sanitation MDG Millennium Development Goal MFI Micro Finance Institution MTEF Medium-term Expenditure Framework NEA National Education Account NGO Non-Governmental Organization NHA National Health Accounts NSO National Statistical Office ODA Official Development Assistance OECD Organisation for Economic Co-operation and Development PER Public Expenditure Review POC National level Point of Contact PPP Purchasing Power Parity PRSP Poverty Reduction Strategy Paper SEEA System of Environmental and Economic Accounting SEEA-Water System of Environmental and Economic Accounting for Water SFP Strategic Financial Planning SHA System of Health Accounts SNA System of National Accounts UIS UNESCO Institute of Statistics UN United Nations UNSD United Nations Statistics Division UNESCO United Nations Educational, Scientific and Cultural Organization UNICEF United Nations Children’s Fund UOE UNESCO/OECD/Eurostat USAID United States Agency for International Development WASH Water, Sanitation and Hygiene WASH Accounts Water, Sanitation and Hygiene Accounts WHO World Health Organization WSP Water and Sanitation Program (World Bank) WSS Water Supply and Sanitation
  • 8.
    7 Introduction Overview This guidance document sets out a proposed methodology to identify and track financing to the WASH sector in a coherent and consistent manner across several countries. It is designed to help countries track financing to the WASH sector on a regular and comparable basis and analyse this information to support evidence-based policymaking based on useful indicators. For ease of reference, the output of this exercise is referred to as WASH-Accounts (WASH-A). Between November 2013 and June 2014, the proposed methodology for the development of WASH-Accounts will be tested in countries that have expressed an interest in doing so. Based on the findings of this exercise, a refined methodology will be developed and disseminated widely so as to assist countries with the provision of sound and reliable financial information for future GLAAS reports. This will then form the basis for further methodological development and country-level applications in subsequent years. The long-term aspiration of the TrackFin initiative is to develop a common approach so that data produced at country level can be used for benchmarking, within and across countries and as a reference to guide key policy decisions. Rationale for the development of a shared methodology This methodology has been developed based on the findings of the WHO and UN-Water GLAAS Working Paper “Tracking national financial flows into sanitation, hygiene and drinking water” (Trémolet & Rama, 2012) published in July 2012. The working paper stressed that effective financing for water, sanitation and hygiene is essential to accelerate and sustain services that could ultimately save two million lives per year. However, limited availability of financial data and inadequate monitoring impedes the ability of countries to assess progress and improve performance. The working paper concluded that our current understanding of financial flows to the water, sanitation and hygiene (WASH) sector at the national level is limited, with numerous gaps. Based on these findings, there was a common agreement that a better understanding of financing to the WASH sector at the national level is critical to support policy development and implementation, as well as to encourage better and more equitable utilization of existing funds and attract additional financing to the sector. However, there was also a consensus that this is a difficult and challenging task, especially considering the poor state of current financial data in the sector. When the data is available, indicators often do not allow breaking down the information. The working paper therefore concluded that a multi-year initiative, thereby referred to as the UN-Water GLAAS TrackFin Initiative would need to be launched in order to gradually develop a methodology that could be used by a broad range of countries in order to produce comparable financial data on their WASH sector, that would enable policy makers to make the appropriate analysis. Demand for sound financial information for the sector was confirmed at the highest political level, including at the High-Level Meeting organised by Sanitation and Water for All in Washington DC in April 2012. An evaluation of the UN-Water GLAAS report identified that improved tracking of financing to the sector is essential and that the GLAAS report has a leading role to play in this area. These calls for action have provided the basis for the launch of the WASH “TrackFin” initiative (as in “tracking financing” to WASH) by WHO on behalf of UN-Water. The development of the present methodology seeks to learn and build upon existing systems for tracking expenditure, including the System of National Accounts (SNA) (see Box 1 below) and sector-specific systems, such as the System of Health Accounts (SHA) for the health sector or the Water Accounts that are to be prepared for the water sector as a whole, in application of the SEEA-Water framework (System of Environmental-Economic Accounting for Water) designed by the United Nations Department of Statistics (UNSD) (Annex B provides more detail on this system).
  • 9.
    8 Box 1- The System of National Accounts (SNA) The system of national accounts (SNA) is a broad structure for national economic accounting. This system was first adopted by the United Nations in 1952 and revised and updated since. The rules and structure of the SNA are contained in a manual called System of national accounts 2008. It is the internationally agreed standard set of recommendations on how to compile measures of economic activity. The SNA describes a coherent, consistent and integrated set of macroeconomic accounts in the context of a set of internationally agreed concepts, definitions, classifications and accounting rules. It provides an overview of economic processes, recording how production is distributed among consumers, businesses, government and foreign nations. It shows how income originating in production, modified by taxes and transfers, flows to these groups and how they allocate these flows to consumption, saving and investment. It provides the definitions that underlie such concepts as gross domestic product (GDP). Specific areas of learning from the SHA or from the SEEA-Water framework are highlighted throughout the text with the following symbols. Learning from the health sector Learning / aligning with SEEA-Water framework Objectives of the methodology The methodology aims to track all financing expenditure made in the WASH sector by all type of entities in the economy, including governments and public institutions, public and private organizations, NGOs, foundations, international and national donors, investors and households. It will enable countries answer five key questions: 1. What is the total expenditure in the WASH sector? 2. Who pays for WASH services and how much do they pay? 3. Which entities are the main funding channels for the WASH sector? 4. How are funds distributed to the different WASH services and expenditure types? Additional questions may be answered depending on the level of detail that can be reached for collecting the information and in order to help answer more specific policy questions. At this relatively early stage, however, the methodology is not encouraging countries to capture every single financing flow (or capital stock) in the smallest detail but rather to identify ballpark financing allocations, based on a combination of real data and a number of transparent assumptions (for the cases where the information base is non-existent or very poor). Early identification of questions that policy-makers want to address based on WASH Accounts data will be essential so as to ensure that the data being produced is policy-relevant. To generate and analyse data in order to answer those questions, the methodology proposes to follow a series of steps, as outlined in Figure 1 below. Step 5 (“Provide feedback for methodological development”) has been included so that the results of the testing exercise can be used in order to improve the methodology used at a global level (including for the GLAAS 2014 report).
  • 10.
    Figure 1 -Overview of proposed methodology to track financing to WASH at national level Source: authors. The development of WASH-Accounts is likely to give rise to a number of specific challenges. These challenges (and potential solutions) are highlighted in boxes with the sign to the left. Target Audience This methodology has been developed for the use of governments, especially in lower income and middle-income countries. It is designed to guide the preparation of WASH Accounts in countries so that they can be used for policymaking, as well as for international reporting, such as for the GLAAS report. It would also be of interest for bilateral donors, multilateral institutions, NGOs and philanthropic organisation looking for financial data to support their decisions regarding the design of their programs, both at international and country levels.
  • 11.
    Testing the methodologyand providing feedback This version of the guidance document has been prepared with the view that it would be tested in about up to four participating countries. The objectives of the testing “exercise” are as follows:  To evaluate the feasibility of collecting financing data on the WASH sector at national or regional 10 level in a way that is comparable and consistent;  To assess the extent to which national statistical offices are able to provide financial information on the WASH sector in a way that can be used by sector policy-makers and on reverse, the extent to which sector policy-makers could express their demands to statistical offices so that information can be provided in a reliable and standardised manner;  To identify challenges and potential solutions when applying this methodology, including the conceptual framework developed to identify and track the financing flows as well as the tools developed to present the information;  To get feedback on the long-term feasibility of national WASH-Accounts and on methodological developments that may be required over the long-term. Overall organisation arrangements of the testing The TrackFin initiative is managed by a small secretariat hosted by WHO. In addition to WHO staff member, the Lead international Consultant (Trémolet Consulting) will provide overall methodological guidance for the work at international and country level and the Country-level Consultants will provide guidance and management support to conduct the testing studies at country-level. National stakeholder groups will be established in each country where the testing will take place, based, where possible, on existing sector coordination mechanisms. The approach to the testing exercise will be the same in all countries as described in this document.  The testing exercise will start by identifying key points of contact at national level, and where appropriate based on previous contacts established by GLAAS;  The national level points of contact (which are likely to be within one or several of the lead Ministries for the sector) will be requested in each country to convey a national level stakeholder group to oversee the testing exercise and provide feedback. These groups would ideally build on existing country-level WASH sector coordination platforms (with representatives of the Ministries in charge of Water, Sanitation and Hygiene and the Ministries of Finance) to which the Department of Statistics should be invited. The national level point of contact should chair this national level stakeholder group and be in charge of getting agreement of a country-level workplan;  Testing at country level will be carried out by national consultants selected by national authorities in coordination with WHO, with the support of the Country Consultant. The national level point of contact, in coordination with WHO team, will prepare terms of reference to reflect country context, data availability and specific study questions that can be tested in this particular country so as to engage a local consultant to assist with the data collection and analysis based on the methodology. These consultants will be funded by WHO. The final selection should be based on a consensus decision with respect to the team leading the initiative, based on a short-list of potential consultants that were recommended by key national contact points, the GLAAS secretariat, national-level WHO offices or the international consultancy team. Based on these ToRs, WHO in coordination with national authorities will procure the national consultants, who will be briefed by the national level contact point and the Country Consultant. The latter will also be responsible for ongoing quality control and providing assistance with the implementation of the methodology;
  • 12.
     The nationalconsultants will conduct preliminary work to collect available information and identify key issues for the application of the proposed Guidance Document to their proposed country context. They will then identify potential options to address such issues and present those to a national-level workshop to which all members of the national stakeholder group will be invited, together with a broader range of actors if available (such as decentralised governments);  Based on methodological choices formulated at the national-level launch workshop, the national level consultant will gather necessary data, conduct rapid surveys if necessary, analyse the information and submit a draft report to the Country Consultant. Following incorporation of comments and questions from the Country Consultant, this report will then be submitted to the national stakeholder group for review via the national contact point;  The national consultants and the national contact point will then organise a final workshop, at which the results from the analysis will be presented, together with methodological issues encountered and recommendations for mainstreaming into the national processes and methodological developments (both at the national level and international level, via revisions to the international methodology as a result of the testing exercise). In each country, the aim will be to use as much recent and original work as possible, liaising as necessary with key experts in WHO regional and country offices, INGOs, NGOs, consultants, governments, research/academic institutions and multilateral bodies such as the World Bank's Water and Sanitation Program. The national-level reports will be developed based on a common format which will be specified in the national level Terms of Reference. In each country, the national consultants will prepare a maximum of a 60-page long report (with any additional relevant detail presented in Annexes) and an Executive Summary. This report will cover three main aspects:  Results of the analysis for the specific country;  Policy recommendations that can be inferred from the results of the analysis;  Recommendations to the WHO secretariat and expert group with respect to how the global 11 methodology could be improved / modified. Based on the results of the testing exercise, this guidance document will be revised and circulated to all countries willing to participate to the GLAAS financial data collection exercise. Structure of the guidance document This guidance document takes the reader through each of the steps for applying the proposed methodology. It is structured as follows:  “Step 1 – Getting started” sets out the initial steps that countries should take in order to get the exercise of building WASH Accounts going.  “Step 2- Collect financial data” is the “heart” of this guidance document as it includes guidance on collecting and organising the data as the input into the WASH Accounts. It recommends alternative methodologies for such data collection to reflect different circumstances.  “Step 3 – Analyse financial data” proposes a set of tables that constitute the “WASH Accounts” (the “output”) and from which a number of standard indicators can be extracted to analyse the sector. Depending on the policy questions that they want to answer, countries can choose to prepare only a sub-set of these tables or to drill down on particular aspects by adding more tables.  “Step 4 – Interpret and disseminate findings” contains guidance with respect to how the data can be interpreted and used for policy-making, highlighting potential pitfalls and future methodological developments.
  • 13.
     “Step 5– Provide feedback for methodological development” summarises what is expected from countries participating in the testing exercise in terms of feedback to be provided on the objectives and nature of the testing exercise. The sections are presented in the order in which the activities will need to be conducted. However, it is important that the teams in charge of carrying the exercise read through the entire guidance document prior to initiating the exercise. To complement this guidance, a series of notes has been developed to provide additional background on the methodology and set out alternative methodologies for specific areas. These notes have been designed to be stand-alone notes so that they can be used in different circumstances and feedback can be obtained from different sets of stakeholders and experts depending on their thematic area. During the testing exercise, each country will be encouraged to use those to firm up their approach and to provide feedback on the methodology that appears most suitable to meet their needs. Methodological notes  No 1: Developing a classification of WASH services  No 2: Developing a classification of WASH sector actors  No 3: Estimating funding of WASH services with a “financing source approach”  No 4: Estimating the costs of providing the service with a “cost-based approach”  No 5: Estimating capital stocks for WASH using a “fixed asset stock approach”  No 6: Preparing WASH Accounts tables and indicators In addition:  Annex A provides a summary of actions to be undertaken at national level under each step;  Annex B contains a brief description of the System of Economic and Environmental Accounting 12 for Water (SEEA-Water), with which the WASH Accounts are looking to align over time;  Annex C includes a glossary of key terms employed in this guide  Annex D contains a list of useful references and relevant websites.
  • 14.
    1 Step 1– Getting started A number of preliminary steps need to be completed so as to start the process prior to data collection. For optimal success, countries should start the preparation of WASH accounts in response to a clearly expressed policy demand. The construction of WASH Accounts will most benefit countries if the results are ultimately used by policymakers and sector stakeholders. 13 Step 1 - Summary of tasks to be undertaken  Create political buy-in: - Identify a country champion to be the national point of contact (POC) - Convene a national level stakeholder group to oversee compilation of data and provide political support to the project  Identify policy questions: - Organise an initial kick-off meeting with members of the national level stakeholder group - Agree on a list of priority policy questions that the data collected will aim to answer  Set up the team in charge of data collection and analysis: 1. Build a strong WASH Accounts team backed up by institutions 2. Identify available data and define a data collection plan 3. Develop a detailed budget and work plan for data collection and analysis 1.1 Create political buy‐in The first step will consist of generating political buy-in from high-level members of the government, within the ministries in charge of WASH services or at the level of the Ministry of Finance. Creating political will is key to ensure the success of the exercise and to overcome potential technical difficulties (including limited availability of information, weak information systems or internal barriers to greater transparency). To that end, a political champion will need to be identified in the country to lead the exercise, and to appoint a national level point of contact. The latter will receive a package of information to be disseminated amongst high level government members and key sector stakeholders to raise awareness on the benefits of gaining a better understanding of financing to the WASH sector and on the potential policy uses of WASH Accounts. Once a country expresses interest in preparing WASH accounts, the national level point of contact (POC) will be requested to convene a national level stakeholder group to oversee their compilation. This group will be responsible for identifying policy questions and providing feedback at critical moments when the analysis is being developed. The group will ideally include representatives of the Ministries in charge of water, sanitation and hygiene and of the Ministry of Finance, as well as from main utilities, regulators, donors, NGOs and Foundations active in the country. To the extent possible, the group will build on existing country-level WASH sector coordination platforms, to which the Department of Statistics should be added (as it may not take part on a regular basis to WASH sector-level groups). The national level point of contact (POC) will chair this national level stakeholder group. The chair will also take the lead to establish and manage the WASH Accounts team responsible for the data collection exercise (see Section 1.3 below). The national level stakeholder group will provide key political support for the testing exercise. This is not only important to link the production of WASH Accounts to the policy process and institutionalise it later on, but also to conduct the present exercise. They can leverage their network to gather key politicians to formulate the policy questions that WASH Accounts will aim to answer, to connect a wide range of skills to form the WASH Accounts team and to disseminate the results.
  • 15.
    14 1.2 Identifypolicy questions To ensure that WASH Accounts are useful for the country and will be used by policymakers to make decisions based on evidence, WASH Accounts need to be designed to answer policy questions expressed by policymakers. Although it is expected that countries collect the common basic indicators on the WASH sector, these policy questions will drive the level of detail that needs to be reached for data gathering, as well as the selection of complementary indicators that will be calculated in this exercise. For instance, Ministries might be looking for data on the total expenditure for the WASH sector to compare it with other countries or sectors, and use this data to advocate for mobilising more resources for the WASH sector. Policymakers may also wish to know more precisely the exact financing potential of households to decide how much public support is needed and how household investments could be better supported.  Examples of possible policy questions that can be addressed through WASH Accounts can be found in Section 4.2 “Turning data into policy - Interpreting and disseminating the data”. Methodological Note No 6 contains a list of WASH Account tables and indicators that can be built in order to provide information to address these policy questions. The national level stakeholder group and the subsequent WASH Accounts team should therefore familiarise themselves with these Tables prior to starting. These policy questions will drive the level of detail that countries want to reach with specific aspects of the analysis, which is why it will be important to agree on these questions prior to defining a data collection plan. To that end, it is proposed that the national point of contact will gather members of the national level stakeholder group for a kick-off meeting, in order to agree on a list of priority policy questions. On this basis, the national level point of contact (POC) will then agree on tailored Terms of Reference for the testing exercise with WHO secretariat. Those Terms of Reference will reflect the country’s context, data availability, policy questions that are relevant to the country and specific methodological questions that can be tested in the country. Some of the participating countries might be in the process of preparing Water Accounts based on the SEEA-Water methodology. In those cases, testing the UN-Water GLAAS TrackFin methodology in parallel with the preparation of Water Accounts will enable to draw conclusions on the extent to which there are economies of scale relative to data collection and on the compatibility of the approaches. Box 2 below provides summary information on this methodology. Box 2 - The System of Environmental-Economic Accounting for water (SEEA-Water) The System of Environmental-Economic Accounting for Water (SEEA-Water), prepared by the UN Statistics Division, provides a conceptual framework for organizing hydrological and economic information in a coherent and consistent manner thus overcoming the tendency to divide issues along disciplinary lines. It is based on the 2003 System of Environmental and Economic Accounting (SEEA) and was further elaborated to reflect the 2008 System of National Accounts (SNA). SEEA-Water provides the framework for developing Water Accounts, which share a similar structure, definitions and classifications with the SNA. In 2007, the SEEA-Water framework was adopted as an international standard by the UN Statistical Commission, which encourages countries to implement it. To date, more than 50 countries have expressed interest in compiling national environmental-economic accounting for water following the SEEA-Water framework. These are mostly developed countries (mainly European Union countries, along with Australia), but some developing countries from different regions of the world are also starting to adopt the framework, including Algeria, Bolivia, Botswana, Brazil, Colombia, Dominican Republic, Ecuador, Egypt, Jordan, Lebanon, Mauritania, Mauritius, Mexico, Morocco, Namibia, Palestine, Panama, South Africa, Tunisia and Zimbabwe. At the national level, SEEA-Water is being implemented gradually, as a step-by-step process. Only a few countries have been able to develop a complete set of Water Accounts, including for both physical and monetary data. The UN Statistics Division is encouraging countries to use this system of accounts by organizing regional workshops and delivering capacity-building activities. Other institutions, such as the World Bank are providing financial support to countries that wish to adopt this system, in particular through the WAVES partnership. Source: (United Nations Statistics Division, 2012). See also Annex B.
  • 16.
    15 1.3 Set‐upthe team in charge of data collection and analysis 1.3.1 Build a strong WASH Accounts team backed up by institutions Based on these ToRs, the national level point of contact (POC) will set up a WASH Accounts team to carry out the testing exercise at country level. The WASH Accounts team should ideally be composed of people with a diverse range of expertise, technical and policy experts from the WASH sector as well as representatives from the National Statistics Office, and good analytical and communication skills. The WASH Accounts team will be briefed by the POC and the International Consultants appointed by WHO. The latter will also be responsible for on-going quality control and providing assistance with the implementation of the methodology. To the extent possible, team members should belong to government’s administration, to ensure capacity building at national level and appropriation of the exercise by the country, regardless of the fact that the work is then be done through national consultants. For the testing exercise, if national consultants are funded by WHO, the consultants would be selected and hired by WHO. The selection will be done at country level based on a short-list of potential consultants, assembled based on recommendations from the key national contact point, GLAAS secretariat, national-level WHO offices and the international consultancy team. Hiring external national consultants would spare financial and human resources from the national governments and avoid diverting employees away from their ongoing regular work, in particular given the short time frame for this project. By contrast, if the personnel conducting the WASH Accounts study are completely external to the government, it may create the risk that the testing exercise would be a one-off exercise and that skills and expertise developed along the way are lost. The WASH Accounts team will conduct preliminary work to collect available information and identify key issues for the application of the proposed methodology to their proposed country context. They will then identify potential options to address such issues and present those to a national-level workshop to which all members of the national stakeholder group will be invited, together with a broader range of actors if available (such as decentralised governments). 1.3.2 Identify available data and define a data collection plan The WASH Accounts team will start by identifying available sources of information so as to support data collection, based on three core principles:  Use all suitable existing data;  Adjust existing data to match the objectives of the WASH Accounts;  Arrange for the collection or generation of the “missing” data. To keep the costs of the exercise down, countries should identify which data is already available in previously existing reports. Examples of potential documentation appear in Box 3 below. Box 3 - Examples of pre-existing information to be collected (as appropriate)  Household surveys (e.g. Multi Indicator Cluster Surveys)  Access data from the Joint Monitoring Programme  The GLAAS Report and survey responses  Information on the water sector at the level of the National Statistical Offices  WSP’s Country Status Overviews (in Sub-Saharan Africa only)  PRSP documents and planned poverty reduction expenditure  Medium Term Expenditure Frameworks  National sector plans and policies
  • 17.
     National budgets  Local government budgets (for decentralised WASH sectors, for a sample of localities)  Utilities’ financial accounts  Sector financing reports produced by the sector regulator (where they exist)  OECD Creditor Reporting System and data from the DAC database  SWA Aid Effectiveness Working Group and Country Processes Working Group documentation  Data from the IBNET database  UN-Water Country Briefs  World Bank Public Expenditure Reviews (PERs)  United Nations Economic Commissions' relevant studies  Africa Infrastructure Country Diagnostic studies  WASH sector reports  Project-specific documentation  Reports on decentralisation processes  Benchmarking reports from utility associations, governments (e.g. Brazil, India) or regulators (e.g. Kenya, 16 Mozambique etc.) In countries where there has already been some analysis of the WASH financing system, country profiles and reports on different segments of the system may indicate other data sources. The WASH Accounts team will also need to interview key informants at stakeholder institutions to identify the extent to which data is available within those organizations. With respect to private operators and non-profit organisations, it will be important to seek out umbrella organizations, such as NGOs and industrial associations, in order to make it easier to find data sources and to ensure that those sources can be made public. It will also be useful to contact international organizations that may have database that can complement national sources. Aligning with National Statistical Offices (NSO) systems. A key area to explore up-stream of testing the methodology will be to assess the extent to which National Statistical Offices (NSOs) collect financial data from the WASH sector at a level of detail that allows drawing conclusions for policy definition. Different types of situations may be identified:  If NSOs do collect data on WASH, it will be important to work with them to identify how this data can be extracted and used by sector actors. This would be the best way to ensure that the data collection exercise is embedded in national systems and can be repeated over time at least cost. A key area of coordination will also be to identify how NSOs and sector stakeholders can work together to translate WASH sector policy needs and produce data at the most appropriate level of disaggregation. WASH sector stakeholders can also learn from NSOs on data collection methods.  If the level of detail of WASH statistical data is insufficient (either because NSOs are poorly performing or they do not collect data from a comprehensive set of WASH service providers), it will be necessary to initiate a specific sector-level data collection process. It will be preferable to align with the statistical office’s classification in order to facilitate integration further down the line. The type of data that will be needed and potential sources for this data is set out in more detail in Section 2, which gives a step-by-step guide on how to collect the information. In some cases, it will be necessary to collect primary data, particularly for the costs of certain service providers (e.g. informal service providers) or certain financing sources (e.g. household investment in on-site sanitation) that are unlikely to be routinely collected by NGOs. When such surveys are not possible or too expensive, it will be necessary to formulate assumptions to derive initial estimates, even if these are approximate. The exercise will necessarily be limited by data availability. Therefore, the WASH Accounts team should initially be aiming at a reasonable but optimal level of accuracy, searching for the 20% of sources that will provide 80% of the needed data.
  • 18.
    Section 2 ofthis guidance document proposes a way forward on specific issues depending on the type of data to be collected: it will therefore be important that the WASH Accounts team reviews this Section in detail prior to defining its work plan. Conducting additional data collection will clearly have budgetary implications, which should be identified from the start: it will be important to consider trade-offs between different types of data collection as well. 1.3.3 Develop a detailed budget and work plan Once policy questions have been identified and available information has been mapped out, the WASH Accounts team will be responsible for defining a work plan and detailed budget. These documents should be approved by the national level stakeholder group. It will be important to start with reasonable expectations in terms of level of detail and complexity for the information, and to improve it over time. The WASH Accounts team, in conjunction with the national level stakeholder group, will need to define the space and time boundaries of the accounts, taking account of the potential challenges indicated below. Potential challenges to consider when defining a budget and workplan  WASH Accounts would preferably cover the entire national territory but could include detailed information for specific regions only, with data for other regions based on extrapolations. If there are substantial discrepancies between geographic areas, regions should be classified into types and data should be obtained from at least one region from each type, so as to allow a more representative extrapolation of regional-level data.  Depending on the organisation of the WASH sector in the country, data collection will likely be conducted separately in each sub-sector. Typically, in a developing country, the service provision and financing arrangements for urban water, urban sanitation, rural water and rural sanitation tend to differ, hence the need to consider each of the four “sub-sectors” separately. As a result, the analysis may need to be repeated for each of the four sub-sectors, even though the methodological tools and approaches for each of the sub-sectors will be the same. Providing feedback on the methodology Countries participating to the testing exercise will be invited to comment on the process proposed in Step 1 to initiate the exercise and create political buy-in within Ministries. Views are sought on whether it would be useful to gather simplified indicators on the sector (as “Quick Wins”) in Step 1 to demonstrate to decisions makers that the exercise will be useful so as to show them how the data can be used. This would aim to create more political support to the team collecting the data. 17
  • 19.
    2 Step 2– Collect financial data This section sets out the framework for developing WASH Accounts in more detail: it is intended to serve as a practical guide for the collection of financial data under Step 2. The WASH Accounts team will need to answer three basic questions in order to collect the data:  Which WASH services are consumed?  How are services provided and by whom?  How much do these services cost and how are they financed? This framework of analysis is based on the basic premise that all services that are consumed are also provided and financed in some way, which means that conducting the analysis alongside these three axes should ultimately yield the same results. Taking account of “financing losses” in the system In some cases, financing allocated to the sector may not translate into actual services consumed, due to various losses along the way. Ideally, these “losses” would need to be quantified and it could be a long-term objective of the TrackFin initiative to help quantify how much financing is “budgeted” or “allocated” but does not actually result in service delivery. This kind of analysis, although important, will most likely be difficult to conduct in the initial stages of applying the methodology, as it requires keeping track of many complex datasets simultaneously. At this stage of methodological development, it is preferable to obtain actual expenditure amounts for all types of flows. This would allow comparisons between different sources of funding and would provide a more accurate representation of actual expenditure in the sector. If obtaining actual expenditure information is proving challenging, it could be possible to estimate it based on budgeted amounts and estimated percentages of realisation (based on past experiences). (See the Challenge Box “Identifying which financing flows can be tracked in Section 2.3). In addition, it could also be useful to complement this with qualitative and quantitative assessments of the difference between budgeted amounts and actual spending. Figure 2 below (based on a similar figure for the SHA) presents the main dimensions that need to be examined in order to track financing to the WASH sector at the national level in a comprehensive and reliable manner. The following sections provide more detail about what to do to generate this data. 18
  • 20.
    Figure 2 -Financing flows in the WASH sector: mapping the sector based on consumption, production & financing 19 FINANCING SOURCES  Tariffs for services provided  Households’ expenditure for self-supply  Domestic public transfers  International public transfers  Voluntary contributions  Repayable financing What is being financed by whom? FINANCING UNITS  National authorities  Regional authorities  Local authorities  Network corporate providers  Non-network corporate providers  Economic and quality regulators  Bilateral and multilateral donors  Banks and Financial Institutions  NGOs and community-based organizations  Households COSTS  Capital costs including hardware and software  Operating and minor maintenance costs  Large capital maintenance costs  Cost of capital  Support or software costs What is being produced by whom and at which cost? SERVICE PROVIDERS  Government agencies  Network corporate providers  Non-network corporate providers  NGOs and community-based organizations  Households (self-provision) SERVICES Water supply services  Water supply through large network systems  Basic drinking water supply Sanitation services  Sanitation though large network systems  Basic sanitation Support services to the WASH sector  Administration of water and sanitation programmes  Regulation of these sector of activities  Governance and legislation  Education and capacity building Water resources Management  Services in relation to water supply and sanitation services What is being consumed by whom? TYPES OF USES  Served domestic use  Self-provided domestic use  Served institutional use  Self-provided institutional use  Served industrial and commercial use  Self-provided industrial and commercial use
  • 21.
    20 2.1 DefineWASH sector boundaries in terms of services Step 2.1 - Summary of tasks to be undertaken  Define a classification of WASH services that will be used for the testing exercise: - Identify the classifications and categories of WASH services that are being used in the country. - Analyse similarities and differences with available international classifications (see Table MN 1.6): can the same categories be used? Is data collected on this basis in the country? - State very clearly which activities are included in the WASH sector definition, preferably by reference to international classifications - Collect data according to these categories if possible or based on aggregate categories (e.g. water supply services, sanitation services, construction services, support services)  Specific task for the testing exercise: Provide feedback on the following questions: - Is the proposed list (see Table 1.) usable and useful in your country to define sector boundaries? - What would be the ideal level of aggregation of data that would answer policy questions and be easily collected at the same time? - Can WASH data based on international classifications be found in your country? - Would it be necessary, in your opinion, to refine existing classifications in order to better match WASH sector needs? Why is it important to define the WASH sector in terms of services? The WASH Accounts team will need to start by defining the “boundaries” of the WASH sector in the country based on a list of potential services to be included. Adopting and using a common classification of products, services and activities relevant to the WASH sector is essential in order to ensure that the information produced for the GLAAS exercise (and beyond) is consistent, comprehensive and comparable. This applies to the collection of financial information as well as to any other type of information collected through the GLAAS report. Such a definition often varies from one country to another, and it is therefore essential to clarify what is included in the sector in the country where the analysis is conducted. There are several specific objectives (and associated challenges) when defining sector boundaries:  To identify the list of products and services for which costs and financing sources are to be tracked through the WASH accounts. Such products and services may be produced jointly with other water services by certain actors. For example, some water companies that distribute water may also be involved with managing water resources up-stream or managing irrigation schemes for agricultural purposes. Other services may be seen by some as going “hand-in-hand” with the provision of WASH services, such as solid waste management, whereas other countries would not typically include solid waste management in their sanitation definition. Some countries might have difficulties including hygiene, as they would not track this on a regular basis. Making reference to a common list will help countries identify which services should be included (such as downstream sludge management) and which should be excluded (e.g. building of dams which are mostly for hydropower generation).  To define categories of services for which financing should be tracked separately. This could be done in order to be in a position to draw policy conclusions on whether financing is allocated to the right type of services or products. In the early stages of implementing the methodology, it might only be possible to disaggregate based on a few types of services (at the very least, between
  • 22.
    water and sanitationservices). However, the long-term objective for methodological development is to allocate financing to different service categories so as to improve the detail of the analysis. To the extent possible, all countries reporting to GLAAS should do so based on a common definition of the WASH sector. If this is not possible (because of the way in which their water sector is organised), reporting countries should be explicit about which services are included (or not) in their definition so that sources of difference can be clearly attributed and understood. Learning from the health sector – The System of Health Accounts (OECD, 2011) defines the boundaries of health care activities from an international perspective based on the functions of health care. Health expenditures are included in Health Accounts based on the following four elements. To be accounted for, they should involve: a) A transaction; b) Which is linked to the consumption of a resident; c) Whose primary purpose is health (the “purpose” of the spending determines the health care functions. This is defined as “the type of need that the transaction aims to satisfy or the kind of objective pursued ”); d) Which involves the application of a qualified health knowledge (direct or through 21 supervision). Are included in the boundary of HA, activities which aim to “improve, maintain and prevent the deterioration of the health status of persons and mitigating the consequences of ill-health through the application of qualified health knowledge. Based on this criteria, health activities are classified in 7 main categories of health care functions sub-divided in a total of 36 categories (Health promotion and prevention; Diagnosis, treatment, cure and rehabilitation of illness; Caring for persons affected by chronic illness; Caring for persons with health-related impairment and disability; Palliative care; Providing community health programmes and Governance and administration of the health system). Countries chose what they can classify based on the nature of their national health statistical systems, the data available and the ability to implement an accounting framework based on a classification based on health purpose. What do we mean by the WASH sector? Broadly defined, the “WASH sector” refers to the provision of water, sanitation and hygiene services. These services may be purchased from WASH service providers or self-provided. The fact that the GLAAS report has been defined in the global monitoring architecture as the report that enables tracking inputs whilst the JMP tracks outputs and outcomes (particularly in terms of attaining the MDGs) has a number of implications for the definition of the WASH sector for the present exercise. The MDGs aim at halving the number of people that do not have access to water and sanitation. Specific emphasis is placed on the provision of services in or near the home (as opposed to in working spaces or institutions). This means that for the purpose of tracking financing (i.e. the “inputs”), it would be preferable to include information from service providers that serve households (i.e. commonly referred to as “domestic water providers”) and institutions (administrations, schools, hospitals, etc.) as opposed to commercial, industrial or agricultural users. This can raise challenges as most municipal service providers serve households and institutions but also other types of customers (see the box below on typical challenges). Potential challenges involved with defining the WASH sector and ways to address such challenges  WASH service providers serve a wide range of different types of users, including industrial, commercial and institutional users). This is a key difference with the health sector, for example, where services are basically consumed by individuals. Disaggregating financial data to separate out services received by households only is likely to be time-consuming and in some cases impossible to achieve. In the first
  • 23.
    instance, we recommendtracking financing for service providers that primarily serve domestic and institutional users, noting if possible the proportion of revenues (and costs) that relate to other types of users (such as commercial or industrial).  Not all WASH services are “provided”: many households or industrial users self-provide water and sanitation services, particularly when network services are too expensive or not accessible (households) or network service quality is not satisfactory (unreliable service hours, inadequate quality, which mean that industrial users develop their own water supply). These “own-use” activities need to be included (as they are in the Water Accounts) in order to capture the whole range of services.  WASH service providers need to carry out other activities up-stream and downstream of providing services to households in order to contribute to managing the water cycle sustainably. Boundaries with water resource management are sometimes difficult to draw. We recommend including the water resource management activities that a water service provider should undertake as part of its normal activities to protect water sources but to exclude, to the extent possible, water resource management for other types of uses, such as irrigation schemes or hydro-energy production.  None of the existing international classifications has identified hygiene relating to water and sanitation as a specific product or service category. If hygiene financing is going to be adequately tracked, this would require developing, adopting and mainstreaming specific classifications (for products, service providers and functions). This is not a priority during the first phase of methodological development but would need to be explored in subsequent stages.  Water resource management activities do not strictly speaking fall under the definition of WASH services. However, some of these activities are implemented by water service providers and are essential for the sustainable provision of such services. It is therefore recommended, if possible, to take into account financing going to the water resource management activities that are directly relevant to water and sanitation service provision but exclude broader water resource management activities, such as the construction of dams for irrigation purposes for example. Providing access to water and sanitation is only a subset of the services that are needed in order to manage the water and sanitation cycle in a sustainable manner whilst serving the needs of all users. These other activities can be referred to as the WASH services “value chain”, as presented in Figure 3 below. 22
  • 24.
    23 Figure 3- The value chain of WASH services Source: “Benefits of investing in water and sanitation: An OECD Perspective” (OECD, 2011), p.31 In addition, to ensure that the overall WASH sector is functioning adequately, additional functions need to be carried out typically at the national ministry level (or regional level, in the case of federal systems), such as sector planning, management and coordination functions.  Methodological Note No 1: Developing WASH services classifications provides additional detail on existing international classifications (with a particular focus on CPC, ISIC and COFOG), how they can be used to support the analysis of the WASH sector and what modifications might be necessary in order to enable a more detailed analysis of the sector. Table MN1.4 in Methodological Note No 1 contains a list of those services and support functions according to existing international classifications (mainly CPC, ISIC and COFOG). To ease understanding, we have reordered these classifications to match the value chain presented in Figure 3 above. The classification of WASH goods and services proposed for this exercise is presented in Figure 1below. As these classes are commonly accepted and used, we recommend using them to identify the boundaries of the WASH sector and identify which activities should be included or excluded when tracking transactions to WASH. Whether or not these services are provided depends on the level of development of the water sector in a given country. In most developing countries, these services are unlikely to be provided in a comprehensive manner. For example, where providing access is a priority, wastewater collection and treatment services are often very limited. However, for the purpose of the testing exercise and to ensure its global applicability, the classification includes all critical services that would ideally need to be provided, from which countries can select as appropriate. To the extent possible, we recommend collecting data according to the categories presented on Table 1 below.
  • 25.
    24 Table 1– Proposed classification of WASH goods and services Code Category Activities included Included in S1 Water supply services Water supply through large network systems  Collection of rain water and water from various sources (from rivers, lakes, wells);  Purification of water for water supply purposes, desalting of sea/groundwater by treatment plants;  Storage of water;  Large scale transmission / conveyance of water in pipelines;  Distribution of water through mains (includes water pumping and transport in local water networks);  Management of water connections and consumer support activities. ISIC: 36 Basic drinking water supply  Collection of rain water and water from various sources (rivers, lakes, wells) using handpumps, spring catchments, gravity-fed systems, rainwater collection and fog harvesting;  Point-of-use water treatment for drinking purpose;  Storage of water in tanks;  Distribution of water through small distribution systems (pipes, wells or trucks) or local neighbourhood networks typically with shared connections/points of use;  Management of water access points and consumer support activities, S2 Sanitation services Sanitation though large network systems  Construction of sanitation facilities in households and communities and connection to large sewage systems;  Collection of sewage by large scale sewer systems including trunk sewers and sewage pumping stations and drains;  Sewage treatment and disposal, including residual sludge disposal; ISIC 37 Basic sanitation  Promotion of sanitation, including demand promotion and sanitation marketing;  Construction of basic sanitation facilities in households and communities (latrines, septic systems, etc.);  Collection and transport of sludge from onsite facilities (pits emptying and cleaning services);  Treatment and disposal of sludge by faecal sludge treatment facilities; S3 Support services to the WASH sector  Water and sanitation sector policy making and governance, including: o Development of sector policies o Legislation : Definition and enforcement of drinking-water and discharge standards for municipal wastewater o Regulation of water and sanitation supply activities and service providers o Sector planning, including estimating future sector financial needs ISIC 8412
  • 26.
    Code Category Activitiesincluded Included in 25 o Administration of water and sanitation programmes;  Education & capacity building in water supply and sanitation S4 Water resources Management (linked to water and sanitation services) Water resources protection  Collection and usage of quantitative and qualitative data on water resources;  Creation and sharing of water knowledge;  Conservation and rehabilitation of inland surface waters (rivers, lakes etc.), ground water and coastal waters;  Prevention of water contamination. River basin development Integrated river basin projects and related institutional activities; river flow control; dams and reservoirs. What needs to be done under this step? The WASH Accounts team will need to identify the list of WASH products and services that fall under the definition of WASH in their own country. In the first instance, it is unlikely that countries will be able to report financial information for each of those services separately. However, setting out a clear definition of what is included in their WASH sector will help when examining potential differences in funding across countries. To the extent possible (i.e. if data is available), countries should report on financing to different types of WASH services, so as to be able to evaluate financing allocations between different types of services. To the extent possible, we recommend collecting data according to existing classifications so as to ease the collection process and facilitate comparisons. To this end, countries can refer to existing classifications, which have been developed internationally (as summarised in Table MN1.4. and discussed in Methodological Note No1). These international classifications do not necessarily reflect adequately the realities of the WASH sector but they are currently the best available. Over time, the TrackFin initiative may be in a position to identify areas of weakness and recommend modifications to existing international classifications if those are likely to be needed. Countries may want to introduce further disaggregation for certain categories to reflect their own policy needs. For example, a country with a significant investment backlog for rural sanitation may want to adopt a higher level of disaggregation for these specific services. Each testing study will need to define which classification(s) can be used depending on the classifications used in the country and the amount of data that can reasonably be collected in the given timeframe. Providing feedback on the methodology Given that the ultimate goal of the exercise is to embed this data collection in national statistical processes, feedback will be sought on the appropriateness of existing classifications for the WASH sector and on the extent to which these classifications may need to be modified. One key objective of the testing exercise will be to better understand how existing classifications (CPC, ISIC and COFOG in particular) capture information on financing to WASH and how they are used and applied in the targeted countries. The WASH Accounts team will be asked to report on the appropriateness of the presented classifications of WASH services and suggest any modifications to contribute to the development of a list of WASH services that could be used later.  Methodological Note No 1: Developing WASH services classifications sets out potential issues with existing classifications and formulates initiate recommendations as to how these classifications may need to be amended in order to meet the policy needs of the WASH sector.
  • 27.
    2.2 Identify themain WASH sector actors, map service provision and 26 financial flows Step 2.2 - Summary of tasks to be undertaken 1. Identify and classify WASH actors, financing sources and uses of WASH services  On the basis of data already gathered in Step 1.3.2, identify the classifications of WASH actors, financing sources and uses that are being used at country level  Analyse similarities and differences with the proposed classifications: can some categories be used? Can collected data fit into the proposed classifications?  State clearly the classifications of WASH actors, financing sources and uses that will be used  Organise actors and financing sources into categories using the proposed classification. 2. Map out the financing of the WASH sector (actors and financing flows schematised by categories)  Represent the WASH sector actors and financing sources for each of the four sub-sectors (if necessary, i.e. if there are substantial differences between them) 3. Provide feedback on the methodology:  Assess if the proposed global classification covers all identified actors and financing sources at country level and whether it needs to be modified to better adjust to the country’s context.  Indicate whether a common classification of WASH actors, financing sources and uses is useful  Report on any difficulties encountered in carrying out the exercise and ways to address them. Why is it important to identify WASH actors and financial flows in the sector using a common methodology? Identifying the main actors of the WASH sector and the financial flows between them is essential to understand what type of data needs to be obtained and where it can be obtained. Building a graphical representation (as shown on Figure 4 below) of financing flows will facilitate this process, to ensure that all actors and flows and recorded and to communicate the results. To allow international comparisons and to ensure that the information produced is consistent, it is preferable that all countries participating in the exercise use the same (or similar) classification of WASH sector actors and of the financing flows circulating between them. At present there is no standard classification for actors in the WASH sector. Country-level statistical offices and WASH sector officials use their own classifications, which vary depending on the structure of the WASH sector in their country. The present methodology proposes a classification of WASH sector actors that could be adopted for this purpose and that is sufficiently broad to capture most (if not all) sector organisations. The proposed classification distinguishes between actors (service providers and financing units), financing sources (characterised by the origin of the funding), and the type of use to which the funding is allocated. This proposed classification was developed so as to align with existing classifications used at an international level, whilst proposing improvements to overcome certain identified weaknesses with existing classifications. If possible, it should be used across countries so as to present data on a comparable basis. Table 2 below presents this classification in a synthetic manner and contains all definitions for WASH sector actors, financing sources and uses of WASH services used in the present methodology.  Methodological Note No 2: Developing classifications of WASH actors and financing sources proposes and justifies a system of classification for the various types of sector actors and financing sources based on a thorough review of existing classifications. This system is summarised in Table 2 below.
  • 28.
    27 Table 2– Definitions: uses of WASH services, WASH sector actors and financing sources Code Category Definition U: Uses of WASH services Type of use of WASH goods and services U1 Served domestic use Consumption of served water and sanitation services by households that are served by service providers and pay for the service via a tariff. This would include water supply to households that are connected to the water and/or sewerage network, but also water fetched from a public standpipe or other providers (e.g. water tankers). U2 Self-provided domestic use Consumption of self-provided water and sanitation services by households. Households have to pay up-front an initial investment (in a well or private latrine) to have access to the service and then need to cover operating and maintenance costs of their assets. U3 Served institutional use Consumption of served water and sanitation services by government agencies (such as Ministries, hospitals, schools) and voluntary organisations such as NGOs, CBOs or foundations. They are served by service providers and pay for the service via a tariff. U4 Self-provided institutional use Consumption of self-provided water and sanitation services by government agencies (such as Ministries, hospitals, schools, etc.) and voluntary organisations such as NGOs, CBOs or foundations. They make an up-front initial investment to have access to the service and then need to cover operating and maintenance costs of their assets. U5 Served industrial and commercial use Services used by commercial entities that are purchasing water and sanitation services from a service provider at the industrial or commercial tariff. U6 Self-provided industrial and commercial use Consumption of self-provided water and sanitation services by industrial or commercial entities. P: WASH service providers Actors engaged in the production and delivery of WASH services. These would include government institutions providing support services to the sector. P1 Government agencies Providers that are integrated in government. This would also include government agencies (such as Ministries, hospitals, schools, etc) and as well as self-provided municipalities (operating the service directly rather than through a corporatized entity). P2 Network corporate providers Utilities that own and/or operate facilities for production and distribution of water and sanitation services through network systems for the public, as well as for bulk services. They can be either privately or publicly owned, mandated or independent, large, medium or small-sized, providing a public service or self-providing the service for their own use. P3 Non-network corporate providers Corporations that provide any WASH good or service along the value chain at a small scale through non-network systems. They usually involve low skilled labour and small level of initial investments. They can take various organisational forms from cooperatives to private ventures, and be formal or informal. P4 NGOs and community-based organizations Non-profit making organisations that seek to complement WASH public services. They usually have a formal structure and offer services to people other than their members, and are, in most cases, registered with national authorities. Community-based organizations (CBOs) are a type of small NGOs that aim to mobilize, organize or empower their members, usually in a local area. P5 Households (self-provision) Households that self-provide the service. They have to pay up-front an initial investment (in a well or private latrine) to have access to the service and then need to cover operating and maintenance costs of their assets.
  • 29.
    Code Category Definition FU: Financing units Institutional entities that provide funding to the sector. They mobilise funding to pay for WASH services. They may allocate 28 funds directly to service providers or channel them through intermediary institutions. FU1 National authorities Public authority at central government level, including Ministries (ministry of finance, ministry of water or other ministries) or national institutions FU2 Regional authorities Public authority operating at the regional level FU3 Local authorities Public body operating at the level of a smaller geographic area, such as a city, a town, or a district. FU4 Network corporate providers Utilities that own and/or operate facilities for production and distribution of water and sanitation services through network systems for the public, as well as for bulk services. They can be either privately or publicly owned, mandated or independent, large, medium or small-sized, providing a public service or self-providing the service for their own use. FU5 Non-network corporate providers Corporations that provide any WASH good or service along the value chain at a small scale through non-network systems. They usually involve low skilled labour and small level of initial investments. They can take various organisational forms from cooperatives to private ventures, and be formal or informal. FU6 Economic and quality Regulators Public authority responsible for the overall supervising of the WASH sector in the country (control of tariffs, quality of water, competition in the sector etc.) FU7 Bilateral and multilateral donors Governments providing official development assistance directly to a country or through multilateral international institutions (UN, World Bank or regional development banks) FU8 Banks and Financial Institutions A financial institution that provides banking services, such as taking deposits and providing credit facilities and loans to individuals and/or small businesses and corporations. FU9 NGOs and community-based organizations Non-profit making organisations that seek to complement WASH public services. They usually have a formal structure and offer services to people other than their members, and are, in most cases, registered with national authorities. Community-based organizations (CBOs) are a type of small NGOs that aim to mobilize, organize or empower their members, usually in a local area. FU10 Households Households that self-provide the service (such as on-site sanitation). They either pay up-front through initial investments (in a well or private latrine) or purchase services from a variety of providers (e.g. water tankers). FS: Financing sources Where funding originates from. This is what the OECD commonly refers to as the 3Ts (as tariffs, taxes and transfers) for which we are proposing a slightly amended classification. FS1 Tariffs for services provided Payments made by users to service providers for getting access to and for using the service. FS2 Households’ expenditure for self-supply Funding provided by households to invest in or provide the service themselves. Households have to pay up-front an initial investment (in a well or private latrine) to have access to the service and then need to cover operating and maintenance costs of their assets. This can be in form of cash, material or time. FS3 Domestic public transfers Public transfers from government agencies (central or local government) to WASH actors. These are often subsidies that come from taxes or other sources of revenues of the government. This category includes only grants and excludes concessionary loans (which are included in FS6). FS4 International public transfers Voluntary donations (or grants) from public donors and multilateral agencies that come from other countries. Concessionary loans are excluded from this category and entirely included in FS6 Repayable Finance.
  • 30.
    29 Code CategoryDefinition FS5 Voluntary contributions Voluntary donations (or grants) from international and national non-governmental donors including from charitable foundations, Non- Governmental Organizations (NGOs), civil society organizations and individuals (remittances). Concessionary loans are excluded from this category and entirely included in FS6 Repayable Finance. FS6 Repayable financing Sources of finance that come from private or public sources and ultimately need to be repaid, such as loans (including concessionary loans and guarantees), equity investments or other financial instruments such as bonds. This category can be divided down into 2 sub-categories: concessionary repayable financing and non-concessionary repayable financing.
  • 31.
    What needs tobe done under this step? The first activity under this step entails identifying and listing all potential actors in the WASH sector, and gathering basic information on these actors (such as number of entities, legal status (formal or informal, publicly or privately owned) and geographical coverage). To conduct this exercise, it will be important to identify whether existing classifications of WASH actors and financing sources are being used at country level, either at the level of the NSO or by the WASH sector itself. If such classifications exist and are being used, it will be necessary to analyse similarities and differences with the classification proposed in the present methodology. It will then be necessary to state clearly the classifications of WASH actors and financing sources that will be used and to organise actors and financing sources into categories using the proposed classification. Once the bulk of this information is collected, the second activity will consist of mapping out how the sector is organised and financed, as presented schematically in Figure 4 below for a hypothetical WASH sector. This figure is purely illustrative for an imaginary sector and does not intend to exhaustively map out all possible financial flows. Mapping out financial flows needs to be distinguished (and kept separate) from mapping out institutional arrangements. The latter show lines of responsibilities and allocation of powers and functions (including policy-making, regulation, asset ownership, service provision, etc…) whereas financial mapping mainly focuses on tracking where the money comes from, how it travels and who it goes to. 30 Figure 4 – Mapping financial flows for WASH service provision: illustrative example Source: adapted from (Trémolet & Rama, 2012). The exercise needs to include and differentiate service providers from all four main subsectors of the WASH sector, i.e. urban water, urban sanitation, rural water and rural sanitation and most likely map them out separately. This is because the organisation of each of these four subsectors often varies substantially. For example, sanitation services may be provided jointly with water services or separately. In a large number of cases, there is no formal sanitation service provider and households are required to invest in on-site sanitation and maintain the installations themselves (this is referred to as “self-supply”).
  • 32.
    WASH sector actorswill be characterised according to the role they play in the financing and provision of WASH services. Actors will be identified mainly as:  “service providers” engaged in the production and delivery of WASH services.  “financing units”, i.e. as actors collecting funds and transferring them to service providers, (potentially via other financing units who pool and distribute the funding). Typically, these would include households, domestic and international governments, private corporations and non-profit organisations; Potential challenges involved with identifying and mapping WASH sector actors and ways to address such challenges  Informal service providers need to be included in the mapping to the extent possible. Even though the economic activities of informal actors may not be accounted for by statistical offices, they often represent a large proportion of WASH service provision in developing countries and need to be taken into account in the classification and mapping.  Actors can play different but simultaneous roles in the WASH sector, which means that it may be difficult to allocate them to a single category. For example, households may be financing units and self-service providers at the same time. They may be using their own resources for investing in WASH whilst also receiving government subsidies. All financing flow information need to be recorded and coded appropriately: a single flow might needs to be recorded in different ways to reflect this multiplicity of roles.  Avoiding double-counting of financial flows. Some financing units allocate funds to the sector from their own resources (such as central government institutions) whilst others are merely channelling funds provided to them by other institutions (typically, local governments may act as financial channels particularly when they do not have their own funds to allocate to the sector). When resources are channelled through several financing units (for instance from an international donor to a national government and then from the national government to a local government) , it is important to ensure that funds are not counted twice i.e. at source and at the point where funds are disbursed to service providers. We recommend that flows be tracked at the level that is closest to service provision (in this case the local government), so as to enable maximum disaggregation of the funding flows. Indeed, any allocation that takes place at the national level is likely to be much more aggregated. The feasibility of this recommendation needs to be assessed during the testing exercise.  Users can also be represented in this figurative mapping. However as users will have several uses (served or self-provided) and thus can be allocated to several categories, we prefer using the concept of “use of WASH services” to track the service and level of service on which the funding is spent (See Methodological Note 2 “MN 2.1. Classifying WASH service uses”). Financing flows will be characterised according to the origin of the funding. “Financing sources” are defined as the flows that are channelled to the service providers and which are differentiated based on the origin of those funds. Funds for the sector can come from either private sources (including households via tariffs and own investments or charitable donations or private investments) or public sources (from taxes, which are either managed by national governments or international governments, in the form of public transfers through official development assistance). The way in which these financing sources are described can vary significantly from one sector to another: this is an area where reaching an agreement on definitions for the WASH sector as a whole would be beneficial. In addition, as financing sources are not actors per se, it is also important to identify the “financing units” separately (as described in the box above 31
  • 33.
    Potential challenges indefining financing sources Different classification systems refer to “financing sources” in slightly different ways. In the OECD 3T terminology, “financing sources” refers to where the funding comes from and the types of funds that can be mobilised to finance the sector. The SEEA-Water terminology refers to financing units (actors grouped by financing sectors), which are covering the costs. To add to the confusion, the SHA terminology refers to these “financing units” as “financing sources”. In the classification recommended in this document, the terminology “financing sources” has been kept as per the OECD definition and complemented with a reference to “financing units”, as the actors from which the funds are mobilised. To the extent possible, we recommend collecting data according to the proposed classifications to ensure comparability between countries. Countries might not need to use all categories, depending on the structure of their WASH sector. Countries may want to adapt those categories and introduce further disaggregation for certain categories to reflect their own policy needs. For example, a country with a significant investment backlog for rural sanitation may want to adopt a higher level of disaggregation for these specific services. Each testing study will need to define which classification(s) can be used depending on the classifications used in the country and the amount of data that can reasonably be collected in the given timeframe. The following sections provide guidance on carrying out the data collection for each category. Identifying the uses of WASH services The WASH Accounts team will need to identify the types of uses of WASH services. We recommend using the classification proposed in Table 2. Countries can also use additional criteria to classify uses depending on the policy questions they wish to answer. For instance domestic uses can be classified by:  Demographic groups (ethnicities, urban or rural);  Socioeconomic strata (level of income, tariff scale);  Geopolitical entities (regions, districts etc.). Countries would need to assess the feasibility of collecting data according to these additional categories, depending on the policy questions they want to answer. Identifying service providers The WASH Accounts team will need to identify the entities that are in charge of providing the services from all four subsectors and the services they are providing. In order to understand the supply market, assess its dynamics and level of fragmentation, the WASH Accounts team collect initial data on main providers or type of provider to get an idea of:  their characteristics and status (ownership, enterprise or non-enterprise, formal or informal);  WASH services they produce;  the users covered (type and number);  external funding they receive;  their geographical distribution and human resources;  expenditure reports produced about their activity; 32
  • 34.
    33 Box 4- Types of service providers: the example of Burkina Faso In Burkina Faso, a public urban utility, ONEA, is in charge of providing water services in the main urban centres (as well as sanitation services in the big cities). By contrast, service provision in rural areas is decentralised, with rural communities being responsible for the delivery of water services. While boreholes in rural areas are managed by water committees or by users’ associations, rural municipalities with a water network are supposed to sign contracts with private operators. To date, about 70 of such municipalities (30%) have signed contracts with four official private providers. In the remaining municipalities, the network is either managed by a recognized community association (20%), by the municipality itself, or by an informal provider. Informal providers are also found in peri-urban areas. Concerning sanitation, in rural areas, services are typically self-provided. As a result, the five service providers categories would be used for this exercise: Public and private utilities (ONEA), NGOs and community-based organizations (in rural areas), Small independent providers (formal and informal operators in municipalities), Government agencies (municipalities) and Households (self-provision). To the extent possible, the WASH Accounts team will classify them in the pre-defined “service provider” categories presented in Table 2 and differentiate between actors from all four main subsectors of the WASH sector (urban water services, urban sanitation services, rural water services and rural sanitation services). To align with SEEA-Water, when a provider operates in several sub-sectors, it should be categorised in the subsector of its primary activity (i.e. for which its output is highest). Identifying financing units The WASH Accounts team will need to identify relevant financing units providing and/or allocating funds to the WASH sector. It will collect data on the characteristics and status of these entities and on the structure they finance, in order to understand whether they act as primary or secondary source of the funding (i.e. only channelling funds. To the extent of possible they will classify relevant entities in the pre-defined “financing units” categories presented in Table 2. Identify financing sources and how funding circulates between WASH sector actors The WASH Accounts team will then identify the financing sources and how these funding flows circulate between the previously identified actors. To the extent possible, we recommend collecting data on financing sources according to the proposed classification presented in Table 2. This classification has been developed based on existing standards classifications, namely a slightly modified version of the OECD’s 3 T (“tariffs, taxes and transfers”) approach and SEEA-Water. Such areas are discussed in Methodological Note No 2: Developing classifications of WASH actors and financing sources. Providing feedback on the methodology Given that the ultimate goal for this data collection is to be embedded in national statistical processes, feedback will be sought on the appropriateness of the proposed classification of WASH actors and financing sources and the extent to which this classification may need to be modified to reflect other existing classifications. The testing exercise will contribute to better understand how these existing classifications capture information on financing to WASH and how they are used and applied in the type of countries that we are targeting. It will also help to know whether data categorised under these classifications can actually be found in developing countries. The WASH Accounts team will provide comments on the proposed classifications based on the methodological discussion included in “Methodological Note No 2: Developing classifications of WASH actors and financing sources”. It will suggest any modifications to contribute to the development of a shared list of WASH uses, service providers, financing units and sources that could be used for subsequent GLAAS data collection exercises.
  • 35.
    34 2.3 Estimatefinancial flows and capital assets stocks Step 2.3 - Summary of tasks to be undertaken  Identify data required to answer policy questions set out in Step 1.2.  Identify whether the National Statistics Office already collects data on financing to WASH and if so, understand their methodology for doing so;  For financing flows, gather financing data at source, starting with the approach that allows generating the most comprehensive data set (i.e. either “Financing Source Approach” or “Cost-based Approach”):  For financing flows, define a time period over which to gather information (2-3 years);  Note that both approaches will need to be applied in parallel as they provide complementary information, particularly needed to allocate costs to types of services;  Gather data on capital assets using the “Fixed asset stocks approach”  Collect the data and create a WASH Accounts database: o Define the structure of the database and the data-records so that it can be maintained on an ongoing basis; o Decide which data to acquire; o Enter existing data into the database; o Allocate WASH Accounts classification codes to all data entries; o Identify data gaps and undertake further analysis / surveys to plug in data gaps; and o Prepare the WASH- Accounts tables.  Reconcile the data, identify gaps in the information and recommend (and conduct) any supplementary primary data gathering (such as additional surveys).  Provide feedback on methodological issues: o Appropriateness of the categories of costs proposed o Identify a list of costs and financing sources that are difficult to value and will require additional methodological development o Appropriateness of using a Fixed Asset Stocks approach o When using a Fixed Asset Stocks approach: on methods for asset valuation and on whether to deal with liabilities alongside assets Why is it important? Collecting financial information is the core objective of the TrackFin methodology. Two main types of financial information can be collected:  Information on financing flows. This can be used to estimate the "inflows and revenue" into the sector each year (tariffs, households’ expenditure for self-supply, domestic public transfers, international public transfers, voluntary transfers and repayable financing) and how much is “spent” every year on providing different types of services, to cover different types of costs, such as operating expenditure, small maintenance, capital expenditure or capital maintenance expenditure.1 1 An indicator such as GDP (Gross Domestic Product) is also a financing flow indicator, as GDP estimates the total value of goods and services produced in a country from the expenditure on consumption and production. It indicates the total monetary value of all the finished goods and services produced within a country's borders in a specific time period (usually in a year). It includes all of private and public consumption, government outlays, investments and exports less imports that occur within a defined territory. It is calculated based on expenditure figures reported in the National Accounts.
  • 36.
     Information onfixed asset stocks. Alternatively, and in complement, it is important to gather information on capital stocks, to estimate how much has been invested by economic actors in building WASH assets over the years. This can also provide the basis for "asset management planning" which is critical for future financial planning. So far, most existing financial tracking initiatives have focused on tracking financing flows. Such methodologies often stem from an emphasis on tracking public financial flows, as public budgets typically distinguish between “recurrent” expenditure and “development” expenditure (i.e. capital investment). It is therefore assumed that collecting data on development budgets from public agencies’ accounts will give a good indication of capital investments. In the present methodology, we argue that it would be important for the WASH sector to get a better grip on the overall value of its assets, which means that collecting data on capital stocks, alongside data on financing flows, is important. The testing exercise gives an opportunity to test the proposed methodology for this. Collecting information on financing flows can itself be done based on two approaches:  The “Financing Source Approach” consists of tracking revenues from each financing source to 35 estimate “how much money is allocated to the sector” and aggregate those estimates; and  The “Cost-based Approach” consists of tracking the costs of different services for service providers to estimate “what is being spent” and aggregate those expenses to derive total expenditure figures. The Financing Source Approach aims at answering questions such as “who are the main sources of finance for the sector” and “what is being spent” from the point of view of financing sources and units. In most cases, it is likely to be the most straightforward approach for tracking public financing flows, as most public entities have a budget allocation for the sector and should be able to report on this. The WASH Accounts team will seek to collect data on financing units’ budgeted allocation of resources and expenditures from their financial reports and data sources mentioned above. However such an approach is often not sufficient when seeking to track how the money is spent (i.e. how it is distributed between water and sanitation for example) or to gather information on certain sources of finance, such as households spending for instance. For this reason, it is often necessary to combine this analysis with a “Cost-based approach” to evaluate the costs of providing the services. This needs to be done based on a commonly agreed typology of costs, which would at least distinguish between capital expenditure (including large maintenance costs, which should be accounted for as a separate item), operating costs and minor maintenance expenditure. Finally, the approach that aims at collecting data on fixed assets stocks is referred to as the “Fixed asset stocks approach”. Information for this approach also needs to be obtained at the level of service providers, by focusing on obtaining data on their assets (and potentially liabilities) rather than on their revenues and expenditures. This methodology would allow estimating the value of existing asset stocks in the sector and is in line with the System of National Accounts. Estimating such values raises methodological difficulties. However, it would be important to attempt this methodology at least in some of the countries where the testing exercise is going to be undertaken.
  • 37.
    These approaches andthe way they may be combined to derive meaningful data on WASH financing are presented schematically on . Figure 5. 36 Figure 5 - Methodology to estimate expenditure in the WASH sector See additional methodological notes on how to apply those approaches and data needs:  Methodological Note No 3: Estimating funding of WASH services with a “Financing Source approach”  Methodological Note No 4: Estimating the costs of providing the service with a “Cost-based approach”  Methodological Note No 5: Estimating fixed asset stocks It will also be important to adopt a common terminology for the different categories of costs and financing sources, and to use the same accounting principles so as to ensure data comparability. Not only will this permit valid comparisons across activities in the accounts, across the years shown in the accounts and across countries, it will also permit comparison of national expenditure on WASH with other economic aggregates, such as gross domestic product. For this reason, it would be preferable to employ an internationally accepted definition of the term “expenditure”, such as that used in the system of national accounts (paragraphs 2.63 to 2.79 and Chapter VI of the SNA93 manual for a description of these concepts and definitions). However, aligning and reconciling with the SNA terminology is likely to take time and to generate difficulties as most WASH sector actors are not familiar with this terminology. This is a key area where feedback from the testing exercise will be important, to assess the extent to which the WASH sector should develop its own concepts and standards or seek to align with standard concepts and terminology as per the SNA. What needs to be done under this step?
  • 38.
    The first activityunder this step consists of identifying which data needs to be collected and whether the National Statistics Office already collects data on financing to WASH (what the SHA refers to as the “top-down approach”) and if so, understand their methodology for doing so. Information gathered by NSOs can provide useful background and indicate whether or not the NSO has established systems to gather data from the WASH sector. However, information gathered by the NSO will have its limitations. First, the SNA focuses on one main aspect of national expenditure, which is the creation of value in production processes. Therefore this information can mainly be used to estimate service providers’ costs and revenues. Second, the information gathered through the National Accounts system is likely to be difficult to understand and interpret by sector actors. This is because it uses a terminology and concepts that WASH sector actors may not be familiar with and because this information is unlikely to be at the level of detail that would be required in order to support policy-making at sector level. Engaging the NSO is important, however, in order to better understand their current methodologies for gathering data and seek to involve them in the recurrent preparation of WASH accounts. The second activity will entail gathering financing data at source, starting with the approach that allows generating the most comprehensive data set. Initially, it will be necessary to identify the main data sources from which information on WASH expenditure can be extracted. Making an inventory of data sources will help keep track of the core data sets which are available and identify where information is missing and extra investigation needs to be conducted (such as household surveys etc.). For each type of data, it would be useful to collect the type of information indicated in Box 5 below. 37 Box 5 - Data sources and collection methods For each data source, it would be important to gather the following type of data:  Name of data source  Administration/Institution/ Origin of the source  Type of data source (registers, business surveys etc.)  Method of collection (e.g. administrative source, statistical full-scope or sample survey; national source versus standardised international survey)  Availability of data (years of data available)  Concept of the measuring units (costs, expenditures, turnover)  Variation in the methodology used to estimate data over time  WASH actors coverage, i.e. can expenditure can be assigned to categories of providers or financing sources and units?  WASH service coverage, i.e. can expenditure be assigned to categories of WASH services?  Configuration of data, i.e. what dimensions of data are available, level of details, by WASH services, uses, service providers, financing sources, financing units, factors of provision, expenditure type etc.  Data reliability bands, i.e. how reliable the data is? Is the methodology to compile the data traceable? This can be assessed with a scoring system. Based on an initial assessment of the availability of data at the level of financing sources and at the level of service providers, the WASH Accounts team will start by gathering information using the approach for which data availability is the greatest and access is easier. The other approaches will then be introduced in order to fill in gaps and to gather complementary information where more detail is needed for the purpose of policy analysis. To estimate financing flows, it will be important to apply both approaches in parallel as some data may only be collected at the level of service providers based on costs (for example, households’ investment in sanitation) whereas for other data, information might be more readily available at the level of the source and be expressed as an expenditure. Ideally, the WASH Accounts team will try to collect those costs at the level of each service provider. If this is not possible, for instance, in countries with a large number of service providers, they might need to collect the data from a sample and then extrapolate the results. The WASH Accounts team will also need to define the timeframe for this analysis. With respect to financing flow data, it would be preferable to gather data for a period of at least 2 to 3 full financial years, instead of capturing data for a single year as the latter would risk yielding non-comparable data. Depending on
  • 39.
    data availability, itwill be essential to define what types of financial flows are going to be tracked, as discussed below. Identifying which financing flows can be tracked For a given transaction, different types of financial flows are usually recorded, including: amounts budgeted and actual expenditure. Although budgetary information is likely to be easier to collect (particularly for transfers from public institutions), it is preferable to obtain actual expenditure amounts for all types of flows. This would allow comparisons between different sources of funding (including with funding provided by households, for which only actual figures are likely to be available) and would provide a more accurate representation of actual expenditure in the sector. If obtaining actual expenditure information is proving challenging, it could be possible to estimate it based on budgeted amounts and estimated percentages of realisation (based on past experiences). It is essential to clearly record what types of financing flows are being tracked in order to allow comparisons. The third activity entails building a database of WASH financial data, based on the initial investigation conducted. Once the list of data source and WASH actors are complete and the methodologies to be applied are clearer, the WASH Accounts team will create a WASH Accounts database in which they will compile all data collected as it becomes available. The structure of this database should be defined so that it can be maintained on an ongoing basis. The data collection process will be iterative as to refine initial estimates. The database will be progressively completed through successive estimations, in order to address remaining data gaps and reconcile estimates from different data sources. Data collection needs to be carefully planned, so as to avoid burdening data providers with overwhelming data requests in order to build a cooperative process with them. When filling information into the database, it will be important to allocate WASH Accounts classification codes to all data entries. The first round of data entry will help to quickly identify missing information, as well as potential questions arising on data sources (how data have been estimated, to which category they should be allocated, etc.). The final activity will consist in trying to reconcile all sets of data, by combining them to refine the allocation of spending to different categories. If significant gaps are found between the results from the two approaches to capture financing flow information, further investigation will be required to identify estimation errors or missing flows. This may require gathering supplementary information (from primary data sources) or applying estimates or using cost allocation keys to estimate data, as set out in Box 6 below. If additional data gathering is required, the WASH Accounts team would need to present this to the national level stakeholder group as this may require additional budget. 38 Box 6 - Filling in data gaps: making assumptions and using keys There will be some cases where data is not available to estimate comprehensively a category of WASH Accounts. In this case it will be necessary to resort to other estimation means using other information available. Using “keys” or pro-rata estimations refers to using the distribution of a proxy variable as a substitute for an actual distribution. For example, if there is no information on the distribution of expenditure across WASH services for a particular actor, that distribution of activities might be used as the "key" for allocating the expenditure by service distribution. Making assumptions might be necessary where insufficient information is available. For instance, if we want to measure the allocation of “software costs”, (i.e. costs associated with infrastructure development, such as for project preparation, capacity building, training, community mobilization and behavioural change activities) by activity of a service provider when we only know the total expenditure of this provider for the provision of WASH goods and services, it might be necessary to make an assumption on how much support costs can be associated to each of these activities. Support costs may not be directly linked to the overall expenditure on a service, however. Typically, for a public provider, support costs represent a higher percentage of the total costs of delivering sustainable sanitation services than of delivering sustainable water services. This is because households are expected to mostly invest in sanitation, which means that the support costs committed by the public party may represent a higher share of their total investment than for water (where public investment, particularly for capital expenditure, is still very much the norm). These assumptions, once formulated, would need to be tested, possibly by enquiring further into the cost structure of the service provider. All estimation methods and assumptions should be clearly presented in metadata attached to the final
  • 40.
    results; they shouldbe justified and well documented. This transparency is a key part of WASH Accounts development as it provides users of the results with a better understanding of how the data was compiled and assists compilers in subsequent compilation rounds. Using small-scale studies and applying results to the population. In some cases, the results of a small-scale study can be used to estimate the data for a particular component. For example, a survey on the allocation of expenditure of NGOs can be used to deal with the treatment of NGOs expenditure in WASH Accounts, given that NGO expenditure (and its allocation) is very often not known to a great level of detail. This approach does have its risks, however, as the selected sample might not be representative of all NGOs in the country. Thus it is important to document the methods employed and the potential biases from such methods. This approach can be used in a variety of areas where there is no separate accounting for WASH expenditure, or for particularly difficult components (households, NGOs, CBOs etc.). Providing feedback on the methodology The methodology for tracking financial costs of WASH services will need to be refined based on the findings from the testing exercise. Specific issues that will need to be addressed include defining cost categories (at present, what is proposed is to distinguish at least between capital expenditure and operations and maintenance expenditure, and potentially separate out large capital maintenance expenditure as well as tracking separately software costs for policy development and programme development). If the proposed cost categories are too detailed or difficult to use for extracting information at source, they might need to be refined and adjusted. Therefore the WASH Accounts team will be asked to develop and test a cost typology and to contribute to the discussion on this methodological point. The testing exercise should bring out key methodological issues that need to be tackled in order to produce comparable cost information and to ascertain the level of detail on costs that can reasonably be expected to be collected given the complexity of the sector. Feedback would also be needed on whether additional guidance is needed (or not) on defining common rules for gathering specific data items so as to ensure comparability. Finally, the WASH Accounts team is also asked to contribute to the discussion on tracking financial flows versus tracking capital stocks. Only certain countries will be expected to measure capital stocks (also referred to as “gross capital formation” in the SNA language) for WASH and test the application of this approach at country level to evaluate and report on their feasibility. 39 3 Step 3 – Analyse financial data Step 3 - Summary of tasks to be undertaken  Identify the tables and indicators from the list presented in this guidance document, based on which are most relevant to answer the country’s policy questions;  Undertake background calculation and compile WASH Accounts Tables;  Calculate the WASH Accounts indicators;  Document the compilation process;  Verify the coherence of the tables;  Provide feedback on the use of suggested tables. Why is it important? In order to conduct analysis and inform policy-making, the WASH Accounts team will need to build a number of tables to present the information collected in a way that can be analysed and
  • 41.
    used by policy-makers.These tables are what is referred to collectively as the “WASH Accounts”. It is on the basis of such tables that comparable indicators can also be derived. The present methodology proposes a number of standard tables that can be developed to address most policy needs. The main objective of building these tables is to answer the policy questions identified at the beginning of the process, including the following questions:  What is the total expenditure in the sector?  How are the funds distributed to the different WASH services and expenditure types?  Who pays for WASH services, and how much?  Which entities are the main channels of funding for the WASH sector, and what is their share of 40 total spending? It is important that all participating countries use a basic set of common WASH Accounts tables and indicators on a similar format, so as to enable international comparisons. Depending on their policy needs and information availability, countries may choose to prepare a smaller set of tables or to present more detailed information on certain aspects to address their own priorities. Table 3 below presents the set of tables we are recommending that countries prepare in order to get a comprehensive picture of WASH financing in their country. Table 3 – WASH Accounts tables recommended for use Table WA 1 (SxR)- WASH expenditure by main WASH service and regional subdivision Table WA 2 (SxU)- WASH expenditure by type of WASH service and use Table WA 3 (SxP)- WASH expenditure by type of WASH service and provider Table WA 4 (PxFS)- WASH expenditure by type of WASH provider and financing source Table WA 5 (SxFS)- WASH expenditure by type of WASH service and financing source Table WA 6 (SxFU)- WASH expenditure by WASH service and financing unit Table WA 7 (PxFU)- WASH expenditure by WASH provider and financing unit Table WA 8 (FSxFU)- WASH expenditure by financing source and financing unit Table WA 9 (CxP)- WASH expenditure by type of cost and WASH provider Table WA 10 (CxS)- WASH expenditure by type of cost and main WASH service Table WA 11 (ASxP)- Asset stocks by type of WASH provider  “Methodological Note No 6: Preparing WASH accounts’ tables and indicators” presents in more detail the proposed WASH account tables and indicators. It contains the actual tables, explains how they are built and what they can be used for. In addition, the WASH Accounts indicators are a set of key figures that can be derived from the WASH Accounts tables. They can be a quicker and more digestible way of presenting the information as a set of headline figures for dissemination of the results. Table 4 below presents the set of WASH Accounts indicators that can be calculated from the tables. They refer to the total expenditure to the sector and the allocation of the expenditure according to the different classifications presented above (per WASH service, provider, financing source) and as a percentage of total expenditure. Countries would need to select from this long-list of indicators those that are most useful to their needs. In addition, a set of internationally accepted common indicators should also be estimated to ensure comparability.
  • 42.
    41 Table 4- Potential WASH Accounts indicators Indicator (I)  Total expenditure on the WASH sector at the national level  Total expenditure on WASH in the country as share of GDP  Total expenditure on WASH per capita  Total expenditure on WASH as a % of total public spending  Total expenditure on urban and on rural drinking-water as a % of total WASH expenditure  Total expenditure on urban and on rural sanitation as a % of total WASH expenditure  Total expenditure per type of use as a % of total WASH expenditure  Total expenditure per type of WASH service as a % of total WASH expenditure  Total expenditure per type of WASH provider as a % of total WASH expenditure  Total expenditure per type of financing source as a % of total WASH expenditure  Total government domestic transfers expenditure and as a % of WASH expenditure  Total international transfers expenditure and as a % of WASH expenditure  Total household expenditure as a % of WASH expenditure  Total expenditure channelled through regional and local authorities/ government agencies as a % of WASH public expenditure  Total capital costs as a % of total WASH expenditure  Total operating and maintenance costs as a % of total WASH expenditure  Total large capital maintenance costs as a % of total WASH expenditure  Capital costs as a % of total water supply expenditure  Operating and maintenance costs as a % of total water expenditure  Large capital maintenance costs as a % of total water expenditure  Capital costs as a % of total sanitation expenditure  Operating and maintenance costs as a % of total sanitation expenditure  Large capital maintenance as a % of total sanitation expenditure  Total WASH fixed asset stocks per capita What needs to be done under this step? As a first activity, the WASH Accounts team will need to determine the tables to construct from the proposed list depending on their usefulness for national policy-making and data availability. International benchmarking should also be a key consideration when deciding which table to construct. In a second sub-step, data from the database built in Step 2.3. will need to be extracted to fill in the tables. It might be useful to start building background tables first, i.e. starting from the most disaggregated ones and building up to more aggregated ones. Throughout this process, it will be important to report on the compilation process and methods used to estimate the figures appearing in those tables, so as to be able to assess the quality of the data. WASH Accounts team will need to state very clearly in an accompanying report how they collected and constructed the tables. Documenting the metadata behind the data in the annex of the tables will enable to obtain solid and comprehensive data and will ensure that it is appropriately interpreted and used. At a minimum, background data should include the sources of data, how data were validated (especially when there are multiple sources of data), the hypothesis used when evaluating data (e.g. method of accounting chosen), the reasoning behind the selection of data used in the estimation and the procedures applied to make data usable.
  • 43.
    In a lastsub-step, the WASH Accounts team will need to verify that the data presented in the tables is robust and internally consistent. It will be important to check that:  Totals are consistent across all tables. The same total expenditures observed for consumption also 42 hold for provision and financing;  Totals reported should be equal to the sum of the constituent parts;  Values of similar expense items from the same classification should be consistent across tables; The various indicators in relation to the totals, related to the population (per capita value), related to GDP and related to historical values when there are several times series of WASH Accounts (percentage change from year to year, growth rates) are plausible. Providing feedback on the methodology Countries participating to the testing exercise will be invited to comment on the feasibility of the approach and of constructing those tables. Following testing, we recommend that a “minimum common set of WASH Accounts tables” and a minimum common set of indicators be developed and agreed at international level. These might include additional tables that were not included in the original set proposed in this draft guidance document (as we have deliberately tried to maintain the number of tables to a manageable number). 4 Step 4 – Interpret and disseminate findings Step 4 - Summary of tasks to be undertaken  Analyse and interpret WASH Accounts data to answer policy questions  Disseminate the WASH Accounts findings by communicating on the indicators, presenting the main results and findings of WASH Accounts in a summary report (including key WASH Accounts tables)  Write short policy briefs for decision makers focused on a specific policy question  Provide feedback on ways to disseminate findings 4.1 Analyse and interpret WASH Accounts data to answer policy questions Why is it important? Data is not information. In addition to producing tables and indicators, it is important to analyse the data based on background information on the WASH sector in the country in order to correctly interpret what the figures are showing. In order to be effectively used by policymakers, this information needs to be concise, directly meaningful and relevant to them. Table 5 below summarizes how WASH Accounts tables and indicators can provide elements to address policy questions and support policy development. It is followed by a discussion of how this data can be used and interpreted to answer a number of key policy questions, including:  What is the total expenditure in the sector?  How are funds distributed?  Who pays for WASH services?  How is funding channelled in the WASH sector?
  • 44.
    43 Table 5- Link between WASH Accounts information and policy questions WASH Accounts Tables (T) WASH Accounts Indicators (I) Policy questions that data can help answer Table WA 1 (SxR)- WASH expenditure by main WASH service and regional subdivision Total expenditure on the WASH sector at the national level Total expenditure on WASH in the country as share of GDP Total expenditure on WASH per capita Total expenditure on WASH as a % of total public spending Total expenditure on urban and on rural drinking-water as a % of total WASH expenditure Total expenditure on urban and on rural sanitation as a % of total WASH expenditure  What is total funding to WASH? Is current funding sufficient?  What is the trend in funding? Is it increasing or decreasing?  How does the level of funding compare to countries with a similar level of income? With neighbouring countries?  How does the level of funding compare with other social sectors (health, education)?  What is the urban/ rural, water/sanitation split in spending?  Is spending allocated to WASH subsectors that need it most?  Is funding going to regions/areas that need it most? Table WA 2 (SxU)- WASH expenditure by type of WASH service and use Total expenditure per type of service use  Which type of use is benefitting from the financial resources allocated to the WASH sector? Table WA 3 (SxP)- WASH expenditure by type of WASH service and provider Total expenditure per type of WASH service Total expenditure per type of WASH provider  Is spending going to services that need it most?  Which services do providers allocate funds to? Table WA 4 (PxFS)- WASH expenditure by type of WASH provider and financing source Total expenditure per type of financing source  Which services and type of providers are funds allocated to?  By whom is each type of service financed?  What is the financial burden on households? Are policies and utilisation of public funds effective at leveraging private investment, including from households?  What is the share of public vs. private expenditure? What is the share of donor’s contribution? How much is donor spending out of the total government’s budget? Are government and donors’ commitments on WASH financing respected? Table WA 5 (SxFS)- WASH expenditure by type of WASH service and financing source Total government domestic transfers expenditure and as a % of WASH expenditure Total international transfers expenditure and as a % of WASH expenditure Total household expenditure as a % of WASH expenditure Table WA 6 (SxFU)- WASH expenditure by WASH service and financing unit Table WA 7 (PxFU)- WASH expenditure by WASH provider Total expenditure channelled through regional and local authorities as a % of WASH public expenditure  How is funding in the WASH sector channelled?  What % of WASH public expenditure is channelled via local governments and how can they be supported?
  • 45.
    44 WASH AccountsTables (T) WASH Accounts Indicators (I) Policy questions that data can help answer and financing unit Table WA 8 (FSxFU)- WASH expenditure by financing source and financing unit Table WA 9 (CxP)- WASH expenditure by type of cost and WASH provider Table WA 10 (CxS)- WASH expenditure by type of cost and main WASH service Total capital costs as a % of total WASH expenditure Total operating and maintenance costs as a % of total WASH expenditure Total large capital maintenance costs as a % of total WASH expenditure Capital costs as a % of total water supply expenditure Operating and maintenance costs as a % of total water expenditure Large capital maintenance costs as a % of total water expenditure Capital costs as a % of total sanitation expenditure Operating and maintenance costs as a % of total sanitation expenditure Large capital maintenance as a % of total sanitation expenditure  Is sufficient spending allocated to operations and maintenance as opposed to investment?  Are tariffs/ subsidies/international transfers dedicated to investment or O&M? Table WA 11 (ASxP)- Asset stocks by type of WASH provider Total WASH asset stocks per capita  What is the stock of fixed assets for WASH services and for each subsector?  Is the capital stock being increased or run down?
  • 46.
    What is thetotal expenditure in the sector? Information on total WASH expenditure (as a monetary value or as a share of GDP) can provide elements to answer the following policy questions:  Is current funding sufficient?  What is the trend in funding? Is it increasing or decreasing?  How does the level of funding compare to countries with a similar level of income? With 45 neighbouring countries?  How does the level of funding compare with other social sectors (health, education)? Answers to these questions could be used to do the following: Monitor funding trends over time. The country’s level of WASH expenditure could be tracked over time to evaluate whether the overall financing effort (i.e. coming from all financing sources, rather than only from government) has increased or decreased. It could be compared with access rates to WASH services to see how the variation in WASH expenditure over time is correlated to access to WASH services. This information could be used to raise awareness on the need to attract more financing to the WASH sector in order to meet agreed physical targets and objectives and inform the debate about the appropriate mix of public and private financing in the sector. Benchmark funding to the WASH sector, against other countries or other sectors. If the data is collected on a comparable, comprehensive and consistent manner, the country’s level of WASH expenditure could be benchmarked against that in countries with similar income levels or in neighbouring countries. Total expenditure on WASH could also be compared to expenditure on other social sectors, such as education and health. At a later stage of methodological development, this financial data could also be related to outputs and outcomes in order to estimate value-for-money. This would request having a good monitoring framework for WASH sector outputs and outcomes in place. It could be used to assess the efficiency of funding to produce outputs (such as numbers of schemes, facilities and hygiene programmes) and outcomes (such as access to sustained WASH services). This analysis could be compared across countries to see how variation in WASH expenditure across countries is correlated with variation in access to WASH services. If similar countries have similar initial level of WASH services and have been spending the same amount on WASH for several years with a large discrepancy in outcomes, it would be useful to investigate the reasons for such a difference, to understand whether this might be due to a difference in policies, financing strategy, implementation capacity or any other factor. For instance the latest GLAAS 2012 report (WHO, 2012) collected data on Government expenditure on health, education and WASH as a share of GDP across 13 countries (see Figure 6 below). It indicates that median government expenditure on sanitation and drinking-water is one third of that for health and one sixth of that for education. However, as noted in Trémolet and Rama (2012), this analysis was based on a small and somewhat unreliable dataset. Once it is based on a broader and more robust dataset, this analysis could eventually be used to set benchmarks for the level of funding that should be allocated to deliver sustainable WASH services and used as a reference point in order to mobilise additional financial resources.
  • 47.
    46 Figure 6- Government expenditure on health, education and WASH How are funds distributed? Matrices of WASH expenditure per region/area and of WASH expenditure per subsector, service, type of providers and expenditure type could provide data to address the following policy questions:  Is funding going to regions/areas that need it most?  What is the urban/ rural, water/sanitation split in spending? Is spending allocated to WASH subsectors that need it most?  Which services and type of providers are funds allocated to? Is spending going to services that need it most?  Is sufficient spending allocated to operations and maintenance as opposed to investment? The answers to these questions could be used by policymakers for budgeting and planning in order to perform the following types of analysis: Identify inequities in spending distribution across regions and population groups. Depending on countries’ requirements, WASH Accounts could show data on the share of WASH expenditure by regions or by population groups with the greatest needs (i.e. at a level of disaggregation below the national level). This could help countries evaluate whether enough financial resources are allocated in areas where access to WASH services is lower. In turn, such analysis could be used to reduce inequities across population groups and regions by relocating transfers (both domestic and international) to those regions and groups that need them most through targeted pro-poor policies. Allocate funds to sub-sectors, services, providers and programmes. WASH Accounts could provide information on the share of spending allocated to the different subsectors (urban water, rural water, urban sanitation and rural sanitation), services (on-site sanitation or piped sewerage, etc.) and types of providers (public, private, community-based, small or large scale). This would help evaluating whether funding is currently allocated to services and providers that need it most in order to allocate budget more efficiently based on evidence.
  • 48.
    For instance astudy on public finance for household sanitation in Dar Es Salaam conducted for WaterAid revealed that in the period 2006-2010, 99% of public finance was allocated to sewerage and to wastewater treatment whereas only 10% of the population was connected to the sewer network and only a mere 3% of the population benefited from wastewater treatment (Trémolet & Binder, 2010). This kind of information could help enhance the comprehensiveness of public financing, target funding gaps and allocate funds in a way that would allow all services along the cycle of WASH activities to function in a sustainable manner. It is also important to track funding to software activities such as hygiene education and support to community management so as to ensure that these hardware expenditure on infrastructure development reach maximum impact. Allocate funds between capital investments and operations and maintenance. The matrix of WASH expenditure per subsectors, services and types of providers could also indicate whether funds are spent on capital investments, capital maintenance or operations (and small maintenance). It is important to check that operation and maintenance activities receive adequate funding so as to be able to sustain the services delivered via capital investments. For instance a WASHCost study on the costing of sustainable sanitation service delivery in the state of Andhra Pradesh in India revealed that in 2009-2011 86% of the Government investments for sanitation were spent on capital costs, largely on household and institutional toilets. Operation and maintenance costs only accounted for 8% of the total government investment, and only 2% were used for direct support costs such as sanitation promotion or training programs, which are usually considered to be essential to ensure consistent use and maintenance. These findings imply low priority given to regular maintenance and management (Snehalatha & al, 2011). A regular tracking of these types of expenditure could help better allocate funding by planning expenditure on a long term in order to enhance the long-term sustainability of WASH services. Plan national WASH policies and strategies. By providing a complete picture of current spending, WASH Accounts could contribute to identifying funding needs and priorities and designing a national WASH strategy to plan expenditure at a national level according based on such priorities. Monitor policies’ outcomes and effectiveness. Regular tracking of actual spending to WASH services overtime could help monitor the efficiency of policies and reallocate budgeted funds based on evidence. For instance this could be used to evaluate the efficiency of a new policy supporting small scale sanitation entrepreneurs in a region by looking at outcomes on access to sanitation facilities and compare trends over time. This could assess the benefits for the population and cost effectiveness and equity of the policy and whether the government should continue to support it or not. Who pays for WASH services? The matrix of WASH expenditure per financing source, per service and per expenditure type could provide information on financing sources of WASH and help define a financing strategy. It could provide data to address the following policy questions:  What is the share of public versus private expenditure?  What is the financial burden on households? Are policies and utilisation of public funds effective 47 at leveraging private investment, including from households?  What is the share of donor’s contributions? How much is donor spending out of the total government’s budget?  Are governments and donors’ commitments expressed in terms of WASH expenditure respected?  How/by whom is each type of service financed?  Are tariffs/ subsidies/international transfers dedicated to investment or Operations and Maintenance?
  • 49.
    The answers tothese questions could be used by policymakers for budgeting and planning to: Define a financing strategy. WASH Accounts could provide data on the actual distribution of financing sources in order to build a full picture of sector financing, something that is not available as yet in many countries. They would take into account public as well as private (including households) and donors’ expenditure. This information could be broken down by type of service, so as to build a better understanding of the sources of finance for on-site sanitation vs. sewerage services for example. This data could be used to identify whether alternative financing structures are more or less effective at leveraging investments from private sources (for example, evaluating the amount of public funding and uses of public funding that might be necessary in order to encourage households to invest in on-site sanitation). In terms of financing strategy, this data could be used to set maximum level of household contributions for certain given services for example. Monitor trends and outcomes of financing strategies over time. WASH Accounts could be used to compare the outcomes of financing strategies and assess the performance of policies designed to leverage investment over time. For instance if a country finds that households’ investment in sanitation facilities is lower than in similar countries, it could set up a policy to leverage private investment through micro finance schemes that can help households invest in their own facilities. A regular tracking of household expenditure in sanitation facilities could help monitor the outcome of this policy and evaluate if it actually increases households investments. Coordinate donor aid and international transfers. A substantial part of aid transfers to developing countries is often channelled through NGOs and therefore is not part of a governments’ budget, making it difficult to evaluate total spending in the sector. WASH Accounts could enable building a more complete picture of expenditures and thus facilitate greater coordination of WASH financing at a national level. This would help to better allocate funds according to priorities identified by governments. WASH accounts data could be used to advocate for joint planning between the government and development partners. Track commitments and targets expressed in financial terms. Data on actual spending to WASH could be used to track governments’ and donors’ commitments with respect to sector financing. Several governments have made commitments at the international level that have been formulated with reference to monetary amounts allocated to the WASH sector. For example, the eThekwini declaration in 2008 committed signatory African countries to establish specific public sector budget allocations for sanitation and hygiene programs. The stated aspiration was that these allocations should be a minimum of 0.5% of GDP for sanitation and hygiene. Compiling such an indicator in a consistent, comprehensive and comparable basis would be essential in order to track the implementation of such a commitment. At the 2012 High Level Meeting organised by Sanitation and Water for All, SWA countries made several commitments that were expressed in monetary terms:  Some countries committed to invest a specific amount in the sector, totalling approximately 1.6 48 billion USD over the next four years (Afghanistan, Burkina Faso, Niger, Senegal, Sri Lanka);  Others committed to “increase investments as a specific percentage of their GDP (Bangladesh, Benin, Cote D’Ivoire, Liberia, Niger, Nigeria, Sierra Leone), of their current sector budget (Kenya Zimbabwe) or their national budget (Nigeria and Togo)”. WASH Accounts could be used to see whether such financial commitments have been respected. They could also be used to estimate the additional financing efforts that would be required to reach the number of new users they committed to reach in output terms.
  • 50.
    How is fundingchannelled in the WASH sector? The matrix on WASH expenditure per financing unit and per service would help answer policy questions such as:  How is funding in the WASH sector channelled?  What share of WASH public expenditure is channelled via local governments?  How can financing units be supported? Answers to these questions could be used by policymakers to: Define and monitor financing strategies. Local governments often play an important role in channelling funds to local levels. Data on WASH expenditure per financing units could be used to evaluate the performance of decentralized financing policies. It could help identify ways to support local governments that channel such budgets. This data could also be used to study the consequences of using basket funds to channel financing to local levels. 4.2 Disseminate the policy analysis This information and analysis can be used at the following stages of the policy process:  Advocacy / attracting funds;  Defining financing strategies;  Budgeting and planning;  Monitoring;  Regular tracking of funding, tracking commitments and targets;  Benchmarking against other sectors or other countries;  Coordinating donor aid. There are three main ways in which WASH Accounts findings can be disseminated:  Produce a consolidated report on the WASH accounts, presenting the WASH Accounts results in 49 a systematic manner in a manner that aims to provide elements to answer key policy questions;  Publish key indicators from the WASH Accounts on a periodic basis, either via national, regional and international databases;  Prepare policy briefs based on results from the WASH Accounts focused on a specific policy question. WASH Accounts reports should provide careful documentation of sources and methodological information so that the observed differences between countries or for one country over time can be understood and put in proper context. To the extent possible, these reports should be developed along similar lines and format across countries to facilitate comparisons and use of the data at both the national and international level. To the extent possible, the WASH Accounts consolidated reports should contain the following elements:  Country background information to provide context for understanding the WASH Accounts findings;  The tables and indicators proposed above, plus extra ones if need be, that will inform the GLASS report and national policy;  Information on data collection and estimation methods (in an Annex); and  Documentation of the WASH Accounts data sources and any methodological information that is important to properly interpret the WASH Accounts results. Country background information in the report will ensure that WASH Accounts data is interpreted in their proper context. It will briefly describe the WASH sector in the country: the actors involved, the main financing flows, some contextual elements (e.g. the role of NGOs and the private sector) and
  • 51.
    major policy issues(e.g. recent reforms, current policies and institutional framework, reforms required etc.). This country background information could be collected via the broader GLAAS exercise, on a format that could be referred to as a “mini-CSO” (based on the Country Status Overview reports that have been prepared for Sub-Saharan Africa). Other data like price index data, GDP, access rate of access to improved water and sanitation facilities etc. could also be very useful to interpret the statistics. In addition to the WASH Accounts summary report, the WASH Accounts team will extract the key information to answer to the main policy issues expressed in step1 and produce short policy brief on the specific issues. The WASH Accounts team will present the WASH Accounts summary report and key indicators to the national stakeholder group and circulate these policy briefs and the WASH Accounts findings as widely as possible across WASH policymakers, high level members of the government, WASH advocates, NGOs and international organizations in the country. This is crucial, not only to share the findings of the WASH Accounts, but also to raise awareness, gain support and create future demand for such financial information. 50 5 Step 5 – Provide feedback on methodological development Step 5 - Summary of tasks to be undertaken  Produce a synthesis report evaluating your experience using this guidance document;  Assess and comment upon the appropriateness of the proposed classifications to define the WASH sector and the way it is financed;  Assess and comment upon the feasibility to collect such data in the country;  Assess the methodology proposed to value the financing flows and capital stocks;  Suggest modifications to improve both the classifications and the methodology;  Provide feedback on the overall process from an organisational point of view and give indications about the cost and resource requirements of the exercise Why is it important? This guidance document has been designed to provide the basis for a testing exercise to be carried out in different countries, with a mix of WASH sector organisation and access to information. As part of the testing exercise, a feedback process will be organised so that the results of the testing can be fed into the on-going development of the methodology. What needs to be done under this step? Below we summarise key areas where feedback is sought from the countries where the testing is going to be conducted and what might be expected of them, in the context of the preparation of the GLAAS report 2014 and beyond. Implementation of the current methodology at national level:  Appropriateness of the proposed classifications of sector products and services, actors and financing flows to describe the WASH sector in the country of study, completeness of these classifications;  Feasibility of collecting data following these classifications and levels of disaggregation;  Assessment of the need for a common classification of WASH actors and financing sources;  Appropriateness of the proposed classification of costs and feasibility to collect data using it;
  • 52.
     Assessment ofthe overall need to modify the proposed classifications to better adjust of the country’s context and reporting of difficulties encountered to classify data according to the proposed categories;  Feasibility of using the proposed approaches to estimate financing flows (the “financing source approach” and the ”Cost-based approach”), reporting of difficulties encountered when valuing financing flows and suggestions of solutions to overcome these issues;  Assessment of the need and feasibility to collect data on capital stocks;  Appropriateness and feasibility of using the “Fixed Asset Stocks approach” to value assets and 51 whether to deal with liabilities alongside assets;  Feasibility of obtaining data from National Statistical Offices which is relevant for policy-making in the WASH sector;  Feasibility of obtaining data according to the other proposed data sources and suggestion of additional sources;  Appropriateness of the proposed tables and indicators to answer the country’s policy questions and feasibility to collect data to inform them, suggestions of modifications to enhance reporting tables;  Appropriateness of the suggested methods to disseminate findings on the WASH Accounts and suggestions on other ways to do so;  Assessment of the organisational process to conduct the exercise;  Assessment of the process to create political buy-in and of the need to gather simplified indicators or “Quick Wins” in Step 1 to demonstrate to decisions makers that the exercise is useful by showing them how results can be used. Future methodological developments  Need and feasibility of defining additional product codes in order to track financial flows to WASH;  Need and feasibility of defining additional cost categories in order to value financial flows; The WASH Accounts team will produce a synthesis report (20 pages) on their experience with conducting the testing exercise. They will address the issues presented above and assess the feasibility to conduct the different steps of this exercise. They will suggest modifications to improve the methodology and classifications proposed. Finally they will provide feedback on the overall process of conducting the exercise from an organisational point of view (team composition, process to collect data, costs and resource requirements, timing, etc.)
  • 53.
    52 Methodological NoteNo 1: Developing WASH services classifications Objectives. This note provides additional information on existing internationally-accepted methods of classification for water-related products, services and activities. These classification methods have been integrated into the SEEA-Water, with which the UN-Water GLAAS TrackFin methodology is proposing to coordinate. The note also highlights areas for long-term methodological development where additional international standard classifications may need to be developed in order to better capture the nature of WASH activities to the level of detail that is relevant for policy-making. The health sector has adopted a similar process as it has developed its own policy-relevant system of classification. MN 1.1. Existing classifications of WASH services This section presents a list of the main existing international classification systems and identifies how they are capturing water, sanitation and hygiene activities. There are three main international systems of classification that can be used to categorise industries, activities, goods and services, as follows: Table MN 1.1. Summary of main international systems of classification of goods and services Classification Purpose Reference CPC Ver.2 Classifies goods and services to help answer the question: Table MN 1.2 (Central Product “what is being consumed?” Classification) ISIC REV.4 (International Standard Industrial Classification of All Economic Activities) Classifies service providers to help answer the question: “who provides those goods and services?” Table MN 1.3 COFOG (Classification of the Functions of Government) Classifies functions performed to ensure that these products are provided. There are also other functional classifications such as CEPA (Classification of environment protection activities), but they are less used. Table MN 1.4 The nature of these classifications is explained below, followed by an explanation of the codes that are most relevant to the WASH sector. CPC (Central Product Classification) is a system used in national accounts to classify all goods and services, based on their physical properties and intrinsic nature and on their industrial origin. A full list of CPCs that could potentially apply to WASH services is provided in Table MN 1.2 below. The main CPC codes that relate to water and sanitation are CPC 18000 (natural water) and CPC 94100 (Sewerage, sewage treatment and septic tank cleaning services). These are the water and sanitation-related CPCs which are directly consumed and produced by water and sanitation service providers (those that fall under the service provider categories of ISIC 36 and ISIC 37, as defined further below). They have been included on the first page of Table MN 1.2. In addition, however, other products need to be produced to enable service delivery to take place. These relate to construction industry-related products, such as sub-categories CPC 53200 (engineering works), CPC 54200 (general construction services of civil engineering works) or CPC 54340 (water well drilling and septic system installation services). In SEEA-Water, these products are not considered to be produced by the water and sanitation industry, but are still a crucial component of the activities that need to be undertaken to deliver sustainable water and sanitation services.
  • 54.
    Learning from SEEA-Water.SEEA-Water simplified standard tables identify only two of the products related to Water: CPC 18000 (natural water) and CPC 94100 (sewerage, sewage treatment and septic tank cleaning services). This might be because they track products that are produced by water and sanitation industries (ISIC 36 and 37) and deem that other products are produced by the construction industry. However, to track expenditure related to capital investments, it is essential to track water and sanitation-related construction services as well. The CPC classification identifies other water distribution related products that are important to track, such as water distribution on own account (CPC 69200) or the distribution of water not through mains (such as via trucks, as in CPC 86530). Finally, CPC 91123 is a very aggregated category that includes public administrative services related to housing and community amenities, which includes among many other services, public administrative services for water supply and sewage system operation. In sum, CPC is the internationally recognised classification of products and services. It is comprehensive and includes all economic activities, but the breakdown of activities in categories is not always adapted to the needs of WASH Accounts. For instance, sanitation and hygiene promotion are not clearly identified in separated categories (there is no CPC linked to those services in particular), although they may be aggregated in another “public service” categories with other non- WASH education activities. In addition, services provided by the government (i.e. public administrative functions) are classified on a very aggregated basis, which does not allow identifying specific functions of government. This classification provides the underlying basis for all classifications but needs to be complemented in some places by more specific classifications. For example, COFOG (the Classification of Functions of Government) goes into more detail in classifying government functions by purpose as its name indicates. In Table MN 1.2 below, we provide a list of CPC codes that directly relate to the provision of water and sanitation services. The description of what the code includes is directly extracted from the UN Statistics definition, whereas the column on the right includes our comments and potential issues regarding the applicability of these classifications for the development of WASH Accounts. 53
  • 55.
    54 Table MN1.2- CPC- Central Product Classification (Source: http://unstats.un.org/unsd/cr/registry/regcst.asp?Cl=25) CPC code Title What it includes Comments and issues about applicability for WASH Accounts 18000 Natural water This subclass includes: - potable and non-potable water, suitable for further use, including: · treated water (e.g., from desalination plants, water treatment plants) · untreated water (e.g., obtained directly from natural sources) This subclass also includes: - used water suitable for further use This subclass does not include: - sea water, cf. 16200 - steam and hot water, cf. 17300 - mineral waters containing added carbon dioxide, cf. 24410 - waters individually bottled as beverages, cf. 24410 - distilled water, cf. 34250 - sewage and other wastewater, i.e. water not suitable for further use, cf. 39990  This category does not allow distinguishing between potable and non-potable water  This category tracks water as a “product” but does not include the related distribution services, which are tracked through separate codes (such as CPC 86330 or CPC 86350) 94100 Sewerage, sewage treatment and septic tank cleaning services 94110 Sewerage and sewage treatment services This subclass includes: - sewage removal services usually provided using equipment such as waste pipes, sewers or drains - sewage treatment services using dilution, screening and filtering, sedimentation, chemical precipitation, etc. This subclass does not include: - collection or purification of water, cf. 18000 - construction, repair and alteration of sewers and sewer pipelines, cf. 54241, 54251 - distribution of water through mains on own account, cf. 69210 - distribution of water through mains on a fee or contract basis, cf. 86330 94120 Septic tank emptying and cleaning services This subclass includes: - emptying and cleaning of cesspools and septic tanks - servicing of chemical toilets 53200 - Civil engineering works
  • 56.
    55 CPC codeTitle What it includes Comments and issues about applicability for WASH Accounts 53231 Aqueducts and other water supply conduits, except pipelines This subclass includes: - aqueducts, water conduits and similar waterways designed to convey water for the purpose of water supply, except pipelines This subclass does not include: - waterworks for irrigation or flood control, cf. 53234 - long-distance pipelines, cf. 53241 - local pipelines, cf. 53251 This code corresponds to ISIC Rev.4 code(s) 4220 53233 Dams This subclass includes: - dams and similar water-retaining structures - embankments for coastal and other waterside areas This code corresponds to ISIC Rev.4 code(s) 4290  Expenditure related to dams should only be included to the extent that dams are mostly for water supply or expenditure could be apportioned relative to use. 53251 Local pipelines This subclass includes: - local gas pipelines and water and sewer mains - local hot-water and steam pipelines This code corresponds to ISIC Rev.4 code 4220 53253 Sewage and water treatment plants This subclass includes: - sewer systems - sewage disposal plants - water treatment and purification plants This subclass does not include: - pipelines and water and sewer mains, cf. 54241 (long-distance) and 54251 (local), respectively This code corresponds to ISIC Rev.4 code(s) 4220
  • 57.
    56 CPC codeTitle What it includes Comments and issues about applicability for WASH Accounts 54200 - General construction services of civil engineering works 54241 General construction services of long-distance pipelines This subclass includes: - construction, repair, alteration and restoration services for: · long-distance overland, underground and submarine pipelines for the conveyance of petroleum products, gas, water or other products · pumping stations and similar related structures This subclass does not include: - urban gas or water distribution systems through mains, cf. 53251 - trenching services, cf. 54330 This code corresponds to ISIC Rev.4 code 4220 54251 General construction services of local pipelines This subclass includes: - construction, repair and alteration services for: · local gas pipelines and water and sewer mains · local hot-water and steam pipelines This subclass does not include: - trenching services, cf. 54330 This code corresponds to ISIC Rev.4 code 4220 54253 General construction services of sewage and water treatment plants This subclass includes: - construction, repair, alteration and restoration services for: · sewage disposal plants · water treatment and purification plants This subclass does not include: - construction services of pipelines and of water and sewer mains, cf. 54241 (long-distance) and 54251 (local), respectively This code corresponds to ISIC Rev.4 code(s) 4220
  • 58.
    57 CPC codeTitle What it includes Comments and issues about applicability for WASH Accounts 54340- Water well drilling and septic system installation services 54341 Water well drilling services This subclass includes: - special trade construction services involving drilling or digging water wells - installation services of water well pumps and well piping systems This code corresponds to ISIC Rev.4 code(s) 4220 54342 Septic system installation services This subclass includes: - installation services of septic systems, including: · aerobic septic systems · evaporation-transpiration (ET) septic systems · greywater systems · holding tank septic systems · pressure dosing septic systems · septic disinfection systems · chemical, composting, incinerating & waterless toilets This subclass also includes: - construction services of leach fields or drainfields This code corresponds to ISIC Rev.4 code(s) 4220 69200- Water distribution (on own account) 69210 Water distribution through mains, except steam and hot water (on own account) This subclass includes: - own-account distribution of water through mains - maintenance of water meters This subclass does not include: - installation of water meters, cf. 54611 - reading of water meters, cf. 85999 - operation of irrigation systems for agricultural purposes, cf. 86119 - water distribution services through mains (on a fee or contract basis), cf. 86330  It is not clear whether this applies mostly to industrial own uses or whether it would also include own provision by households or by communities to community members. For example, if a community sets up a piped community water scheme, it would be important to clarify whether those services would be included in here. 69230 Water distribution, except through mains (on own account) This subclass includes: - own-account distribution of water by trucks and other means This subclass does not include: - operation of irrigation systems for agricultural purposes, cf. 86119 - water distribution services, except through mains (on a fee or contract basis), cf. 86350 - This code corresponds to ISIC Rev.4 code(s) 3600
  • 59.
    58 CPC codeTitle What it includes Comments and issues about applicability for WASH Accounts 86300- Support services to electricity, gas and water distribution 86330 Water distribution services through mains (on a fee or contract basis) This subclass does not include: - water distribution services through mains on own account, cf. 69210 - operation of irrigation systems for agricultural purposes, cf. 86119  The content of this category is not entirely clear 86350 Water distribution services, except through mains (on a fee or contract basis) This subclass includes: - water distribution services except through mains, e.g., distribution by trucks This subclass does not include: - transport of water by trucks (without distribution), cf. 65119 - water distribution services by trucks etc. on own account, cf. 69230 - operation of irrigation systems for agricultural purposes, cf. 86119  It would be important to clarify whether small-scale private delivery of water to households by trucks would be included in this category. 91123 Public administrative services related to housing and community amenities This subclass includes: - public administrative services related to housing and overall community development, water supply, sanitation and street lighting - public administrative services related to the development, monitoring and evaluation of housing and housing standards (other than construction standards) - public administrative services related to rent control and eligibility standards for state-subsidized housing - public administrative services related to housing for the general public or for people with special needs - dissemination of public information about housing - services provided by government offices, bureaux, departments and programme units involved in developing and administering regulations concerning water supply - public administrative services related to refuse collection and disposal, sewage system operation and street cleaning - public administrative services related to pollution standards, including the dissemination of information regarding pollution This subclass does not include: - waste collection and disposal services, cf. 942, 943 - sewerage and sewage treatment services, cf. 94110  This category of public administrative services does include services related to water and sewage but this category is very aggregated. It would therefore need to be disaggregated through combining with other statistical classification systems.
  • 60.
    ISIC (International StandardIndustrial Classification of All Economic Activities) is a United Nations system for classifying economic data according to types of economic activities. The activity carried out by a unit is the type of production in which it engages. An “industry” is defined as a set of production units engaged primarily in the same or similar kind of productive economic activity. This classification examines only the type of activities undertaken and does not distinguish who performs them by legal status (i.e. whether the producers are governmental, non-governmental or private). Two main categories relate to WASH activities:  ISIC class 36 (collection, treatment and supply of water); and  ISIC class 37 (sewerage). These two categories of activities are the ones that are used by SEEA-Water in their Economic Accounts. However, they do not capture the full range of activities involved in providing access to water and sanitation services. ISIC 36 and 37 are service oriented: they do not include activities related to:  The construction of WASH infrastructure and equipment such as pipelines and sewerage network, water abstraction and storage facilities, sanitation facilities, water utilities, and sewerage and waste water treatment plants (ISIC 42);  Water resources management;  Activities linked to government collective activities (ISIC 84). These are considered as goods and services required for delivering water and sanitation services (ISIC 36 and 37). As such, they are taken into account in the SEEA-Water Economic Accounts as intermediate consumption or fixed capital formation, as appropriate. In addition, the activities linked to government collective activities are all aggregated in ISIC 84. As a result, government activities that specifically relate to the water and sanitation sector cannot be separated out. There are a number of issues with these classifications. ISIC 36 does not allow separating water provided for domestic use from water provided for industrial use or for irrigation canals. In addition, ISIC 37 does not explicitly include faecal sludge management or hygiene promotion. Finally, whereas ISIC 84 refers to the management of water supply programmes, it specifically excludes the management of sanitation programmes, even though these would need to be clearly identified separately from the provision of sewerage and sewage treatment services. Table MN 1.3 below presents a summary of the ISIC codes that are likely to be relevant for the elaboration of WASH Accounts, with a summary of the main comments on these categories. 59
  • 61.
    60 Table MN1.3 - ISIC- International Standard Industrial Classification Source: http://unstats.un.org/unsd/cr/registry/regcst.asp?Cl=27&Lg=1 ISIC code Title What it includes Comments and issues about applicability for WASH Accounts 3600 Water collection, treatment and supply This class includes water collection, treatment and distribution activities for domestic and industrial needs. Collection of water from various sources, as well as distribution by various means is included. The operation of irrigation canals is also included. However the provision of irrigation services through sprinklers, and similar agricultural support services, is not included. This class includes: ‐ collection of water from rivers, lakes, wells etc. ‐ collection of rain water ‐ purification of water for water supply purposes ‐ treatment of water for industrial and other purposes ‐ desalting of sea or ground water to produce water as the principal product of interest ‐ distribution of water through mains, by trucks or other means ‐ operation of irrigation canals This class excludes: ‐ operation of irrigation equipment for agricultural purposes, see ISIC 0161 treatment of wastewater in order to prevent pollution, see ISIC 3700 (long-distance) transport of water via pipelines, see ISIC 4930 This class does not allow separating out water supply for domestic uses (at least at an aggregate level). Doing so would require excluding: - treatment of water for industrial and other purposes - operation of irrigation canals. This class is focused on activities relating to service provision but does not include the construction of the infrastructure necessary to provide those services. This is because, in the ISIC logic, the construction of water and sewerage infrastructure is assumed to be the responsibility of construction companies (for which construction is the primary purpose) and not of the industries in charge of providing water and sanitation services. There are limitations to this approach, however:  Water and sewerage service providers may choose to build at least part of the infrastructure themselves;  Infrastructure building costs (gross capital formation) need to be included in the WASH Account exercise, as they represent a significant proportion of costs. 3700 Sewerage This class includes: - Operation of sewer systems or sewer treatment facilities - Collecting and transporting of human or industrial wastewater from one or several users, as well as rain water by means of sewerage networks, collectors, tanks and other means of transport (sewage vehicles etc.) - emptying and cleaning of cesspools and septic tanks, sinks and pits from sewage; servicing of chemical toilets - treatment of wastewater (including human and industrial wastewater, water from swimming pools etc.) by means of physical, chemical and biological processes like dilution, screening, filtering, sedimentation etc. - maintenance and cleaning of sewers and drains, including sewer rodding  Although this class is called “sewerage", it does include on-site sanitation activities (emptying and cleaning of cesspools and septic tanks).  Although there is a clear reference to transport of faecal sludge, it is not clear whether treatment of faecal sludge is also included  Hygiene services are not explicitly included in here
  • 62.
    61 ISIC code Title What it includes Comments and issues about applicability for WASH Accounts 4220 Construction of utility projects This class includes the construction of distribution lines and related buildings and structures that are integral part of these systems. This class includes: - construction of civil engineering constructions for: · long-distance pipelines, communication and power lines · urban pipelines, urban communication and power lines; ancillary urban works · water main and line construction · irrigation systems (canals) · reservoirs - construction of: · sewer systems, including repair · sewage disposal plants · pumping stations · power plants - water well drilling This class excludes - project management activities related to civil engineering works, see ISIC 7110 8412 Regulation of the activities of providing health care, education, cultural services and other social services, excluding social security This class includes public administration of programmes aimed to increase personal well-being: health, education, culture, sport, recreation, environment, housing, social services. This class specifically includes: ‐ administration of potable water supply programmes - administration of waste collection and disposal operations - administration of environmental protection programmes - administration of housing programmes This class excludes: - sewage, refuse disposal and remediation activities, see ISIC 37, 38, 39 - compulsory social security activities, see ISIC 8430 human health-related activities, see ISIC division 86  This class aggregates the administration of very different public programmes, including the administration of potable water supply programmes but excluding sewage activities. As such, it is unlikely to provide sufficient detail on support functions carried out by Governments, which is where using the COFOG classification can provide additional detail. In countries where a COFOG classification is not applied, using this broader category might be considered for constructing WASH Accounts.  This class excludes the administration of sewage and sanitation programmes, even though public programmes need to be developed independently from the provision of the services themselves.
  • 63.
    COFOG (Classification ofthe Functions of Government) is a classification of expenditure by the Government according to purpose. It classifies transactions, such as outlays on final consumption expenditure, intermediate consumption, gross capital formation and capital and current transfers by the Government according to the function that the transaction serves. These COFOG categories allow breaking down further the broad ISIC category in which water supply and sewage administration are included, i.e. ISIC 8412 (Public Administration). Four COFOG categories relate to water management in general and are used as such in SEEA-Water: waste water management, soil and ground water protection, environmental protection not elsewhere classified, and water supply. These COFOG categories refer to collective services of government (formulation and administration of government policy, the setting and enforcement of public standards, the regulation, licensing or supervision of producers, etc., as in the case of education and health). The categories COFOG 05.2 and 06.3 should not be confused with activities of “sewerage” and “water collection, treatment and supply”, classified under ISIC divisions 37 and 36, respectively, which are considered to be individual services as opposed to collective services. Table MN 1.4. below presents a summary of the COFOG codes that are likely to be relevant for the elaboration of WASH Accounts, with a summary of the main comments on these categories. Other classifications of government activities for environmental protection have been developed and could potentially be referred to. For example, CEPA (Classification of Environmental Protection Activities) was developed by Eurostat in cooperation with the United Nations to classify environmental protection activities, environmental protection products and expenditures for environmental protection. These environmental protection activities are production activities in the sense of the SNA as they combine resources, such as equipment, labour, manufacturing techniques and information network or products in order to create an output of goods or services. In the case of water, CEPA includes “waste water management” and “protection and remediation of soil, ground water and surface water”. SEEA-Water uses the CEPA definition of wastewater management to classify expenditure for activities and measures aimed at preventing the pollution and protection of water through reductions in the release of wastewater into inland surface water and seawater. As a CEPA category does not exist for water management and exploitation, SEEA-Water has created this classification, which corresponds to ISIC 36 and part of ISIC 84. However, according to the UN department of statistics, this classification is not really used in developing countries. We therefore do not recommend that specific references be made to this classification. Finally, “Classifications of Expenditure According to Purpose” might be useful in some cases (and are referred to by the System of Health Accounts). These are primarily designed to classify transactions undertaken by households, non-profit institutions serving households (NPISHs), government and producers that result in payables. They are used in the System of Health Account to define the classifications of the functions of health care (ICHA-HC), health providers (ICHA-HP) and the factors of provision (ICHA-FP). COICOP is used to classify only a single kind of outlay, which is the individual consumption expenditures of households, NPISHs and general government. Three classes of purposes relate to the WASH sector: 62  Class 01.2.2: Mineral waters, soft drinks, fruit and vegetable juices  Class 04.4.1: Water supply  Class 04.4.3: Sewage collection COPP is used to classify intermediate consumption and capital outlays of mainly non-financial and financial corporate enterprises. Only one class is related to the WASH sector:  Class 03.2.0: Outlays on wastewater management (as defined in CEPA Class 2) COPNI is used to classify a range of transactions, including outlays on final consumption expenditure, intermediate consumption, gross capital formation and capital and current transfers, by NPISHs. There are no classes relates to water.
  • 64.
    63 Table MN1.4 - COFOG (Classification of the Functions of Government) Source: http://unstats.un.org/unsd/cr/registry/regcst.asp?Cl=4 COFOG code Title What it includes Issues about applicability for WASH accounts 5 Environmental protection 5.2 Waste water management This group covers sewage system operation and waste water treatment. Sewage system operation includes management and construction of the system of collectors, pipelines, conduits and pumps to evacuate any waste water (rainwater, domestic and other available waste water) from the points of generation to either a sewage treatment plant or to a point where waste water is discharged to surface water. Wastewater treatment includes any mechanical, biological or advanced process to render waste water fit to meet applicable environment standards or other quality norms.  This category includes both construction and management of the sewage system operation and wastewater treatment. 5.3 Pollution abatement This group covers activities relating to ambient air and climate protection, soil and groundwater protection, noise and vibration abatement and protection against radiation. These activities include construction, maintenance and operation of monitoring systems and stations (other than weather stations); construction of noise embankments, hedges and other anti-noise facilities including the resurfacing of sections of urban highways or railways with noise reducing surfaces; measures to clean pollution in water bodies; measures to control or prevent the emissions of greenhouse gases and pollutants that adversely affect the quality of the air; construction, maintenance and operation of installations for the decontamination of polluted soils and for the storage of pollutant products; transportation of pollutant products. It includes : -Administration, supervision, inspection, operation or support of activities relating to pollution abatement and control; - grants, loans or subsidies to support activities relating to pollution abatement and control.  The component relative to cleaning pollution in water bodies is only a small sub-set of this broader category.
  • 65.
    64 COFOG codeTitle What it includes Issues about applicability for WASH accounts 5.6 Environmental protection (not elsewhere classified) This group includes : - Administration, management, regulation, supervision, operation and support of activities such as formulation, administration, coordination and monitoring of overall policies, plans, programmes and budgets for the promotion of environmental protection; preparation and enforcement of legislation and standards for the provision of environmental protection services; production and dissemination of general information, technical documentation and statistics on environmental protection. Includes: environmental protection affairs and services that cannot be assigned to (05.1), (05.2), (05.3), (05.4) or (05.5).  This is a very broad category which might make it difficult to specifically identify activities that relate to water and sanitation. 6 Housing and community amenities 6.3 Water supply This group includes : -Administration of water supply affairs; assessment of future needs and determination of availability in terms of such assessment; supervision and regulation of all facets of potable water supply including water purity, price and quantity controls; - construction or operation of non-enterprise-type of water supply systems; - production and dissemination of general information, technical documentation and statistics on water supply affairs and services; - grants, loans or subsidies to support the operation, construction, maintenance or upgrading of water supply systems. It excludes: irrigation systems (04.2.1); multi-purpose projects (04.7.4); collection and treatment of waste water (05.2.0).  The category "construction or operation of non-enterprise-type of water supply systems" is not necessarily clear  With regard to grants, loans or subsidies, it is not clear whether the amounts included include only the administration charges or the grants and subsidies themselves
  • 66.
    MN 1.2. Summaryevaluation: the potential use of existing classifications for 65 the development of WASH Accounts Existing classifications are not always adequate to capture the reality of the WASH sector and answer policy questions. CPC categories are too infrastructure based and ISIC categories do not explicitly include some services that are essential in developing countries such as faecal sludge management. Therefore in the short term, we recommend using a list of water and sanitation services as proposed in this methodology for the purpose of tracking financing to WASH (See Table 1). It reflects the main activities alongside the WASH value chain, with the main caveat that these activities primarily relate to water and sanitation and do not adequately reflect hygiene. However, we recognise that there is an important advantage in relying on existing international classifications: It may ease data collection and allow greater comparability of data across countries, assuming that countries apply those classifications in a standard manner. Table MN 1.6. below presents the categories proposed in this methodology to build WASH Accounts and the correspondences with international classifications. Water Resource Management activities that are directly relevant to water and sanitation services provision (S4 as per our proposed classification) are not explicitly mentioned as a separate category in CPC, ISIC, and COFOG, which is why no correspondence is proposed on Table MN 1.6. below. In the longer term, we would encourage the WASH international community to examine whether a revised and more disaggregated international standard classification of WASH services would be needed in order to more closely match the sector’s analytical and policy needs. A long-term objective may entail setting up a more disaggregated international classification of WASH sector functions and services that can be aggregate up to the existing ISIC classification. If this long-term objective was pursued, we have identified the following issues with the existing classifications that would need to be addressed:  Some countries have developed their own classifications based on the international ones and coherence between those different classifications is not always guaranteed;  Some categories aggregate several services and it may difficult to separate out data;  The detail on support services (usually provided by the Government) is rather limited. Usually, the following types of sector support activities need to be provided, as shown on the Table below. These activities are alluded to in international classifications but not specifically identified. Table MN 1.5 - WASH sector support activities  Develop sector policies and programmes  Sector planning, including estimating future sector financial needs  Reform water sector management  Mobilize financial resources and structure investment projects  Carry out tariff reforms  Regulate service providers  Protect water resources necessary for drinking-water supply (e.g. establish catchment protection zones, establish and enforce voluntary agreements, establish regulations)  Define and enforce drinking-water and discharge standards for municipal wastewater  Conduct sanitation promotion and hygiene promotion campaigns Feedback from the testing studies will be essential to identify how data is classified at country level (particularly at the level of statistical offices), whether it is possible to use the classification proposed in this document or whether it would be preferable to use international standard classifications (ISIC, CPC etc.). Feedback will also be sought on whether modifications to the existing international classifications might be needed. To this end, we have included in the steps of the methodology specific questions where feedback from the national WASH Account teams will be sought.
  • 67.
    66 Table MN1.6 - Correspondences between CPC, ISIC and COFOG classifications along the water and sanitation value chain Value chain CPC (Central Products Classification) ISIC (International Standard Industrial Classification) COFOG Products and Services ISIC code and description What it includes Purpose of the expenditure Water supply services (S1) 53233 Dams 4290 Construction of other civil engineering projects 53231 Aqueducts and other water supply conduits, except pipelines 4220 Construction of utility projects 54341 Water well drilling services Water well drilling and septic system installation services 18000 Natural water 3600 Water collection, treatment and supply Collection of rain water and water from various sources, from rivers, lakes, wells Purification of water for water supply purposes Desalting of sea or ground water to produce water as the principal product of interest 69210 Water distribution through mains, except steam and hot water (on own account) Distribution of water through mains 86330 Water distribution services through mains (on a fee or contract basis) 69230 Water distribution, except through mains (on own account) Distribution of water by trucks or other means 86350 Water distribution services, except through mains (on a fee or contract basis) Sanitation services (S2) 54342 Septic system installation services 4220 Construction of utility projects Water well drilling and septic system installation services 94120 Septic tank emptying and cleaning services 3700 Sewerage Collection of sewage by sewer systems or sewage treatment facilities
  • 68.
    67 Value chainCPC (Central Products Classification) ISIC (International Standard Industrial Classification) COFOG Products and Services ISIC code and description What it includes Purpose of the expenditure 94110 Sewerage and sewage treatment services Treatment and disposal of sewage by sewer systems or sewage treatment facilities Unallocated construction activities (for both water and sanitation services) ( S1 and S2) 53251 Local pipelines (water and sewerage) 4220 Construction of utility projects Construction of pipelines and long distance transport of water and sewage 53253 Sewage and water treatment plants Construction of sewage disposal plants 54241 General construction services of long-distance pipelines Construction of pipelines and long distance transport of water and sewage 54251 General construction services of local pipelines Construction of pipelines and long distance transport of water and sewage 54253 General construction services of sewage and water treatment plants Support services (S3) 91123 Public administrative services related to housing and community amenities 8412 Regulation of the activities of providing health care, education, cultural services and other social services, excluding social security Public administration of programmes aimed to increase personal well-being: health, education, culture, sport, recreation, environment, housing, social services This class includes: - administration of potable water supply programmes - administration of waste collection and disposal operations 5.2 Waste water management 6.3 Water supply
  • 69.
    Methodological Note No2: Developing classifications of WASH actors and financing sources Objectives. This note complements and provides the rationale for the guidance provided in Section 2.2. of the main guidance document. The note highlights the importance to clearly define and identify WASH sector actors (including WASH uses, service providers and financing units) and the main financing sources. Some of these categories warrant a full classification that can be used across countries in a comparable manner and later on used by statistical offices in order to compile the necessary data on an ongoing basis. Others (such as financing units) do not as they would vary substantially from country to country. This note is based on information on existing internationally-accepted methods of classification for water actors and financing sources. It especially looks at the classifications used by SEEA-Water on which the UN-Water GLAAS TrackFin methodology is proposing to build upon and at the OECD 3Ts classification of financing sources. The note highlights potential issues with existing classification and formulates recommendations on the classifications that can be used across countries for the development of WASH Accounts. This note provides additional rationale for definitions underlying the classifications of WASH actors and financing sources as briefly defined in the table below. 68 Table MN 2.1- Classifications of WASH uses, actors and financing sources Classifications Definition Uses Types of use of WASH goods and services (domestic served or self-provided, industrial and commercial, institutional etc.) WASH sector actors: Service providers Actors engaged in the production and delivery of WASH services. These would include government institutions providing support services to the sector. Financing units Institutional entities that provide funding to the sector. They mobilise funding to pay for WASH services. They may allocate funds directly to service providers or channel them through intermediary institutions. Financing sources Where funding originates from: what the OECD commonly refers to as the 3Ts (as tariffs, taxes and transfers) and for which we are proposing a modified classification (see Table MN 2.7) MN 2.1. Classifying WASH service uses Classifying WASH service uses is important because, although the GLAAS report (and this WASH Accounts methodology) is proposing to focus on domestic use, separating out information that relates to domestic uses from the rest (i.e. use of water and sanitation services for industrial, commercial, institutional and in some cases, agricultural purposes) might be challenging. Therefore a classification of WASH service uses can provide a useful tool for conducting this type of analysis. The proposed WASH Accounts classification of WASH service uses is set out in Table MN 2.3. Countries can also define their own sub-categories of WASH service uses with an added level of detail in order to meet their own policy needs.
  • 70.
    69 Table MN2.2 - Proposed WASH Accounts classification of WASH Service uses WASH service uses Proposed definition U1 Served domestic use Consumption of served water and sanitation services by households that are served by service providers and pay for the service via a tariff. This would include water supply to households that are connected to the water and/or sewerage network, but also water fetched from a public stand pipe or other providers (e.g. water tankers). U2 Self-provided domestic use Consumption of self-provided water and sanitation services by households. Households have to pay up-front an initial investment (in a well or private latrine) to have access to the service and then need to cover operating and maintenance costs of their assets. U3 Served institutional use Consumption of served water and sanitation services by government agencies (such as Ministries, hospitals, schools, etc.) and voluntary organisations such as NGOs, CBOs or foundations. They are served by service providers and pay for the service via a tariff. U4 Self-provided institutional use Consumption of self-provided water and sanitation services by government agencies (such as Ministries, hospitals, schools, etc.) and voluntary organisations such as NGOs, CBOs or foundations. They pay up-front an initial investment to have access to the service and then need to cover operating and maintenance costs of their assets. U5 Served industrial and commercial use Services used by commercial entities that are purchasing water and sanitation services from a service provider at the industrial or commercial tariff. U6 Self-provided industrial and commercial use Consumption of self-provided water and sanitation services by industrial or commercial entities Focusing on “uses” rather than “users” We are proposing to track financing by types of uses rather than users. The main reason for this is that users cannot always be attributed to a single category. For example, domestic users might get water from multiple sources, including through self-provided sources or different types of providers (networked or non-networked). As a result, those users would invest in their own systems (e.g. a water well) but also pay a tariff to obtain piped water supplies. It is therefore difficult to define “user categories” that can capture such multiple modes of access to water services. However, it is essential for the WASH Accounts to capture information relative to different financial allocations to these types of uses. Defining categories of “uses” rather than of users allows overcoming such difficulties. The key criteria to distinguish “uses” will be to rely on the types of tariff applied to them based on each country's system. If a use is paid for based on the “institutional tariff” then it would be counted under “institutional use”. In order to interpret the data, it would be useful to complement it with coverage data showing how many households are concerned by different types of uses. Distinguishing between “served” and “self-provided” domestic uses An important distinction is between services used by domestic users that are connected to network supplies and those that need to self-provide the services (calling on the services from a range of non-networked service providers). This is because it would be useful to track the extent to which costs and expenditures are different for these types of uses. However, data may be difficult to disaggregate in order to make that distinction in practice.
  • 71.
    Learning from SEEA-Waterclassification of WASH service users In order to define a relevant classification, it is useful to refer to the way in which SEEA-Water classifies water users, as set out below, based on the ISIC classification system (see Table MN1.3. for more detail on the ISIC classification system). SEEA-Water defines service users rather than uses. Table MN2.1. below presents a summary of how WASH service users are classified in the SEEA-Water methodology. 70 Table MN 2.3 - Classification of water services users in SEEA-Water Categories of water services users in SEEA-Water Explanation and correspondence  Specialized producers: (intermediate consumption) - ISIC 36 water Producers - ISIC 37 sewerage services Producers  ISIC 36 and ISIC 37 producers may those services for their own use  Other Producers (ISIC 1-3, 5-33,41-43, 35, 38, 39, 45-99) (intermediate consumption)  These would include producers invo types of activities which consume w sanitation for industrial or commerc  Households  Domestic use  General Government - can be disaggregated into central and local government  Institutional use  Rest of the world  International users: with respect to w and sanitation, these would not be r MN 2.2. Classifying WASH service providers Classifying WASH service providers is important to analyse which type of providers receive funding (and from where) and how they spend these funds. In addition, WASH service providers often hold information on costs of water services, so identifying WASH service providers is key to identifying where cost data might be held. SEEA-Water classifies producers “into relevant ISIC categories, regardless of the kind of ownership, type of legal organization and mode of operation. Therefore even when activities for water collection treatment and supply (ISIC 36) and sewerage (ISIC 37) are carried out by the government, they are classified to the extent possible in the specific division (ISIC 36 and 37).” It also presents in separate tables the production of water and sewerage services self-provided by households and water related collective consumption services by the general government. Table MN 2.4. presents the different categories of water service providers used in SEEA-Water. Table MN 2.3 - Classification of Water service providers in SEEA-Water Categories of water service providers  Specialized producers: - ISIC 36 water Producers - ISIC 37 sewerage services Producers  Other Producers (ISIC 1-3, 5-33,41-43, 35, 38, 39, 45-99)  Households (as producers for own use)  General Government (as producer of water related collective consumption services) - can be disaggregated into central and local government This classification of service providers was used as a basis for the definition of categories of WASH service providers for the purpose of the WASH accounts, as set out in Table MN 2.4 below. This classification can be used for both water and sanitation providers in two separate tables.
  • 72.
    71 Table MN2.4 - WASH Accounts classification of WASH service providers WASH service providers Definition P1 Government agencies Providers that are integrated in government. This would include government agencies (such as Ministries, hospitals, schools, etc) as well as municipalities (operating the service directly rather than through a corporatized entity). P2 Network corporate providers Utilities that own and/or operate facilities for production and distribution of water and sanitation services through network systems for the public, as well as for bulk services. They can be either privately or publicly owned, mandated or independent, large, medium or small-sized, providing a public service or self-providing the service for their own use. P3 Non-network corporate providers Corporations that provide any WASH good or service through non-network systems. They usually involve low skilled labour and small level of initial investments. They can take various organisational forms, from cooperatives to private ventures, and be formal or informal. P4 NGOs and community-based organizations Non-profit making organisations that seek to complement WASH public services. They usually have a formal structure and offer services to people other than their members, and are, in most cases, registered with national authorities. Community-based organizations (CBOs) are a type of small NGOs that aim to mobilize, organize or empower their members, usually in a local area. P5 Households (self-provision) Households that self-provide the service. They have to pay up-front an initial investment (in a well or private latrine) to have access to the service and then need to cover operating and maintenance costs of their assets. The classification focuses on the type of institutional sector that owns them (government, corporation or household). Depending on policy needs, countries could introduce additional criteria to characterise service providers such as: public or private, formal or informal, size of the utility, mandated or independent etc. Where corporate providers are self-providing and not serving domestic customers, this should be noted specifically and potentially excluded from overall figures. It is critical to include households as self-providers. In a large number of cases for instance, there is no formal sanitation service provider. As a result, households invest in on-site sanitation solutions and maintain those installations themselves (“self-supply”). Thus, households’ expenditures on self-supplied sanitation in particular accounts for a large part of sanitation services and therefore need to be clearly identified in the classification. Countries are encouraged to use the proposed classification to the extent that it is possible even though it might be difficult to obtain data on certain categories of producers (such as self-supply from households). They could prioritize data collection for the more relevant types of providers depending on their importance and weight in the WASH services supply market. MN 2.3. Classifying WASH financing units It is important to identify where the money is ultimately coming from, i.e. from which type of actor. Financing units are defined as the institutional entities that provide funding to the sector. They mobilise funding to pay for WASH services. They may allocate such funding directly to service providers or channel it to the sector through other financing units, who act as intermediary institutions by pooling and distributing funding to the sector.
  • 73.
    To identify sourcesof financing, SEEA-Water identifies the “financing sectors” (as the entities actually bearing the cost) and characterises them by type of ownership, including: General Government (which can be disaggregated between central and local government); Non-for-profit institutions serving households; Corporations; Households; Rest of the world. These financing sectors are shown in Table MN2.6. below.2 72 Table MN 2.5 - Classification of Water financing sectors in SEEA-Water Categories of Financing sectors  General Government - It can be disaggregated into central and local government  Not-for-profit institutions serving households  Corporations - Specialized producers: (ISIC 36 water Producers; ISIC 37 sewerage services Producers) - Other Producers (ISIC 1-3, 5-33,41-43, 35, 38, 39, 45-99)  Households  Rest of the world In the same way, we propose classifying financing units by type of institutional sectors as this might be the most relevant information to answer policy questions on the origins and channels of funds received by service providers. The proposed classification for WASH financing units is presented in Table MN 2.6 below. Table MN 2.6 - WASH Accounts classification of WASH financing units Financing units Definition FU1 National authorities Public authority at central government level, including Ministries (ministry of finance, ministry of water or other ministries) or national institutions FU2 Regional authorities Public authority operating at the regional level (or any other intermediary level between national and local government) FU3 Local authorities Public body operating at the level of a smaller geographic area, such as a city, town, or a district, depending on the country’s administrative structure FU4 Network corporate providers Utilities that own and/or operate facilities for production and distribution of water and sanitation services through network systems for the public, as well as for bulk services. They can be either privately or publicly owned, mandated or independent, large, medium or small-sized, providing a public service or self-providing the service for their own use. FU5 Non-network corporate providers Corporations that provide any WASH good or service along the value chain at a small scale through non-network systems. They usually involve low skilled labour and small level of initial investments. They can take various organisational forms from cooperatives to private ventures, and be formal or informal. FU7 Bilateral and multilateral donors Governments providing official development assistance directly to a country or through multilateral international institutions (UN, World Bank or regional development banks) FU8 Banks and financial Institutions A financial institution that provides banking services, such as taking deposits and providing credit facilities and loans to individuals and/or 2 Additional detail on how this data is used in the SEEA-Water accounts is provided in Annex B.
  • 74.
    73 Financing unitsDefinition small businesses and corporations. FU9 NGOs and community-based organizations Non-profit making organisations that seek to complement WASH public services. They usually have a formal structure and offer services to people other than their members, and are, in most cases, registered with national authorities. Community-based organizations (CBOs) are a type of small NGOs that aim to mobilize, organize or empower their members, usually in a local area. FU10 Households (for investments in self-provided services) Households that self-provide the service (such as on-site sanitation). They either pay up-front through initial investments (in a well or private latrine) or purchase services from a variety of providers (e.g. water tankers). MN 2.4. Classifying WASH financing sources Next, it is important to identify what the “financing sources” for the sector are, i.e. the type of financial flows that are mobilised to fund the sector and where they are coming from. To identify typologies of financing sources, it is useful to refer to previous work in this area, from within the water sector and based on the SNA. Existing classification systems have their strengths and weaknesses, which is why we have proposed a consolidated classification of WASH financing sources to be used for WASH accounts, as set out below. WASH sector financing sources according to the OECD: the 3Ts Since the Camdessus report on water financing (Winpenny, 2003), the water sector has been referring to three main sources of finance for the water sector as the “3Ts”, i.e. tariffs, taxes and transfers, to which must be added repayable financing sources. The way in which these sources of finance can be combined to cover the costs of water service provision has been summarised by the OECD in the Figure MN 2.1. below (OECD, 2010).
  • 75.
    74 Figure MN2.1 - Sources of finance for the WASH sector Source: (OECD, 2010), Innovative financing mechanisms for the water sector The OECD defines these sources of finance as follows:  “Tariffs” are funds contributed by users of WSH services for obtaining the services. Users generally make payments to service providers for getting access to the service and for using the service. When the service is self-provided (for example, when a household builds and operates their household latrine), the equity invested by the household (in form of cash, material or time - “sweat equity”) would also fall under “tariffs”.  “Taxes” refer to funds originating from domestic taxes which are channelled to the sector via transfers from all levels of government, including national, regional or local. Such funds would typically be provided as subsidies, for capital investment or operations. “Hidden” forms of subsidies may include tax rebates, soft loans (i.e. at a subsidised interest rate) or subsidised services (such as subsidised electricity).  “Transfers” refer to funds from international donors and charitable foundations (including NGOs, decentralized cooperation or local civil society organizations) that typically come from other countries. These funds can be contributed either in the form of grants, concessionary loans (i.e. through the grant element included in a concessionary loan, in the form of a subsidised interest rate or a grace period) or guarantees. Due to the capital-intensive ‘lumpy’ nature of WASH sector investments (with relatively large investments with a long asset-life), it is seldom possible to finance all necessary investments up-front. If additional financing cannot be raised, either by reducing costs or by increasing the 3Ts, it is
  • 76.
    standard practice forthe financing gap to be “bridged” via a mix of repayable financing sources, which may include the following:3 - Bank loans, including commercial finance, microfinance and concessionary loans (i.e. loans from donors that would include a grant or transfer element in the form of an interest rate below market rate or a grace period, for example); - Equity provided by investors with the expectation that such equity can be repaid and would earn a rate of return on the capital invested. In going concerns, equity may be provided over very long periods of time and may therefore not be repaid. A hidden form of public subsidy (or transfer) may consist of making an equity investment with no expectation of a repayment or a return; - Other financial instruments, such as bonds, whereby a debt title is sold in the market to a large group of bond investors. Bond issuers may include municipalities (i.e. “municipal bonds”) or public and private companies (“corporate bonds”). Evaluation of the relevance of the OECD 3T typology for the WASH Accounts The OECD 3T typology is relevant to WASH Accounts in the sense that it categorises the flows of funding according to their origin and to their nature (for example, distinguishing between revenues from the service and external subsidies). Referring to this terminology can be an advantage as it has become well known and accepted in the sector over the recent years, where it has been useful to convey in simple terms a number of key concepts about WASH sector financing, such as the idea that full-cost recovery from tariffs should not be the only objective and that sustainable cost recovery from a mix of the 3Ts could be a good alternative objective. However, concerns regarding this typology have been raised in previous consultations with sector stakeholders, as summarised below:  Some have expressed that this typology is mainly known amongst international organizations and External Support Agencies (donors, NGOs etc.); its appropriation by developing country actors is still in progress.  The terminology used can be confusing in the context of some developing countries. As the WASH Accounts are meant to be used by policy makers it would be important that the terminology of the classifications is straight forward and easily understood without allowing for any interpretation. Specific concerns have been raised about the 3T terminology and how it may introduce confusion. These concerns are set out below:  The term “Tariff” is understood in common language as the tariff paid by users to utilities. However the OECD typology includes in this category payments made by households for self-provision. These two types of funds are substantially different, with different data sources. Thus we would recommend separating the two types of financing sources out if possible, under the overall category of tariffs (which could be renamed as “household expenditure for self-supply”).  The OECD typology includes under the item “Transfer” “funds from international donors and charitable foundations (including NGOs, decentralized cooperation or local civil society organizations) that typically come from other countries”. However, in several countries (such as India or many Latin American countries), the term “transfer” is often used to refer to central government budget that is allocated to local governments in decentralised settings. This is part of what the OECD’s terminology refers to as “taxes”, although this term is relatively vague and may be misunderstood by developing countries’ governments. Therefore given the interpretations that could arise around the terminology we recommend adapting the terminology of the OECD typology of financing sources for the purpose of preparing the WASH Accounts. A revised classification is suggested in Table MN2.7. below. To derive this revised 3 For large, capital intensive service providers individual loans may be repaid but the total debt level may not reduce as loans are 'rolled-over' or renewed to maintain the same balance between debt and equity finance. 75
  • 77.
    classification, it wasalso useful to examine in detail and learn from the SEEA-Water typology of financing sectors, as set out below. WASH sector financing sources according to SEEA-Water: financing units and sectors Analysis of the financing sectors identified by SEEA-Water (Table MN 2.5 above) have helped us identify categories of financing sources that are not explicitly considered by the OECD 3T terminology, such as transfers from Not-for-profit institutions serving households (which might be in kind or in cash, and may originate from domestic voluntary sources as opposed to only international transfers) as well as international transfers from the rest of the world which might not be described as Official Development Assistance (such as transfers from non-OECD donors, including from the BRICS). WASH Accounts proposed classification of financial sources In summary, we are recommending the adoption of a classification of financial sources that would broadly align with the 3T terminology but provide additional disaggregation and reconcile with the SEEA-Water terminology. The proposed classification of financing sources is shown on Table MN 2.7 below, with relevant definitions. 76
  • 78.
    77 Table MN2.7 - WASH Accounts classification of WASH financing sources WASH-Account financing sources Proposed definition Correspondence with OECD Typology of financing sources Correspondence with SEEA-Water categories of financing sectors FS1 Tariffs for services provided Payments made by users to service providers for getting access to and for using the service. TARIFFS Part of funding via “Corporations” FS2 Households’ expenditure for self-supply Funding provided by households to invest in or provide the service themselves. Households have to make up-front an initial investment (in a well or a private latrine) to have access to the service and then need to cover operating and maintenance costs of their assets. This can be in form of cash, material or time (sometimes referred to as “sweat equity”). Households FS3 Domestic public transfers Public transfers from government agencies (central or local government) to WASH actors. These are often subsidies that come from taxes or other sources of revenues of the government. This category includes only grants and excludes concessionary loans (which are included in FS6). TAXES Governments FS4 International public transfers Voluntary donations (or grants) from public donors and multilateral agencies that come from other countries. Concessionary loans are excluded from this category and entirely included in FS6 Repayable Finance. TRANSFERS Rest of the world FS5 Voluntary contributions Voluntary donations (or grants) from international and national non-governmental donors including from charitable foundations, Non-Governmental Organizations (NGOs), civil society organizations and individuals (remittances). Concessionary loans are excluded from this category and entirely included in FS6 Repayable Finance. Not-for-profit institutions serving households FS6 Repayable financing Sources of finance that come from private or public sources and ultimately need to be repaid, such as loans (including concessionary loans and guarantees), equity investments or other financial instruments such as bonds. This category can be divided down into 2 sub-categories: concessionary repayable financing and non-concessionary repayable financing. REPAYABLE FINANCE Part of funding via “Corporations”
  • 79.
    Methodological Note No3: Estimating funding of WASH services with a “Financing Source approach” Objectives. This note provides guidance for tracking financing flows in the WASH sector using a “financing source approach”. It is based on a review of the experience of the System of Health Accounts in estimating financing sources. For each type of financing source, it indicates what the potential sources of information might be and identifies what can be the challenges (and associated solutions) with identifying those financing sources. MN 3.1. Obtaining data on financing sources As mentioned in in the Guidance Document, there are several types of financing sources that can be drawn upon to finance the sector. Identifying information on each of these financing sources can be done in several ways, as outlined in Table MN 3.1 below. The most appropriate methods for gathering data on financing sources needs to be defined on a country by country basis, depending on data availability. Additional guidance on gathering information on each type of financing source is provided below the Table. 78 Table MN 3.1 - Gathering data on financing sources Categories of financing sources Data sources and collection methods Tariffs for services provided (FS1)  Use existing sources where available, such as IBNET, national regulators or service providers’ associations, strategic financial planning exercises at national level  For main service providers, obtain turnover data per WASH service; in decentralized countries, organize a survey of formal service providers  Organize an inventory and survey of other service providers (including small-scale informal providers) to assess their overall tariff revenues Households’ expenditure for self-supply (FS2)  Rely on existing household survey data on coverage  Organize ad hoc household surveys to assess their investments in self-provided water or sanitation Domestic public transfers (FS3)  National and local government actual expenditure data, based on data collection by national bureau of statistics or specific questionnaires International public transfers (FS4)  OECD DAC database  National and local government financial accounts Voluntary transfers (FS5)  National and local government financial accounts  Surveys of NGOs and other charitable organizations about their investments Repayable financing (FS6)  Surveys of commercial banking sector FS1: Tariffs for services provided Information on tariffs paid to “official” WASH service providers exists at a disaggregated level (i.e. at the level of each service provider) but obtaining this information usually requires careful examination of the service providers’ financial accounts and tariff schedules.
  • 80.
    Some countries ororganisations have gathered data on average tariffs in a given country or in different cities,4 whilst other organisations gather and present data on tariff structures at country level. However, few (if any) countries collect data on a consistent and regular basis on the total amounts of revenues that are generated through tariffs paid by users for services provided. The present methodology requires gathering such data, both at an aggregate and at a disaggregated level:  Aggregate information on revenues from tariffs: this is the aggregate of all revenues generated from all types of services at the level of service providers, based on what is usually referred to as “turnover from sales of water / sanitation services”, as extracted from the profit and loss accounts of service providers;  Disaggregated information on revenues from tariffs: in most cases, obtaining disaggregated information on the distribution of revenues from tariffs between various services (water, sanitation and other services) or various regions would need to be obtained based on commercial data. This requires a specific visit (or sending a questionnaire) to each service provider. Collecting this type of data is likely to be difficult when the provision of WASH services is highly decentralized, resulting in a large number of service providers and when informal service providers play an important role i.e. serve a large share of the market. To overcome these potential difficulties, the WASH Accounts team can try to obtain data from:  National water sector regulators (e.g. NWASCO, the National Water Supply and Sanitation 79 Council in Zambia, or PURC in Ghana, WASREB in Kenya, etc.);  National utility associations (e.g. ABCON5 in Brazil);  Global surveys and databases that collect information on tariffs, such as the International Benchmarking Network for Water and Sanitation Utilities (IBNET) benchmarking platform managed by the World Bank;  Strategic Financial Planning exercises for the sector, which might have been conducted under the leadership of international organisations such as the OECD or the World Bank. Box MN 3.1 - Regulatory data on tariffs of service provision from national regulators Data on tariff structures can be available from the national regulator of water and sewerage. For example, Ofwat (the Office of Water Services) is the economic regulator of the water industry in England and Wales. Ofwat monitors and approves every year each company’s water and sewerage charges to check that they respect the price limits set. It used to publish results in yearly charges reports. These price limits are set by the regulator every 5 years by assessing in detail the operators business and financial models. To conduct such price reviews, they rely on financial models that capture all financial flows, including revenues (from tariffs and other sources) and sources of repayable finance. The regulator builds into the price limits, and therefore the tariffs charged to customers, the cost of servicing the debt and equity by estimating the value of the regulatory capital asset base. All this information is made publically available online, except where any information is deemed commercially sensitive. As mentioned above, tariff surveys are unlikely to estimate total revenues from tariffs but are more likely to include data on average tariffs or tariff structures. The WASH Accounts team would therefore need to process this data, using complementary datasets on the number of customers and their respective consumption (this could become a somewhat complex exercise when tariffs are structured based on consumption blocks, in which case, some approximation are likely to be necessary). 4 For example, the OECD data for a set of cities and countries around the world (OECD, 2009. Managing Water for All - An OECD perspective on pricing and financing. Paris: OECD Publications.) 5 Associação Brasileira das Concessionárias Privadas de Serviços Públicos de Água e Esgoto.
  • 81.
    In the caseof informal service providers, it is unlikely that information will be readily available on their revenues from tariffs. Where such informal service providers are serving a substantial share of the market, surveys based on a representative number of informal service providers (and their customers) will therefore need to be conducted in order to obtain data on the revenues from tariffs that they perceive. The tariffs they charge from their customers are likely to be higher than the tariffs applied by formal operators but the volumes consumed will inevitably be lower, so information on tariffs as well as volumes consumed will need to be collected for a representative sample. This data would then need to be extrapolated based on information on the average number (and size) of informal service providers (but excluding households, which are covered in the next category). FS2: Households’ expenditure for self-supply The second type of financing source coming directly from households relates to what we are referring to as “households’ out-of-pocket expenditure for self-supply”.6 This financing source is most relevant for household investments in water self-supply solutions (such as private or community wells, water tanks, etc.) and household level sanitation. It is an important financing source to track as it can represent a substantial portion of investments made by households but also by the country as a whole in water and sanitation. Yet, it is the financing source that is typically tracked the less or in the less reliable manner. In order to assess financing flows from households, the WASH Accounts team can use existing household surveys to obtain information on coverage rates, as these would indicate how many households have invested in household-level on-site sanitation. When such coverage data is updated on a regular basis (for example, the WHO-UNICEF Joint Monitoring Program is currently conducting surveys every two years but is considering carrying them out every year), it would be possible to track the amount of investments carried out by households over time. In many countries, however, coverage information is not gathered on an annual basis in a reliable manner. Given this, it would not be possible (or even necessary) to try and track annual levels of expenditure made by households on self-supply. This means that estimating these expenditures lends itself better to a “capital stock” approach rather than to a “financing source approach (see “Methodological Note No5). In order to generate a comprehensive picture of financing sources for the sector, however, it would be useful to derive estimated investment flows from households. This could be done by taking coverage estimates for two available dates (which might be 5, 10 or 15 years apart if the best reliable information is the census) and estimating the trend in coverage between those two dates to derive annual investment flows. To enhance accuracy, these coverage estimates would need to reflect the type of investments that households have made (for example, the type of latrines). Coverage estimates then need to be combined with information on the average household investment by type of investment category, based on existing surveys or project-related information. If reliable coverage information is not available, it would be necessary to conduct ad-hoc household surveys to assess their investments. Such surveys are likely to be necessary in any case to estimate the value of household investment for different types of investments, such as types of latrines. Conducting this type of surveys would be greatly facilitated by the use of mobile phone technologies to reduce the cost of data gathering and minimise the risk of error. Such mobile phone technologies have been used extensively already to gather information on water points (what is referred to as “water point mapping”), including information on the geographical location, related investment costs and functionality of rural hand-pumps for example. This information (particularly that on investment costs) will be of critical interest to fill in the data gap on household investments in self-supply. 6 Note that in the OECD 3T terminology, these are included in “tariffs”. We are proposing to separate them out, partly because the methodology for their estimation is likely to be different. 80
  • 82.
    FS3: Domestic publictransfers Domestic public transfers are public funds transferred by government agencies (either at central or decentralised government level) to WASH sector actors. Such funds would typically be provided as subsidies, for capital investment or operations. This category includes only pure grants and excludes repayable finance, even concessionary loans (which are included in FS6 – Repayable Finance). “Hidden” forms of subsidies may include tax rebates or subsidised services (such as subsidised electricity). Explicit subsidies are a priority for the tracking exercise. In the first stage of methodological development, it would be sufficient to simply mention the existence of hidden subsidies rather than to seek to quantify them (such quantification could be the subject of methodological development later down the line). In addition, in this first stage, we are recommending focusing on “budgeted public transfers”, complemented by spot checks to evaluate the extent to which “budgeted amounts” differ from effective spend. Public transfers: distinguishing between “budgeted” and effectively spent One important distinction when it comes to public transfers (for domestic and international public transfers alike) is that there might be a substantial difference between what is “budgeted” and what is effectively spent. In some countries effective spent might systematically be under what has been budgeted. This can be linked to a number of reasons, including political obstacles, low management and “absorptive” capacity, or difficulties with planning and implementing investment projects. At this stage of methodological development, it will be easier to obtain information on budgeted public transfers so it is recommended to focus on this type of data gathering. However, particularly in countries where there is a substantial gap between budgeted amounts and effective spending, it would be necessary to complement this with qualitative and quantitative assessments of the difference between budgeted amounts and actual spending. Data on public transfers channelled to the WASH sector need to be collected from a wide range of stakeholders and sources, including national and local governments or other public financing units, such as, for example, common funding baskets which are set up when a sector-wide approach to pool funding is adopted for the sector. This will need to be based on the sector financial flow mapping exercise conducted in Step 2.2. In some cases, aggregated data at a national level can be found in some countries in established tools for tracking and planning financial resources. For example, the Total Sanitation Campaign in India had a solid system of reporting, both for public financial flows and for achievements, which can be used to some extent for this purpose (although independent spot-check verifications might be needed). FS4: International public transfers In this category we only include voluntary donations from public donors and multilateral agencies that come from other countries. These funds can be contributed either in the form of grants or guarantees. Other forms of repayable finance from international donors, such as concessionary loans, are excluded from this category and entirely included in FS6 Repayable Finance. To obtain data on international public transfers, the WASH Accounts team can consult:  The OECD-CRS and OECD DAC databases: it tracks most transfers in the form of official development assistance (ODA) from donor countries and international organizations (bilateral and multilateral cooperation). It is the best database available at this stage and gives the ability to track separately grants and (concessionary) loans. However, there are a number of caveats with this database. First, data does not always match detailed data that can be obtained at national level. Therefore, some degree of triangulation is likely to be needed. In addition, it is only recently that the OECD DAC database started differentiating spending on water from spending on sanitation, and no further disaggregation is available at this stage. Finally, the database covers 81
  • 83.
    only international publictransfers from OECD countries and does not currently include important non- OECD aid flows such as those coming from China, Arab states or India.  National and local government financial accounts: They can be used to complement and refine data from OECD database at a national level. In case of conflicting information, however, it would be essential to state which source has been given priority (depending on reliability). Collecting data on ODA and the issue of concessionality The OCDE database tracks official development assistance (ODA) from donor countries and international organizations, according to the following definition: “Financial flows to countries and territories on the DAC which are: - provided by official agencies, including state and local governments, or by their 82 executive agencies; and - each transaction of which: a) is administered with the promotion of the economic development and welfare of developing countries as its main objective; and b) is concessional in character and conveys a grant element of at least 25%, calculated at a rate of discount of 10 per cent (except for capitalised interest included in re-schedulings of ODA loans which is recorded as ODA, regardless of the grant element of the rescheduling.)” Therefore to allocate the expenditure between FS4 (International public transfers) and FS6 (Repayable Finance), it is necessary to distinguish repayable loans from pure concessional finance (100% of grant element). Details on the conditionality of the financing flows can be found on the OECD databases and corroborated with national level information. Source: http://www.oecd.org/dac/38429349.pdf FS5: Voluntary transfers Voluntary donations may come from international and national non-governmental donors including from charitable foundations, Non-Governmental Organizations (NGOs), civil society organizations and individuals (remittances). Only donations that are 100% pure grants are included in this category. All forms of repayable finance (including concessionary loans and guarantees) are included in the category FS6 Repayable Finance. In many developing countries, there are frequently many voluntary organisations contributing funding to the water and sanitation sector in-cash or in-kind (for example, by digging a well or providing equipment). In most countries, such transfers are not recorded in a reliable fashion and there is therefore little transparency about their actual contribution to sector financing. To obtain data on such transfers, the WASH Accounts team could consult:  National and local government financial accounts: some governments have started collecting information on voluntary transfers to the water and sanitation sector, with the objective of ensuring better coordination of such financial flows. This is the case in Bangladesh, for example, where NGO financing needs to be recorded in the public sector budget, thereby greatly simplifying the task of collecting financial information on their contribution. This type of initiative, if deemed successful, could be replicated in other countries in order to improve coordination and facilitate the task of obtaining and recording information on such flows.  Surveys of NGOs and other charitable organizations about their investments: given the current lack of transparency on spending on WASH by the voluntary sector, some international NGOs have taken the initiative to record such flows in a more reliable manner, for example, as undertaken by Washfunders. Other initiatives, such as that developed by Interaction, the largest coalition of US-based NGOs, seek to map NGO-funded projects at country level (see an example for Haiti here). However, this information is not specifically gathered for water and sanitation and is only available for a very small number of countries at present.
  • 84.
    FS6: Repayable financing This category includes all types of repayable finance, including concessionary loans or guarantees. Information on repayable financing to the sector is very limited, but some can be found in existing data bases:  The OECD-CRS database contains information on concessionary lending;  The International Financing Review compiles data on commercial loans or bonds;  The World Bank Private Participation in Infrastructure database reports the amount of capital investments that is committed by private operators at the start of the contract. It is commonly used to track private investment in infrastructure. Although private operators are not financing sources as such, they can “bridge” the financing gap temporarily. Separating “concessional” from “non-concessional” repayable finance The FS6 category can be further broken down in two sub-categories: Concessionary Repayable Finance and Non-concessionary Repayable Finance. The allocation of repayable finance flows between these two sub-categories can be done in two ways: - In a first instance, we can start by bluntly characterising the flows as “concessional” or “non-concessional” based on the ownership status of the lender. A repayable flow coming from a public sector agency could be characterised as “concessional” and a repayable flow coming from a private sector agency will be characterised as “non-concessional”. However, some public sector agencies can themselves be involved in 83 providing loans at market rates. - To obtain a more refined estimation of these flows, we would recommend obtaining data on the lending conditions for specific loans where there are doubts about the category in which they fall. Concessional loans include a grant element, in the form of a subsidised interest rate or a grace period. We recommend using the OECD definition of ”concessional” to allocate the flows to the sub-categories. “Concessionary Repayable Finance” would include repayable flows that convey a grant element of a least 25 per cent, calculated at a rate of discount of 10 per cent (except for capitalised interest included in reschedulings of ODA loans which is recorded as concessional, regardless of the grant element of the rescheduling.) Source: http://www.oecd.org/dac/38429349.pdf However, the WASH Accounts team might need to complement this information with surveys of the commercial banking sector, to better understand the extent to which they are currently financing the water and sanitation sector and through which kind of instrument (commercial loans, bonds, equity issuance, guarantees, etc.). Given that such financial flows are by definition “repayable”, reflecting such flows into the WASH accounts is not straightforward: the box below indicates how the System of Health Accounts is handling the treatment of loans, for example. We are proposing to use a similar methodology in the case of the WASH Accounts. Lessons from the health sector: handling of loans in the System of Health Accounts Loans increase the funds available to a provider or financing agent. In the health accounts, financing agents are defined as the units that channel finance to the sector by pooling funds together from different sources and re-distributing them to service providers. Loans are not included directly in the health accounts, because they affect the balance sheet (assets and liabilities) of the financing agent. What does appear in the SHA is the money that
  • 85.
    the financing agentreleases into the health care system. Since most loans are spent as soon as they are disbursed, the distinction matters more for the purposes of attributing the funds to a financing source than for the level of health expenditure. Loan repayments do not appear in the health accounts because they represent a change in assets rather than a current expenditure for health. In effect, they are funds that were already registered in the health accounts when the disbursement was spent. On the other hand, it is appropriate to include interest payments made on outstanding debt as part of health spending, provided that the debt was directly related to the financing agent’s health activity. Most accounting systems separate loans and loan repayment from other transactions, so this treatment is not difficult to implement in practice. In systems where such a separation is not made, health accountants should be on the lookout for budget line items that indicate the infusion of new capital or the repayment of loans or retirement of other debt, and eliminate those entries from the total for the financing agent. From a policy perspective, it is important to show the effect of new loans or of loan repayments on a given financing agent or class of financing agents, this can be done in an exhibit table. This type of exhibit can inform policy-makers without detracting from the presentation of the current state of the health care system's ability to deliver care. MN 3.2. Potential challenges and how to address them Collecting information on revenue sources will give rise to a number of challenges and, as a result, cannot be relied upon as the sole methodology for data collection. Allocating resources from financing sources to different financing units is likely to be problematic. For example, domestic public transfers are not systematically allocated to different types of services, 84
  • 86.
    particularly when fundingfor water and sanitation is part of overall transfers from central to municipal governments. To overcome this challenge, it might be necessary to estimate “revenue allocation keys” in order to reconstruct the portion of such funding flows that is allocated to WASH services. Such allocation keys can be more or less precise, based on the level of information available. One potential method would be to estimate the costs relative to different uses or different services (based on a “Cost-based Approach” as described in 2.3 and Methodological Note No 4: Estimating the costs of providing the service with a “Cost-based approach”) and to use these to derive allocation keys to be applied to revenue sources. Another potential difficulty is to avoid double-counting, particularly when resources are allocated from international donors to national governments and from national governments to local governments. In that case, it is important not to count a financial flow twice, i.e. at source (such as the national government as the financing unit) and at the point where funds are disbursed to service providers (i.e. at the level of the financing unit through which funds are channelled which in this case would be the local government). Depending on what makes more sense given the country’s institutional set-up, it would be important to define where the flows are going to be tracked and stick to that specific rule. We recommend that flows be tracked at the level that is closest to service provision, so as to enable maximum disaggregation of the funding flows. 85
  • 87.
    Methodological Note No4: Estimating the costs of providing the service with a “Cost‐based approach” Objectives. This note provides guidance for tracking financial costs of WASH services. It draws from the experience of Health Accounts in estimating costs and also presents existing costs classification that could be referred to. It then discusses specific issues such as tracking the full costs of the service, defining cost categories now and for the future and, in particular, what type of cost categories may need to be obtained, at the very least distinguishing between capital expenditure and operations and maintenance expenditure, and potentially large capital maintenance expenditure. Software costs for policy development, programme development, etc. will also need to be tracked separately if possible, although this might be difficult to do at an aggregate level. MN 4.1. Classifying costs For the purpose of data comparability across countries, it will be important to use the same cost categories and commonly agreed methodologies to estimate such costs. At the international level at present, there are no standard classifications of costs that are used in both the urban and rural sub-sectors alike. In the urban sub-sector, country-level regulators define cost items in a specific manner (this if the case of Ofwat in England and Wales, for example, which has defined cost categories in order to set prices in an uniform manner for all water and sewerage companies). International utility benchmarking exercises, such as IBNET developed with support from the World Bank, seek to benchmark operating costs (defined as the unit operational cost per cubic metre of water produced or sold) but does not attempt to benchmark investment costs, as “they tend to differ widely from one year to another due to the lumpiness of the investments”. As a result, the IBNET toolkit suggests measuring the capital intensity of a utility based on the gross fixed asset value (a capital stock indicator) per capita served. However, they also state that: “Unfortunately there is often limited information available about asset values and until more emphasis is placed on this item the values derived must be treated with caution” (see Methodological Note No5 for more information about how asset values can be derived). For the rural and peri-urban sector, the WASHCost project led by IRC of the Netherlands has defined a cost typology that seeks to capture the entire life cycle costs of investing in WASH services. The cost definitions developed by WASHCost were inspired by the cost categories that are typically used for urban water and sewerage services and were extended to the rural water and sanitation sectors.7 These cost categories are shown on Table MN4.1. below. 86 Table MN 4.1 - WASHCost classification of costs in the WASH sector Cost component Explanation Capital expenditure, including hardware and software Initial costs of putting new services into place: “hardware” such as pipes, toilets and pumps and one-off “software” costs such as associated training and consultations. Operating and minor maintenance expenditure Routine maintenance and operation costs to keep services running (e.g. wages, fuel or any other regular purchases). Neglect has long-term consequences for service delivery, such as expensive capital (maintenance) expenditure and/or service failure. Capital maintenance expenditure Occasional large maintenance costs for the renewal, replacement and rehabilitation of a system. These essential expenditures are required before failure occurs to maintain service levels and need to be planned for. 7 However, they do not include any specific mention of water resource costs or environmental costs, which may need to be done in subsequent methodological development.
  • 88.
    Cost component Explanation Cost of capital The cost of borrowing money or investing in the service instead of another opportunity. It also includes any profits that service providers may earn and that are not reinvested. It has a direct impact on the ability to maintain a service financially. Expenditure on direct support Post-construction support costs (e.g. training for community or private sector operators, users or user groups). These costs are often forgotten in rural water and sanitation estimates but are necessary to achieve long-term functionality and scale. Expenditure on indirect support The cost of planning and policy-making at the governmental level, including strengthening the skills and capacities of professionals and technicians. These costs have a direct impact on the long-term sustainability of projects. Source: Adapted from WASHCost (2010a) This classification clearly identifies cost items that are typically neglected, and therefore not adequately budgeted for, such as capital maintenance expenditure or expenditure on direct (or indirect). For example, the methodology explicitly considers software costs—that is, expenditure on a range of “software” activities required to ensure that such services are delivered effectively.8 These software activities are extremely varied and broad in scope; they range from the costs of managing the sector at the level of the ministry (staff costs employed in planning, budgeting, interaction with international donors, monitoring and evaluation, technical assistance, etc.) down to the costs of capacity-building or hygiene education activities at the local level. If validated, such cost classification could be used as a standard way of accounting for costs in the WASH sector in the long term. However, this classification appears to be more useful from the point of view of project planning and budgeting than for tracking costs at a national level. Indeed, it may be difficult to use the WASHCost classification in the context of the present testing study, as some of the cost categories (such as capital maintenance expenditure, cost of capital or expenditure on direct and indirect support) are not consistently tracked in most countries at present. Typically, most government- or NGO-led programmes do not account separately for software costs associated with capital expenditure or for expenditure on direct or indirect support. Overtime, using a costing classification based on the WASHCost classification could be considered. For the testing exercise, we recommend using a cost typology that at least distinguishes between capital expenditure (including large maintenance costs) and operating and minor maintenance expenditure at the level of each service provider. Support (or “software”) costs could be collected at the aggregate level for the sector (e.g. expenditure of the water ministry) as well as at the level of each particular service and be incorporated into either operating costs (if they are “recurrent” in nature) or capital expenditure (if they are “one-off” costs associated with the development of a specific capital investment project). In this document, we use the terms “cost” and “expenditure” interchangeably. The word “cost” is more likely to be used for utilities and “expenditure” for governments or households. The overall category is referred to as a “cost classification”. The classification of cost types that we are proposing to use for the testing exercise is summarised in Table MN 4.2. below. 8 Trémolet, Kolsky & Perez (2010) also explicitly accounted for software costs when deriving the costs of providing on-site sanitation at the household level. 87
  • 89.
    88 Table MN4.2 - Proposed classification of costs Type of costs Definition C1 Capital costs including hardware and software Initial costs of putting new services in place, including “hardware” such as pipes, toilets and pumps and one-off associated “software” costs, such as for detailed design (engineering studies) or associated training and consultations. C2 Operating and maintenance costs Routine maintenance and operation costs to keep services running (e.g. wages, fuel or any other regular purchases). Operating expenditures is the recurrent (regular, ongoing) spending to provide WASH goods and services: labour, fuel, chemicals, materials, and purchases of any bulk water. Maintenance expenditure is the routine expenditure needed to keep systems running at design performance, but does not include major repairs or renewals which are recognised as not recurrent. C3 Large capital maintenance costs Occasional large maintenance costs for the renewal, replacement and rehabilitation of a system that goes beyond routine maintenance to repair and replace equipment, in order to keep systems running. These essential expenditures are required before failure occurs to maintain service levels and need to be planned for. If this cannot be separated out from capital expenditure (C1), this should be included with this category of spending and explicitly mentioned as such. C4 Cost of capital This is estimated based on the cost of borrowing money (interest paid for the loan) and the cost of equity (if a return is paid to shareholders). C5 Support or software costs Includes expenditure on direct and indirect support:  Expenditure on direct support (ExpDS) includes expenditure on both pre-and post-construction support activities directed to local-level stakeholders (e.g. training for community or private sector operators, users or user groups).  Expenditure on indirect support (ExpIDS) includes the cost of planning and policy-making at the governmental level, including strengthening the skills and capacities of professionals and technicians. These costs have a direct impact on the long-term sustainability of projects. A number of methodological issues relative to the estimation of such costs can be anticipated at this stage, as highlighted below: Estimating capital expenditure and large capital maintenance expenditure. Annual flows of capital expenditure (and large capital maintenance) are usually estimated based on the service providers’ balance sheet. The asset base included in the balance sheet will evolve from one year to the next on the basis of new investments (also referred to as “gross capital formation” in the System of National Accounts) which would be reflected as an increase in assets) and depreciation of existing assets (also referred to as “consumption of fixed capital” in the SNA). Based on a service provider’s balance sheet, it is therefore possible to estimate how much the service provider has invested every year. In the case of service providers that are providing different types of services (such as water and sanitation), in order to allocate such costs by type of service, it would be necessary to obtain data on the recent (and planned) investment programme. The allocation by type of service could be done based on actual investments (particularly if the utility itself has done such allocation) or by using estimated ratios if the utility has not done the allocation itself (i.e. 40% investment for water, 60% for sanitation for example). Over time, it would be necessary to aim for as much actual allocation as possible. All associated software expenditure, which has been a one-off and undertaken specifically to support this hardware investment could be associated with it (such as supporting design studies or planning). As a note of caution, however, there are a number of reasons for which such “capital investment flows” may not be a robust indicator of an actual trend in investment, as discussed in more detail in Methodological Note No 5: Estimating fixed asset stocks . As a result, the approach of estimating capital investment flows may need to be complemented by an estimation of capital stocks.
  • 90.
    The cost ofcapital will need to be estimated based on financial accounts. Typically, the cost of capital is made up of two main elements: financial costs, which correspond to the costs of repaying the interest of the debt associated with capital investment (this is the cost of renting the capital and can usually be identified separately in financial accounts); and the return on equity capital, which is paid out as dividends to shareholders (or other benefits) in the event of profit-making companies. Given the potential difficulties in estimating the return on equity capital and the profit element for not-for-profit companies, the System of Health Accounts uses different approaches to capture costs and expenditure for for-profit and non-profit / government providers, as discussed in the box below. Learning from the health sector: distinguishing between for-profit and non-profit/ 89 government providers. The System of National Accounts (as well as the System of Health Accounts) establishes a distinction for evaluating costs of market and non-market providers. In the case of market (for-profit) providers, the value of goods and services they produce is estimated based on the revenue they receive from the sale of these goods. As a result, this can be done by compiling information on the total amount paid for these goods and services at the point of consumption. As a result, data valuing their output from the country’s national accounts may be very useful for these kinds of providers. In the case of non-market (non-profit or government) providers, the value would be estimated based on the cost of production, as these goods and services are not necessarily sold or sold at a price that reflects the true cost of production. Costs would be typically calculated as the actual expenditure on inputs such as staff remuneration (including all benefits) and supplies. This would include budgetary expenditures on salaries, supplies, and other inputs. It may also include goods and services (such as free electricity) provided to those facilities by other government agencies. Estimating operating and maintenance expenditure. Operating and minor maintenance expenditure can be derived from the income and expenditure statement (profit and loss account) of the service providers. In the event of joint service provision (water and sanitation), it will be necessary to allocate such costs to these respective services. If the utility does not already do it based on actual costs, allocation keys will need to be used, which means that additional information will need to be collected, including on the individual cost factors (such as energy, chemicals, spare parts, etc.) and on the number of staff per service. Using the share of revenues by service as an allocation key is unlikely to be helpful and could introduce distortions, as there are frequently cross-subsidies between water and sanitation, which means that tariff revenues from sanitation for example may actually be much lower than the actual costs generating by those services. When applying a “Cost-based approach”, it would be necessary to analyse costs in order to identify what are the actual costs of each service. To do so, it would be necessary to rely on recent tariff studies or pre-existing information or to do it only for a small sample of utilities, as it can be a time-consuming exercise. Estimating support or software costs. Software costs can be included in two main ways: expenditure on indirect support (such as for policy development, sector planning, budgeting, etc…) can be estimated at a national level. It might be possible to extract those costs directly from the National Accounts, as there are categories in the National Accounts that capture information on “support services to the water and sanitation sector” (see Table MN 1.4 which contains our recommended classification of WASH services). Regarding those costs that are directly related to the provision of a particular service, those costs might either be elicited based on the costs of NGOs and other support organisations (including
  • 91.
    government) that supportservice delivery or at the level of service providers that have called on such NGOs to support the development of their services. Those costs are typically difficult to track, however. In the case of NGOs, for example, having access to their costs on a consolidated basis can be difficult and they would seldom separate out hardware from software costs. It would therefore be recommended to estimate such costs on a sample basis for a representative sample of NGOs. MN 4.2. Collecting data on the costs of service provision Potential sources of cost data vary depending on which agencies incur those costs. Table MN 4.3. below lists potential sources of costs by type of service provider. 90 Table MN 4.3 - Gathering data on costs of service provision Categories of service providers Data sources and collection methods P1 Government agencies  Public expenditure accounts presented to national parliaments  National budget  Annual budget for each relevant financing unit  Supplementary information to determine cost allocation if needed (such as number of staff per department, percentage of their time dedicated to a sub-sector) P2 Public and private utilities  Service providers’ annual financial statements (balance sheet and profit and loss accounts)  Supplementary information to determine cost allocation if needed: o Number of staff per department, percentage of their time dedicated to a given service o Number of customers per service, unit cost of production, average investment costs per type of investment o Investment programme (realisations by category of investment spending) o Activity-based costing reports o Any recent tariff study that might have been undertaken to estimate costs of production, historically and going forward P3 Small independent providers (formal and informal)  Survey of a sample of small independent providers on their total production costs P4 NGOs and community-based organizations  Annual financial statements  Detailed costing / cost benchmarks for a number of representative projects P5 Households (self-provision)  Households survey,  Detailed costing / cost benchmarks for typical household investments Learning from the health sector: the costs of self-provision of WASH services Whereas the actual costs to households will be estimated (such as investment or operating costs), free labour provided by households to build latrines for example should not be included in consistency with the System of National Accounts, which does not include non-monetary contributions (this is also in line with the practice in the System of Health Accounts). The value of these activities can be estimated, but it cannot be part of the total used for comparison of WASH expenditure with other economic aggregates or for international comparisons.
  • 92.
    Methodological Note No5: Estimating fixed asset stocks Objectives. This note indicates why it is important to estimate fixed asset stocks for the sector, as well as estimating financial flows. It indicates how this would allow linking with existing accounting conventions (such as in the System of National Accounts) and highlights potential methodological challenges for doing so (and ways to address those). MN 5.1. How does estimating fixed asset stocks differ from evaluating 91 investment flows? Methodological Note No 4: Estimating the costs of providing the service with a “Cost-based approach” indicated how to track financing flows to the sector, including investment flows (capital expenditure). There are several limitations with tracking investment flows, however:  Tracking investment flows can potentially generate misleading results, as investment flows typically vary from year to year due to capital programming and realization. For example, if a country is building a large asset at a national scale (e.g. a dam or a transmission pipe), capturing the nominal value of that investment in each year as the asset is being built would show up as an investment peak followed by much lower levels of investment. At a global level, this may be interpreted as the country having “deprioritized” investment once this large asset has been built, when in fact the asset would be producing benefits and investment needs are subsequently lower.  Capturing the entire value of an investment in a given year does not allow differences in the asset lives of such investments to be reflected. Following on the example mentioned above, taking into account the entire value of a new asset with an asset life of, say, 50 years in the year in which such investment is made ignores the fact that such an asset delivers benefits over a long period.  Some very important investments (e.g. households’ out-of-pocket expenditure for self-supply) cannot be tracked in such a way because no data is available on annual investment flows for this type of expenditure. What is available is information (mostly from household surveys) on service coverage at different points in time (i.e. when the household surveys are conducted) rather than annual investment flows. To complement tracking investment flows, it can be useful to estimate the value of existing fixed asset stocks and track how such value evolves over time. Such a methodology has numerous advantages, as follows:  It would allow tracking all sources of investment on a comparable basis, thereby overcoming the problem of a lack of data on annual capital investment flows for significant investors, such as households for on-site sanitation. This was the approach taken by the World Bank-led AICD report (Africa Infrastructure Country Diagnostic) when estimating current investments in the sector, for example. On the basis of this kind of approach, they found that households are the most significant investors in the WASH sector in sub-Saharan Africa.  It would allow reflecting whether existing assets are providing a service or not. For example, at a subsequent stage of methodological development, it would be possible to exclude from the “asset base” the value of assets that are not functioning, bearing in mind that such proportion can be significant (for example, several estimates indicate that 50% of all manual hand-pumps in sub- Saharan Africa are non-functional at any given time).  It would provide a sounder basis for estimating future costs—in particular, the costs of attaining the MDGs. For example, the WHO global costing exercise (first produced in 2004 and updated in 2012, see (Hutton, 2012)) is currently based on a relatively “crude” estimate of the total asset stock by combining JMP figures on coverage with the best available estimates of unit costs, based on the service ladder. Based on the value of this stock of assets, the authors apply a ratio to derive projected operations and maintenance costs. However, good unit cost values are not
  • 93.
    always available atthe national level. These estimates would therefore be strengthened if more reliable estimates for asset stocks were available.  It is in line with the United Nations System of National Accounts, the standard methodology used by governments to compile and track information on economic activity. According to the UN Statistics Division, statistics bureaux in each country should already be compiling information on asset stocks for all economic activities, including for water and sanitation. Concepts such as “gross fixed capital formation” and “stocks of fixed assets” are already defined in a standard manner in SNA 2008. Table MN 5.1. below summarises the definitions used by the SNA and could therefore be referred to or used in the WASH Accounts. 92 Table MN 5.1 - Terminology used in SNAs to evaluate changes in capital asset stocks Definition Consumption of fixed capital Cost of the decline in value of the producer's stock of fixed assets as a result of physical deterioration, foreseen obsolescence or normal or accidental damage in the accounting period. It corresponds to “depreciation” in the business management terminology. It should reflect the use of capital as a factor of production. It includes the use of buildings, equipment and other capital goods such as vehicles. It excludes the rentals paid on the use of equipment or buildings, and fees, commissions, royalties, etc., payable under licensing arrangements, which are included as the purchase of services. Gross fixed capital formation Total value of the fixed assets that service providers have acquired during the accounting period (less the value of the disposal of these assets) and that are used repeatedly or continuously for more than one year in the production of services and goods. This is what corresponds to investments made in that year. Opening stocks of fixed assets Value of fixed assets at the start of the period (usually an accounting year). Closing stocks of fixed assets Closing stocks = opening stocks + gross fixed capital formation – consumption of fixed capital + other changes in volume of asset + holding gains/losses on assets Where:  Other changes in the volume of the asset are those that are not due to transactions, such as changes in classification, discoveries and natural disasters.  Holding gains/losses on assets are the changes in the price of assets. Source: System of National Accounts (2008). MN 5.2. Potential methodological challenges with this approach and ways to overcome them This type of methodology has not been explicitly adopted in previous exercises that have sought to track financial flows to the WASH sector, however. This is probably due to the fact that there are a number of methodological difficulties with adopting a “fixed asset stock” approach, which would require further consideration, including the following: Existing information on fixed assets is often very poor in the WASH sector, for a number of reasons. Few entities have developed a comprehensive and reliable asset register. The ownership of the assets is frequently unclear, and there is frequent confusion about who has paid for the assets and who effectively owns the assets. If such a methodology was adopted on a large scale, however, it could provide added incentives to WASH service providers for improving asset registries, which are useful tools for improved asset management. Existing information may not always distinguish between water and wastewater. Some utilities currently split the valuation of their assets between water and wastewater but this is by no means
  • 94.
    universal. Again, theadoption of a more systematic approach to valuing capital stocks could give incentives for utilities to split the values of water and wastewater in their balance sheets. Most importantly, to obtain comparable capital asset stock values, it would be necessary to agree on a common methodology for valuing assets across the sector. There are a number of existing methodologies for valuing assets, which can produce very different values, especially if the asset base combines assets that have been built at different times. Alternative methodologies for valuing fixed asset stocks are presented in the Box below. Different service providers may be using different rules, even within the same country. 93 Box MN 5.1 - Alternative methodologies for valuing fixed asset stocks Valuing assets at their current book value, i.e. as they are recorded in the service providers’ balance sheet. This is likely to be the simplest method for asset valuation, at least in the first instance, as these values can be directly extracted from companies’ balance sheets. The book value is based on the original expenditure of the asset less any depreciation incurred since the asset was purchased plus any capital maintenance expenditure since incurred on that asset. Applying this method can lead to distortions, however, as different service providers may use different conventions for valuing assets in their balance sheets. Some may value assets at their historical costs (adjusted for depreciation and in some case, for inflation), whilst others would have adjusted the value of assets based on their replacement value. Valuing assets at their historical cost: this methodology estimates how much it cost to build when it was built, adjusted for depreciation and inflation. In the case of many utilities, water and sewerage assets have been acquired a long time ago, although they are still delivering benefits. Their historical value would therefore be very low (as the assets have been or almost been depreciated) despite the fact that they are still providing services. Other utilities might have updated the value of assets in their books. Valuing assets at their replacement value, also referred to as the Modern Equivalent Asset value. This is equivalent to how much it would cost to replace the given asset by its modern equivalent at today’s cost, i.e. by an investment using the latest technologies but providing the same level of service. This kind of valuation can provide values that are closer to actual values but conducting such a “revaluation” exercise can be complicated, costly and time-consuming which means that it is seldom done, unless there is a clear motivation for doing it (such as the introduction of private sector participation, which would call for valuing the asset base before letting a contract). Asset valuation methods vary from one country to another. For example, Ofwat (2005), compared methods for valuing capital bases in six different countries for which they were comparing the regulatory systems as a whole. In England and Wales, values for capital employed are based on an initial value estimated at the time of privatisation in 1989, adjusted for subsequent depreciation and new investment. Companies also report MEA values: the estimated cost of assets of equivalent productive capability to satisfy the remaining service potential of the asset, less accumulated current cost depreciation. Australian companies report the current replacement cost of the asset in a similar way to the companies in England and Wales. Source: Ofwat (2005), “International comparison of water and sewerage service”, March 2005. The System of National Accounts (2008) also formulates recommendations as to how valuing assets and reflect those in the balance sheets, which can be used for reference. A few points of caution when valuing assets: It would be important to obtain information about who invested in such an asset in the first place. If this information is going to be used in order to track financial sources to the sector, it will be important to know who financed its construction in the first place. For water utilities, for example, investment funds may come from internally generated revenues, government subsidies or international transfers.
  • 95.
    For investments carriedout by households, it will be necessary to formulate a number of assumptions. Deriving the value of the capital stock in which households have invested over time can be done based on the number of existing facilities multiplied by the unit costs of these facilities, minus government subsidies.9 Given the typical lack of information about when the investments have been made by households, this is equivalent to valuing household assets based on an MEA approach (Modern Equivalent Asset). In order to be consistent, it might therefore be preferable to use an MEA approach for all other types of assets as well, although this might be difficult to achieve if no prior valuation of assets using this method has been adopted in the country or for the utility. MN 5.3. Valuing fixed asset stocks in the testing exercise and next steps In conclusion, given the methodological difficulties entailed with estimating fixed asset stocks, the testing exercise will need to test the feasibility of alternative methods for estimating fixed asset values and potential errors or biases in doing so. Countries that take on the exercise of valuing asset stocks will need to state clearly which method has been used for valuing assets and whether this method has been used consistently across service providers or asset types. It might be possible to do so only on a sample basis. Valuing fixed asset stocks may be more complex the first time round (when the initial value of the asset base needs to be determined) but would become comparatively easier for subsequent iterations. It would require identifying existing assets for each service provider and valuing those assets. It would also help with defining reference values for other types of costs, such as operating costs and capital maintenance costs, which can be estimated as a percentage of asset values (if no other reliable estimate can be gathered at a reasonable cost). A next step in the refinement of the methodology could be to adopt a full “Fixed Asset Stock” approach for the sector, by tracking not only assets, but also liabilities (i.e. the loans that have been provided to finance such assets), so as to derive a value for the net capital stock. Such a “Fixed Asset Stock” approach at the sector level is recommended, for example, by the International Monetary Fund (2001) in its Government finance statistics manual. 9 An additional complication is that in national accounts, households are not considered to be “investors”; instead, they purchase consumer durables (which would be classified as investments if purchased by an establishment). As a result, for households, the consumer durable is recorded as consumed the moment it is purchased. It is therefore important to record the purchase of consumer durables by households and estimate the lifetime of the equipment. The treatment of these household investments will need to be discussed and agreed with experts in System of National Accounts and statistics. 94
  • 96.
    Methodological Note No6: Preparing WASH accounts’ tables and indicators Objectives of this note. This note sets out the proposed tables for the WASH Accounts. A summary list of the proposed Tables is presented in Step 3 of the main document. Preparing all these tables would enable countries to build a full picture of their WASH sector financing for policy uses (as detailed in Section 4.1. Analyse and interpret WASH Accounts data to answer policy questions). This Methodological Note contains the structure of the proposed tables together with a justification for putting them forward and the list of indicators that can be calculated based on those tables. MN 6.1 What are the WASH Accounts tables? WASH Accounts tables are a means of displaying information on the consumption, production and financing activities for a country’s WASH sector. Reporting the data and estimates in a comparative way, using standard tables, allows carrying out comparisons across countries and is thus useful for international comparisons. The rows and columns of the WASH Accounts are based on the classifications presented elsewhere in this methodology, including:  Table 1 – Proposed classification of WASH goods and servicess;  Table 2 – Definitions: uses of WASH services, WASH sector actors and financing sources;  Table MN 4.2 - Proposed classification of costs. In addition, some of the proposed WASH Account tables include a breakdown by region or service areas, which is why we have included this in the table below, which summarizes all the different types of classifications (and labels) used in the WASH Accounts. 95 Table MN 6.1 - Classifications used in the WASH Accounts Classifications Definition WASH services (S) WASH services and products provided by WASH service providers and consumed by the users. See Table 1 for more the classification. Uses of WASH services (U) Type of use of WASH goods and services. See Table 2. WASH providers (P) Actors that are engaged in the production of WASH goods and services. See Table 2. Financing sources (FS) Where funding originates from before being channelled by financing entities. See Table 2. Financing units (FU) Institutional entities that provide funding to the sector. They mobilise funding to pay for WASH services. They may allocate funds directly to service providers or channel them through intermediary institutions.. See Table 2. Costs (C) Type of costs (or expenditure type) borne by service providers for providing WASH services. See Table MN 4.2. Service areas (R) Regions where WASH services are provided and consumed. Would vary from one country to another. WASH Accounts tables are constructed in a way to track the flows of financing between these dimensions. The classifications can be applied to WASH costs individually to produce expenditure tables for a single dimension (Expenditure by type of WASH uses, service providers, financing sources etc.). Additional information can be gained from cross-classifications that use two or more dimensions. Many combinations of two and three dimensions tables can be created. The choice of tables will depend on their usefulness and the feasibility to construct them. A selection of main two dimensions tables is presented in the present methodology.
  • 97.
    Recommended common WASHAccounts tables Below, we provide additional explanation about each proposed WASH Accounts table and the type of information they allow analysing. For ease of reference and to facilitate comparisons, each of these tables is referred to with a number and a code indicating which information it contains. The convention used is that the labels for the WASH Accounts tables refer first to the row classification and then to the column classification. For example, Table WA 1 presenting the allocation of WASH expenditure by main WASH service (S) and regional subdivision (R) is referred to as the SxR table, with WASH services (S) appearing in rows and regional subdivisions (R) in columns. Table WA 1 (SxR) - WASH expenditure by main WASH service and regional subdivision. This table shows the total expenditure on each main type of WASH service by main geographical areas. To respond to country-specific policy needs, countries can choose the level of regional disaggregation (i.e. overall, urban/rural, by region etc...) and the level of service disaggregation below the main service categories presented in MN1. 96 Table WA 1 (SxR) - WASH expenditure by main WASH service and geographical region Areas Urban Rural R1 R2 R3 R4 Main WASH services millions of currency units Regional sub-division 1 Regional sub-division 2 Regional Sub-division 3 Regional Sub-division 4 Total S1 Water supply services S2 Sanitation services S3 Support services to the WASH sector S4 Water resources Management Total Table WA 2 (SxU) -WASH expenditure by type of WASH service and use. This table shows the expenditure of financing units on the different type of WASH services and uses. It tells us “who consumes what”. This is not done by types of users but rather by types of uses. This table provides a summary presentation of the demand for WASH services in the country, i.e. who is consuming what type of WASH service. Table WA 2 (SxU) - WASH expenditure by type of WASH uses and service WASH uses (U) U1 U2 U3 U4 U5 U6 Main WASH services millions of currency units Served domestic use Self-provided domestic use Served institutional use Self-provided institutional use Served industrial and commercial use Self-provided industrial and commercial use Total S1 Water supply services S2 Sanitation services S3 Support services to the WASH sector S4 Water resources Management Total Table WA 3 (SxP) - WASH expenditure by type of WASH service and provider. This table shows the expenditure of service providers on the different types of WASH services. It tells us “who
  • 98.
    provides what”. Thistable provides a summary presentation of the WASH supply market in the country, i.e. who are the providers involved and how spending to the sector is channelled through different providers. It displays the relative importance of each type of provider on the market. 97 Table WA 3 (SxP) - WASH expenditure by type of WASH provider and service WASH providers P1 P2 P3 P4 P5 Main WASH services millions of currency units Government agencies Network corporate providers Non-network corporate providers NGOs and community-based organizations Households (self-provision) Total S1 Water supply services S2 Sanitation services S3 Support services to the WASH sector S4 Water resources Management Total Table WA 4 (PxFS) - WASH expenditure by type of WASH provider and financing source. It addresses the question “where does the money come from” by presenting the different sources of revenue for each type of service provider. It enables to follow the resource flows in the WASH sector, from the columns displaying the origin of the funds to the rows displaying the recipients and users of these funds. The table also shows the relative importance of each type of revenue stream in financing the activity of each type of provider and the sector overall. Table WA 4 (PxFS) - WASH expenditure by type of financing source and WASH provider Financing sources FS1 FS2 FS3 FS4 FS5 FS6 WASH providers millions of currency units Tariffs for services provided Households’ expenditure for self-supply Domestic public transfers International public transfers Voluntary contributions Repayable financing Total P1 Government agencies P2 Network corporate providers P3 Non-network corporate providers P4 NGOs and community-based organizations P5 Households (self-provision) Total Table WA 5 (SxFS) - WASH expenditure by type of WASH service and financing source. This table shows the financing path to fund the provision of WASH services. It addresses the question “who finances what” by presenting the different sources of revenue for each type of WASH service.
  • 99.
    This table enablesto follow the resource flow to the WASH sector from the columns displaying the origin of the funds to the rows displaying the activities on which they are spent. 98 Table WA 5 (SxFS)- WASH expenditure by type of financing source and WASH service Financing sources FS1 FS2 FS3 FS4 FS5 FS6 Main WASH services millions of currency units Tariffs for services provided Households’ expenditure for self-supply Domestic public transfers International public transfers Voluntary contributions Repayable financing Total S1 Water supply services S2 Sanitation services S3 Support services to the WASH sector S4 Water resources Management Total Table WA 6 (SxFU) - WASH expenditure by WASH service and financing unit. This table (see next page) shows how much is spent by each financing unit on which WASH service. It describes how overall financing units allocate their resources to the main types of WASH services. It addresses the question “who funds what”. Table WA 7 (PxFU)- WASH expenditure by WASH provider and financing unit. This table (see next page) shows how much is spent by each financing unit on which type of WASH service provider. It shows the financing path to fund the provision of WASH services. It addresses the question “who funds who”. Table WA 8 (FSxFU)- WASH expenditure by financing source and financing unit. This table (see next page) shows how overall financing units allocate their financial resources to the sector, i.e. through which type of financial sources.
  • 100.
    99 Table WA6 (SxFU)- WASH expenditure by financing unit and WASH service Financing Units FU1 FU2 FU3 FU4 FU5 FU6 FU7 FU8 FU9 FU10 Main WASH services millions of currency units National authorities Regional authorities Local authorities Network corporate providers Non-network corporate providers Economic and quality Regulators Bilateral and multilateral donors Banks and Financial Institutions NGOs and community-based organizations Households Total S1 Water supply services S2 Sanitation services S3 Support services to the WASH sector S4 Water resources Management Total
  • 101.
    100 Table WA7 (PxFU)- WASH expenditure by WASH provider and financing unit Financing Units FU1 FU2 FU3 FU4 FU5 FU6 FU7 FU8 FU9 FU10 WASH providers millions of currency units National authorities Regional authorities Local authorities Network corporate providers Non-network corporate providers Economic and quality Regulators Bilateral and multilateral donors Banks and Financial Institutions NGOs and community-based organizations Households Total P1 Government agencies P2 Network corporate providers P3 Non-network corporate providers P4 NGOs and community-based organizations P5 Households (self-provision) Total
  • 102.
    101 Table WA8 (PxFU)- WASH expenditure by financing source and financing unit Financing Units FU1 FU2 FU3 FU4 FU5 FU6 FU7 FU8 FU9 FU10 Financing Sources millions of currency units National authorities Regional authorities Local authorities Network corporate providers Non-network corporate providers Economic and quality Regulators Bilateral and multilateral donors Banks and Financial Institutions NGOs and community-based organizations Households Total FS1 Tariffs for services provided FS2 Households’ expenditure for self-supply FS3 Domestic public transfers FS4 International public transfers FS5 Voluntary contributions FS6 Repayable financing Total
  • 103.
    Table WA 9(CxP) - WASH expenditure by type of cost and WASH provider. This table shows how different types of providers allocate their resources to cover the different types of costs. It answers the question “what type of costs are funded and by whom”. 102 Table WA 9 (CxP)- WASH expenditure by type of cost and WASH provider WASH providers P1 P2 P3 P4 P5 Cost type millions of currency units Government agencies Network corporate providers Non-network corporate providers NGOs and community-based organizations Households (self-provision) Total C1 Capital costs including hardware and software C2 Operating and maintenance costs C3 Large capital maintenance costs C4 Cost of capital C5 Support or software costs Total Table WA 10 (CxS) - WASH expenditure by type of cost and WASH service. This table shows on which type of costs resources are spent to provide each WASH service. Table WA 10 (CxS)- WASH expenditure by type of cost and main WASH service Main WASH services S1 S2 S3 S4 Cost type millions of currency units Water supply services Sanitation services Support services to the WASH sector Water resources Management Total C1 Capital costs including hardware and software C2 Operating and maintenance costs C3 Large capital maintenance costs C4 Cost of capital C5 Support or software costs Total Table WA 11 (ASxP) - Asset stocks by type of WASH provider. This table presents the stock of assets for each type of WASH provider. This enables to evaluate the stock of assets for the sector as a whole, reflecting what has been invested over time by each type of service provider (including households for self-service).
  • 104.
    103 Table WA11 (ASxP)- Fixed asset stocks by type of WASH provider WASH providers P1 P2 P3 P4 P5 Asset stocks millions of currency units Government agencies Network corporate providers Non-network corporate providers NGOs and community-based organizations Households (self-provision) Total AS1 Closing stocks of fixed assets MN 6.2 What are the WASH Accounts indicators? The WASH Accounts indicators are key figures on WASH sector expenditure that can be derived directly from the WASH Accounts tables. These indicators are meant to be directly relevant to national policy makers and for international reporting. The outcome of the testing will be to agree on an international common set of indicators, that countries could complement with their own indicators. Due to difficulties with comparing national currency units, it is recommended to use ratios (such as ratio of WASH spending to GDP) to the extent possible, rather than currency amounts, in order to avoid the distorting impact of exchange rates. However some indicators such as the Total expenditure on the WASH sector at the national level and Total expenditure on WASH per capita will be presented in currency units. The conversion from local currency amounts into international dollar amounts using a current exchange rate or a PPP exchange rate will need to be considered and documented. Table MN 6.2 below presents the main indicators that can be used depending on the country’s policy questions. Benchmarking and presenting indicators in context Certain indicators would benefit from being presented by comparison with actual levels of GDP. For example, the figure that shows the percentage of WASH sector expenditure as a percentage of GDP (Figure 9 in the 2010 GLAAS report) does not give an indication of the relative sizes of GDP from one country to the next. It would be preferable to chart the percentage of WASH expenditure on the x-axis and show GDP per capita on the y-axis. This would enable seeing whether there is any type of “GDP impact” on WASH sector spending.
  • 105.
    104 Table MN6.2 - WASH Accounts indicators Table (T) Indicator (I) that can be derived Table WA 1 (SxR)- WASH expenditure by main WASH service and regional subdivision Total expenditure on the WASH sector at the national level Total expenditure on WASH in the country as share of GDP Total expenditure on WASH per capita Total expenditure on WASH as a % of total public spending Total expenditure on urban and on rural drinking-water as a % of total WASH expenditure Total expenditure on urban and on rural sanitation as a % of total WASH expenditure Table WA 2 (SxU)- WASH expenditure by type of WASH service and use Total expenditure per type of service use Table WA 3 (SxP)- WASH expenditure by type of WASH service and provider Total expenditure per type of WASH service Total expenditure per type of WASH provider Table WA 4 (PxFS)- WASH expenditure by type of WASH provider and financing source Total expenditure per type of financing source Table WA 5 (SxFS)- WASH expenditure by type of WASH service and financing source Total government domestic transfer expenditure and as a % of WASH expenditure Total international transfer expenditure and as a % of WASH expenditure Total household expenditure as a % of WASH expenditure Table WA 6 (SxFU)- WASH expenditure by WASH service and financing unit Table WA 7 (PxFU)- WASH expenditure by WASH provider and financing unit Table WA 8 (FSxFU)- WASH expenditure by financing source and financing unit Total expenditure channelled through regional and local authorities as a % of WASH public expenditure Table WA 9 (CxP)- WASH expenditure by type of cost and WASH provider Table WA 10 (CxS)- WASH expenditure by type of cost and main WASH service Total capital costs as a % of total WASH expenditure Total operating and maintenance costs as a % of total WASH expenditure Total large capital maintenance costs as a % of total WASH expenditure Capital costs as a % of total water supply expenditure Operating and maintenance costs as a % of total water expenditure Large capital maintenance costs as a % of total water expenditure Capital costs as a % of total sanitation expenditure Operating and maintenance costs as a % of total sanitation expenditure Large capital maintenance as a % of total sanitation expenditure Table WA 11 (ASxP)- Fixed asset stocks by type of WASH provider Total WASH fixed asset stocks per capita
  • 106.
    Annex A –Summary of key steps under the methodology Objective. This Annex provides a summary of the different steps outlined in this methodology, It will provide the basis for preparing the Terms of Reference for conducting the exercise at national level. 105 Step 1 – Getting started Summary of tasks to be undertaken  Create political buy-in: o Identify a country champion to be the national point of contact (POC) o Convene a national level stakeholder group to oversee compilation of data and provide political support to the project  Identify policy questions: o Organise an initial kick-off meeting with members of the national level stakeholder group o Agree on a list of priority policy questions that the data collected will aim to answer  Set up the team in charge of data collection and analysis: o Build a strong WASH Accounts team backed up by institutions o Identify available data and define a data collection plan o Develop a detailed budget and work plan for data collection and analysis Step 2 – Collect financial data Step 2.1 - Define WASH sector boundaries in terms of services  Define a classification of WASH services that will be used for the testing exercise: o Identify the classifications and categories of WASH services that are being used in the country. o Analyse similarities and differences with available international classifications (see Table MN1.4): can the same categories be used? Is data collected on this basis in the country? o State very clearly which activities are included in the WASH sector definition, preferably by reference to international classifications o Collect data according to these categories if possible or based on aggregate categories (e.g. water supply services, sanitation services, construction services, support services)  Provide feedback on the following questions: o Is the proposed list (see Table MN1.4.) usable and useful in your country to define sector boundaries? o What would be the ideal level of aggregation of data that would answer policy questions and be easily collected at the same time? o Can WASH data based on international classifications be found in your country? o Would it be necessary, in your opinion, to refine existing classifications in order to better match WASH sector needs? Step 2.2 - Identify the main WASH sector actors, map service provision and financial flows  Identify and classify WASH actors, financing sources and uses of WASH services o On the basis of data already gathered in Step 1.3.2, identify the classifications of WASH actors, financing sources and uses that are being used at country level o Analyse similarities and differences with the proposed classifications: can some categories be used? Can collected data fit into the proposed classifications? o State clearly the classifications of WASH actors, financing sources and uses that will be used o Organise actors and financing sources into categories using the proposed classification.  Map out the financing of the WASH sector (actors and financing flows schematised by categories) o Represent the WASH sector actors and financing sources for each of the four sub-sectors (if necessary, i.e. if there are substantial differences between them)  Provide feedback on the methodology:
  • 107.
    o Assess ifthe proposed global classification covers all identified actors and financing sources at country level and whether it needs to be modified to better adjust to the country’s context. o Indicate whether a common classification of WASH actors, financing sources and uses is 106 useful o Report on any difficulties encountered in carrying out the exercise and ways to address them. Step 2.3 - Estimate financial flows and capital assets stocks  Identify data required to answer policy questions set out in Step 1.2.  Identify whether the National Statistics Office already collects data on financing to WASH and if so, understand their methodology for doing so;  For financing flows, gather financing data at source, starting with the approach that allows generating the most comprehensive data set (i.e. either “Financing Source Approach” or “Cost-based Approach”):  For financing flows, define a time period over which to gather information (2-3 years);  Note that both approaches will need to be applied in parallel as they provide complementary information, particularly needed to allocate costs to types of services;  Gather data on capital assets using the “Fixed Asset Stock Approach”  Collect the data and create a WASH Accounts database: o Define the structure of the database and the data-records so that it can be maintained on an ongoing basis; o Decide which data to acquire; o Enter existing data into the database; o Allocate WASH Accounts classification codes to all data entries; o Identify data gaps and undertake further analysis / surveys to plug in data gaps; and o Prepare the WASH- Accounts tables.  Reconcile the data, identify gaps in the information and recommend (and conduct) any supplementary primary data gathering (such as additional surveys).  Provide feedback on methodological issues: o Appropriateness of the categories of costs proposed o Identify a list of costs and financing sources that are difficult to value and will require additional methodological development o Appropriateness of using a Fixed Asset Stock approach o When using a Fixed Asset Stock approach: on methods for asset valuation and on whether to deal with liabilities alongside assets Step 3 - Analyse financial data  Identify the tables and indicators from the list presented in this guidance document, based on which are most relevant to answer the country’s policy questions;  Undertake background calculation and compile the WASH Accounts Tables;  Calculate the WASH Accounts indicators;  Document the compilation process;  Verify the coherence of the tables;  Provide feedback on the use of suggested tables. Step 4 - Interpret and disseminate findings  Analyse and interpret WASH Accounts data to answer policy questions  Disseminate the WASH Accounts findings by communicating on the indicators, presenting the main results and findings of WASH Accounts in a summary report (including key WASH Accounts tables)  Write short policy briefs for decision makers focused on a specific policy question  Provide feedback on ways to disseminate findings
  • 108.
    Step 5 -Provide feedback on methodological development  Produce a synthetic report evaluating your experience using this guidance document;  Produce a synthesis report evaluating your experience using this guidance document;  Assess and comment upon the appropriateness of the proposed classifications to define the 107 WASH sector and the way it is financed;  Assess and comment upon the feasibility to collect such data in the country;  Assess the methodology proposed to value the financing flows and capital stocks;  Suggest modifications to improve both the classifications and the methodology;  Provide feedback on the overall process from an organisational point of view and give indications about the cost and resource requirements of the exercise
  • 109.
    Annex B –The System of Environmental Economic Accounting for Water (SEEA‐Water): a brief introduction 108 1. Objectives of SEEA‐Water SEEA-Water (United Nations Statistics Division, 2012) is the conceptual framework prepared by the United Nations Statistics Division to organize hydrological and economic information in a coherent and consistent manner. SEEA-Water was developed with the objectives of standardizing concepts and methods in water accounting. The advantage of the SEEA-Water approach is that it provides a tool to integrate hydrological and economic information in support of environmental-economic analysis, thus overcoming the tendency to divide issues along disciplinary lines. SEEA-Water is potentially an important tool for policy-makers, as it provides them with indicators to monitor the interaction between the environment and the economy, with a database for strategic planning and policy analysis to identify sustainable development paths and appropriate policy instruments for implementing them. In 2010 the International Recommendations for Water Statistics (United Nations Statistics Division, 2012) were adopted to assist countries in the implementation of SEEA-Water. SEEA-Water has been divided into four areas of policy application presented in Figure A.1. in order to prioritise its implementation in countries according to policy demand. WASH Accounts are linked to the first quadrant “Improving drinking and sanitation services.” Figure A.1 - The WASH Accounts in relation to the overall System of National Accounts The SEEA-Water framework comprises the five categories of accounts:  Category 1: Physical supply and use tables describing the flows of water from the environment within the economy and back to the environment;  Category 2: Emission accounts describing the amounts of pollutants added to water as a result of production and consumption;  Category 3: Hybrid and economic accounts linking the physical accounts with the monetary information of the national accounts, disaggregated for water and sanitation;  Category 4: Water asset accounts;
  • 110.
     Category 5:Quality accounts describing the quality of water and the changes in quality; these 109 accounts are still experimental. Of these, category 3 (hybrid and economic accounts) is particularly interesting in terms of tracking national financial flows to water and sanitation services. This category of accounts aligns physical information with monetary information on supply and use. These accounts are referred to as “hybrid” because they combine different types of measurement units. In these accounts, physical quantities can be compared with the matching economic flows. This category of accounts includes information on the costs associated with water use and supply, such as water abstraction, purification, distribution and wastewater treatment. It also provides information on financing - for example, the amount users pay for the services of wastewater treatment, and the extent to which these services are subsidized by the government and other units. These accounts can help governments take decisions in terms of cost recovery policies and water allocation policies and can be used in economic models to evaluate potential costs and benefits of putting in place new infrastructure. Hybrid and economic accounts describe in monetary terms the use and supply of water-related products to identify: 1. the costs associated with the production of these products; 2. the income generated by their production; 3. the investment in water-related infrastructure and the costs to maintain them ; 4. the fees paid by the users for water-related services as well as the subsidies received. 2. SEEA‐Water tables purpose and content Hybrid and economic accounts are composed of three types of tables: 1. The Hybrid Supply and Use Tables, consolidated in the Hybrid Account for Supply and Use of Water; 2. The Economic Accounts that expand the “hybrid accounts” for (a) water‐related activities carried out for own use (Hybrid Accounts for water supply and sewerage for Own Use) and (b) government expenditures for water‐related services (Government Accounts for water-related collective consumption services); 3. The National Expenditure Accounts and Financing Accounts for water-related activities classified by purpose. Figure A.1 summarises the tables and data that comprises SEEA-Water. Table A.1 - Summary of SEEA-Water Accounts Tables Information Water Sanitation W&S Hybrid supply Table Water and sewerage services output of (HST) industries by ISIC categories x Hybrid Use Table (HUT) Water and sewerage services use and consumption by type of users (intermediate and final) x Hybrid Account for Supply and Use of Water (HASU) Output and consumption (intermediary and final) of water and sewerage services, by type of producers (ISIC) and users (industries, households and the government). x
  • 111.
    110 Hybrid Accountsfor water supply and sewerage for Own Use (HAOU) Costs of production of water and sewerage supply for own use, for ISIC industries and household x Government Accounts for water-related collective consumption services (GA) Costs of production of government water-related collective consumption services (by COFOG categories) x National Expenditure Accounts (NEA) Expenditure for use of water and sewerage services by type of users and beneficiaries (2 tables) Financing Accounts (FA) Expenditure by financing sectors bearing the costs of the water and sewerage services consumed by type of users (2 tables) a. The supply and use hybrid accounts x x x x The Hybrid Account for Supply and Use of Water juxtapose the standard System of National Accounts (SNA) supply and use tables with the corresponding physical tables describing the volumes of supplied and used water. The Hybrid Account for Supply and Use of Water presented in Table A.2. provides information on the output and consumption of water and sewerage services produced by ISIC categories of industries. ISIC class 36 and 37 corresponding to the suppliers of water and sewerage services are particularly relevant for supply. The account presents data on water-related output, the intermediate consumption and use of water and sewerage services, including their costs of purchase, and the total value added produced by these industries. Output and consumption are estimated at purchaser’s price. It provides also information on gross fixed capital formation for water-related infrastructure by industry, which represents the investments in fixed capital related to water (infrastructures). It finally shows the closing stocks of fixed assets for water supply and sanitation (e.g. pumps and dams). They represent the total value of infrastructure in place and are distinguished between water supply and wastewater services assets.
  • 112.
    111 Table A.2- Hybrid account for supply and use of water Source: (United Nations Statistics Division, 2012) b. Further disaggregation of hybrid accounts To provide a complete picture of the economy of water, the hybrid account is expanded into two additional tables: (a) water-related activities carried out for own use and (b) government expenditures for water-related services. These activities are not identified explicitly in the SNA and their costs are incorporated into those of the principal activity of the entity (industry, household or government). The SEEA-Water identifies them to better assess how much is spent by each economic activity for the provision of water and sanitation services. The “Hybrid Account for water supply and sewerage carried out for Own Use” presented in Table A.3. identifies the intermediate costs and outputs of activities carried out by household and industries for their own use. Costs are categorised by type of activities (water and sewerage services). Since reliable market prices do not generally exist for these activities, the value of the output of these activities is by convention equal to the costs of production, that is the sum of intermediate consumption, compensation of employees, consumption of fixed capital and other taxes (less subsidies) on production.
  • 113.
    112 Table A.3- Hybrid Account for water supply and sewerage carried out for Own Use Source: (United Nations Statistics Division, 2012) The Government Accounts for water-related collective consumption services presented in Table A.4. identifies governmental expenditures according to the Classification of the Functions of Government (COFOG). It classifies expenditures of the government by type of expenditure according to the function that the transaction serves. The following functions classified in COFOG are relevant for water:  Wastewater management  Soil and groundwater protection  Environmental protection not elsewhere classified (related to water)  Water supply COFOG categories refer to collective services of the government. The collective consumption services are assumed to be produced and used by the government. The value of these activities is equal to the costs of their production, namely, the sum of intermediate consumption, compensation of employees, consumption of fixed capital and other taxes less subsidies on production. These accounts can be further disaggregated for central, state and local governments.
  • 114.
    113 Table A.4- Government accounts for water-related collective consumption services Source: (United Nations Statistics Division, 2012) c. The National Expenditure and Financing Accounts for water‐related activities classified by purpose These accounts are compiled for water-related activities of the Classification of Environmental Protection Activities and Expenditure) (CEPA), namely wastewater management and water management and exploitation. For each of these two activities, the expenditure is allocated by beneficiaries: “producers”, “final consumers” (households and governments) and “rest of the world”. Producers are further disaggregated into “specialised producers” and “other producers”. Specialized producers are defined as those that carry out an environmental protection activity as their principal activity. “Other producers” are those that use environmental protection services (including the use of such services for own use) and connected and adapted products for their intermediate consumption, invest in the production of environmental protection services for own use and receive specific transfers for environmental protection. The National Expenditure Accounts disaggregate the expenditure of resident units and financed by resident units by type of costs. Table A.5. presents the standard National Expenditure Account for wastewater management. The elements of costs are disaggregated in:  Use of services by resident unit (except “specialized producers” to avoid double-counting);  Use of “adapted and connected products”10 for intermediate and final consumption;  Gross capital formation for producing the services;  Specific transfers received to contribute to the financing of environmental protection. The sum corresponds to the total domestic use of the services. 10 In the case of wastewater management, adapted products include, for example, phosphate-free washing products and highly biodegradable products. Connected products include, for example, septic tanks, biological activators of septic tanks and services for collecting septic tank sludge.
  • 115.
    114 Table A.5- National Expenditure Account for wastewater management (billions of currency units) Source: (United Nations Statistics Division, 2012) The Financing Account presents how national expenditures on water and wastewater management is financed by identifying the financing sector (sector providing the financing) and the beneficiaries (the units benefiting from the financing) as well as the amount being financed. Table A.6. presents the standard Financing Accounts for waste water management. Financing units are classified according to the institutional sectors of national accounts (general government, which can be further disaggregated under central and local government, non-profit institutions serving households, corporations and households). Entries in the column describe how the expenditures are financed. Table A.6 - Financing Account for waste water management (millions of currency units) Source: (United Nations Statistics Division, 2012) Table A.7 provides information on the classification of financing sectors of SEEA-Water used in the Financing Accounts and the type of funding included in each category.
  • 116.
    115 Table A.7- Classification of financing sectors used in the SEEA-Water Financing Accounts SEEA-Water classification of Financing sectors Type of funding included in the SEEA-Water Financing Accounts General Government (central and local government) - Subsidies to producers : specific transfers, investment grants (that are not earmarked taxes) - Transfers to government agencies - Social transfer in kind to households Not-for-profit institutions serving households - Social transfer in kind to households Corporations - Own funds to finance their production and capital formation - Subsidies to other producers - Tariff paid as users to utilities - Earmarked taxes from corporations Households - Tariff paid by users (Households) to utilities - Household out-of-pocket expenditure for self-supply - Earmarked taxes from households Rest of the world - International cooperation funds - Other flows received from the rest of the world (not specified)
  • 117.
    116 Annex C‐ Glossary Note that terms which appear in Italics are defined elsewhere in the glossary. Term Definition Source Bond A method of borrowing used by private companies, governments or municipalities consisting of the issue of fixed interest securities, repayable in a specified date. Certain government bonds have no fixed redemption date, and can be sold at their prevailing market price. Small Scale Finance for Water and Sanitation (Trémolet, 2012) Capital expenditure (CapEx), including hardware and software Initial costs of putting new services into place, including “hardware” such as pipes, toilets and pumps and one-off “software” costs such as associated training and consultations. WASHCost Capital maintenance expenditure (CapManEx) Occasional large maintenance costs for the renewal, replacement and rehabilitation of a system that goes beyond routine maintenance to repair and replace equipment, in order to keep systems running. These essential expenditures are required before failure occurs to maintain service levels and need to be planned for. WASHCost Closing stocks of fixed assets Closing stocks = opening stocks + gross fixed capital formation – consumption of fixed capital + other changes in volume of asset + holding gains/losses on assets Where:  Other changes in the volume of the asset are those that are not due to transactions, such as changes in classification, discoveries and natural disasters.  Holding gains/losses on assets are the changes in the price of assets. SNA (SNA 2008) Commercial loan A loan extended by commercial banks or development finance agencies at commercial rates, i.e. interest rates that reflect market conditions. Compensation of human resources (employees and self-employed professional remuneration) Total remuneration paid by an enterprise to an employee in return for work performed during the accounting period. It includes wages and salaries and all forms of social benefits, payments for overtime or night work, bonuses, allowances, as well as the value of in-kind payments such as the provision of uniforms for medical staff. This category also includes the remuneration of the income of non-salaried self-employed professionals. SNA (SNA 2008) Concessionary loan (or ‘soft loan’) A loan provided on concessionary lending terms, which may include a lower interest rate than the market rate, a longer repayment period or a grace period. Small Scale Finance for Water and Sanitation Consumption of fixed capital Cost of the decline in value of the producer's stock of fixed assets as a result of physical deterioration, foreseen obsolescence or normal or accidental damage in the accounting period. It corresponds to “depreciation” in the SNA (SNA 2008)
  • 118.
    117 Term DefinitionSource business management terminology. It should reflect the use of capital as a factor of production. It includes the use of buildings, equipment and other capital goods such as vehicles. It excludes the rentals paid on the use of equipment or buildings, and fees, commissions, royalties, etc., payable under licensing arrangements, which are included as the purchase of services. Domestic public transfers Public transfers from government agencies (central or local government) to WASH actors. These are often subsidies that come from taxes or other sources of revenues of the government. These are referred to as “taxes” in the OECD 3T terminology. WASH Accounts Equity investments A form of finance in which investors take an ‘equity stake’, which means that they purchase shares in an entity. This enables them to share the risk of that entity (through fluctuations in the share price) in return for the prospect of sharing its profits (through dividend payments). The higher the investment risk, the higher the expected level of return. Small Scale Finance for Water and Sanitation Factors of production Factor inputs used by providers to produce the goods and services consumed or the activities conducted in the system. Are included:  the costs of production (intermediary consumption + gross valued added + Compensation of human resources + Other taxes less subsidies on production + Consumption of fixed capital);  Gross fixed capital formation;  Changes in the stock of assets. SNA (SNA 2008) Financing Act of providing funding Financing sources Where funding originates from before being channelled by financing units. The OECD 3T typology refers to financing sources as tariffs, taxes and transfers, to which must be added private repayable financing. We are proposing that the WASH Accounts classify financing sources as: Tariffs for services provided, Household out-of-pocket expenditure for self-supply, Domestic public transfers, International public transfers, Voluntary transfers, Private repayable financing. WASH Accounts Financing units Institutional entities that provide funding to the sector. They mobilise funding to pay for WASH services. They may allocate funds directly to service providers or channel them through intermediary institutions. WASH Accounts Funding Monetary value of the funds provided to support a given activity. Households’ out-of-pocket expenditure for self-supply Funding provided by households to invest in or provide the service themselves. This can be in form of cash, material or time (sometimes referred to as “sweat equity”). This would form part of tariffs as per the OECD 3T terminology. WASH Accounts Grant A form of development aid without repayment obligations. Grants might be untied or carry explicit or implied political and commercial obligations. Grants are usually provided by Small Scale Finance for Water and
  • 119.
    118 Term DefinitionSource IFIs, governments, foundations and specific funds with different policies, procedures and technical products. A grant can be blended with other kinds of finance to produce a suitable financing package for a particular project. Sanitation Gross Domestic Product GDP derives from the concept of value added. Gross value added is the difference between output and intermediate consumption. GDP is the sum of gross value added of all resident producer units plus that part (possibly the total) of taxes on products, less subsidies on products, that is not included in the valuation of output. Next, GDP is also equal to the sum of the final uses of goods and services (all uses except intermediate consumption) measured at purchasers’ prices, less the value of imports of goods and services. Finally, GDP is also equal to the sum of primary incomes distributed by resident producer units. SNA 2008 2.138 (SNA 2008) Gross fixed capital formation Total value of the fixed assets that service providers have acquired during the accounting period (less the value of the disposal of assets) and that are used repeatedly or continuously for more than one year in the production of services and goods. SNA (SNA 2008) Gross valued added Gross value added = output – intermediate consumption Gross value added is a measure of the contribution to GDP made by an individual producer, industry or sector. It is the value of output less the value of the goods and services, excluding fixed assets, consumed as inputs by a process of production (intermediate consumption). Once the value added has been generated, it can be decomposed in the primary factors for generation of income, according to the following formula: (Gross) value added = (gross) operating surplus + compensation of employees + taxes – subsidies SNA (SNA 2008) Guarantees A contract by a third party (C) to underwrite a financial commitment entered into by two parties (A and B). Guarantees can be used by national governments to reduce the risks of borrowing and bond issues by their sub-sovereign bodies and by international agencies to increase the creditworthiness of developing country institutions and support specific projects within them. Small Scale Finance for Water and Sanitation Intermediate consumption (materials and services used) Total value of goods and services used for the provision of goods and services (not produced in-house) bought in from other providers and other industries of the economy. All the materials and services are to be fully consumed during the production activity period. SNA 2008 6.123 (SNA 2008) International public transfers Funds from public donors and multilateral agencies that come from other countries. These funds can be contributed either in the form of grants, concessionary loans (i.e. through the grant element included in a concessionary loan) or guarantees. This category is included in the OECD 3T typology as “transfers”. Official Development Assistance constitutes a subset of international public transfers as it only captures funding originating from countries that are part of the OECD Development Assistance Committee. WASH Accounts
  • 120.
    119 Term DefinitionSource Microfinance institutions Refers to schemes for extending credit, savings, insurance, money transfers and other financial products to small business, farmers and other low-income borrowers who cannot get access to normal bank loans. Small Scale Finance for Water and Sanitation Net value added Net value added = Gross valued added – consumption of fixed capital = output – intermediate consumption – consumption of fixed capital Net value added is obtained from Gross value added less the Consumption of fixed capital that occurs when the reduction in the value of the fixed assets used in production during the accounting period results from physical deterioration, normal obsolescence or normal accidental damage. SNA (SNA 2008) Official Development Assistance (ODA) Grants or loans to countries and territories on the DAC List of ODA Recipients (developing countries) and to multilateral agencies which are: (a) undertaken by the official sector; (b) with promotion of economic development and welfare as the main objective; (c) at concessional financial terms (if a loan, having a grant element of at least 25 per cent). The OECD DAC database at present only tracks ODA flows from OECD member countries but is looking to develop coverage of other non-OECD donors. OECD Operating and maintenance expenditure Routine maintenance and operation costs to keep services running (e.g. wages, fuel or any other regular purchases). Operating expenditures is the recurrent (regular, ongoing) spending to provide WASH goods and services: labour, fuel, chemicals, materials, and purchases of any bulk water. Maintenance expenditure is the routine expenditure needed to keep systems running at design performance, but does not include major repairs or renewals which are recognised as not recurrent. WASHCost Private repayable financing Refers to sources of finance that come from private sources and ultimately need to be repaid, such as loans, equity investments or other financial instruments such as bonds. WASH Accounts Service providers Actors that are engaged in the production of WASH goods and services. WASH Accounts Software cost Cost of software activities associated with infrastructure development, such as for project preparation, capacity building, training, community mobilization and behavioural change activities Subsidies A subsidy is a grant given generally by the government to economic actors in various forms, such as a cash transfer, a tax reduction or inputs at lower prices (such as free land). A subsidy can be given to economic actors as an incentive to deliver goods and/ or services that benefit society. A subsidy can also be provided to households below the poverty line to enable them to access basic goods and Small Scale Finance for Water and Sanitation
  • 121.
    120 Term DefinitionSource services. Subsidies are sometimes provided to support utility infrastructure projects and may include ‘hardware subsidies’ (to reduce the initial capital investment costs), ‘operating subsidies’ (to cover losses incurred during service operation) or ‘software subsidies’ (to cover the software costs associated with the infrastructure development, such as for project preparation, capacity building and training). A hidden form of public subsidy may consist of making an equity investment with no expectation of a repayment or a return. Support or software costs Includes expenditure on direct and indirect support. Expenditure on direct support (ExpDS) includes expenditure on both pre- and post-construction support activities directed to local-level stakeholders (e.g. training for community or private sector operators, users or user groups). Expenditure on indirect support (ExpIDS) includes the cost of planning and policy-making at the governmental level, including strengthening the skills and capacities of professionals and technicians. These costs have a direct impact on the long-term sustainability of projects. WASHCost Tariffs Funds contributed by users of WASH services for obtaining the services. In the OECD 3T typology, tariffs include two types of funding:  Tariffs for services provided  Households’ out-of-pocket expenditure for self-supply The WASH Accounts terminology proposes to separate out these two types of funds to avoid confusion. OECD 3T typology (OECD, 2009) Tariffs for services provided Payments made by users to service providers for getting access to and for using the service. WASH Accounts Taxes Funds originating from domestic taxes which are channelled to the sector via transfers from all levels of government, including national, regional or local. Such funds would typically be provided as subsidies, for capital investment or operations. “Hidden” forms of subsidies may include tax rebates, concessionary loans (i.e. at a subsidised interest rate) or subsidised services (such as subsidised electricity). OECD 3T typology (OECD, 2009) Transfers Funds from international donors and international charitable foundations (including NGOs, decentralized cooperation or local civil society organizations) that typically come from other countries. These funds can be contributed either in the form of grants, concessionary loans (i.e. through the grant element included in a concessionary loan, in the form of a subsidised interest rate or a grace period) or guarantees. The WASH Accounts terminology proposes to separate international public transfers and voluntary transfers to avoid confusion. OECD 3T typology (OECD, 2009) Voluntary transfers Funds from international and national non-governmental donors including from charitable foundations, Non-
  • 122.
    121 Term DefinitionSource Governmental Organizations (NGOs) and civil society organizations. These funds can be contributed either in the form of grants, concessionary loans (i.e. through the grant element included in a concessionary loan, in the form of a subsidised interest rate or a grace period) or guarantees.
  • 123.
    Annex D -References Partners for Health Reformplus. (2002). Using NHA to Inform the Policy Process- NHA Global Policy Brief. Bethesda, MD: Abt Associates Inc. AMCOW, EUWI, UNDP. (2006). Getting Africa on track to meet the MDGs on water and sanitation - A status overview of sixteen African countries. AMCOW. Barnett, C., & al. (2001). The Application of National Health Accounts Framework to HIV/AIDS in Rwanda. Special Initiatives Report No. 31. Bethesda, MD: Partnerships for Health Reform Project, Abt Associates Inc. De, S., & al. (2003). Has Improved Availability of Health Expenditure Data Contributed to Evidence- Based Policymaking? Country Experiences with National Health Accounts. Health Systems 20/20. (2011). Mali NHA policy Impact. Health Systems 20/20. Hernandez, P. (2012). Health Accounts : a review of 20 years of experience, Presentation for the 2012 Stockholm World Water Week. Maeda, A., & al. (2012). Creating Evidence for Better Health Financing Decisions: A Strategic Guide for the Institutionalization of National Health Accounts. The World Bank. McIntyre, D., & al. (1995). Health Expenditure and Finance in South Africa. South Africa: Health Systems Trust and the World Bank. OECD. (2011). A System of Health Accounts. Paris: OECD Publications. OECD. (2011). Benefits of Investing in Water and Sanitation: An OECD perspective. Paris: OECD Publishing. OECD. (2010). Innovative financing mechanisms for the water sector. Paris: OECD Publications. OECD. (2009). Managing Water for All - An OECD perspective on pricing and financing. Paris: OECD Publications. SNA 2008. (2009). System of National Accounts 2008. New York: United Nations. Snehalatha, M., & al. (2011). Looking Beyond Capital Costs - Life Cycle Costing for Sustainable Service Delivery -A Study from Andhra Pradesh, India. Hyderabad: WASHCost (India) Project, Center for economics and social studies. The World Bank . (2010). Harnessing National Health Accounts to Strengthen Policymaking - Compendium of Case Studies. Washington, DC: The World Bank. Trémolet. (2012). Small-scale finance for water and sanitation. Stockholm: EU Water Initiative and Share. Trémolet, S., & Binder, D. (2010). Evaluating the effectiveness of public finance for household sanitation in Dar Es Salaam, Tanzania. 122
  • 124.
    Trémolet, S., &Rama, M. (2012). Tracking national financial flows into sanitation, hygiene and drinking water. Geneva: WHO. United Nations Statistics Division. (2012). International recommendations for water statistics . New- York: United Nations Publications. United Nations Statistics Division. (2012). System of Environmental-Economic Accounting for Water. New-York: United Nations Publications. WHO. (2012). UN-water global annual assessment of sanitation and drinking-water (GLAAS) 2012 report. Geneva: WHO . Winpenny, J. (2003). Financing water for all. World Water Council, Secretariat of the 3rd World Water Forum and Global water Partnership. 123 Relevant websites National Health Accounts http://www.who.int/nha/en/ UN Statistics Division – International classifications registry http://unstats.un.org/unsd/cr/registry/regct.asp?Lg=1 SEEA-Water http://unstats.un.org/unsd/envaccounting/seeaw/