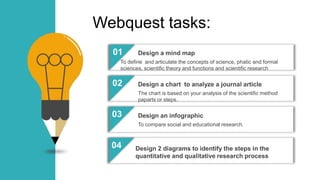
Module 2 Webquest
“Research, the scientific
method and social
research”
Prof. Andrea Bernal Hernández
Webquest tasks:
01
02
03
04
Design a mind map
To define and articulate the concepts of science, phatic and formal
sciences, scientific theory and functions and scientific research
Design a chart to analyze a journal article
The chart is based on your analysis of the scientific method
paparts or steps.
Design an infographic
To compare social and educational research.
Design 2 diagrams to identify the steps in the
quantitative and qualitative research process
a. Science
Task 1 Design a mind map to articulate and define the following concepts
Add Contents Title
1. Read chapter 1.4 to 2.5
2. As you read take notes of the
following concepts
Ñaupas Paitán, H., Mejía Mejía, E., Novoa Ramírez,
E., & Villagómez Paucar, A. (2014). Metodología de
la investigación. Cuantitativa, cualitativa y redacción
de la tesis. Cuarta edición. Ediciones de la U. Bogot
á, DC Colombia.
b. Phatic and formal sciences
c. Scientific theory and its functions
d. Scientific research
3. Design a mind map to articulate
and define the concepts
Task 2 Design charts to identify the parts of the scientific method
Read: Ñaupas Paitán, H., Mejía Mejía, E., Novoa Ramírez, E., & Villagómez Paucar, A. (2014). Metodología de la
investigación. Cuantitativa, cualitativa y redacción de la tesis. Cuarta edición. Ediciones de la U. Bogotá, DC Colo
mbia. Chapter 3 The scientific Method
The scientific
method
Parts
Bunge states the
following
1. Discover the
problem…
2.
3.
4.
Example
Article
analysis
Article title
and link
STEPS
IDENTIFIED
1. Explain
2. Explain
3. Explain
4. Explain
The scientific
method
Parts
Tecla and Garza
(1965)
1.
2.
3.
4.
Instructions
1. Read the diverse steps to
develop the scientific method
according to the authors cited by
Ñaupas et al (2013)
2. Design charts to identify the
parts proposed by each author
3. In Google scholar find an article
result of research about a topic
you like
4. Read the article
5. Article analysis: Design a chart
that shows the parts of the
scientific method identified in the
article
Task 3 Infographic to compare social and educational research
1. Read the following suggested readings and based on the definitions design the infographic:
a. Social Research pages 88-90 Ñaupas Paitán, H., Mejía Mejía, E., Novoa Ramírez, E., & Villagómez Paucar, A. (2014). Metod
ología de la investigación. Cuantitativa, cualitativa y redacción de la tesis.
b. Characteristics of educational research. Pages 13-17. McMillan, J. H., & Schumacher, S. (2005). Investigación educativa una
introducción conceptual. Pearson educación.
Social Research.
It is…
Characteristic 1
It is….
Characteristic 2
Educational
Research.
It is…
Characteristic 1
It is….
Characteristic 2
Example
Task 4 : Design 2 diagrams
Instructions:
1. Read about the quantitative and qualitative research process. Pages 4 to 18. Hernández Sampieri, R., Fernán
dez Collado, C., & Baptista Lucio, P. (2010). Metodología de la investigación (Vol. 3). México: McGraw-Hill.
2. In Academia.com find a qualitative and a quantitative study.
3. Design 2 diagrams to represent the process you identify in each study
Phase 1…….
Phase 2…….Phase 3…….
Phase 4……. etc
ASSESSMENT
50 40 30 20 10
EXCELLENT GOOD AVERAGE
NEEDS TO BE IMPR
OVED
DIDN'T DO THE
TASK
The students com
pleted the task foll
owing all the instru
ctions reaching the
goals of the unit
The students com
pleted the task foll
owing most of the
instructions reachi
ng the goals of the
unit
The students co
mpleted the task
following some o
f the instructions
reaching some of
the goals of the u
nit
The students comp
leted the task, but
didn't follow most
of the instructions
The student did
n't complete th
e task
Conclusions
Answer the following questions
What did you learn?
What concepts do you have questions
about?
What task were difficult? Why?
01
02
03
Useful sources
You can use these sources to develop the tasks
About infographics:
https://venngage.com/blog/wh
at-is-an-infographic/#1
To design diagrams and mind
maps:
Mindmaster, Gliffy or Genialy
Thank you

Webquest 2 researh principles

  • 1.
    Module 2 Webquest “Research,the scientific method and social research” Prof. Andrea Bernal Hernández
  • 2.
    Webquest tasks: 01 02 03 04 Design amind map To define and articulate the concepts of science, phatic and formal sciences, scientific theory and functions and scientific research Design a chart to analyze a journal article The chart is based on your analysis of the scientific method paparts or steps. Design an infographic To compare social and educational research. Design 2 diagrams to identify the steps in the quantitative and qualitative research process
  • 3.
    a. Science Task 1Design a mind map to articulate and define the following concepts Add Contents Title 1. Read chapter 1.4 to 2.5 2. As you read take notes of the following concepts Ñaupas Paitán, H., Mejía Mejía, E., Novoa Ramírez, E., & Villagómez Paucar, A. (2014). Metodología de la investigación. Cuantitativa, cualitativa y redacción de la tesis. Cuarta edición. Ediciones de la U. Bogot á, DC Colombia. b. Phatic and formal sciences c. Scientific theory and its functions d. Scientific research 3. Design a mind map to articulate and define the concepts
  • 4.
    Task 2 Designcharts to identify the parts of the scientific method Read: Ñaupas Paitán, H., Mejía Mejía, E., Novoa Ramírez, E., & Villagómez Paucar, A. (2014). Metodología de la investigación. Cuantitativa, cualitativa y redacción de la tesis. Cuarta edición. Ediciones de la U. Bogotá, DC Colo mbia. Chapter 3 The scientific Method The scientific method Parts Bunge states the following 1. Discover the problem… 2. 3. 4. Example Article analysis Article title and link STEPS IDENTIFIED 1. Explain 2. Explain 3. Explain 4. Explain The scientific method Parts Tecla and Garza (1965) 1. 2. 3. 4. Instructions 1. Read the diverse steps to develop the scientific method according to the authors cited by Ñaupas et al (2013) 2. Design charts to identify the parts proposed by each author 3. In Google scholar find an article result of research about a topic you like 4. Read the article 5. Article analysis: Design a chart that shows the parts of the scientific method identified in the article
  • 5.
    Task 3 Infographicto compare social and educational research 1. Read the following suggested readings and based on the definitions design the infographic: a. Social Research pages 88-90 Ñaupas Paitán, H., Mejía Mejía, E., Novoa Ramírez, E., & Villagómez Paucar, A. (2014). Metod ología de la investigación. Cuantitativa, cualitativa y redacción de la tesis. b. Characteristics of educational research. Pages 13-17. McMillan, J. H., & Schumacher, S. (2005). Investigación educativa una introducción conceptual. Pearson educación. Social Research. It is… Characteristic 1 It is…. Characteristic 2 Educational Research. It is… Characteristic 1 It is…. Characteristic 2 Example
  • 6.
    Task 4 :Design 2 diagrams Instructions: 1. Read about the quantitative and qualitative research process. Pages 4 to 18. Hernández Sampieri, R., Fernán dez Collado, C., & Baptista Lucio, P. (2010). Metodología de la investigación (Vol. 3). México: McGraw-Hill. 2. In Academia.com find a qualitative and a quantitative study. 3. Design 2 diagrams to represent the process you identify in each study Phase 1……. Phase 2…….Phase 3……. Phase 4……. etc
  • 7.
    ASSESSMENT 50 40 3020 10 EXCELLENT GOOD AVERAGE NEEDS TO BE IMPR OVED DIDN'T DO THE TASK The students com pleted the task foll owing all the instru ctions reaching the goals of the unit The students com pleted the task foll owing most of the instructions reachi ng the goals of the unit The students co mpleted the task following some o f the instructions reaching some of the goals of the u nit The students comp leted the task, but didn't follow most of the instructions The student did n't complete th e task
  • 8.
    Conclusions Answer the followingquestions What did you learn? What concepts do you have questions about? What task were difficult? Why? 01 02 03
  • 9.
    Useful sources You canuse these sources to develop the tasks About infographics: https://venngage.com/blog/wh at-is-an-infographic/#1 To design diagrams and mind maps: Mindmaster, Gliffy or Genialy
  • 10.