Download as PDF, PPTX
![1
Web Search Engine Metrics
for Measuring User
Satisfaction
[Section 7 of 7: Presentation]
Ali Dasdan, eBay
Kostas Tsioutsiouliklis, Yahoo!
Emre Velipasaoglu, Yahoo!
With contributions from Prasad Kantamneni, Yahoo!
27 Apr 2010
(Update in Aug 2015: The authors work in different companies now.)](https://image.slidesharecdn.com/web-search-metrics-tutorial-www2010-section-7of7-presentation-150830231036-lva1-app6891/85/Web-search-metrics-tutorial-www2010-section-7of7-presentation-1-320.jpg)


![© Dasdan, Tsioutsiouliklis, Velipasaoglu, 2009-2010.
7
7
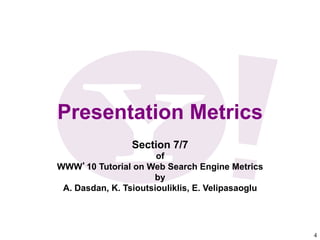
Example: query [obama] on Yahoo!
7](https://image.slidesharecdn.com/web-search-metrics-tutorial-www2010-section-7of7-presentation-150830231036-lva1-app6891/85/Web-search-metrics-tutorial-www2010-section-7of7-presentation-7-320.jpg)


![© Dasdan, Tsioutsiouliklis, Velipasaoglu, 2009-2010.
11
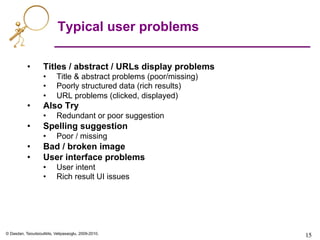
Presentation aspects and issues
• What kind of information should be displayed
• How much variation can there be in a UI without being
overwhelming
• Where should information be displayed - layout
• How do Presentation elements impact perception, and usage
– Font size and type, colors, design elements, Interaction design
• How do we generalize the findings to other countries
• How to plan changes in an interface
• How to tune a UI given that user expectations are evolving
[KO’09], [MK’08], [HLZF’06], [ABD’06], [ABDR’06]](https://image.slidesharecdn.com/web-search-metrics-tutorial-www2010-section-7of7-presentation-150830231036-lva1-app6891/85/Web-search-metrics-tutorial-www2010-section-7of7-presentation-11-320.jpg)
![© Dasdan, Tsioutsiouliklis, Velipasaoglu, 2009-2010.
13
13
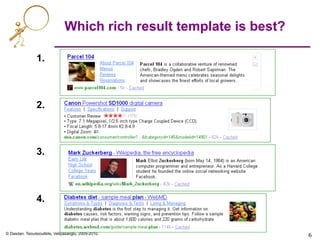
Clustered search: Clusters
[H’09]
Product clusters](https://image.slidesharecdn.com/web-search-metrics-tutorial-www2010-section-7of7-presentation-150830231036-lva1-app6891/85/Web-search-metrics-tutorial-www2010-section-7of7-presentation-13-320.jpg)
![© Dasdan, Tsioutsiouliklis, Velipasaoglu, 2009-2010.
14
14
Clustered search: Expansion
[H’09]](https://image.slidesharecdn.com/web-search-metrics-tutorial-www2010-section-7of7-presentation-150830231036-lva1-app6891/85/Web-search-metrics-tutorial-www2010-section-7of7-presentation-14-320.jpg)
![© Dasdan, Tsioutsiouliklis, Velipasaoglu, 2009-2010.
16
16
Bad quicklinks examples:
[amc theatre], [nobel prize]
[CKP’09], [CKP’08]](https://image.slidesharecdn.com/web-search-metrics-tutorial-www2010-section-7of7-presentation-150830231036-lva1-app6891/85/Web-search-metrics-tutorial-www2010-section-7of7-presentation-16-320.jpg)
![© Dasdan, Tsioutsiouliklis, Velipasaoglu, 2009-2010.
17
17
Bad rich result examples:
[droids], [hells canyon], [flickr]](https://image.slidesharecdn.com/web-search-metrics-tutorial-www2010-section-7of7-presentation-150830231036-lva1-app6891/85/Web-search-metrics-tutorial-www2010-section-7of7-presentation-17-320.jpg)

![© Dasdan, Tsioutsiouliklis, Velipasaoglu, 2009-2010.
22
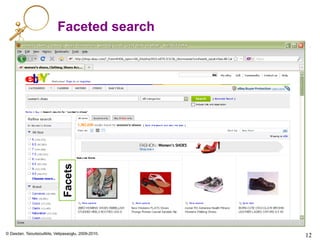
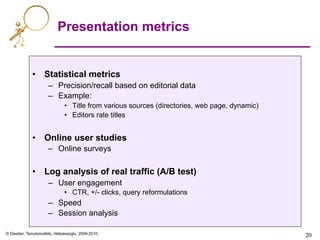
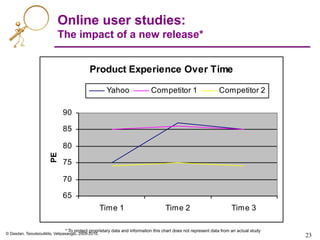
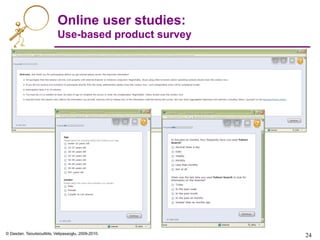
Online user studies
• Goal:
– To measure product experience
• Various types
– General surveys of a product
– Task-specific exercises
– Commercial products: userzoom.com, keynote.com
• Two dimensions of product experience:
1. Measured user experience
• Example:
– User given a set of tasks.
– What is the task completion success rate?
2. Perceived user experience
• Many sub-dimensions
– Ease of use
– Performance (e.g. response times)
– User-friendliness (e.g. fun, not user-engaging)
• Example:
– User given a set of tasks.
– How easily (in her opinion) did user complete tasks?
[A’09]](https://image.slidesharecdn.com/web-search-metrics-tutorial-www2010-section-7of7-presentation-150830231036-lva1-app6891/85/Web-search-metrics-tutorial-www2010-section-7of7-presentation-22-320.jpg)


![© Dasdan, Tsioutsiouliklis, Velipasaoglu, 2009-2010.
27
27
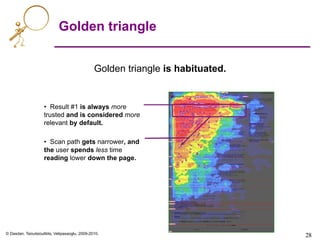
Heat maps
Highest density of
clicks concentrated
in hottest zone.
[E’05]](https://image.slidesharecdn.com/web-search-metrics-tutorial-www2010-section-7of7-presentation-150830231036-lva1-app6891/85/Web-search-metrics-tutorial-www2010-section-7of7-presentation-27-320.jpg)
![© Dasdan, Tsioutsiouliklis, Velipasaoglu, 2009-2010.
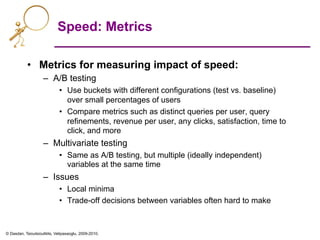
Speed
• Presentation is not just the visual aspects of a page
• Speed is also very important
– Among top ten core principles at Google [G’01]
• What is speed?
– Time-to-load, interaction with page, dynamic aspects
• Slow response times have direct impact on bottom
line
– Shopzilla [V’09]: A 5 second speed up (from 7 to 2 seconds)
resulted in:
• +25% page views
• +7-12% revenue
• -50% hardware](https://image.slidesharecdn.com/web-search-metrics-tutorial-www2010-section-7of7-presentation-150830231036-lva1-app6891/85/Web-search-metrics-tutorial-www2010-section-7of7-presentation-30-320.jpg)
![© Dasdan, Tsioutsiouliklis, Velipasaoglu, 2009-2010.
Speed: Conclusions
Steve Souders, Velocity and the bottom line [V’09]
• Impact
– Bing: 2sec slowdown resulted in -1.8% queries/user and -4.3%
revenue/user.
– Google Search: 400ms delay resulted in -0.59% change in
searches/user.
• Even after delay was removed there were -0.21% fewer searches.
– AOL: Page views per visit drop off with load time increases. 7.5 top
decile, 6 for 3rd decile, 5 for bottom decile.
– Google Search: A 500ms increase in load time (from 400ms to
900ms) resulted in a 25% dropoff in first result page.
• A 2% slowdown of search results resulted in 2% drop in searches/user.
• Perception of speed
– Total time-to-load vs. partial time-to-load (gradual page load)
• Easy ways to increase speed
– E.g. serve non-cookie content from a different server, put all
images into a single sprite](https://image.slidesharecdn.com/web-search-metrics-tutorial-www2010-section-7of7-presentation-150830231036-lva1-app6891/85/Web-search-metrics-tutorial-www2010-section-7of7-presentation-32-320.jpg)
![© Dasdan, Tsioutsiouliklis, Velipasaoglu, 2009-2010.
Reference review on presentation
metrics
• Enquiro Eye Tracking Reports I & II [E’05]
– Original eye-tracking studies showing golden triangle for SERP
• C. Clarke, et. al, The influence of caption features on
clickthrough patterns in web search [CADW’07]
• D.E. Rose, et. al, Summary attributes and perceived search
quality, WWW’07 [ROK’07] .
– Studies showing the effects of fixations and presentation patterns
• M. Hearst (2009), Search User Interfaces [H’09]
– Exhaustive review of user interfaces
• Steve Souders, Velocity and the bottom line [V’09]
– Rich collection of studies on impact of speed
34](https://image.slidesharecdn.com/web-search-metrics-tutorial-www2010-section-7of7-presentation-150830231036-lva1-app6891/85/Web-search-metrics-tutorial-www2010-section-7of7-presentation-34-320.jpg)
![© Dasdan, Tsioutsiouliklis, Velipasaoglu, 2009-2010.
35
35
References
• [A’09] W. Albert (2009), Unmoderated usability testing: experience from the field, Usability
Professionals Association Conference Panel.
• [ABD’06] E. Agichtein, E. Brill, and S.T. Dumais (2006), Improving web search ranking by
incorporating user behavior, SIGIR’06.
• [ABDR’06] E. Agichtein, E. Brill, S.T. Dumais, and R. Ragno (2006). Learning user interaction
models for predicting web search preferences, SIGIR’06.
• [AK’08] P. Anick, Peter and R.G. Kantamneni (2008), A longitudinal study of real-time search
assistance adoption, SIGIR’08.
• [CADW’07] C. Clarke, E. Agichtein, S. Dumais, and R. White (2007), The influence of caption
features on clickthrough patterns in web search, SIGIR’07.
• [CKP’08] D. Chakrabarti, R. Kumar, and K. Punera (2008), Generating succinct titles for web URLs,
KDD’08.
• [CKP’09] D. Chakrabarti, R. Kumar, and K. Punera (2009), Quicklink selection for navigational query
results, WWW’09.
• [E’05] Enquiro Eye Tracking Reports I & II (2005), http://www.enquiroresearch.com/.
• [G’01] http://www.google.com/corporate/tenthings.html
• [H’09] M. Hearst (2009), Search user interfaces, Cambridge University Press.
– http://searchuserinterfaces.com/
• [HLZF’06] E. Hovy, C. Lin, L. Zhou, and J. Fukumoto (2006), Automated summarization evaluation
with basic elements, LREC’06.
• [KO’09] T. Kanungo and D. Orr (2009), Predicting readability of short web summaries, WSDM’09.
• [MK’08] D. Metzler and T. Kanungo (2008), Machine learned sentence selection strategies for
query-biased summarization, SIGIR’08.
• [ROK’07] D.E. Rose, D. Orr, and R.G.P. Kantamneni (2007), Summary attributes and perceived
search quality, WWW’07.
• [V’09] http://radar.oreilly.com/2009/07/velocity-making-your-site-fast.html](https://image.slidesharecdn.com/web-search-metrics-tutorial-www2010-section-7of7-presentation-150830231036-lva1-app6891/85/Web-search-metrics-tutorial-www2010-section-7of7-presentation-35-320.jpg)

The document discusses various metrics and approaches for measuring user satisfaction with web search engines, emphasizing the importance of presentation aspects and speed in user experience. It covers both explicit and implicit metrics, including online user studies and eye-tracking studies, while providing case studies that show the impact of interface changes. Key problems addressed include managing user attention and optimizing information presentation to align with user intent.


