Download to read offline


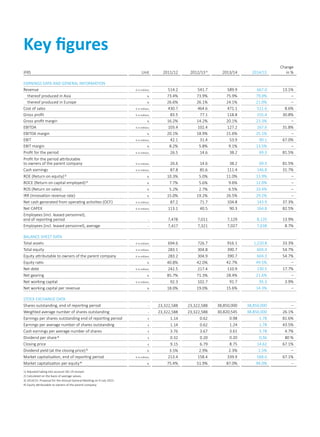
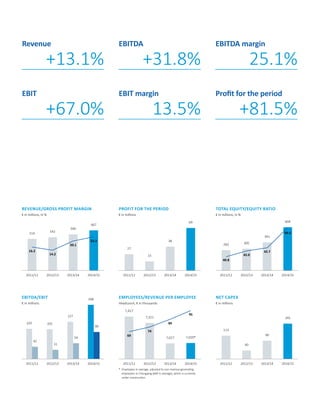
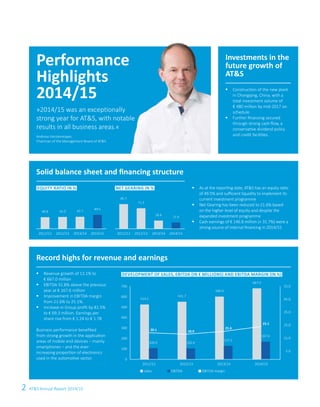

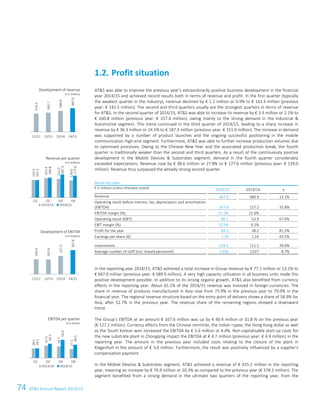
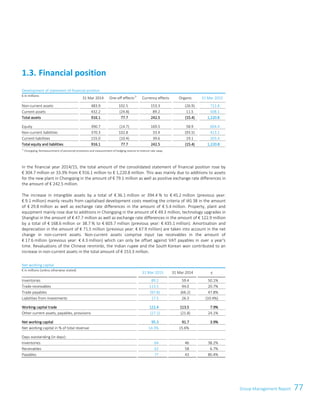
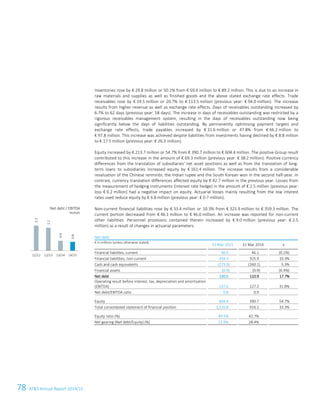
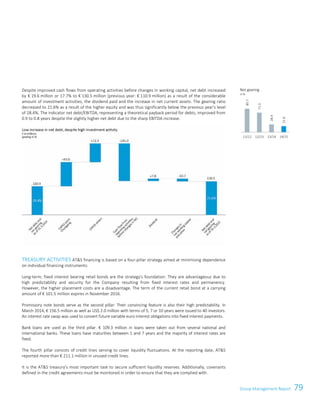
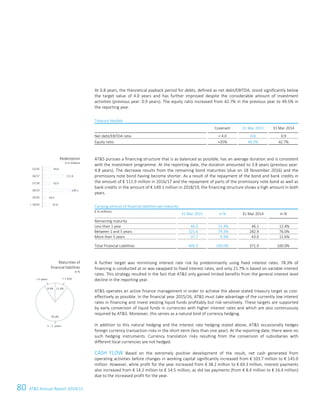
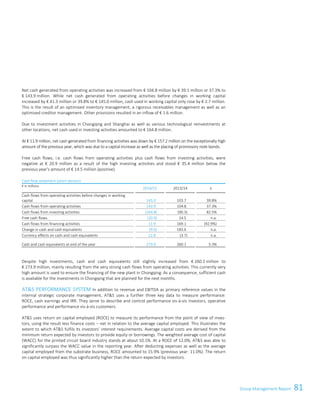
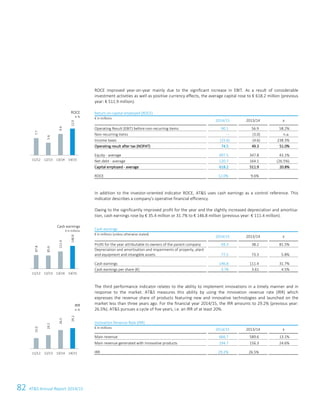
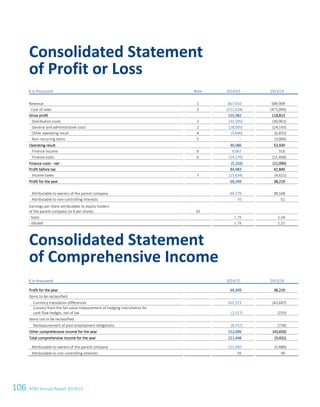
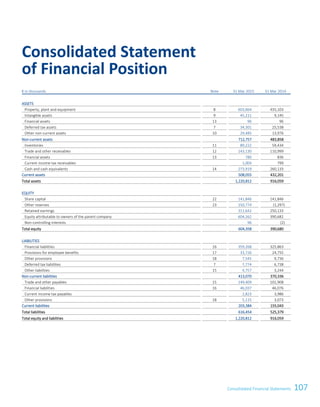
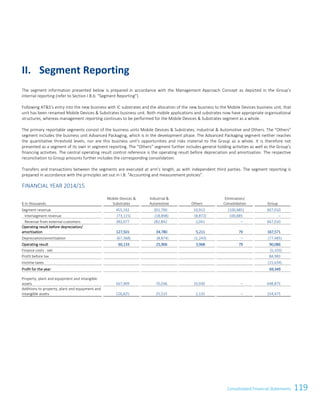
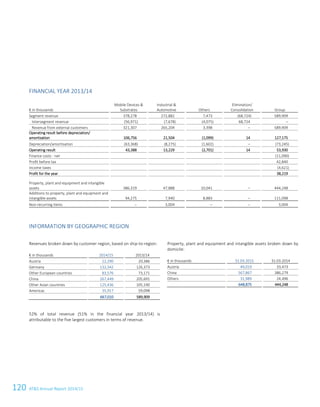
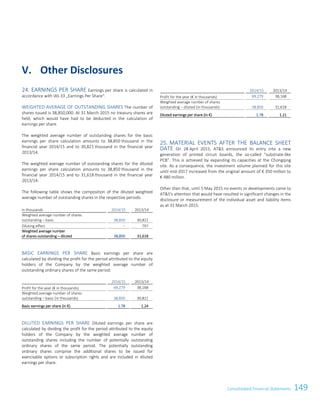


The annual report summarizes the company's financial performance in 2014/15. Some key points: - Revenue grew 13.1% to €667 million, with strong growth in mobile devices and automotive electronics. - Earnings also increased substantially, with EBITDA up 31.8% and profit for the period rising 81.5% to €69.3 million. - The balance sheet remains solid, with an equity ratio of 49.5% and reduced net gearing of 21.6%, allowing continued investment in expanding production capacity.


