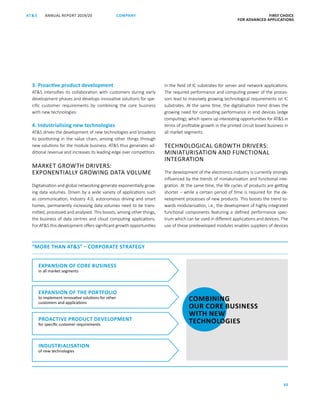
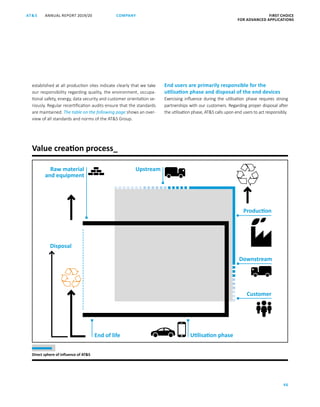
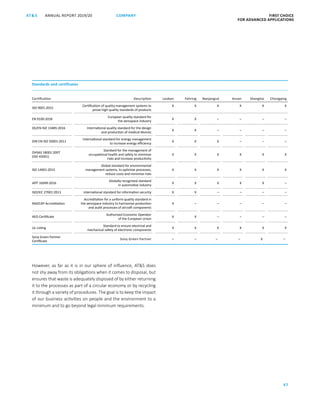
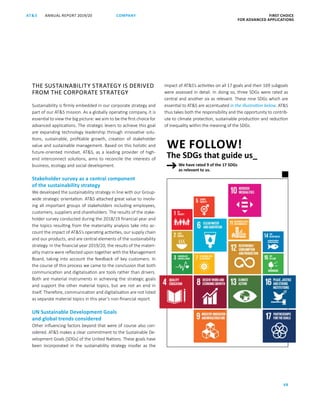
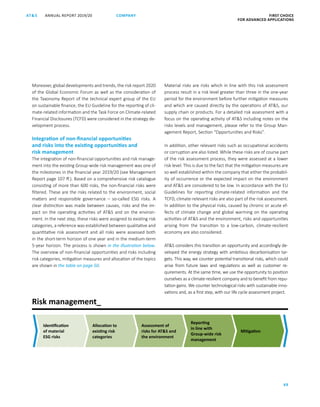
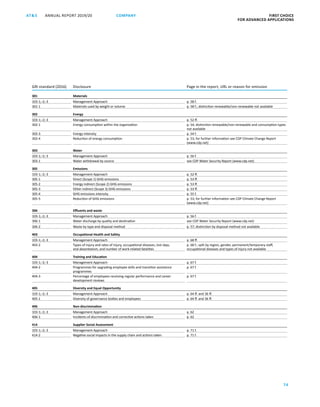
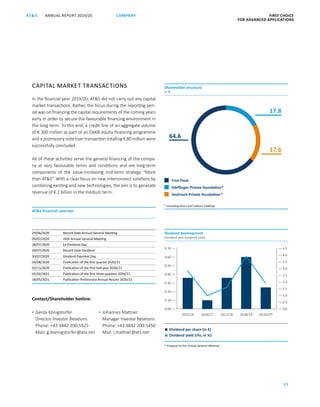
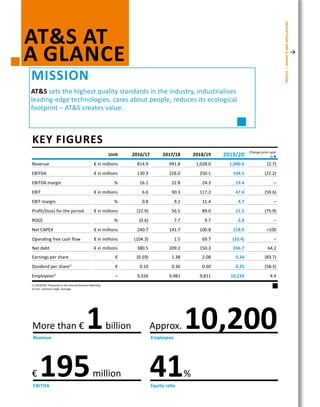
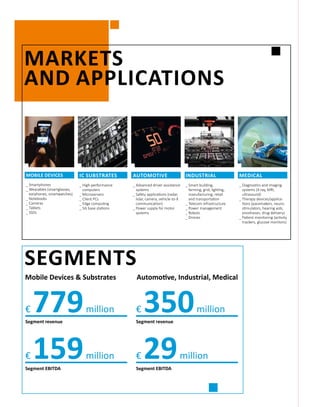
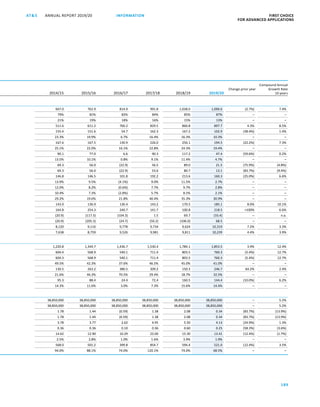
FIRST CHOICE
FOR ADVANCED
APPLICATIONS
STRONGFOR
tomorrow
ANNUAL REPORT 2019/20
KEY FIGURES
Employees
Equity ratio
Revenue
Approx. 10,200
41%
More than € 1billion
€ 195million
EBITDA
Unit 2016/17 2017/18 2018/19 2019/20
Change prior year
in %
Revenue € in millions 814.9 991.8 1,028.0 1,000.6 (2.7)
EBITDA € in millions 130.9 226.0 250.1 194.5 (22.2)
EBITDA margin % 16.1 22.8 24.3 19.4 –
EBIT € in millions 6.6 90.3 117.2 47.4 (59.6)
EBIT margin % 0.8 9.1 11.4 4.7 –
Profit/(loss) for the period € in millions (22.9) 56.5 89.0 21.5 (75.9)
ROCE % (0.6) 7.7 9.7 2.8 –
Net CAPEX € in millions 240.7 141.7 100.8 218.5 >100
Operating free cash flow € in millions (104.3) 1.5 69.7 (33.4) –
Net debt € in millions 380.5 209.2 150.3 246.7 64.2
Earnings per share € (0.59) 1.38 2.08 0.34 (83.7)
Dividend per share1)
€ 0.10 0.36 0.60 0.25 (58.3)
Employees2)
– 9,526 9,981 9,811 10,239 4.4
1) 2019/20: Proposal to the Annual General Meeting
2) incl. contract staff, average
AT&S AT
A GLANCE
MISSION
AT&S sets the highest quality standards in the industry, industrialises
­leading-edge technologies, cares about people, reduces its ecological
­footprint – AT&S creates value.
PROFILE—MARKETSANDAPPLICATIONS
Digital networking is bringing the world and
­industries closer together, opening up paths
to new applications and new growth for
AT&S. Products are becoming increasingly
powerful while taking up less space, because
the growing data volumes still need to be
securely processed, stored and transported.
AT&S ­supports customers with increasingly
­comprehensive solutions – these are the ele-
ments they need to successfully develop their
business models.
FIRST
CHOICE
FOR ADVANCED
APPLICATIONS
3
1
2
3
1
2
4
5
6
6
5
4
HEADQUARTERS
AT&S is one of the globally leading manufacturers of high-end printed circuit boards and
IC substrates. At its locations in Europe and Asia, AT&S develops and produces high-tech
solutions for its global partners, especially for applications in the areas of communication,
computer and consumer electronics, mobility, industry and medical technology. AT&S will
continue to drive the digital megatrends and grow profitably in the coming years. To do so,
AT&S will increase vertical integration and work even more closely together with its customers
as a system supplier.
PROFILE
PRODUCTION PLANTS
1 – LEOBEN, AUSTRIA
2 – FEHRING, AUSTRIA
3 – NANJANGUD, INDIA
4 – CHONGQING, CHINA
5 – SHANGHAI, CHINA
6 – ANSAN, SOUTH KOREA
1 – SAN JOSE, USA
2 – DÜREN, GERMANY
3 – BANGALORE, INDIA
4 – TOKYO, JAPAN
5 – TAIPEI, TAIWAN
6 – HONG KONG, CHINA (HOLDING)
SALES SUPPORT OFFICES
MARKETS
AND APPLICATIONS
Mobile Devices & Substrates
Segment EBITDA
Automotive, Industrial, Medical
Segment EBITDA
Segment revenueSegment revenue
SEGMENTS
€ 779million € 350million
€ 29million€ 159million
MOBILE DEVICES
_ Smartphones
_ Wearables (smart­glasses,
earphones, smart­watches)
_ Notebooks
_ Cameras
_ Tablets
_ SSDs
IC SUBSTRATES
_ High-performance
­computers
_ Microservers
_ Client PCs
_ Edge computing
_ 5G base stations
INDUSTRIAL
_ Smart building,
­farming, grid, lighting,
­manufacturing, retail
and transportation
_ Telecom infrastructure
_ Power management
_ Robots
_ Drones
AUTOMOTIVE
_ Advanced driver­assistance
systems
_ Safety applications (radar,
lidar, camera, vehicle-to-X
communi­cation)
_ Power supply for motor
systems
MEDICAL
_ Diagnostics and ­imaging
systems (X-ray, MRI,
­ultrasound)
_ Therapy devices/applica-
tions (pacemakers, neuro­
stimulators, hearing aids,
prostheses, drug delivery)
_ Patient monitoring (­activity
trackers, ­glucose monitors)
2
10
6Networking across all
areas of life and work
makes everyday life
easier.
Data transfer in real time
throws the door wide open to
new applications.
Smart
society
5G
GESCHÄFTSBERICHT 2019/20AT S
ANNUAL REPORT 2019/20AT S
3
14
18
78
116
186
	 GO BIG
6 – Smart society
10 – 5G
14 – Medical technology
	Company
20 – Management interview
28 – Strategy
32 – Report of the Supervisory Board
35 – Consolidated corporate governance report
44 – Non-financial report
75 – ATS on the capital market
	Group management
report
80 – Market and industry environment
87 – Economic report
100 – Other statutory information
104 – Research and development
107 – Opportunities and risks
115 – Outlook
	Consolidated financial
­statements
118 – Consolidated statement of profit or loss
118 – Consolidated statement of comprehensive income
119 – Consolidated statement of financial position
120 – Consolidated statement of cash flows
121 – Consolidated statement of changes in equity
122 – Notes to the consolidated financial statements
179 – Statement of all legal representatives
180 – Auditor’s report
	Information
188 – Ten-year timeline
190 – Glossary
192 – Imprint
People stay healthy for
­longer. Physical restrictions
are compensated for.
Medical
technology
4
FIRST CHOICE
FOR ADVANCED APPLICATIONS
4
175With the increasing net-
working of devices, data
volume will climb by 26%
annually, up to a level of
175 zettabytes by 2025.
In bytes that would be
175 plus 21 zeros.
GESCHÄFTSBERICHT 2019/20AT S
ANNUAL REPORT 2019/20AT S
5
GO
BIG
FIRST CHOICE
FOR ADVANCED APPLICATIONS
Digital networking is bringing the
world and industries closer together.
For us, this opens up paths to new
­appli­cations – and new growth.
Our products are becoming increasingly powerful while taking up less space,
because the growing data volumes still need to be securely processed,
stored and transported. And we support our customers with comprehensive
solutions – these are the elements they need to successfully develop their
­business models.
6
IETY
7SOC.8billion people
live on Earth
in 2020.
Smart society –
Humans and machines
as a team
Digital transformation is leading the economy into a new era:
many new business models are no longer just technology-­
based but increasingly also driven by people’s everyday life.
This is made possible by smart networking across all areas of
work and life.
GESCHÄFTSBERICHT 2019/20AT S
ANNUAL REPORT 2019/20AT S
7
56
Intelligent devices and machines are
­connected with one another, and with
the Internet. They collect information
about their environment, linking and
­analysing it. As early as 2008, more
­devices were connected to the Internet
than there were people.
devices will be
connected to the Internet
in 2025.
The new model
of society is techno-
logy-based,
focuses on people and comprises
a variety of smart application
scenarios.
billion
Two decades ago, technology pioneer
Kevin Ashton used the term “Internet
of Things” (IoT) for the first time in
a presentation at the ­Massachusetts
Institute of Technology. The IoT
­connects physical objects with the
virtual world.
FIRST CHOICE
FOR ADVANCED APPLICATIONS
8
--
DATA VOLUME EXPLODES
The volume of data to be processed will see a massive increase
in the coming years. As a result, computing performance in cloud and decen-
tralised structures will also surge. Likewise, demand for high-performance
micro­processors will also grow. In preparation for this development, ATS
takes a forward-looking approach – with high investments and a targeted ex-
pansion of the value chain.
Interconnectedness is driven by the opportunities of mobile
communication, social media and the Internet. In addition to texts, enormous
data volumes are generated with photos and videos and frequently distribut-
ed over the Internet or mobile communication networks. Such data are then
processed and stored in data centres and all types of mobile devices (smart-
phones, notebooks, etc.). The 5G mobile communication technology enables
transmission of higher data volumes not only via telephone and glass fibre
lines – it will also make mobile transmission possible at high speed (data rate)
and quality. Apart from pure mobile communication, many other segments,
including automotive, industrial, trade, transport, media, entertainment,
healthcare and administration, can benefit from the transfer and processing
possibilities of large data volume. This is referred to as big data.
With the increasing networking of devices, the volume of data
will climb by 26% annually, up to a level of 175 zettabytes by 2025. Here are
two examples to illustrate the size of this number: a digitally connected air-
plane alone produces the same amount of data in a single day as the Hubble
telescope does in five months. And the data created in a smart factory in one
day correspond to 500 billion pages of text.
COVID-19 is causing an
­additional shift of companies’
business activities into the
net: online conferences and
remote working are increasing
digital data exchange.
The market for IC substrates is
­growing. ATS continues to ex-
pand this segment, thus providing
for sustainable growth.
5G BIG DATA AI IOT
Game changers for innovative applications_
GESCHÄFTSBERICHT 2019/20AT S
ANNUAL REPORT 2019/20AT S
9
11PAVING THE WAY TO AUTONOMOUS DRIVING
The automotive industry will also ben-
efit greatly from the digital development. The number
of digital functionalities keeps growing year by year.
Advanced driver assistance systems (ADAS) require
many sensors such as radar, lidar, GPS or cameras
with local data processing. In the coming five years,
electronic components will account for 35% of the
cost of vehicles, which is twice as much as today. With
the Vehicle-to-X (V2X) technology, vehicles will com-
municate with their environment in real time in the
future. The combination of sensor data, externally
transmitted data and internal data processing will en-
able completely autonomous driving. By 2025, more
than 100 million vehicles worldwide will be digitally
connected and data transmission will grow to up to
100 million gigabytes per month.
Even if we still have to wait for a few
years to see self-driving cars in everyday traffic: digital
networking is growing exponentially in the automo-
tive sector.
annual growth for the
IC substrate segment is
forecast by experts for the
coming years.The transmission, processing
and storage of increasingly
­advanced data and processes
requires powerful printed circuit
boards and IC substrates. Given
its technology and market
­leadership in these segments,
ATS is in an excellent position to
also benefit from this promising
market.
Growth
%
A new plant in China is already
under construction. The planned
investment volume of up to
€ 1 billion underlines ATS’s
aspiration to significantly expand
its market position.
ATS will expand its
IC substrate capacities
over the coming years.
FIRST CHOICE
FOR ADVANCED APPLICATIONS
10
5GThe new network – fast,
­reliable, available
The commercial roll-out of 5G, the next generation of
mobile broadband, is imminent. The 5G network brings
exponentially higher speeds and significantly lower
­latencies. Secure data transmission, effectually in real
time, allows completely new, previously unthinkable
appli­cations. This opens up significant potential for ATS.
GESCHÄFTSBERICHT 2019/20AT S
ANNUAL REPORT 2019/20AT S
11
24
NoresThe transmission rate
of the fifth-generation mobile
Internet will be more than
ten times faster by 2025 than
the current LTE standard.
5G makes it possible: in
the future, vehicles will use
the new standard to communi-
cate with their environment
in real time.
countries have already
introduced 5G. Most of
them are in East Asia.
STEP BY STEP TO A NEW LEVEL OF INTERCONNECTEDNESS
As the markets became increasingly integrated, the global
economy developed very successfully in recent years. The new 5G mobile
communication standard will once again significantly boost this develop-
ment in the years to come. According to calculations of consulting firm
­McKinsey, economic output will increase by up to US$ 2 trillion in the next
ten years with the introduction and utilisation of the standard.
The advantages of 5G will become apparent step by step:
initially, the focus will be on the use of devices with very high data trans-
mission rates of up to 10 gigabit/s. This includes, for example, the area of
(mobile) communication. Subsequently, applications for time-critical and
fail-safe uses such as autonomous driving will follow. A third step will mainly
comprise applications where a large number of machines connected with
one another exchange data autonomously and efficiently – the Internet of
Things. One example is the automated tracking of goods. So it is not only
network equipment and mobile communication providers that benefit from
the growth of 5G applications but a wide variety of industries and seg-
ments – from mechanical engineering to automation enterprises and public
organisations such as hospitals, universities and authorities. In other words:
5G will provide a gigantic boost for productivity.
The 5G standard will be crucial
to the Internet of Things (IoT):
according to projections of the
GSM Association (GSMA), the
number of global IoT connec-
tions will more than ­double
­between 2019 and 2025,
­increasing to nearly 25 billion.
10times
faster
Everything is connected to
everything – today, this is still
a vision of the future. In only
a few years, this vision will
have started to take shape.
FIRST CHOICE
FOR ADVANCED APPLICATIONS
12
5.2 billion people used mobile
services in late 2019 according
to the GSMA. That is 67% of the
world’s population.
In combination with
other connected
devices this offers
enormous potential
for the Internet of
Things.
billionsmartphones will
be sold globally by
2025 according to
market research
­company IDC.
This figure is expected to
­increase to 5.8 billion by 2025.
­Consequently, the need for the
5G standard, which makes high
data transfer rates possible in
mobile communication, is also
growing. The introduction of
5G will in turn continue to boost
the global exchange of data.
1.5
GESCHÄFTSBERICHT 2019/20AT S
ANNUAL REPORT 2019/20AT S
13
THE DAWNING OF A NEW ERA IN MOBILE COMMUNICATION
The new standard is now entering the acceleration phase in the
mobile communication markets: compared with 2019, the number of smart-
phones sold will increase by roughly 200 million to 1.5 billion in 2025. More than
half will be 5G-capable by 2025. In 2019, only about 20 million mobile devices had
5G capability. Although the current COVID-19 pandemic puts these forecasts into
perspective, the direction is clear: 5G will prevail in mobile communication sooner
rather than later.
According to the GSMA, the network is currently available in
24 countries with South Korea in the leading position. It was the first country to
introduce a nationwide commercial 5G network in April 2019. The USA, Australia,
­Qatar, Switzerland, Finland, Spain, China and the United Arab ­Emirates are also
well on track setting up their infrastructure. In terms of geographic ­regions, East
Asia has made the biggest progress, while Europe lags behind due to its hetero-
geneous infrastructures and outstanding frequency allocation processes in many
countries.
To support the leap to the new standard and further increase con-
sumers’ interest, network providers are expected to invest roughly US$ 1.1 trillion
between 2020 and 2025; about 80% of these investments will target the 5G tech-
nology, demonstrating the market’s great expectations of the new standard.
As transmission speed and data volume grow, the requirements
placed on devices will also increase. Ever more complex systems and electron-
ic circuits require particularly powerful IC substrates and printed circuit boards.
mSAP (modified Semi-Additive Process) and HDI (High Density Interconnect) are
leading technologies for the production of printed circuit boards. ATS is the
technology and market leader for both. Recently ATS has also achieved a top
technology position for IC substrates used in processors and is currently investing
massively in building further capacity, and in research and development. Features
such as minimum width and spacing between traces as well as the most accurate
control of the trace profile and the use of new materials enable significant im-
provements in electromagnetic signal transmission as required for state-of-the-art
5G technology.
Year by year, ATS’s products are becoming more powerful, relia-
ble and compact. This is also attributable to ATS’s broad experience. Our solu-
tions can be found in the products of a wide range of industries and applications.
With each adaptation, ATS
gains new knowledge, which can
then be used for solutions in
other ­application areas.
Businesses will not be the only
ones to benefit from the 5G
network – an ever increasing
number of applications are also
available to private users.
FIRST CHOICE
FOR ADVANCED APPLICATIONS
14
Control and regulation units of
prostheses require particularly
flexible printed circuit boards.
ATS uses an extremely flexible
base material with rolled copper
to guarantee the required ben-
ding cycles and small bend radii.
GESCHÄFTSBERICHT 2019/20AT S
ANNUAL REPORT 2019/20AT S
15
As the world’s population keeps growing and aging, the need for
healthcare applications will continue to increase and many new –
especially digital – products will enter the market. ATS has
every­thing it takes to participate in this development and expand
its position in this market segment.
Digital health – the patient at
the centre of digital solutions
TECHNO
LOGY
ME
DI
CAL
FIRST CHOICE
FOR ADVANCED APPLICATIONS
16
Highly complex printed circuit board
­solutions are used to meet the high require-
ments of diagnostic imaging.
Mobile collection and
processing of patient
data requires ever
more functions on ever
­smaller space – and
consequently a miniatu-
risation of electronics.
Artificial intelligence
­makes it possible that
20% of ­medical services
can also be performed
­digitally.
GESCHÄFTSBERICHT 2019/20AT S
ANNUAL REPORT 2019/20AT S
17
28%annual growth is
projected for the
overall digital health
market.
The digital health market
will therefore be worth
just over US$ 500 billion in
2025.
Priority is given to technical inno­
vations: ATS aims to utilise
roughly 8,000 ­additional square
metres for new production lines
at its site in Ansan, South Korea,
to manufacture printed circuit
boards for applications in medical
technology by the end of 2020.
If everything goes according to
plan, the new production facilities
will have obtained all required
customer qualifications by mid-
2021. Overall, this project involves
an investment of roughly € 30
million in this site.
DIGITAL TRANSFORMATION IN HEALTHCARE
Digitalisation will fundamentally change the healthcare
system in the years to come. Over the past years, digital data collection
directly on the patient as well as digital health checks and the demand for
digital healthcare services by patients – in other words: digital health –
have gained growing importance. Along with companies currently repre-
sented in the healthcare market such as medical technology and therapy
device manufacturers, digital companies selling smartwatches in addition
to software will play an important role – mainly because such consum-
er devices are getting continuously better at measuring and processing
health data and some of them already have medical certification.
Smartwatches are increasingly used as devices for mobile
patient data collection. In addition, a wide variety of sensors are being
developed which can either be applied to human skin or implanted near
the surface to take a person’s temperature, pulse, blood pressure or blood
sugar level. The measuring data can often be read via smartphones in an
easy and contactless process. Examples of therapy devices are pacemak-
ers or implants for neurostimulation.
Miniaturisation in electronics can be achieved using a va-
riety of printed circuit boards, substrate and module integration technol-
ogies such as embedding. Also, ATS is one of just a few companies cer-
tified in accordance with the EN ISO 13485 standard for medical devices.
Particularly high demands are placed on pacemakers and defibrillators.
The printed circuit boards integrated into implants are highly advanced
and subject to special qualification tests.
ATS also creates innovative solutions for private use:
the Cycle Tracker for example, which was co-developed by ATS, helps
women to record and predict their menstruation cycle. The user places
temperature-sensitive sensor electronics under the arm with a plaster
and enables an app on her smartphone. Information is then continuously
transmitted to the phone via NFC (Near Field Communication).
Another example: patients with type 1 diabetes use a smart
insulin pump supported by elements made by ATS. It is fixed directly to
the body with a plaster. By pumping insulin into the body continuously,
the blood sugar level is controlled and stabilised. The application consists
of two main units – the plaster with the needle, and the insulin cartridge,
which is renewed on a regular basis. The pump and the electronic control
unit remain functional together throughout the lifetime of the product.
In December 2019, ATS broke ground on its site in Ansan,
South Korea, for an upgrade and the expansion of its production. This un-
derpins ATS’s claim to be one of the leading suppliers of printed circuit
boards and interconnect solutions in the medical segment in the future.
FIRST CHOICE
FOR ADVANCED APPLICATIONS
share
CO
MP
AN
Y
24
28
31
34
45
63
20 _ Management interview
28 _ Strategy
32 _ Report of the Supervisory Board
35 _ Consolidated corporate
governance report
44 _ Non-financial report
75 _ ATS on the capital market
FIRST CHOICE
FOR ADVANCED APPLICATIONS
20
ANNUAL REPORT 2019/20AT S MANAGEMENT INTERVIEW
In view of the COVID-19 pandemic,
we have not carried out a ­Management
Board photo shoot this year and
­instead are making use of existing
photo material.
FIRST CHOICE
FOR ADVANCED APPLICATIONS
21
ANNUAL REPORT 2019/20AT S MANAGEMENT INTERVIEW
We are
on a very
­promising
path.
INT
ERV
IEW
ANNUAL REPORT 2019/20AT S FIRST CHOICE
FOR ADVANCED APPLICATIONS
22
MANAGEMENT INTERVIEW
The financial year 2019/20 is behind us. Looking back,
how did it develop overall?
Andreas Gerstenmayer Operationally, we can be
quite satisfied. We dealt with the issues we intended to address.
We made progress on the implementation of our strategy and
our plants are well on track. In terms of volume, our capacity
was not utilised to the extent planned, but I think we used the
year well to prepare for future challenges.
Economically, we certainly did not meet all our goals. However,
we were also faced with a challenging operating environment.
In the automotive sector, uncertainties about the future of the
powertrain dampened demand. The trade conflict between the
USA and China continued, though at a lower level. And Euro­
pean industry investment behaviour remained at an unex-
pectedly weak level. On top of that, we saw the outbreak of
­COVID-19 in the final quarter, which forced us to temporarily
close plants in China.
What does that mean in terms of actual figures?
Monika Stoisser-Göhring That we fell short of
expectations on the earnings side. We surpassed the one-billion-­
euro revenue mark once again. However, revenue was 2.7% lower
than in the previous year. At least the EBITDA margin, at 19.4%,
was within our adjusted target corridor of 18 to 20%. Earnings per
share amounted to € 0.34 after interest on hybrid capital, which
was significantly lower than last year. Along with unexpectedly
difficult market conditions, this was also due to the intense prep­
aration for the strategic expansion of our business.
Andreas Gerstenmayer At the beginning of the
fourth quarter, we were still confident in the Management Board
that we would meet our guidance for revenue and earnings.
And we have done everything possible in the last few months
to achieve this goal. In particular, we reacted very rapidly to
­COVID-­19. Wherever we could influence something, we did. I
even think that we were able to keep the economic impact low
due to our measures. This could well have ended very differently.
We were among the first companies, if not the first, to resume
production. At our Chongqing I plant we never stopped produc-
tion, even with all the official measures imposed.
Despite low earnings figures you are planning to pay out a
dividend again this year.
Monika Stoisser-Göhring That’s correct. Against
the background of the solid business development, we will pro-
pose a dividend of € 0.25 per share to this year’s Annual General
Meeting, together with the Supervisory Board. Even though the
current market situation is currently rather unclear due to the ex-
ceptional circumstances. And because we are deeply convinced
that based on our position and the course we are pursuing, we
are excellently prepared for the future.
We are deeply
convinced that based
on our position and the
course we are pursuing,
we are excellently pre-
pared for the future.
“
Monika Stoisser-Göhring, CFO
Monika Stoisser-Göhring
FIRST CHOICE
FOR ADVANCED APPLICATIONS
ANNUAL REPORT 2019/20AT S
23
MANAGEMENT INTERVIEW
How are ATS’s activities in the strategic areas
5G, IC substrates and big data developing?
Andreas Gerstenmayer We made considerable
progress in all three areas. In the area of 5G we used to focus
primarily on mainboards for mobile devices. We now have the
first contracts for printed circuit boards for modules and are dis-
cussing topics such as 5G base stations and antenna technology
with infrastructure providers. That means that we can address
significantly more applications today than even a year ago. In
the area of IC substrates, we made major investment decisions
and created the basis enabling us to be present in precisely
those markets that will grow in the coming years.
This is also underscored by the decision to build
Chongqing III. We will be able to produce large volumes of the
latest technologies very soon. And thanks to our strength in the
area of IC substrates, we are also in a good position for big data.
As data volumes explode, we will see very attractive jobs in the
years to come.
Which industries will be the first to recover
from the crisis?
Andreas Gerstenmayer Similar to the damage in
the industries, it is also very difficult to estimate which sector
will be the first to bounce back: will it be capital goods or rather
consumer goods? One thing we can perhaps say is that anything
related to infrastructure will pick up sooner. This is because,
from experience, states deliberately provide impetus in these
areas to reduce unemployment, increase purchasing power and
ultimately boost the economy again.
Heinz Moitzi We can also assume that the topic
of 5G will gain momentum: we are currently experiencing how
fast people get used to digital communication in everyday busi-
ness. For many employees, working from home and video con-
ferences did not even feature as a topic only a few months ago.
Today they use these tools as a matter of course – with all the
restrictions this entails. One thing has become clear: today’s net-
work infrastructure is not at all sufficient for digital working. This
will be the next big push.
The automotive industry has been particularly
hard hit by the shutdown. How do you see this
situation from the angle of ATS?
Andreas Gerstenmayer This is another area
where it is difficult to assess how strong the impact is – and to
what extent we will be affected at the end of the day. But we
definitely assume that there will be effects. In the car market in
particular, we will have to watch the development very carefully
in the coming months. This is a market with a complex supply
chain, which has recently ground to a halt. I think that this seg-
ment will tend to take longer to recover.
Have you adapted or sharpened your strategy
at all in view of COVID-19?
Andreas Gerstenmayer We have worked very
intensively on our strategy over the past few years. We are sure
that the topics we aim to implement as part of our mid-term
strategy are still valid. I don’t see any aspect in any of our stra-
tegic ­focus areas that would make the topics obsolete. On the
contrary: the trends we see are sustainably intact. Only in terms
of timing there may be delays in one place or another due to the
extraordinary situation the global economy is facing.
5G
“Today’s network infrastructure
is not at all sufficient for digital
working.”
Heinz Moitzi
ANNUAL REPORT 2019/20AT S FIRST CHOICE
FOR ADVANCED APPLICATIONS
24
MANAGEMENT INTERVIEW
And with respect to the economic positioning –
do you see any need for adjustment?
Monika Stoisser-Göhring No. ATS continues to
be very stable economically: our equity ratio is very solid at 41%
and our debt repayment period – at 1.3 years – is significantly
below our self-imposed maximum of three years. In terms of
investments, everything is consistent with our plans; because
of changes in the content of our projects, we spent around € 90
million less in the past financial year than originally budgeted.
In accordance with our scheduling, we were able to largely fi-
nance our investments from our own resources in the past fi-
nancial year. Should we actually require additional funds for our
projects, we have different options. It goes without saying that
we put a particular focus on costs in times like these. As a pre-
caution, but also because we still aspire to serve the main part
of our capital requirements for our projects from our cash flow.
Ms Stoisser-Göhring, you recently received the CFO
Award. That proves that you do many things right …
Monika Stoisser-Göhring It shows that ATS
does many things right. Within the Management Board we
act based on good cooperation and a shared understanding.
Against this background, a lot can be done in finance. I think
that finance tools such as hybrid bonds and promissory note
loans, which were recently introduced at ATS, are part of the
standard portfolio in modern corporate finance. Starting busi-
ness relationships with Chinese banks has also been a logical
step for us. The vast majority of our non-current assets is based
in Asia and we know the market and the mentality of its people
well. By working together in finance we gain important trust,
not only among the banks.
To what extent will the changed market situation
bring new opportunities for ATS, for example in
medical technology?
Andreas Gerstenmayer Of course we look at
the markets differently in a changed situation and check out
additional opportunities, also in the medical sector. We have
to admit, however, that many of the things which are in great
demand right now use standard technologies that we very de-
liberately did not address in the past. But of course we are also
looking for ways to help in the current situation. This is why we
are now producing components for local medical technology
manufacturers at our plant in India despite the shutdown.
Advanced applications, for example for pacemakers, hearing
aids or insulin pumps, continue to be very interesting for us.
This is where our future market lies, and consequently we are
focusing on this market with our comprehensive technology
upgrade at our plant in Ansan, South Korea.
With the investments in Ansan and, above all, in
Chongqing, ATS is opening the door to its second billion
in revenue. Where will your employees come from?
Monika Stoisser-Göhring That is a demanding
task, especially since it is important to recruit employees with
the appropriate skills. We need people who deal with the tech-
nical side of megatrends such as autonomous driving and digi-
tal networking. To bring these people on board, we have set up
the “Talent Mapping” project. We have defined the expertise
we will need in the future within this project so that we can
now address professionals in areas like microelectronics, RF/IC
design, chemistry and physics in a targeted manner. The pro-
ject will be accompanied by an international talent programme,
through which we send graduates of technical studies to China
for a ­period of time after they have completed a year of training
with us.
41%
“Our equity ratio is very solid
at 41% and our debt repay-
ment period – at 1.3 ­years – is
significantly below our self-­
imposed maximum of three
years.”
Monika Stoisser-Göhring
FIRST CHOICE
FOR ADVANCED APPLICATIONS
ANNUAL REPORT 2019/20AT S
25
MANAGEMENT INTERVIEW
The young generation nowadays increasingly chooses
employers based on their value profile …
Monika Stoisser-Göhring That is a good thing,
because values are also important to us. We believe that a
­stable foundation of values is a necessary prerequisite for long-
term success. That is why we put a strong focus on topics such
as sustainability, governance and diversity and set ambitious
targets: for example, we aim to raise the share of women from
21% today to 30% by 2025.
Heinz Moitzi In our production, we are already
operating at a high level in terms of environmental matters and
work safety. But we also see room for improvement in this area:
we aim to cover 80% of our energy supply with renewable en-
ergies in the future. And we are planning a life cycle assessment
for our product groups in the future.
You are also entering aerospace technology now.
What are the prospects in this segment?
Heinz Moitzi This has evolved over the last few
years and shows that we can keep adding “new” segments to our
core business. We have acquired a very demanding certification
(NADCAP) which is required for supplying the aerospace industry,
because we are aware that part of the communication infrastruc-
ture also goes into space. We have learned that our technologies
can help these industries to cost-effectively implement miniatur-
isation and weight reduction, which are increasingly gaining im-
portance in this segment, too.
Andreas Gerstenmayer In this context, the 5G de-
velopment should also be mentioned. How will network providers
cost-effectively reach those who do not live in conurbations in the
future? At the end of the day, it will only be possible using satel-
lite technology. Communication satellites, transmission stations,
antenna technology, satellite launches – we can make a small, but
important contribution with our solutions in all of these areas.
Communication satellites,
transmission stations,
antenna technology,
satellite launches –
we can make a small, but
important contribution.
“
Andreas Gerstenmayer, CEO
Andreas Gerstenmayer
ANNUAL REPORT 2019/20AT S FIRST CHOICE
FOR ADVANCED APPLICATIONS
26
MANAGEMENT INTERVIEW
Europe is occasionally said to have a need to catch up as
a location for innovation. To what extent does that limit
ATS in its development?
Heinz Moitzi I would not quite put it that way
that Europe lags behind other continents. Working on electronic
innovation is a global business for a company of our size today.
Thanks to its global positioning, ATS can combine the advan-
tages of Asia, the USA and Europe well. We collaborate with uni-
versities and electronics institutions on different continents: in
Germany, for example, we work with the Fraunhofer Institute
and in the USA with the International Electronics Manufactur-
ing Initiative (iNEMI), and of course we also collaborate with
­Austrian universities. On top of that, we work very closely with
our customers in development.
Industrial production is where Europe has a need to catch up:
a region which only does research but has no production is
blind on one eye. However, the EU has now realised that and
is promoting basic technologies again. This creates the basis for
bringing back some parts of the supply chain, after it moved
to Asia around the turn of the millennium. As digitalisation in-
creases, cost differences can be balanced out better in Europe.
Here, ATS is already in a very good position. Leoben has been,
and will remain, a central location for us as a production site and
research centre for special applications.
What new technological potential do you
see for the future?
Heinz Moitzi First of all, let me say that ATS is
moving in technology segments today that we could only dream
of even a few years ago. And our development is rapidly pro-
gressing. Let’s take miniaturisation for example: Today we op-
erate in the range of trace widths of 10μm and with more than
1,000 laser drillings per second, with a diameter of 40μm or
less. In some areas we are already advancing to the nano seg-
ment, getting in close contact with semiconductors.
It has always been one
of ATS’s skills to see
what needs to be done
and develop the right
solutions.
Heinz Moitzi, COO
Heinz Moitzi
“
FIRST CHOICE
FOR ADVANCED APPLICATIONS
ANNUAL REPORT 2019/20AT S
27
MANAGEMENT INTERVIEW
That means that we are currently on the thresh-
old to new technological territory. Developing the appropriate
technologies for this is a demanding job. But it has always been
one of ATS’s skills to see what needs to be done and develop
the right solutions. Where possible, we do this on our own, and
where useful, we collaborate with partners.
COVID-19 has put the industry in crisis mode over night.
How did the crisis management work out at ATS?
Andreas Gerstenmayer I think we can pay a
huge compliment to all our teams at all locations. In China, we
managed to at least produce at one plant, even during the peak
of the crisis – even if it was not with the full staff. We were also
able to restart operations at the other plants after a relatively
short period of time. While other factories were still shut down,
we were able to produce significant volumes again.
Heinz Moitzi What helped us was that we had
been properly sensitised after SARS in 2003. We responded
quickly and took initial measures in December and were able
to cope with a variety of issues based on sophisticated crisis
management within a very short period of time: implementing
safety concepts, reorganising logistics and meeting official re-
quirements. The well-coordinated processes helped us not only
in China, but also in India, South Korea and Austria. At no time
did we have problems with protective masks and to this day we
don’t know of a single infection in our company.
Sounds almost easy …
Heinz Moitzi Of course it was not quite that easy.
What I mean to say is that the critical topics were not so much
the processes at our production sites – we managed to create
the appropriate framework conditions very quickly at the work-
places and in the canteens. Supply chain topics, for example,
were more challenging. If you want to set up machines while
travel restrictions are in place and service technicians have to
undergo quarantine for safety reasons, no manual will have the
advice you need, but you have to find effective solutions fast.
The year 2020/21: How is ATS approaching the current
year? Can the medium-term forecast be maintained in the
current situation?
Andreas Gerstenmayer In 2020/21 we will have
to “drive by sight” and permanently review our assumptions – at
monthly rather than quarterly intervals. With COVID-19 we are
currently learning in the global economy that things can literal-
ly change over night. But this situation does not mean that we
will reduce capacity in production or discontinue our future pro-
grammes. From today’s perspective our strategy is intact and suf-
ficiently robust to support the medium-term guidance: doubling
revenue with an EBITDA margin of 25% to 30%.
As responsible entrepreneurs, we of course have to review this
again and again, and make decisions: are our key indicators still
correct or do we have to make adjustments? What we can do
right now is to get through the current phase as well as possible.
To this end, we are very restrictive on current spending. At the
same time, we keep driving our strategic projects for IC substrates
and modules.
“From today’s perspective our
strategy is intact and sufficiently
robust to support the medium-term
guidance: doubling revenue with an
EBITDA margin of
Andreas Gerstenmayer
25%to
30%
ANNUAL REPORT 2019/20AT S FIRST CHOICE
FOR ADVANCED APPLICATIONS
28
STRATEGY
COMPANY
STRATEGIC GOALS
4
SUSTAINABLE MANAGEMENT
_80% renewable energy
_Life cycle assessment of product groups
_30% women in leadership positions
FIRST CHOICE
FOR ADVANCED
APPLICATIONS
1
EXPANSION OF TECHNOLOGY LEADERSHIP
_Leading provider of advanced interconnect solutions
_Innovation revenue rate: 20%
2
FOCUS ON SUSTAINABLE PROFITABLE GROWTH
_Medium-term revenue target of € 2 billion
_Continuation of constant and sustainable improvement in margins
_Medium-term EBITDA margin target of 25% to 30%
3 CREATE SHAREHOLDER VALUE
_Long-term ROCE of ≥12%
“MORE THAN ATS”: GROWING
PROFITABLY WITH THE MARKETS
As digitalisation progresses, the requirements on digital infra-
structure will grow massively in the next several years – both with
respect to the devices themselves (modularisation, miniaturisa-
tion) and to their environment (data storage, transmission and
processing). The new 5G mobile communication standard will
exponentially increase the data volume transmitted and take the
capacity requirements for decentralised computing performance
to a new level.
Consequently, the demand for high-end IC substrates, modules
and high-performance microprocessors will also grow dispropor-
tionately. As a leading manufacturer of high-end printed circuit
boards and IC substrates, ATS aims to leverage this potential.
Our company is excellently positioned in the market and in-
tends to significantly expand its leading edge through capacity,
per­formance and technology enhancements. Once the markets
pick up again, this should enable us to double our revenue to € 2
billion in the medium term (time horizon: 5 years), with a target
EBITDA margin of 25% to 30%.
VISION AND STRATEGIC GOALS
Our growth strategy is based on our vision “First choice for ad-
vanced applications”. This is closely linked with our aspiration to
be the contact of choice for customers in our market segment
based on our top performance – for high-end printed circuit
boards and IC substrates, and in the future also for modules and
appropriate system and interconnect solutions.
On our path to implementation, we are guided by four strategic
goals:
1. Expansion of technology leadership
We strive to be the leading provider of advanced interconnect
solutions. To achieve this, we aim for an innovation revenue rate
of 20%.
When it comes to strategic implementation, we use a dual ap-
proach: first of all, we industrialise new interconnect solutions
by combining existing and new technologies as part of the ATS
Toolbox (high-end printed circuit boards, IC substrates, embed-
ding). In the course of this approach, we increasingly position
ourselves as a proactive system development partner for our
FIRST CHOICE
FOR ADVANCED APPLICATIONS
ANNUAL REPORT 2019/20AT S
29
COMPANY
customers who will take over the entire production process for
them  – from the production of printed circuit boards and IC
substrates to the manufacturing of modules and design, manu-
facturing and test services. As a result, ATS will evolve from a
manufacturer to an interconnect solution provider.
2. Sustainable profitable growth
We intend to increase our company’s revenue to € 2 billion in
the coming years, aiming for an EBITDA margin in the range of
25% to 30%.
We use four levers for the strategic implementation:
a)	 Customer orientation and highest service level: We sup-
port our customers by providing technical advice as well as ad-
ditional design, simulation and test services in order to enable
the optimum interconnect solution.
b)	 Operational excellence: In our processes, we focus on effi-
ciency, productivity with highest capacity utilisation and a com-
petitive cost structure. In doing so, we are also prepared for par-
ticularly complex and individual manufacturing requirements in
different lot sizes in premium quality.
c)	 Focus on fast-growing and profitable applications: We
concentrate on technologically advanced applications with
­disproportionately high market growth and double-digit EBITDA
margin potential.
d)	 Focus on cash flow generation and optimisation of the fi-
nancing structure: We strengthen our internal financing power
for further investment cycles by maintaining our key figures at
a high level: We aim for an equity ratio 40% and a debt repay-
ment period 3 years.
3. Creation of shareholder value
The interest on the capital employed by our shareholders (ROCE)
should amount to at least 12% in the long term. The return on
capital employed thus exceeds the weighted average cost of cap-
ital of roughly 8.7% of comparable companies. At the same time,
we pursue a transparent dividend policy based on investment cy-
cles and profit for the year.
4. Sustainable management
We will only be able to expand our technology leadership and
achieve sustainable profitable growth if our actions are value-­
based and we generate added value for all stakeholder groups.
Compliance with high standards in the areas of ethics, working
conditions, health and safety, environment and quality are basic
requirements on the road to success. The Responsible Business
Alliance, the OECD Guidelines for Multinational Enterprises, the
Sustainable Development Goals of the United Nations (SDGs) and
our company values serve as our compass.
Our strategic focus areas are derived from the above as well as
the ATS materiality analysis, customer requirements and global
developments in environmental and social matters.
STRATEGIC FIELDS OF ACTION
One of the strengths of ATS is that the company understands
its customers’ challenges and develops customised intercon-
nect solutions together with them early on. This is an ability
we will maintain and expand on in the future. In this context,
ATS increasingly focuses on combining the possibilities of the
core business with new technologies.
To achieve targeted growth, we drive our business based on
the following four strategic fields of action:
1. Expansion of the core business
ATS strengthens its core competence in the area of high-end
printed circuit boards and IC substrates and continues to de­
velop its business in the existing market segments; here, the
market promises solid growth.
2. Expansion of customer and application portfolio
ATS uses proven technologies to implement innovative solu-
tions for other (groups of) customers and applications, thus ex-
tending the life cycle of existing technologies and expanding its
earnings base.
ANNUAL REPORT 2019/20AT S FIRST CHOICE
FOR ADVANCED APPLICATIONS
30
COMPANY
EXPANSION OF CORE BUSINESS
in all market segments
EXPANSION OF THE PORTFOLIO
to implement innovative solutions for other
customers and applications
PROACTIVE PRODUCT DEVELOPMENT
for specific customer requirements
INDUSTRIALISATION
of new technologies
COMBINING
OUR CORE BUSINESS
WITH NEW
TECHNOLOGIES
3. Proactive product development
ATS intensifies its collaboration with customers during early
development phases and develops innovative solutions for spe-
cific customer requirements by combining the core business
with new technologies.
4. Industrialising new technologies
ATS drives the development of new technologies and broadens
its positioning in the value chain, among other things through
new solutions for the module business. ATS thus generates ad-
ditional revenue and increases its leading edge over competitors.
MARKET GROWTH DRIVERS:
EXPONENTIALLY GROWING DATA VOLUME
Digitalisation and global networking generate exponentially grow-
ing data volumes. Driven by a wide variety of applications such
as communication, Industry 4.0, autonomous driving and smart
homes, permanently increasing data volumes need to be trans-
mitted, processed and analysed. This boosts, among other things,
the business of data centres and cloud computing applications.
For ATS this development offers significant growth opportunities
“MORE THAN ATS” – CORPORATE STRATEGY
in the field of IC substrates for server and network applications.
The required performance and computing power of the proces-
sors lead to massively growing technological requirements on IC
substrates. At the same time, the digitalisation trend drives the
growing need for computing performance in end devices (edge
computing), which opens up interesting opportunities for ATS in
terms of profitable growth in the printed circuit board business in
all market segments.
TECHNOLOGICAL GROWTH DRIVERS:
MINIATURISATION AND FUNCTIONAL
INTEGRATION
The development of the electronics industry is currently strongly
influenced by the trends of miniaturisation and functional inte-
gration. At the same time, the life cycles of products are getting
shorter – while a certain period of time is required for the de-
velopment processes of new products. This boosts the trend to-
wards modularisation, i.e., the development of highly integrated
functional components featuring a defined performance spec-
trum which can be used in different applications and devices. The
use of these predeveloped modules enables suppliers of devices
FIRST CHOICE
FOR ADVANCED APPLICATIONS
ANNUAL REPORT 2019/20AT S
31
COMPANY
to further reduce the time to market. This process will fundamen-
tally change the supply chain in the electronics industry. Based on
the modules’ high integration density, a wide variety of technolo-
gies will be used for the production of the modules
MODULARISATION TREND:
ADDITIONAL BUSINESS OPPORTUNITIES
The trend towards modularisation in electronics is becoming
increasingly apparent not only in consumer, computer and
communication products, but also in automotive, industrial and
medical applications. As part of its growth and diversification
strategy, ATS addresses the growth potential on three levels:
Level 0: Expansion of the classic printed circuit board business –
with a continued focus on the high-end segment.
Level 1: Provision of IC substrates and high-end printed circuit
boards for the rapidly growing market segment of modules.
Level 2: Broadening the service spectrum in the value chain
through additional module integration services such as design,
assembly and test services with the objective of offering com-
prehensive solutions for modules.
With this approach, we are expanding our position in the value
chain and opening up additional business opportunities by enter-
ing the field of module integration. We will finance this growth
largely from our own cash flow.
The implementation of the strategy will lead to further diversi-
fication of our application and customer portfolio in a high-tech
market segment and help ATS to establish a good position in an
important future market early on.
ATS has gradually built crucial capabilities required for the im-
plementation of the strategy over the last few years (with the
ATS Toolbox). At the same time, all possibilities for the estab-
lishment of additional required technologies and capabilities are
being reviewed. In this context, ATS is considering both organic
and non-organic measures.
1) In 2025
2) Compounded annual growth rate until 2025
Source: Prismark, April 2020; Yole, May 2019; A.T. Kearney, August 2018; ATS Analysis
MORE THAN ATS – GROWTH AND DIVERSIFICATION STRATEGY
2
0
1
MODULE INTEGRATION SERVICES
Additional capabilities needed
IC SUBSTRATES, PCB FOR MODULES
High growth potential
PCB BUSINESS
Focus on high-end segment
Market size1)
Market growth2)
Share of
module value
US$ 52 billion 11% 20%
US$ 18 billion 11% 3%
US$ 58 billion 3%
MIDTERMATSTODAY
ANNUAL REPORT 2019/20AT S FIRST CHOICE
FOR ADVANCED APPLICATIONS
32
COMPANY
REPORT OF THE
SUPERVISORY BOARD
Dear shareholders,
The past financial year was heavily influenced by a significant
economic slowdown and the outbreak of the COVID-19 pan-
demic. Despite a challenging operating environment, ATS de-
livered solid results in the financial year 2019/20 and generated
revenue of € 1,000.6 million (previous year: € 1,028.0 million).
Although ATS very successfully managed to keep the effects
of the COVID-19 pandemic on ongoing production to a mini-
mum at all locations, the economic impact could not be avoided
completely. EBITDA, at € 194.5 million, was lower than in the
previous year at € 250.1 million. The EBITDA margin declined to
19.4% (previous year: 24.3%).
After finance costs – net and income taxes, a profit of € 21.5
million was recorded for the financial year 2019/20.
ACTIVITIES OF THE SUPERVISORY BOARD
The Supervisory Board met six times during the financial year
2019/20. After having undergone surgery, Mr Androsch did not
participate in person in more than half of the meetings of the
Supervisory Board.
In the financial year 2019/20, the Supervisory Board performed
the tasks for which it is responsible in accordance with the law,
the articles of association and rules of procedure. During the
financial year from 1 April 2019 to 31 March 2020, the Super-
visory Board was regularly informed by the Management Board
about the market situation, strategy, operating and financial
position of the Group and its investments, staff situation and
planned capital expenditures in plenary and committee meet-
ings, as well as in comprehensive oral and written reports. The
Supervisory Board made the respective decisions accordingly. At
these meetings, there was a comprehensive exchange between
the Management Board and the Supervisory Board about the
business development and situation of the ATS Group, includ-
ing the financial performance. The Chairman of the Supervisory
Board and his deputies were regularly informed about relevant
developments by the Management Board, also between meet-
ings of the Supervisory Board.
The activities of the Supervisory Board also focused on the
preparation of the budget for the financial year 2020/21 and
the further technological development. In the past financial
year, the consulting activities and decisions of the Supervisory
Board were also related to advancing the company’s strategic
development, which the Management Board coordinated with
the Supervisory Board in detail on a regular basis, the expansion
projects at the various production sites, in particular the expan-
sion project of a new plant at the Chongqing site, and the design
of the Group’s financing structure.
SUPERVISORY BOARD COMMITTEES
Within the Supervisory Board, the Audit Committee, the Nomina-
tion and Remuneration Committee as well as the Finance Com-
mittee, as standing committees, exercise certain tasks assigned
to them through the rules of procedure of the Supervisory Board.
The respective committees carried out detailed analyses of par-
ticular matters where necessary and reported their findings to
the Supervisory Board:
The Audit Committee, consisting of Regina Prehofer (Chairwom-
an), Gertrude Tumpel-Gugerell (finance expert, from the AGM
2019), (Gerhard Pichler (finance expert, until the AGM 2019)),
Georg Riedl, Wolfgang Fleck and Günther Wölfler, focused pri-
marily on the review of the annual and consolidated annual fi-
nancial statements for the year ended 31 March 2019, and on
planning and preparation for the audit of the annual and con-
FIRST CHOICE
FOR ADVANCED APPLICATIONS
ANNUAL REPORT 2019/20AT S
33
COMPANY
solidated financial statements for the financial year 2019/20
and, in particular, the preparation of a proposal for the election
of the statutory auditor. By means of discussions with the audi-
tor, inspection of relevant documents and discussions with the
Management Board, it obtained a comprehensive view. The Au-
dit Committee also monitored the effectiveness of the compa-
ny-wide internal control system and the Group’s internal audit
and risk management systems. The Audit Committee reported
to the full Supervisory Board with respect to this monitoring and
found no deficiencies. The Audit Committee convened six times
in the past financial year. The meetings, which were attended by
all committee members, were chaired by Regina Prehofer.
In accordance with a decision made by the Supervisory Board,
the members of the Nomination and Remuneration Committee
are Hannes Androsch (Chairman), Willibald Dörflinger (Deputy
Chairman), Georg Riedl, Wolfgang Fleck and Günther Wölfler. This
committee held four meetings in the past financial year, which
focused in particular on matters related to succession planning
for the position of the COO.
The following Supervisory Board members were appointed mem-
bers of the Finance Committee:
The members of the Finance Committee are Hannes Androsch
(Chairman), Willibald Dörflinger, Regina Prehofer, Georg Riedl,
Wolfgang Fleck and Günther Wölfler.
The Finance Committee met once during the financial year
2019/20 and discussed matters of general group financing as well
as project financing.
SELF-EVALUATION OF
THE SUPERVISORY BOARD
The Supervisory Board annually carries out a self-evaluation,
and did so again for the financial year 2019/20. This evaluation
performed by the Supervisory Board based on a digital ques-
tionnaire confirmed that its practices meet the Good Govern-
ance requirements and that its organisation, work practices and
target orientation are efficient and effective.
ANNUAL FINANCIAL STATEMENT
AND DIVIDENDS
The Supervisory Board of ATS proposed to the 25th Annual
General Meeting that PwC Wirtschaftsprüfung GmbH, Vienna,
be appointed Company and Group auditors for the financial year
2019/20. The proposal was approved by the Annual General
Meeting of 4 July 2019.
The annual financial statements of AT  S Austria Technologie
 Systemtechnik Aktiengesellschaft and the consolidated finan-
cial statements for the year ended 31 March 2020 were audited
by PwC Wirtschaftsprüfung GmbH, Vienna, and awarded an un-
qualified audit report. The Management Report and the Group
Management Report for the financial year 2019/20 were consist-
ent with the annual financial statements and the consolidated
financial statements. Based on the prior discussions of the Audit
Committee, and, following its own detailed discussions and ex-
amination, the Supervisory Board approved the Company’s an-
nual financial statements for the year ended 31 March 2020 in
accordance with Section 96 (4) of the Austrian Stock Corpora-
tion Act (AktG) at its meeting on 4 June 2020. With regard to
the non-financial report, the Management Board obtained a
statement by the auditor prior to the audit, which was submitted
to the Supervisory Board. Moreover, based on the prior discus-
sions of the Audit Committee, and after its own detailed con-
sideration and examination, the Supervisory Board approved the
consolidated financial statements drawn up in accordance with
IFRS pursuant to Section 245a of the Austrian Commercial Code
(UGB) as well as the Management Report, the Group Manage-
ment Report, the Corporate Governance Report and the Non-fi-
nancial Report. The Supervisory Board review, which included
extensive discussions with the auditors, did not give rise to any
objections. Pursuant to the recommendation of the Audit Com-
mittee, the Supervisory Board of ATS will propose to the 26th
Annual General Meeting that Deloitte Audit Wirtschaftsprüfung
GmbH, Vienna, be appointed Company and Group auditors for
the financial year 2020/21.
ANNUAL REPORT 2019/20AT S FIRST CHOICE
FOR ADVANCED APPLICATIONS
34
COMPANY
TheSupervisoryBoardsupportstheproposaloftheManagement
Board: it will be proposed to the Annual General Meeting that
out of the total profit of € 105,198,064.56 a dividend of € 0.25
per no-par share outstanding on the payout date and entitled to
dividend be distributed and an amount of € 95,485,564.56 be
carried forward. Furthermore, the Management and the Super­
visory Board of AT  S Austria Technologie  Systemtechnik
Aktiengesellschaft will propose to authorise the Management
Board to reclassify an amount of up to € 80,000,000.00 of the
aforementioned total profit carried forward to free reserves,
subject to the approval of the Supervisory Board.
THANKS TO THE MANAGEMENT
BOARD AND ALL ATS EMPLOYEES
Despite recently difficult market developments and the chal-
lenges related to the COVID-19 pandemic, ATS closed a satis-
factory year. Strategically, ATS is on a promising course which
provides for further growth.
The Supervisory Board would like to thank all those who worked
with great trust and commitment to further develop the ATS
Group. We are convinced that together we will continue to ad-
vance the ATS Group and achieve even more success!
On behalf of the Supervisory Board
Leoben-Hinterberg, 4 June 2020
Hannes Androsch m.p.
Chairman of the Supervisory Board
FIRST CHOICE
FOR ADVANCED APPLICATIONS
ANNUAL REPORT 2019/20AT S
35
COMPANY
CONSOLIDATED CORPORATE
GOVERNANCE REPORT
The Austrian Code of Corporate Governance is a regulatory
framework for stock corporations regarding the management
and supervision of the company. The objective of the Code is
the responsible management and control of enterprises and
groups for the purposes of sustainable, long-term value crea-
tion. This is intended to achieve a high level of transparency for
all stakeholders of the company. The Code is based on the pro-
visions of Austrian company, stock exchange and capital market
law, the EU recommendations regarding the responsibilities of
supervisory board members and the remuneration of directors
and the principles of the OECD Guidelines for Corporate Gov-
ernance. The Code has been amended several times since 2002.
COMMITMENT TO THE AUSTRIAN CODE
OF CORPORATE GOVERNANCE
AT  S Austria Technologie  Systemtechnik Aktiengesellschaft
(“ATS”) has expressly committed to compliance with the rules of
the Austrian Code of Corporate Governance (ACCG) since its ad-
mission to listing on the Vienna Stock Exchange on 20 May 2008.
This Corporate Governance Report is based on the status of the
Code as amended in January 2020. In key report items, matters
of the entire Group are included, if necessary.
The Code can be accessed at www.corporate-governance.at.
As an internationally operating listed company, ATS con­siders
the responsible and sustainable management of the ATS
Group a fundamental prerequisite to achieving the corporate
goal of a sustainable increase in company value considering eco-
logical, social and economic aspects.
EXPLANATION OF DEVIATIONS
(FROM C-RULES)
Based on the following explanations, ATS ensures behaviour
consistent with the Code in accordance with the ACCG.
C-RULES 27 AND 27A AND ALL
RELATED PROVISIONS
These rules were amended in the course of the review of the
ACCG in December 2009 and came into force on 1 January 2010.
Rules 27 and 27a contained in the version of January 2010 only
applied to contracts concluded after 31 December 2009. C-Rules
27 and 27a were therefore not applicable with respect to the
original agreement appointing Heinz Moitzi to the Management
Board as of 1 April 2005 and were also not applied in full when
that agreement was extended by the Supervisory Board in 2016.
Overall, it was ensured in drawing up the Management Board
contracts that existing contracts would not be interfered with and
Management Board contracts concluded at a later time would
also be consistent with the relevant regulations regarding remu-
neration. The following deviations regarding the contracts of An-
dreas Gerstenmayer, Monika Stoisser-Göhring and Heinz Moitzi
currently require explanation:
A long-term incentive programme (“LTI programme”) for the
Management Board and key staff was implemented by resolu-
tion of the Supervisory Board on 3 July 2014 based on stock ap-
preciation rights (“SAR”). The Management Board and Super-
visory Board work continuously to increase the per­formance
of the ATS Group with respect to non-financial targets and
cooperate closely regarding the long-term development of
the company. However, in order to maintain the transparen-
cy and traceability of target achievement as it relates to var-
iable long-term remuneration, no fixed non-financial criteria
for remuneration are stipulated under the long-term incentive
programme. This LTI programme was continued essentially un-
changed for the period 2017 to 2019. Details regarding the
LTI programme can be found in the section on Management
Board remuneration.
The variable remuneration of the Management Board (not in the
formofSAR)isdependentontheachievementoftwoperformance
indicators defined in the budget for the respective financial year:
return on capital employed (ROCE), with a 90% weighting, and the
ANNUAL REPORT 2019/20AT S FIRST CHOICE
FOR ADVANCED APPLICATIONS
36
COMPANY
innovation revenue rate (IRR), with a 10% weighting. The inclusion
of IRR is of major importance in giving variable remuneration a
long-term focus because innovation strength – the development of
new technologies, products or product types – is a crucial factor for
the future business success of the Group. It can also be measured
reliably. IRR represents the share of total revenue generated from
technologically innovative products introduced in the past three
years. The three-year reference period provides a long-term com-
ponent of variable remuneration.
The combination of short-term and long-term incentive pro-
grammes promotes the desired long-term, sustainable steering
effect over several years while at the same time accentuating the
targeted dynamic company growth.
Management Board members are contractually entitled to ter-
mination benefits in accordance with the Salaried Employees
Act, applied mutatis mutandis (“old system for severance pay”),
if their appointments are terminated. As a result, severance pay-
ments may exceed the amount of two annual remunerations
in exceptional cases. The same could also apply in the event of
a premature termination of a Management Board member’s
appointment by the respective Board member for reasonable
cause, or where the function becomes obsolete for legal reasons.
The contracts of all members of the Management Board in-
clude a “Change of Control” clause, which defines the benefits
related to the termination of the Management Board appoint-
ment as a result of a change of control. A change of control
exists in the event that a shareholder has obtained control of
the company in accordance with Section 22 of the Austrian
Takeover Act (ÜbG), or the company has been merged with
a non-Group legal entity, unless the value of the other legal
entity amounts to less than 50% of the value of the company
according to the agreed exchange ratio.
In the event of a change of control, the Management Board
member is entitled to resign for good cause and to terminate
the Management Board contract within a defined period of time
(“special termination right”). If the special termination right is
exercised or the Management Board contract is terminated by
mutual agreement within six months of the change of control,
the Management Board member is entitled to the payment of
his/her remuneration entitlements for the remaining term of this
contract, however, for a maximum of three annual gross salaries.
Other remuneration components shall not be included in the cal-
culation of the amount of the severance payment and shall be
excluded from it. If a termination benefit has been agreed in the
Management Board contract, the Management Board member
is also entitled to this termination benefit in the event the spe-
cial termination right is exercised or the Management Board con-
tract is terminated by mutual consent in the event of a change of
control. Beyond that, there are no entitlements. The agreement
of such a contract clause is considered market standard by the
Nomination and Remuneration Committee and serves to ensure
that Management Board members exercise their tasks in the best
interests of the company in such situations.
Management Board
COMPOSITION, WORKING PRACTICES
AND ORGANISATION
As of 31 March 2020, the Management Board consisted of ­Andreas
Gerstenmayer as Chairman of the Management Board (CEO),
­Monika Stoisser-Göhring as Chief Financial Officer (CFO) and Depu-
ty Chairwoman, and Heinz Moitzi as Chief Operating Officer (COO).
As a collective executive body, the Management Board is jointly
responsible for the management of the company. In addition to
the collective responsibility, each Management Board member
is also responsible for defined areas of business. The assigned
corporate functions are shown in the table.
FIRST CHOICE
FOR ADVANCED APPLICATIONS
ANNUAL REPORT 2019/20AT S
37
COMPANY
Composition of the
Supervisory Board
The Supervisory Board monitors and supervises management,
and is responsible for decisions that are of fundamental im­
portance to, or involve the strategic focus of, the Group.
Throughout the financial year from 1 April 2019 to 31 March
2020, the Supervisory Board received written and oral reports
from the Management Board on the Group’s policies and per­
formance, and was closely involved in all business issues. The
Super­visory Board met six times during the financial year
2019/20. Mr Androsch did not participate in person in more
than half of the Supervisory Board meetings.
At these meetings, the Management Board and the Supervisory
Board discussed the economic position of the ATS Group in
detail. The Management Board comprehensively informed the
Chairman of the Supervisory Board or his Deputy, also between
Supervisory Board meetings, and the Supervisory Board as part
of the Group’s ongoing reporting process and at all board meet-
ings, of the Group’s operating and financial position, and of its
investments in other companies, the staff situation and planned
capital expenditures. In the past financial year, discussions and
decisions of the Supervisory Board addressed, in particular, the
Group’s future strategic development and the establishment of
a new plant in Chongqing.
The Supervisory Board annually carries out a self-evaluation in ac-
cordance with Rule 36 of the Code of Corporate Governance, and
Management Board of ATS AG
Assigned Group functions
Date of first
appointment
End of current
appointment
Andreas Gerstenmayer, CEO
born 1965
Sales/Marketing; Communication; Investor Relations; Purchasing;
Business Development/Market Intelligence; Strategy
and Transformation; Compliance 01.02.2010 31.05.2021
Monika Stoisser-Göhring, CFO
born 1969
Finance and Accounting; Controlling, Legal; Internal Audit;
Information Technology; Human Resources;
Corporate Social Responsibility 02.06.2017 15.05.2020
Heinz Moitzi, COO
born 1956
Research  Development (RD); Maintenance;
Production; Quality Assurance; Business Process Excellence;
Environment; Health  Safety 01.04.2005 31.05.2021
did so again for the financial year 2019/20. This evaluation per-
formed by the Supervisory Board based on a digital questionnaire
confirmed that its practices meet the Good Governance require-
ments and that its organisation, work practices and target orienta-
tion are efficient and effective.
INDEPENDENCE OF SUPERVISORY
BOARD MEMBERS
In accordance with C-Rule 53 of the ACCG, the Supervisory
Board has established the following criteria to be used in de-
termining the independence of its members: Supervisory Board
members are to be regarded as independent if they have no
business or personal relationships with the company or its Man-
agement Board which could be cause for material conflicts of
interest and therefore liable to influence the behaviour of the
member in question. The detailed criteria for the assessment
of a Supervisory Board member are defined in the Rules of Pro-
cedure of the Supervisory Board, Appendix 1: Criteria of Inde-
pendence of the members of the ATS Supervisory Board. The
Rules of Procedure of the Supervisory Board can be viewed at
www.ats.net/company/supervisory-board/.
In March 2020, the members of the Supervisory Board appointed
by the Annual General Meeting each declared in writing whether
they were independent as determined by the above criteria. Sev-
en of the eight members of the Supervisory Board representing
shareholder interests declared that they were independent. Mr
Androsch declared that he was not independent.
ANNUAL REPORT 2019/20AT S FIRST CHOICE
FOR ADVANCED APPLICATIONS
38
COMPANY
ATS AG Supervisory Board
Date of first
appointment
End of current
appointment Membership of other Supervisory Boards
Independent
according to
ACCG rule
Hannes Androsch
Chairman of the Supervisory Board
born 1938 30/09/1995 26th AGM 2020 – –
Willibald Dörflinger
First Deputy Chairman of the Supervisory Board
born 1950 05/07/2005 26th AGM 2020
Deputy Chairman of the Supervisory Board of HWA AG,
Affalterbach, Germany 53
Regina Prehofer
Second Deputy Chairwoman of the Supervisory Board
born 1956 07/07/2011 30th AGM 2024
Member of the Supervisory Board of Wienerberger AG,
Vienna, Austria 53, 54
Karl Fink
Member of the Supervisory Board
born 1945 05/07/2005 26th AGM 2020 – 53, 54
Albert Hochleitner
Member of the Supervisory Board
born 1940 05/07/2005 26th AGM 2020 – 53, 54
Georg Riedl
Member of the Supervisory Board
born 1959 28/05/1999 30th AGM 2024
Member of the Supervisory Board of Vienna Insurance
Group AG, Vienna, Austria 53
Gertrude Tumpel-Gugerell
Member of the Supervisory Board
born 1952
04/07/2019 30th AGM 2024
Member of the Supervisory Board
of Vienna Insurance Group AG, Vienna, Austria
of OMV AG, Vienna, Austria
of Commerzbank AG, Frankfurt, Germany 53, 54
Karin Schaupp
Member of the Supervisory Board
born 1950 07/07/2011 30th AGM 2024 – 53, 54
Appointed by the Works Council
Wolfgang Fleck
Member of the Supervisory Board
born 1962 03/09/2008 – – n. a.
Günter Pint
Member of the Supervisory Board
born 1976 19/09/2017 – – n. a.
Siegfried Trauch
Member of the Supervisory Board
born 1960 28/01/2016 – – n. a.
Günther Wölfler
Member of the Supervisory Board
born 1960 10/06/2009 – – n. a.
FIRST CHOICE
FOR ADVANCED APPLICATIONS
ANNUAL REPORT 2019/20AT S
39
COMPANY
C-Rule 54 specifies that, for companies with a free float in excess
of 50%, at least two Supervisory Board members who are inde-
pendent in accordance with C-Rule 53 should also not be share-
holders with interests in excess of 10%, or representatives of such
interests. Five of the eight Supervisory Board members repre-
senting shareholder interests – Regina Prehofer, Karin Schaupp,
Getrude Tumpel-Gugerell, Karl Fink and Albert Hochleitner – de-
clared themselves independent within the meaning of this rule.
DIVERSITY
When selecting members of the Supervisory Board, the focus
is on expertise and management experience. Diversity is also a
consideration in its composition. Currently, three members of
the Supervisory Board are women, representing a proportion
of female members of 25%, a value below the average of listed
Austrian companies. However, an increase was achieved com-
pared to the previous year and the company strives to further
raise this percentage in accordance with legal requirements. The
age of Supervisory Board members ranges from 43 to 81 years on
31 March 2020. All members of the Supervisory Board represent-
ing shareholder interests have extensive experience in interna-
tional business. In the financial year 2017/18, a diversity concept
was prepared, which is continuously developed further. Details
regarding the diversity concept and the advancement of women
in leadership roles are provided in chapter “Material topics” of
the non-financial report.
RELATED PARTY TRANSACTIONS
In connection with various projects, the Group obtained services
totalling € 363 thousand (previous year: € 376 thousand) from AIC
Androsch International Management Consulting GmbH, where
Chairman of the Supervisory Board Hannes Androsch has full au-
thority to act on behalf of the company as its Managing Director.
COMMITTEES
In order to provide effective support and to properly address
complex technical matters, the Supervisory Board has established
three permanent committees for detailed analysis of particular
issues and regular reporting to the Supervisory Board.
Audit Committee
In the reporting year, the Audit Committee consisted of:
▪  Regina Prehofer (Chairwoman)
▪  Gertrude Tumpel-Gugerell (Finance expert, from AGM 2019)
▪  Gerhard Pichler (Finance expert, until AGM 2019)
▪  Georg Riedl
▪  Wolfgang Fleck
▪  Günther Wölfler
The Audit Committee monitors the accounting process and the
work of the statutory auditor, monitors and reviews the statutory
auditor’s independence, reviews the preparation and audit of the
annual financial statements and reviews the proposed distribu-
tion of profits, the Management Report and the Corporate Gov-
ernance Report as well as other reports and declarations to be
presented as part of the preparation of the annual financial state-
ments. The committee is responsible for reporting on the results
of its reviews to the Supervisory Board. The Audit Committee
also carries out preparatory work for the Supervisory Board on
all issues in connection with the audit of the consolidated finan-
cial statements, consolidated management report and the con-
solidated accounting process. It also submits a proposal for the
appointment of the statutory auditors and reports on this matter
to the Supervisory Board. The Audit Committee is responsible for
monitoring the effectiveness of the Group-wide internal control
system and, where appropriate, the Group’s internal audit and
risk management systems. The Audit Committee convened six
times in the financial year 2019/20. Its activities focused on the
discussion and reviews of the annual and consolidated financial
statements as of 31 March 2019, the planning and preparation
of the audit of the annual and consolidated financial statements
for the financial year 2019/20, the preparation of a proposal for
the election of the statutory auditor as well as the discussion of
the risk management, internal control and internal audit systems.
Nomination and Remuneration Committee
This committee consisted of the following members:
▪  Hannes Androsch (Chairman)
▪  Willibald Dörflinger (Deputy Chairman)
▪  Georg Riedl
▪  Wolfgang Fleck
▪  Günther Wölfler
ANNUAL REPORT 2019/20AT S FIRST CHOICE
FOR ADVANCED APPLICATIONS
40
COMPANY
The Nomination and Remuneration Committee submits pro­
posals to the Supervisory Board for appointments to fill vacan-
cies on the Management Board whenever necessary. It deals
with succession planning issues and the remuneration of Man-
agement Board members. All of the committee members rep-
resenting shareholders possess knowledge of and experience in
the area of remuneration policies. The Nomination and Remu-
neration Committee is also authorised to make decisions in ur-
gent cases. This committee met four times in the financial year
2019/20, which focused primarily on the succession planning
for the position of the COO.
Finance Committee
In December 2018, a permanent Finance Committee of the Su-
pervisory Board of ATS was established in order to address the
complex and specific tasks of financing as efficiently as possible.
The Members of the Finance Committee are:
▪  Hannes Androsch (Chairman)
▪  Willibald Dörflinger
▪  Regina Prehofer
▪  Georg Riedl
▪  Wolfgang Fleck
▪  Günther Wölfler
The Finance Committee met once in the financial year 2019/20
and discussed matters of general Group financing as well as pro-
ject financing.
Remuneration Report
for the Management and
Supervisory Boards
The following report presents the remuneration of ATS’s
Management and Supervisory Board members. It should be
read in conjunction with the explanations in the notes to the
2019/20 annual and consolidated financial statements.
MANAGEMENT BOARD REMUNERATION
Total remuneration paid to members of the Management Board
in the financial year: see table below
The fixed element represented 65.2% of Mr Gerstenmayer’s
total remuneration, and the variable element 34.8%. The fixed
element represented 100% of Mr Moitzi’s total remuneration
and the variable element 0%. Finally, the fixed element repre-
sented 100% of Ms Stoisser-Göhring’s total remuneration and
the variable element 0%. For the current Management Board
as a whole, the fixed element represented 83% in the financial
year 2019/20 and the variable element 17.0%.
By resolution of the Supervisory Board on 3 July 2014, a long-term
incentive (“LTI”) programme for the Management Board and key
staff based on stock appreciation rights (SAR) was implemented
for the period from 2014 to 2016; this programme was extended
largely unchanged for the period from 2017 to 2019.
SAR are rights to appreciation in value based on share perfor-
mance over a defined period of time. As with stock options, but
without granting actual shares or an option for such granting,
Management Board remuneration
€ in thousands
Financial year 2019/20 Financial year 2018/19
Fixed Variable Total Fixed Variable Total
Andreas Gerstenmayer 532 2841)
816 532 714 1,246
Monika Stoisser-Göhring2)
423 – 423 391 175 566
Heinz Moitzi 429 – 429 417 186 603
Karl Asamer3)
– – – – 142 142
Total 1,384 284 1,668 1,340 1,217 2,557
1) Variable remuneration includes remuneration from share appreciation rights amounting to € 284 thousand (previous year: € 427 thousand).
2) The exercise of share appreciation rights allocated before the appointment to the Management Board on 2 June 2017 is not included.
3) Former member of the Management Board (until 2 June 2017).
FIRST CHOICE
FOR ADVANCED APPLICATIONS
ANNUAL REPORT 2019/20AT S
41
COMPANY
the recipient receives financial remuneration only if the per-
formance of the share price is positive. In particular, the condi-
tions include long-term and multiple-year performance criteria,
a minimum vesting period of three years (with a subsequent
exercise period of no more than two years), a minimum own
investment by the recipient, and an upper limit on the potential
financial benefits:
Earnings per share (EPS) determines how many of the SAR al-
lotted may actually be exercised once the vesting period ends.
The EPS established by the medium-term plan for the report-
ing date of the third year following the allotment applies as the
target. If, at the end of the vesting period, less than 50% of the
EPS target has been achieved, the allotted SAR are forfeited. If
100% or more of the EPS target has been achieved at the end
of the vesting period, all of the allotted SAR may be exercised. If
achievement of the target is between 50% and 100%, the allot-
ted SAR may be exercised in linear proportion to the percentage
achieved.
Own investment is a mandatory prerequisite for exercising SAR.
The own investment is made by purchasing shares correspond-
ing to 20% of the total allotment amount in SAR for a given year
(e.g. for an allotment of 5,000 SAR, the own investment is 1,000
shares). If the own investment has not been made in full by the
end of the vesting period (after three years), all previously al-
lotted SAR of the corresponding programme are forfeited. The
own investment must be held for the entire period of participa-
tion in the LTI programme.
The exercise price is determined on the allotment date and is
equal to the average closing price of ATS shares on the Vienna
Stock Exchange during the six months preceding the respective
allotment date.
The performance of the share price determines the amount of
the LTI awarded to the recipient: the difference between the
exercise price of the relevant virtual allotment and the closing
price of the ATS share on the Vienna Stock Exchange on the
exercise date is multiplied by the number of SAR. There are no
premiums on the exercise price and payouts are made in cash.
In the event of exceptionally positive performance, the payout
amount per SAR is limited to the amount represented by 200%
of the respective exercise price (example: for an exercise price
of € 8, the maximum value per SAR is € 16, which means that
any share closing price above € 24 produces no associated in-
crease in the value per SAR).
Three allotment tranches were possible for the LTI programmes
2014–2016 and 2017–2019 respectively, from 1 April 2014 to
1 April 2019.
The following table shows the allotted SAR which have not been
exercised and have not forfeited by the year of allotment and
allotment prices as of 31 March 2020: see table below
The variable remuneration of the Management Board (not in
the form of SAR), which is generally accounted for in total re-
muneration, depends on the short-term achievement of two
performance indicators defined in the budget for the respec-
tive financial year: return on capital employed (ROCE), with a
90% weighting, and the innovation revenue rate (IRR), with a
10% weighting. The basic prerequisite for awarding this vari­
able remuneration is positive EBIT for the Group as a whole for
the financial year and the attainment of the target EBIT margin
for the Group as a whole by at least 70% (the “hurdle rate”).
If these key performance indicators are exceeded, bonuses are
restricted to a maximum of 200% of the annual bonus set out
in the contract of employment. The inclusion of IRR is of major
Total number of SARs granted, not yet exercised and not yet expired on 31 March 2020
Total 2019 2018 2017 2016
Andreas Gerstenmayer 150,000 50,000 50,000 50,000 –
Monika Stoisser-Göhring 90,000 30,000 30,000 30,000 –
Heinz Moitzi 90,000 30,000 30,000 30,000 –
Karl Asamer1)
30,000 – – 30,000 –
Exercise price (in €) 17.25 21.94 9.96 13.66
1) Former Member of the Management Board (until 2 June 2017).
ANNUAL REPORT 2019/20AT S FIRST CHOICE
FOR ADVANCED APPLICATIONS
42
COMPANY
importance in giving variable remuneration a long-term focus.
Innovative strength  – the development of new technologies,
products or product types – is a crucial factor for the future
business success of the Group. It can also be reliably measured:
IRR represents the share of total revenue generated by techno-
logically innovative products introduced in the past three years.
The three-year reference period provides a long-term compo-
nent of variable remuneration.
With respect to the variable remuneration of selected executives
in other Group companies, the same principles apply as described
above for the Management Board of the parent company.
Management Board members are contractually entitled to ter-
mination benefits in accordance with the Salaried Employees
Act, applied mutatis mutandis (“old system for severance pay”),
if their appointments are terminated. In the event of prema-
ture termination initiated by a Management Board member for
reasonable cause, or if the function is eliminated for legal rea-
sons, remuneration is payable until the end of the appointment
contract. Where a Management Board member resigns the ap-
pointment or is removed from office for severe breach of duty,
and in the event of death, payment of salary ceases at the end
of the applicable month.
Mr Gerstenmayer, Ms Stoisser-Göhring and Mr Moitzi have pen-
sion entitlements in the form of defined benefit or defined con-
tribution plans agreed individually. For Mr Gerstenmayer and
Ms Stoisser-Göhring, a contribution of 10% of the monthly gross
fixed salary is paid into a pension fund. Mr Moitzi’s pension en­
titlement is 1.2% of his most recent salary for each year of service,
up to a maximum of 40%. The amount of the occupational pen-
sion is based on the capital accumulated in the pension fund; the
annuity is determined by the pension fund’s rules.
Members of the Management Board are entitled to a company
car (included in the above-mentioned fixed remuneration in the
amount of the additional taxable amount) and are covered by
accident insurance, the premium of which is also included in
the above-mentioned fixed remuneration. Health insurance is
limited to what is provided under the Austrian statutory social
security system.
SUPERVISORY BOARD REMUNERATION
Remuneration for the members of the Supervisory Board is de-
termined retrospectively for the past financial year by means
of a resolution at the Annual General Meeting. Remuneration
paid to members of the Supervisory Board in the financial year
2019/20 for the previous financial year 2018/19 was in accord-
ance with the resolution passed at the 25th Annual General
Meeting of 4 July 2019: see table below
The Chairman of the Supervisory Board received fixed remu-
neration of € 56,240 as shown above, his Deputies € 44,160
and all other elected members €  28,120. Chairmanship of a
standing committee (Nomination and Remuneration Commit-
tee, Audit Committee) was remunerated with a fixed amount
of €  5,000 per financial year, and membership of a standing
committee with €  3,000. The attendance fee was €  400 per
Supervisory Board meeting and all cash expenses were thus
reimbursed. Members of the Supervisory Board also received
Remuneration for the members of the Supervisory Board
in €
Member Fixed fee
Committee
fee
Variable
remuneration
Attendance
fees Total
Hannes Androsch 56,240 6,667 13,800 2,400 79,107
Willibald Dörflinger 44,160 4,000 9,200 2,400 59,760
Regina Prehofer 44,160 6,000 9,200 2,400 61,760
Karl Fink 28,120 – 6,900 2,000 37,020
Albert Hochleitner 28,120 – 6,900 2,400 37,420
Gerhard Pichler 28,120 3,000 6,900 2,400 40,420
Georg Riedl 28,120 7,000 6,900 2,400 44,420
Karin Schaupp 28,120 – 6,900 2,400 37,420
Total 285,160 26,667 66,700 18,800 397,327
FIRST CHOICE
FOR ADVANCED APPLICATIONS
ANNUAL REPORT 2019/20AT S
43
COMPANY
variable ­remuneration based on the short-term achievement of
two performance targets defined as part of the budget. These
targets are return on capital employed (ROCE), with a weighting
of 90%, and the innovation revenue rate (IRR), with a weighting
of 10%. If the targets are achieved 100%, the Chairman receives
€ 15,000, his Deputies € 10,000 and other members € 7,500
per financial year. If the key performance indicators for ROCE
and IRR are exceeded, variable remuneration of a maximum of
200% of the base described above is paid. Members of the Su-
pervisory Board do not receive stock options in the Group or
SAR. Since the targets established for variable remuneration in
the budget for the financial year 2018/19 were achieved and ex-
ceeded, the maximum amount of variable remuneration for the
members of the Supervisory Board was provided in the financial
year 2018/19. For the financial year 2019/20 the remuneration
of the Supervisory Board will be determined at the 26th Annual
General Meeting on 9 July 2020.
The employee representatives perform their duties on the Su-
pervisory Board voluntarily and therefore receive no separate
remuneration for their position.
DIRECTORS AND OFFICERS LIABILITY
INSURANCE (DO INSURANCE)
The DO insurance at ATS covers all past, present and future
members of the Company’s and its subsidiaries’ managing and
supervisory bodies and selected other senior staff. The insur-
ance covers court and all other costs of defence against un-
warranted claims, together with the satisfaction of warranted
claims for pure financial loss arising from breaches of duty by
the insured in their managerial or supervisory activities. The in-
surance provides global cover and the annual premium is paid
by ATS.
Directors’ Dealings
Purchases and sales carried out by members of the Man-
agement Board, the Supervisory Board and related persons
are reported to the Financial Market Authority in accord-
ance with Art. 19 of Regulation (EU) No. 596/2014 and pub-
lished via an EU-wide disclosure system as well as on the
ATS website, www.ats.net/company/corporate-governance/
directors-­dealings/.
ANNUAL REPORT 2019/20AT S FIRST CHOICE
FOR ADVANCED APPLICATIONS
44
COMPANY
NON-FINANCIAL REPORT
Embedding and managing
sustainability
STATEMENT OF THE MANAGEMENT BOARD
ATS is committed to sustainability in all its facets. With this con-
densed report for the Group as a whole and for Austria Technol-
ogie und Systemtechnik AG (in the following referred to as the
“parent company”), we not only meet the reporting obligation
in accordance with the Sustainability and Diversity Improvement
Act (Section 243b, Section 267a and Section 243c of the Austrian
Commercial Code, UGB). Rather, our objective is to provide trans-
parency for all stakeholder groups. On the following pages, we
describe the development of the sustainability strategy and the
resulting fields of action in detail. The material topics are allocat-
ed to these strategic fields of action with management concepts,
due diligence processes and indicators.
BUSINESS MODEL AND GOVERNANCE
STRUCTURE STAND FOR SUSTAINABILITY
Today ATS high-end printed circuit boards and substrates al-
ready form the central nervous system of nearly all electronic de-
vices and are just as versatile and complex as the electronic devic-
es themselves. High-end interconnect solutions enable powerful
and high-tech applications for our customers and are employed
in the mobile devices, IC substrates, automotive, industrial and
medical segments. This makes ATS the technology and quality
leader in the printed circuit board and substrate industry. ATS is
Management structure_
Orientation
Steering
Implementation
Corporate
functions
and business
segments
Management
Board
Corporate
Sustainability
Sustainability
Steering
Committee
Governance
Risk 
Compliance
Committee
Working groups
FIRST CHOICE
FOR ADVANCED APPLICATIONS
ANNUAL REPORT 2019/20AT S
45
COMPANY
a global player with production sites in Austria, India, China and
South Korea and additional sales service companies around the
globe. Working with passion and diligence every day, an average
of 10,239 employees make the success of ATS and its customers
worldwide possible. Independent of the evolving technologies,
ATS offers the interconnect technology of the future.
The sustainability dimensions are firmly embedded in this busi-
ness model. All decisions are made taking into account social,
environmental and economic aspects and, of course, compliance
with legal requirements.
The Corporate Sustainability team is responsible for the devel-
opment of the sustainability strategy in close alignment with the
Management Board of the ATS Group, the business segments
and all other corporate functions, and for the coordination of
the sustainability agenda. The team is also represented in rele-
vant steering committees and reports directly to the ATS Group
Management Board.
PARTNERSHIPS – MORE
EFFECTIVE TOGETHER
ATS is convinced that working together, we are more effec-
tive as a society. ATS therefore relies on strong partnerships
and is committed to the UN Sustainable Development Goals
(SDGs), the OECD Guidelines for Multinational Enterprises, the
UN Guiding Principles for Business and Human Rights, the In-
ternational Labour Organization (ILO), the Responsible Business
Alliance (RBA) and the Responsible Minerals Initiative (RMI). In
addition, we continuously work on the increasing integration of
climate-related information in accordance with the EU guideline
for the disclosure of climate-related information and the Task
Force on Climate-related Financial Disclosures (TCFD). This re-
port was prepared based on the standards of the Global Report-
ing Initiative (GRI), “Core” option.
VALUE CREATION PROCESS –
RESPONSIBILITY STARTS WITH
THE SUPPLY CHAIN
For a high-end interconnect solution provider, growth and value
creation are central to economic success. ATS recognises its
responsibility along the entire value chain, uses opportunities
and risks and is committed to excellence in the printed circuit
board and substrate industry based on the best customer ser-
vice and innovative, sustainable solutions. In doing so, it is not
enough to focus on selected processes; rather, the entire value
chain must be viewed in an integrated manner.
In procurement, it is not just the price that counts
This integrated approach starts with sourcing raw materials
such as copper and gold, but also covers the production of key
materials such as laminates and chemicals, the choice of equip-
ment as well as purchased energy and water supply. Therefore,
ATS needs sustainable partnerships within the value chain
with partners who pursue the same goals. That is why in ad-
dition to price, non-financial factors such as delivery reliability,
quality, business ethics, respect for human rights and compli-
ance with environmental standards also count in the selection
of our suppliers.
Storage, production and transport are
direct spheres of influence
Spheres of influence include the transport and storage of pre-
cursor materials, the production and packaging of products and,
in part, the delivery to customers. Appropriate storage of the
materials before the start of production as well as careful han-
dling in production are indispensable for the entire manufac-
turing process. ATS always strives for best-in-class approach-
es in all processes. To contribute to a sustainable value chain
ATS aims to continuously improve processes and build strong
partnerships with our employees and supplier companies.
This includes permanent efforts to reduce the consumption of
­water, energy and raw materials to a minimum through target-
ed efficiency projects. Certifications and standards that are well
ANNUAL REPORT 2019/20AT S FIRST CHOICE
FOR ADVANCED APPLICATIONS
46
COMPANY
­established at all production sites indicate clearly that we take
our responsibility regarding quality, the environment, occupa-
tional safety, energy, data security and customer orientation se-
riously. Regular recertification audits ensure that the standards
are maintained. The table on the following page shows an over-
view of all standards and norms of the ATS Group.
End users are primarily responsible for the
utilisation phase and disposal of the end devices
Exercising influence during the utilisation phase requires strong
partnerships with our customers. Regarding proper disposal after
the utilisation phase, ATS calls upon end users to act responsibly.
Value creation process_
Direct sphere of influence of ATS
Raw material
and equipment
Upstream
Production
Downstream
Customer
Utilisation phaseEnd of life
Disposal
FIRST CHOICE
FOR ADVANCED APPLICATIONS
ANNUAL REPORT 2019/20AT S
47
COMPANY
Standards and certificates
Certification Description Leoben Fehring Nanjangud Ansan Shanghai Chongqing
ISO 9001:2015
Certification of quality management systems to
prove high quality standards of products
X X X X X X
EN 9100:2018
European quality standard for
the aerospace industry
X X – – – –
DS/EN ISO 13485:2016 International quality standard for the design
and production of medical devices
X X – – – –
DIN EN ISO 50001:2011
International standard for energy management
to increase energy efficiency
X X X – – –
OHSAS 18001:2007
(ISO 45001)
Standard for the management of
occupational health and safety to minimise
risks and increase productivity
X X X X X X
ISO 14001:2015
Global standard for environmental
management systems, to optimise processes,
reduce costs and minimise risks
X X X X X X
IATF 16949:2016
Globally recognised standard
in automotive industry
X X X X X –
ISO/IEC 27001:2013 International standard for information security X X – – – –
NADCAP Accreditation
Accreditation for a uniform quality standard in
the aerospace industry to harmonise production
and audit processes of aircraft components
X – – – – –
AEO Certificate
Authorised Economic Operator
of the European Union
X X – – – –
UL Listing
Standard to ensure electrical and
mechanical safety of electronic components
X X X X X X
Sony Green Partner
Certificate
Sony Green Partner – – – – X –
However, as far as it is in our sphere of influence, ATS does
not shy away from its obligations when it comes to disposal, but
ensures that waste is adequately disposed of by either returning
it to the processes as part of a circular economy or by recycling
it through a variety of procedures. The goal is to keep the impact
of our business activities on people and the environment to a
minimum and to go beyond legal minimum requirements.
ANNUAL REPORT 2019/20AT S FIRST CHOICE
FOR ADVANCED APPLICATIONS
48
COMPANY
THE SUSTAINABILITY STRATEGY IS DERIVED
FROM THE CORPORATE STRATEGY
Sustainability is firmly embedded in our corporate strategy and
part of our ATS mission. As a globally operating company, it is
essential to view the big picture: we aim to be the first choice for
advanced applications. The strategic levers to achieve this goal
are expanding technology leadership through innovative solu-
tions, sustainable, profitable growth, creation of stakeholder
value and sustainable management. Based on this holistic and
future-oriented mindset, ATS, as a leading provider of high-
end interconnect solutions, aims to reconcile the interests of
business, ecology and social development.
Stakeholder survey as a central component
of the sustainability strategy
We developed the sustainability strategy in line with our Group-
wide strategic orientation. ATS attached great value to involv-
ing all important groups of stakeholders including employees,
customers, suppliers and shareholders. The results of the stake-
holder survey conducted during the 2018/19 financial year and
the topics resulting from the materiality analysis take into ac-
count the impact of ATS’s operating activities, our supply chain
and our products, and are central elements of the sustainability
strategy. In the financial year 2019/20, the results of the materi-
ality matrix were reflected upon together with the Management
Board, taking into account the feedback of key customers. In
the course of this process we came to the conclusion that both
communication and digitalisation are tools rather than drivers.
Both are material instruments in achieving the strategic goals
and support the other material topics, but are not an end in
itself. Therefore, communication and digitalisation are not listed
as separate material topics in this year’s non-financial report.
UN Sustainable Development Goals
and global trends considered
Other influencing factors beyond that were of course also con-
sidered. ATS makes a clear commitment to the Sustainable De-
velopment Goals (SDGs) of the United Nations. These goals have
been incorporated in the sustainability strategy insofar as the
impact of ATS’s activities on all 17 goals and their 169 subgoals
were assessed in detail. In doing so, three SDGs were rated as
central and another six as relevant. These nine SDGs which are
essential to ATS are accentuated in the illustration below. ATS
thus takes both the responsibility and the opportunity to contrib-
ute to climate protection, sustainable production and reduction
of inequality within the meaning of the SDGs.
The SDGs that guide us_
WE FOLLOW!
We have rated 9 of the 17 SDGs
as relevant to us.
FIRST CHOICE
FOR ADVANCED APPLICATIONS
ANNUAL REPORT 2019/20AT S
49
COMPANY
Moreover, global developments and trends, the risk report 2020
of the Global Economic Forum as well as the consideration of
the Taxonomy Report of the technical expert group of the EU
on sustainable finance, the EU Guideline for the reporting of cli-
mate-related information and the Task Force on Climate-related
Financial Disclosures (TCFD) were considered in the strategy de-
velopment process.
Integration of non-financial opportunities
and risks into the existing opportunities and
risk management
The integration of non-financial opportunities and risk manage-
ment into the existing Group-wide risk management was one of
the milestones in the financial year 2019/20 (see Management
Report page 107 ff.). Based on a comprehensive risk catalogue
consisting of more than 600 risks, the non-financial risks were
filtered. These are the risks related to the environment, social
matters and responsible governance  – so-called ESG risks. A
clear distinction was made between causes, risks and the im-
pact on the operating activities of ATS and on the environ-
ment. In the next step, these risks were assigned to existing risk
categories, a reference was established between qualitative and
quantitative risk assessment and all risks were assessed both
in the short-term horizon of one year and in the medium-term
5-year horizon. The process is shown in the illustration below.
The overview of non-financial opportunities and risks including
risk categories, mitigation measures and allocation of the topics
are shown in the table on page 50.
Material risks are risks which in line with this risk assessment
process result in a risk level greater than three in the one-year
period for the environment before further mitigation measures
and which are caused directly by the operations of ATS, our
supply chain or products. For a detailed risk assessment with a
focus on the operating activity of ATS including notes on the
risks levels and management, please refer to the Group Man-
agement Report, Section “Opportunities and Risks”.
In addition, other relevant risks such as occupational accidents
or corruption are also listed. While these risks are of course part
of the risk assessment process, they were assessed at a lower
risk level. This is due to the fact that the mitigation measures are
so well established within the company that either the probabil-
ity of occurrence or the expected impact on the environment
and ATS are considered to be low. In accordance with the EU
Guidelines for reporting climate-related information and the
TCFD, climate-relevant risks are also part of the risk assessment.
In addition to the physical risks, caused by chronic or acute ef-
fects of climate change and global warming on the operating
activities of ATS and the environment, risks and opportunities
arising from the transition to a low-carbon, climate-resilient
economy are also considered.
ATS considers this transition an opportunity and accordingly de-
veloped the energy strategy with ambitious decarbonisation tar-
gets. This way, we counter potential transitional risks, which could
arise from future laws and regulations as well as customer re-
quirements. At the same time, we use the opportunity to position
ourselves as a climate-resilient company and to benefit from repu-
tation gains. We counter technological risks with sustainable inno-
vations and, as a first step, with our life cycle assessment project.
Identification
of material
ESG risks
Allocation to
existing risk
categories
Assessment of
risks for ATS and
the environment
Reporting
in line with
Group-wide risk
management
Mitigation
Risk management_
ANNUAL REPORT 2019/20AT S FIRST CHOICE
FOR ADVANCED APPLICATIONS
50
COMPANY
In addition, we included risks in our assessment process which
are not, or only partially, caused by ATS. These include pan-
demics, extreme weather events and global warming. We are,
however, aware that ATS, like any other company or individual,
also contributes to these phenomena. Moreover, such events
may have considerable effects on both ATS and relevant stake-
holder groups and are therefore also deemed to be relevant.
Deriving fields of action from
the strategy process
As shown in the illustration on the following page, four strate-
gic fields of action were derived from the strategy development
process: environment  resources, sustainable innovation, em-
ployees  society, sustainable supply chain.
The sustainability strategy underlines the stringent approach
of the definition of fields of action, setting clear and ambitious
goals and initiating concrete measures to achieve these goals.
This is complemented by transparent management and control
of the degree of target attainment. The strategy is intended to
Overview of material and other relevant risks
Risk category Risk Mitigation Opportunities NaDiVeG issues
OPERATIONAL
Inefficient use
of resources
Energy strategy, projects to increase
efficiency and effectiveness, water recycling
Cost reduction, climate-resilient business
model, industry benchmark, image
improvement
Environmental issues
ORGANISATION
Discrimination and
low diversity of staff
Diversity strategy, Code of Conduct Inclusive, diverse employer, competitive
advantage, increased profitability, inno-
vative strength and employee motivation,
low fluctuation
Social issues,
employee issues
MARKET Use of ATS
products in
unethical
applications
Code of Conduct, commitment to RBA,
internal guideline, training
Protection of human rights, avoidance of
support of armed conflicts and environ-
mental degradation, image improvement,
increased employee motivation
Environmental issues,
social issues, respect
for human rights
PROCUREMENT Non-compliance
with ESG-relevant
requirements
Supplier Code of Conduct, clear processes
for careful selection of suppliers, supplier
audits, commitment to RBA  RMI
Protection of human rights, image
improvement, increased attractiveness
of the company for sustainable financing,
avoidance of support of armed conflicts,
increased employee motivation
Social issues, employee
issues, environmental
issues, respect for
human rights
OPERATIONAL Disruption of
operations/
pandemics
Business continuity management,
OHSAS 18001/ISO 45001, highest
safety standards
Image improvement, strong crisis
management, strong cohesion and
loyalty of staff
Employee issues,
social issues
OPERATIONAL Occupational
accidents
OHSAS 18001/ISO 45001, protective
clothing, handling of dangerous goods,
training
Increased employee motivation,
low fluctuation
Employee issues
ENVIRONMENT Extreme weather
events, natural
disasters
Business continuity management, OHSAS
18001/ISO 45001, employee sensitisation
and training
Strong cohesion, loyalty of staff,
stronger adaptability
Environmental issues,
social issues
ENVIRONMENT Global warming Energy strategy, projects to increase
efficiency and effectiveness, employee
sensitisation and training
Cost reduction, climate-resilient
business model, industry benchmark,
image improvement
Environmental issues,
social issues
ORGANISATION Corruption and
unethical behaviour
Code of Conduct, anti-corruption
guideline, capital market compliance,
training, GRC Committee
Image improvement, trustful
partnerships, competitive advantage
Employee issues,
combat corruption
and bribery
MaterialrisksOtherrelevantrisks
FIRST CHOICE
FOR ADVANCED APPLICATIONS
ANNUAL REPORT 2019/20AT S
51
COMPANY
make an essential contribution to mitigating the negative impact
of ATS’s operating activities on the topics. At the same time,
positive aspects should be maximised and opportunities used
as best possible. Details regarding the qualitative and quantita-
tive goals, management concepts, due diligence processes and
key figures, as well as reference to the SDGs are provided in the
following chapters. The report is structured according to strate-
gic fields of action, to which the material topics are assigned as
shown in the illustration below.
In some areas it is not fully possible to clearly allocate the mate-
rial topics to the strategic fields of action or chapters. For exam-
ple, efficient production is possible only partially due to innovative
solutions. Since all our measures regarding energy, CO2, water and
waste are aimed at making production more efficient and counter-
ing inefficient use of resources, efficient production is part of the
chapter Environment  Resources.
These overlaps are even clearer in the strategic fields of action Em-
ployees  Society and Sustainable Supply Chain. The material topic
human rights, for example, could be allocated to both Employees
 Society and to Sustainable Supply Chain. We chose to allocate
human rights to the Supply Chain because the risk of human rights
violations within the ATS system boundaries is relatively low in
comparison with the supply chain. This is attributable to the direct
controllability within the company and the well-established miti-
gation measures. Therefore, the corresponding control measures,
goals and indicators in the area of human rights are allocated to the
supplychain.Inaddition,wereportonmeasurestopreventhuman
rights violations within ATS in the section Employees  Society.
ATSSustainability
strategy
2025
Environment
 Resources
_ Efficient production
Sustainable
Innovation
_ Innovation
Employees 
Society
_ Occupational health
and safety
_ Knowledge
_ Diversity
_ Anti-corruption
Sustainable
Supply Chain
_ Human rights
Stakeholders
SDGs
Global trends
Opportunities
and risks
Corporate
strategy
Four strategic fields of
action and allocated material topics_
ANNUAL REPORT 2019/20AT S FIRST CHOICE
FOR ADVANCED APPLICATIONS
52
COMPANY
SDGs The contribution of ATS
in the area of Environment  Resources
Decoupling of economic growth from environmental impact
through global efficiency measures, higher productivity, techno-
logical development and innovation. The copper recycling
project and a number of Lean Six Sigma projects around the
world contribute to this goal.
Taking into account a resilient infrastructure and sustainable
industrialisation, we see economic development strongly
associated with SDG 17 and SDG 13. This aspect is reflected
in the energy strategy, which can only be achieved through
strong partnerships, higher resource efficiency and eco-friendly
technologies.
Stringent sustainability management with respect to environ-
ment, waste, chemicals and energy in accordance with ISO
14001 and ISO 50001. This includes efficient use of resources,
careful disposal, waste prevention and recycling, and the
­prevention of emissions into the air, water and soil.
Transparent sustainability reporting on all aspects of sustaina-
bility.
Based on the ISO 14001 certification at all locations and our
REACH and RoHS compliance, we commit to the prevention of
water pollution as well as releasing chemicals and hazardous
substances. We achieve maximum efficiency of water con-
sumption in regions where water is scarce through the highest
possible water recycling rates.
The ATS energy strategy and the climate protection measures
derived from it are central aspects of the sustainability strategy.
Environment 
Resources
Environment  Resources is a strategic field of action of ATS,
to which the material topic efficient production technologies is
allocated. This is consistent with our analysis of the UN Sustain-
able Development Goals (SDGs). The impact of ATS’s operating
activities on the environment and resources, and consequently
the effectiveness of the measures taken by ATS, is the greatest
on SDGs 6, SDG 8, SDG 9, SDG 12, and SDG 13.
Sustainability is always associated with an increasing scarcity of
resources. While the economy is growing, the aim is to reduce
material resource consumption. This can only be achieved with
maximum efficiency.
As a producing business with a large number of wet chemical
processes, the topics of climate protection and water are also
of great importance to us. Details on ATS’s contribution to
achieving the above-mentioned SGDs are summarised in the
following table.
PRODUCTION EFFICIENCY MINIMISES
ENVIRONMENTAL IMPACT AND ­RESOURCE
CONSUMPTION WHILE CREATING
MAXIMUM VALUE
ATS attaches great importance to manufacturing high-end prod­
ucts based on efficient processes and technologies which stand for
premium quality and reliability. This comprises minimum energy,
material and water consumption and the prevention of emissions
and waste while creating maximum value. The environmental im-
pact is kept to a minimum based on a holistic approach. The certi-
fication according to the international quality and environmental
standardsISO9001andISO14001atallproductionsitesisonlyone
example showing that the high quality and environmental aware­
ness is embedded in the Group-wide management systems. In ad-
dition to annual recertification audits to maintain these standards,
we also possess further industry- and location-specific certifica-
tions for the automotive sector (ISO/TS 16949), aviation (AS/EN
9100) and the medical sector (DS/EN 13485).
Our journey to a climate-resilient,
low-carbon future
With a focus on the market and megatrends, and taking into ac-
count the needs of our stakeholders, ATS is now taking more
drastic climate protection measures as part of our sustainability
strategy and the energy strategies derived from it.
Our goal is to cover at least 80% of the Group’s energy require-
ments from renewable energy sources by 2025 and to replace
all fossil fuels within our own production sites around the globe
(Scope 1 emissions) by 2030. As a result of climate change and the
associated global warming as well as growing resource and water
scarcity, the demands on the part of customers, politics and society
in this context are expected to intensify in the future.
FIRST CHOICE
FOR ADVANCED APPLICATIONS
ANNUAL REPORT 2019/20AT S
53
COMPANY
ATS recognises that this is a very ambitious goal. At the same
time it is a categorical imperative if we are to grow profitably
in the long term. Building on the existing goal of reducing rel-
ative energy consumption by 5% annually, long-term goals are
defined for the first time as part of the energy strategy.
The targets and measures we set with respect to energy and
CO2 in the past few years help us achieve this goal. Even though
energy efficiency does not directly pay into the achievement of
our long-term goal, energy efficiency measures are most use-
ful from both an economic and an ecological perspective and
therefore a crucial element of the ATS energy strategy. Our
locations in Austria and India are already certified according to
the energy management standard ISO 50001, with the loca-
tions in China and South Korea expected to follow in the com-
ing financial year. Energy audits have already been performed
at all locations. Appropriate measures were derived from the
resulting energy savings potential, and implemented. Optimum
Our goal for 2025
waste heat utilisation, heat recovery from air compressors, var-
iable speed control of motors, the use of heat pumps, regular
identification and elimination of compressed air leaks, building
insulation and reduction of natural gas consumption for heat
and steam generation are only a few examples. Overall, savings
of 13.4 GWh or 10.9 kt of CO2 were thus realised throughout
the Group during the financial year 2019/20 compared with
12 GWh or 9.3 kt of CO2 in the previous year. On a cumulative
basis, the energy efficiency measures of the past years have al-
ready led to savings of 46.4 GWh.
ATS attaches great importance to a modern, sustainable infra-
structure, with efficient use of resources and increased utilisa-
tion of clean, eco-friendly energy. It therefore goes without say-
ing that the results of the energy audits are taken into account
in the expansion of the plants in South Korea and Chongqing.
We thus ensure maximum energy efficiency in the planning
phase of new plants.
As part of the energy strategy, further levers to accomplish goals
are now being added to the energy efficiency measures already
taken or planned all over the world. Innovative solutions and
resilient partnerships in energy procurement are as important
to us as taking completely new paths. Collaboration with inter-
nal research and development, engineering and maintenance
specialists as well as external stakeholders such as research
partners, machine manufacturers and neighbour companies en-
ables us to generate new solutions supporting the implementa-
tion of the goals. All measures are evaluated taking into account
profitability and feasibility. This is the only way we can achieve
technological modernisation and ensure a climate-resilient,
low-carbon economy and efficient use of natural resources.
With the ATS energy strategy we aim to make our contribution
to reaching the 2-degree goal and are considering joining the
Science Based Targets initiative. In doing so, we would put our
goal of decarbonising our production processes to the test and
define additional goals if necessary. Until then, we will adhere to
our previous key indicators and try to expand them. For example,
Scope 3 emissions were added to our reporting for the financial
year 2019/20, and transparency was increased in the area of en-
ergy sources in order to illustrate the complexity of the climate
and energy target for our stakeholders.
CO2 emissions are reported in accordance with the Greenhouse
Gas (GHG) Protocol. Scope 1 emissions refer to all direct emissions;
in our case, this comprises the use of natural gas, liquefied gas, die-
sel and heavy oil. Scope 2 emissions refer to purchased electricity
while Scope 3 covers all indirect emissions, which are not direct-
ly related to the company. The calculation of Scope 1 emissions is
Energy savings
ANNUAL REPORT 2019/20AT S FIRST CHOICE
FOR ADVANCED APPLICATIONS
54
COMPANY
based on the factors of the Federal Economic Agency. The other
CO2 indicators are based on the conversion factors of the ecoinvent
database version 3. All CO2 figures refer to CO2 equivalents.
The chart above on the left shows that electricity is ATS’s main
energy source, resulting in a high Scope 2 share of CO2 emissions
at 48.7%. At the same time, Scope 3 emissions, which are reported
in greater detail for this financial year, are substantial at 48.2%. The
reporting of Scope 3 emissions was significantly improved in the
financial year 2019/20. Scope 3 emissions now also cover air travel
of ATS employees, the transport of our products to customers as
well as 72.4% of the purchasing volume and consequently the CO2
emissions of essential materials. Scope 3 emissions are also gener-
ated in the production of direct and indirect energy sources, which
are now also included in Scope 3 reporting. This also explains the
increase in Scope 3 emissions compared to the previous years.
Energy consumption by energy source
in %
Electricity
Natural gas
Other
80.6
17.6
1.8
Split of carbon footprint by Scope
in %
Scope 1
Scope 2
Scope 3
48.2
3.1
48.7
At the same time, this results in a decline in Scope 2 emissions as
the conversion factors used also had to be adjusted accordingly.
Despite energy savings of 13.4 GWh, we did not manage to re-
duce relative energy consumption in 2019/20 compared with the
previous year. Rather, we recorded an increase of 12.4%, which is
primarily attributable to the ATS growth strategy and the relat-
ed technology developments. The expansion and qualification of
production lines as well as the development of new technologies
require resources, without directly generating added value. In
addition, the financial year 2019/20 saw a challenging market en-
vironment and the COVID-19-pandemic. However, based on the
planned extensive measures as part of the energy and climate
strategy we are confident that these are only temporary effects.
Energy consumption
Absolute energy consumption
(in GWh)
Relative energy consumption
(in kWh per € GVA)
2019/20 2018/19 Change in % 2019/20 2018/19 Change in %
Mobile Devices  Substrates segment 518.2 500.2 3.6 1.68 1.53 10.0
Automotive, Industrial,
Medical segment  Others 146.5 147.3 (0.6) 1.02 0.87 16.1
Total Group 664.6 647.5 2.6 1.47 1.30 12.4
thereof attributable to parent company 70.0 71.1 (1.6) 0.69 0.62 11.0
FIRST CHOICE
FOR ADVANCED APPLICATIONS
ANNUAL REPORT 2019/20AT S
55
COMPANY
1.74
Relative energy consumption
in kWh per € GVA
2016/17 2017/18 2018/19 2019/20
1.38
1.30
1.47
Relative carbon footprint (Scope 1+2)
in kg CO2 per € GVA
2016/17 2017/18 2018/19 2019/20
1.22 1.16
0.96
1.53
Carbon footprint (Scope 3)
Absolute carbon footprint (Scope 3)
(in kt CO2)*
Relative carbon footprint (Scope 3)
(in kg CO2 per € GVA)*
2019/20 2018/19 Change in % 2019/20 2018/19 Change in %
Mobile Devices  Substrates segment 309.8 5.3 100 1.00 0.02 100
Automotive, Industrial,
Medical segment  Others 92.6 5.8 100 0.64 0.03 100
Total Group 402.4 11.1 100 0.89 0.02 100
thereof attributable to parent company 32.1 0.6 100 0.32 0.01 100
* The strong increase results from the inclusion of the following categories in addition to the transportation of products to customers as of the financial
year 2019/20: purchased goods and services, fuel- and energy-related activities (not included in Scope 1 or 2) and business travel.
Carbon footprint (Scope 1 + 2)
Absolute carbon footprint (Scope 1 + 2)
(in kt CO2)
Relative carbon footprint (Scope 1 + 2)
(in kg CO2 per € GVA)
2019/20 2018/19 Change in % 2019/20 2018/19 Change in %
Mobile Devices  Substrates segment 346.5 462.7 (25.1) 1.12 1.41 (20.5)
Automotive, Industrial,
Medical segment  Others 86.8 111.9 (22.4) 0.60 0.66 (9.4)
Total Group 433.3 574.6 (24.6) 0.96 1.16 (17.4)
thereof attributable to parent company 17.6 20.9 (15.5) 0.17 0.18 (4.7)
ANNUAL REPORT 2019/20AT S FIRST CHOICE
FOR ADVANCED APPLICATIONS
56
COMPANY
Accordingly, energy expenses also increased by roughly € 2 mil-
lion as explained in the consolidated statement of profit or loss in
the notes to the consolidated financial statements.
The reduction of the relative carbon footprint (Scope 1 + 2) by
17.4% year-on-year is primarily attributable to the removal of
fuel and energy-related Scope 3 emissions as of the financial year
2019/20. Without the change in factors, the relative carbon foot-
print would also increase by 3.6% in comparison to the previous
year.
The relative indicators refer to the gross value added (GVA),
which is calculated based on EBIT plus depreciation/amortisa-
tion and wage and salary expenses.
Reduction of water consumption
and waste as further central elements
of the sustainability strategy
As part of its sustainability efforts, ATS not only strives to make
a significant contribution to climate protection, but also pursues
the efficient use, sustainable withdrawal and provision of water,
as well as the prevention and recycling of waste.
The production of printed circuit boards and IC substrates re-
quires a large number of wet chemical and water-intensive
processes. Due to exothermal chemical production process-
es, ­water is also used to cool machinery. In addition to cool-
ing water, deionised and ultra-pure water is produced, which is
used as process water in production. Wastewater is treated in
a chemical-­physical wastewater system or fed through purifica-
tion or biofilter facilities and cooling towers. This way we reduce
potential environmental impacts at all locations to a minimum.
We are aware that a conflict of objectives exists between the
energy targets and the reduction of water consumption. There-
fore, we will focus on developing a water strategy which is con-
sistent with the energy strategy in the financial year 2020/21.
In the course of the strategy development, we will also define
long-term goals in the area of water. Until then, we will adhere
to the existing target of a 3% reduction of water consumption
in comparison to the target of the previous year. In any case, it
is obvious to us that the water recycling rate at production sites
located in high-risk areas according to the Aqueduct Water Risk
Tool must be increased continuously. This will affect above all our
locations in Shanghai and Nanjangud. Here, ATS can also build
on extensive measures of the past few years. The water recycling
rates at these locations already amount to up to 25% and 80%,
respectively. Nonetheless, water consumption increased in rela-
tion to gross value added in the financial year 2019/20, up 17.4%
to 11.66 litres per € of gross value added. This means that the
Relative water consumption
in litres per € GVA
2016/17 2017/18 2018/19 2019/20
12.93
10.62
9.93
Water consumption
Absolute water consumption
(in m³ million)
Relative water consumption
(in litres per € GVA)
2019/20 2018/19 Change in % 2019/20 2018/19 Change in %
Mobile Devices  Substrates segment 4.70 4.28 9.8 15.22 13.06 16.6
Automotive, Industrial,
Medical segment  Others 0.58 0.65 (10.2) 4.03 3.84 4.9
Total Group 5.28 4.93 7.2 11.66 9.93 17.4
thereof attributable to parent company 0.18 0.30 (39.7) 1.80 2.65 (31.9)
11.66
FIRST CHOICE
FOR ADVANCED APPLICATIONS
ANNUAL REPORT 2019/20AT S
57
COMPANY
3% reduction target was not met in the financial year 2019/20.
Similar to the increase in relative energy consumption, this is also
attributable to our growth strategy, the technology development
and the market environment.
The reduction of the quantity of waste, in particular hazardous
waste, is another central element of the sustainability strategy
and contributes significantly to achieving SDG 12, sustainable
consumption and production, and indirectly to SDG 6 by pre-
venting emissions and reducing wastewater.
In the financial year 2019/20, the quantity of relative total waste in-
creasedby15.2%afterdecliningcontinuouslyinthepreviousyears.
In particular, the share of hazardous waste rose. This is addressed
by the copper recycling project initiated in the last financial year.
Waste amount
Absolute waste amount
(in kt)
Relative waste amount
(in kg per € GVA)
2019/20 2018/19 Change in % 2019/20 2018/19 Change in %
Mobile Devices  Substrates segment 31.6 29.5 7.1 0.10 0.09 13.7
Automotive, Industrial,
Medical segment  Others 16.2 16.0 1.6 0.11 0.09 18.6
Total Group 47.8 45.5 5.1 0.11 0.09 15.2
thereof attributable to parent company 5.7 5.7 1.1 0.06 0.05 14.1
Copper is an indispensable raw material in the production of
printed circuit boards, which, at 4,066 tonnes, accounts for the
largest share of production materials used.
Copper-containing material flows are incurred in the production
of the conductive pattern. A large part of them is fed to the com-
pany’s internal wastewater treatment plants. Before disposing
of the copper-containing sludge created in this process, a wide
variety of chemicals are used to treat the waste.
The goal of the current copper recycling project is to make the
production of ATS printed circuit boards as resource-friendly
as possible while preventing waste as much as possible. The aim
is to move from a linear usage of copper throughout the process
to a cycle of reuse of copper, preventing waste and increasing
raw material efficiency.
As part of the project, detailed analyses were conducted to evalu-
ate possibilities to manage the flows of recyclable materials more
efficiently. The focus was put on hazardous waste and acids. In ad-
dition to enhancing raw material efficiency by recovering copper-­
containing acids from production processes, the project also leads
to a reduction of the chemicals used and the waste produced,
which is largely classified as hazardous waste.
We are confident that we can scale these measures and systems
in such a way in the future that the amounts of copper sludge
produced at the sites in Hinterberg and Nanjangud correspond
in the future. Subsequently, the concept will be rolled out to the
other locations.
Relative waste amount
in kg per € GVA
2016/17 2017/18 2018/19 2019/20
0.15
0.11
0.09
▪Hazardous waste
▪Non-hazardous waste
0.110.06
0.09
0.04
0.07
0.02
0.07
0.02
0.08
ANNUAL REPORT 2019/20AT S FIRST CHOICE
FOR ADVANCED APPLICATIONS
58
COMPANY
Essential materials for the production
of our products
Efficient production can be seen from material usage. Overall,
we recorded an increase in the purchasing volume of copper,
laminates and chemicals in the financial year 2019/20, while
that of gold and palladium was down on the previous year. The
purchasing volumes of gold and palladium decreased above all
at the production site in Shanghai, by 7.1% and 10.4%, respec-
tively, the main reasons being lower production volumes and a
change in product mix. The increase in the volume of copper,
laminates and chemicals purchased is attributable to stocking
up the inventories during the COVID-19-pandemic. This ensured
that production could proceed smoothly.
Purchase of significant materials
Total Group
Unit 2019/20 2018/19 Change in %
Gold kg 508 547 (7.1)
Palladium kg 154 171 (10.4)
Copper t 4,066 3,764 8.0
Laminate million m² 13.8 12.8 8.0
Chemicals thousand t 147.1 138.0 6.6
Purchase of significant materials
attributable to parent company
Unit 2019/20 2018/19 Change in %
Gold kg 99 117 (15.2)
Palladium kg 0 0 n.a.
Copper t 396 367 7.9
Laminate million m² 1.3 1.3 (5.2)
Chemicals thousand t 9.5 9.4 1.2
Classification of chemicals purchased
in %
2019/20* 2018/19* Change in %
Explosive GHS01 – – n.a.
Flammable GHS02 0.22 0.21 3.2
Oxidising GHS03 2.83 2.88 (1.8)
Compressed gas GHS04 1.78 1.86 (4.2)
Corrosive GHS05 79.11 79.33 (0.3)
Toxic GHS06 0.61 0.66 (7.7)
Irritant GHS07 32.02 32.75 (2.2)
Health hazard GHS08 4.59 4.57 0.5
Environmental hazard GHS09 2.07 2.07 0.1
Non-hazardous – 12.18 11.28 8.0
* Since one chemical can be included in several hazardous substance categories, the total of all categories is greater than 100%.
FIRST CHOICE
FOR ADVANCED APPLICATIONS
ANNUAL REPORT 2019/20AT S
59
COMPANY
We permanently strive to reduce the environmental impact of
ATS’s business activities to a minimum and to continuously im-
prove our reporting in order to both offer our stakeholders more
transparency and to enable better control. Compliance with EU
Regulation 1907/2006, better known as the REACH Regulation,
for all our products is a matter of course for us. (REACH stands
for registration, evaluation, authorisation and restriction of
chemicals and has been in force since 2007.) The same applies
to the EU’s RoHS Directive, which governs the use of hazardous
substances in electrical and electronic equipment.
In the financial year 2019/20, we are reporting the GHS classifi-
cation for purchased chemicals for the first time. GHS stands for
Globally Harmonised System and refers to a standardised classi-
fication and labelling of hazardous substances. This globally har-
monised classification defines the danger of chemical products
and comprises health and safety advice in handling them.
The additional reporting of the GHS classification shows that the
total quantity of purchased chemicals increased by 6.6% year-on-
year, but the share of non-hazardous chemicals was 8% higher than
in the previous year, while toxic chemicals were reduced by 7.7%.
Sustainable Innovation
Industrialising leading-edge technologies is our mission. Only with
a strong team that stands for our innovative strength will this be
possible. This is why our research and development departments
and our engineering teams account for 11.4% of our total staff.
In the course of defining the strategic fields of action and as-
sessing the impact of ATS’s operations on non-financial issues
and the UN Sustainable Development Goals (SDGs), there were
substantial overlaps with the area of Environment  Resources.
This is due to the fact that many projects and programmes to
achieve our climate and energy goals, waste reduction, resource
efficiency or material recycling require innovative approaches
in addition to efficiency and effectiveness. Nonetheless it is im-
portant to us to focus on the topic of innovation as a separate
strategic field of action – not only because innovation is highly
relevant according to our materiality matrix from a company
perspective and from the perspective of our stakeholders, but
also because it is indispensable to embed sustainability in the
innovation strategy and all research and development process-
es. In addition, SDG 17 plays an important part in innovation be-
cause especially in the area of research and development strong
partnerships and joint development projects with customers as
well as research institutions and suppliers are essential for suc-
cessful project execution and the industrialisation of new ideas.
SDGs The contribution of ATS
in the area of Sustainable Innovation
Our research and development departments and our engineer­
ing teams make a significant contribution to the decoupling of
economic growth from environmental impact through global
efficiency measures, higher productivity, technological develop-
ment and innovation. One major contribution comes from the
planned life cycle assessment project.
Our research and development departments and our engineer­
ing teams make a significant contribution to the decoupling of
economic growth from environmental impact through global
efficiency measures, higher productivity, technological develop-
ment and innovation.
Certain approaches to waste prevention and recycling require
innovative solutions.
Innovative solutions can also play an important role in the
course of developing a water strategy.
The ATS energy strategy and the climate protection measures
derived from it are central aspects of the sustainability strategy.
New, innovative solutions can leverage the achievement of the
climate and energy target.
Global partnerships with universities, NGOs and agencies, as
well as an active exchange of expert knowledge and know-how
are integral parts of expanding sustainable development.
ANNUAL REPORT 2019/20AT S FIRST CHOICE
FOR ADVANCED APPLICATIONS
60
COMPANY
SUSTAINABILITY IS ALREADY FIRMLY
EMBEDDED IN THE RD PROCESSES
In order to do business responsibly in the interests of future
generations, it is necessary to consider sustainability aspects in
the innovation strategy and in the processes. The ATS innova-
tion process ensures that only leading-edge technologies reach
the industrialisation phase. When evaluating projects, non-­
financial criteria are assessed along with market and strategy.
For example, process efficiency, energy and resource consump-
tion as well as positive effects on health and safety at work have
the same weighting in the assessment.
The innovation revenue rate (IRR) is an indicator of our innova-
tive strength. It reflects the proportion of total revenue that ATS
generates with product groups that have been on the market for
less than three years. In order to further expand our technology
leadership, ATS has defined the clear goal of achieving an an-
nual IRR of at least 20%. In the financial year 2019/20, this target
was once again exceeded by far with an IRR of 30.8%.
The costs of research and development projects total € 94.8
million in the financial year 2019/20. This corresponds to a re-
search rate of 9.5%.
Innovation revenue rate
Research rate (relative to revenue)
The number of patents granted amounts to 326 at the end of the
financial year 2019/20, while we recorded 61 new applications.
The section “Research and Development” of the Management Re-
port provides further details on due diligence processes, innova-
tionrevenuerateandpatentsincludingyear-on-yearcomparisons.
OUR INNOVATION AWARD
BOOSTS INNOVATIVE STRENGTH
AND SUSTAINABILITY
To continuously drive effectiveness and efficiency and to gene-
rate innovative ideas, products and technologies with minimal
development times and a rapid market launch, we give centre
stage to the best and brightest minds at ATS. We call on all
resourceful and motivated employees from all areas across the
globe to submit projects in the course of the annual Innovation
Awards. This not only promotes knowledge transfer, team spirit
and motivation, but also offers an opportunity across depart-
ments and locations to actively participate in the innovation
process. The Innovation Award has been presented since 2015.
The evaluation criteria for the Innovation Award are based on
the innovation process and also include economic, social and
ecological aspects. In the financial year 2019/20, 23  projects
were submitted for the Innovation Award: 19 technical projects
and 4 administrative projects. All of the 8 finalist projects scored
above average in the three clustered assessment criteria qual-
ity, environment, health, safety, values and people. Four even
scored higher than three in all three sustainability categories
and thus above average. This is, from our perspective, anoth-
Number of patents
FIRST CHOICE
FOR ADVANCED APPLICATIONS
ANNUAL REPORT 2019/20AT S
61
COMPANY
DIGITAL TRANSFORMATION IS GAINING
FURTHER MOMENTUM
The Digital Transformation Programme (DTP) continued to gain
momentum in the financial year 2019/20 with the support of
the Fraunhofer Institute Austria. After a detailed analysis of
the content, another field of action was added. The DTP con-
sequently comprises six fields of action now: management and
organisation development, employee development, Industry
4.0 technology, data use and automation of production and ad-
ministrative processes. Internal experts have been defined as
“Digital Leaders” for these fields of action; they are responsible
for and will drive the respective fields of action.
The number of projects submitted to the ATS Innovation
Award is also a good indicator of the topicality and importance
of digitalisation. Once again, we recorded an increase in sub-
missions which have digitalisation character in the financial year
2019/20. 39% of the projects submitted support digital trans­
formation, compared with 26% in the previous year.
DIGITALISATION AND DATA SECURITY ARE
NO CONTRADICTION
Data protection is gaining increasing importance in a digital
world. To protect our intangible assets and information of our
key stakeholder groups, we continue to consistently pursue
the path of ISO 27001 certification of our Information Security
Management System. After the successful certification of our
headquarters, the two plants in Austria and the branch offic-
es in Europe across all company processes, the locations out-
side Europe will now follow. This certification is driven by our
Information Security Organisation and brings clearly noticeable
improvements in our employees’ handling of confidential data.
er indication of the growing importance of environmental and
social responsibility, which permeates the entire organisation.
Moreover, a sustainability award was presented for the most
sustainable project in the financial year 2019/20. This under-
lines the importance of sustainability for ATS and contributes
to raising awareness among the workforce. An expert jury rates
the projects submitted and chooses the winners from the pro-
ject teams, many of which work together across locations.
One of the winning projects of the Innovation Award 2019/20 is
the “virtual printed circuit board”. The project successfully de-
veloped a virtual, simulation-based tool set which contributes
to accelerating product development and increasing the reliabil-
ity of our products, thus minimising risk. At the same time, any
simulation means a reduction in resources used and higher se-
curity for the end customer. This project would therefore also be
a candidate for the Sustainability Award, which, however, went
to a project team from Fehring this year. They developed an in-
expensive and efficient solution to prevent waste of resources
caused by the carryover of chemicals and valuable materials
such as gold in wet processes. In addition, the process was real-
ised maintaining maximum energy efficiency.
WE SET THE COURSE TOWARDS
LIFE CYCLE ASSESSMENT
During the financial year 2019/20 we started to increasingly ad-
dress the carbon footprint of our materials. This is shown by
our Scope 3 emissions, which are reported for the first time in
depth in the section Environment  Resources in the financial
year 2019/20.
A research and development project is planned for the financial
year 2020/21 in cooperation with external partners. The goal is a
realistic introduction of a life cycle assessment at the process, tech-
nology or even product group level.
ANNUAL REPORT 2019/20AT S FIRST CHOICE
FOR ADVANCED APPLICATIONS
62
COMPANY
Employees 
Society
The strategic field of activity Employees  Society covers all
measures related to our social responsibility. The material top-
ics anti-corruption, diversity, health and safety and knowledge
are allocated to this segment, and the focus here is on SDG 8,
SDG  4, SDG  6, SDG  10, SDG  16 and SDG  17. In this context,
SDG 8 must be viewed with a clear focus on respecting human
rights, our responsibility as an employer and, consequently, our
strict rejection of any form of child and forced labour. As pre-
viously stated, respect for human rights, as a material topic in-
cluding management approach, due diligence process and key
indicators, is allocated to the Sustainable Supply Chain and is
addressed in that chapter. Nevertheless, we must also underline
the importance of complying with social standards and respect-
ing human rights as a basis for SDG 8 and decent work when it
comes to our responsibility as an employer. All of this goes hand
in hand with SDG 16 and our zero-tolerance policy towards any
form of corruption. Details on our contributions to the relevant
SDGs are provided in the following table.
THE ATS CODE OF CONDUCT AS A
FOUNDATION FOR DECENT WORK
All our principles with respect to business ethics, working condi-
tions, health and safety as well as environmental topics directly
and indirectly related to people and society are governed by our
Code of Conduct. This code is based on the Responsible Business
Alliance (RBA) and is applicable to all activities of ATS around the
globe. These ethical principles and compliance with all laws form
the basis of our trustworthiness and credibility as well as for long-
term partnerships and sustainable success.
Any form of misconduct, whether it is abuse of human rights, sus-
pected corruption, inadequate working conditions or other viola-
tions of our Code Of Conduct on the part of ATS stakeholders,
canandshouldbereportedviatheATS“WeCare”whistleblowing
platform. Internal Audit is responsible for processing such reports
confidentially. In the financial year 2019/20 five reports were filed,
SDGs The contribution of ATS
in the area Employees  Society
ATS is committed to respecting human rights and does not
tolerate any form of child or forced labour. We also protect the
rights of our employees through adequate working condi­
tions, remuneration and working times, stable employment
relationships and the freedom of association. For ATS, decent
work also includes high health and safety standards for our
employees which we provide based on ISO 45001 and OHSAS
18001 certifications at all production sites. All of this is specified
in our globally valid Code of Conduct.
ATS is a responsible employer for roughly 10,000 employees,
providing appropriate technical and professional qualification
for all. It goes without saying that we do not tolerate any dis­
crimination with respect to the training offered. Moreover, we
continuously work on raising awareness of the importance of all
sustainability dimensions.
It goes without saying that ATS provides all employees
worldwide with drinking water and clean sanitary facilities. In
addition, we also support water supply projects in the neigh­
bourhood of our plant in Nanjangud, India.
ATS stands for economic inclusion, equal opportunities,
anti-discrimination regardless of gender, skin colour, ethnicity
and national origin, religion, age, sexual orientation, gender
identity, pregnancy, political affiliation, trade union affiliation,
marital status, type of personality, language skills, physical and
mental abilities, education level, socio-economic background,
former military affiliation, intercultural skills and perspective or
learning differences.
ATS commits to complying with the Austrian Code of Cor­
porate Governance, thus ensuring a high level of transparency.
Based on our Code of Conduct we reject any form of bribery or
corruption and do not tolerate any form of violence, abuse or
taking advantage of children. ATS has established a whistle-
blowing platform for all of these cases.
ATS maintains global partnerships with universities, NGOs and
agencies in order to expand sustainable development.
all of them anonymously. Four of these reports required detailed
investigations, but no further measures had to be initiated.
ATS defends the rights to freedom of opinion and association as
well as fair payment as a matter of principle, and, as a responsible
employer, ensures compliance with the statutory working times.
FIRST CHOICE
FOR ADVANCED APPLICATIONS
ANNUAL REPORT 2019/20AT S
63
COMPANY
At the end of the financial year 2019/20, ATS employed
10,511 people; 2.3% of them are contract workers. ATS strives
to continuously lower the share of contract workers as we aim to
be a stable and responsible employer. Compared with the previ-
ous year, we reduced the share of contract workers by another
42%.
The attrition rate was further decreased from 20.4% in the pre-
vious year to 15.3% – despite the fact that the attrition rate is
generally higher at the Chinese locations, which is typical of the
Chinese labour market. The attrition rate is an indicator of the
satisfaction and motivation of our employees. Therefore, we con-
duct standardised employee surveys at the Chinese sites every
year in order to keep the attrition rate to a minimum.
We remunerate our employees at market conditions and in ac-
cordance with the applicable laws, in Austria at least according
to the collective agreement. The ratio of personnel costs to rev-
enue was 25.2% in the financial year 2019/20, up 9.1% on the
previous year. Details are provided in the explanations regarding
the consolidated statement of profit or loss in the notes to the
consolidated financial statements. In addition, our Group-wide
bonus system governs performance-based remuneration, which
depends on the economic performance (EBIT; ROCE), innovative
strength (IRR) and the personal performance of employees.
ZERO TOLERANCE OF CORRUPTION
ATS pursues a zero tolerance policy towards any form of corrup-
tion. In order to meet the highest standards for our stakeholders
at any time, in both technical and business terms, the Group’s
Anti-corruption Guideline entered into force in 2016. This guide-
line sets the standards for appropriate business practices and
is valid for ATS executives, representatives and employees. To
raise awareness among everyone, the content of the guideline
is conveyed to all employees through various communication
channels. Following a risk-based approach, employees who have
to undergo special anti-corruption training due to their position
and activity are selected. 697 people received training during the
financial year 2019/20, and took a final test to ensure that the
content conveyed had been understood. This corresponds to an
increase of 58% over the previous year.
Our Capital Market Compliance Guideline aims to prevent the
abuse of compliance-relevant inside information in accordance
with the applicable laws and the ACCG. This guideline is applicable
to all ATS employees and corporate bodies including the Super­
visory Board. Capital market compliance training was converted
to the new Learning Management System in the past financial
year, which enables more comprehensive training including a final
test. Of 225 persons pertaining to an area of confidentiality, 85%
completed the training successfully in the financial year 2019/20.
The training rate reported in the previous year was 100%.
Headcount (at year-end)
number of people
2019/20 2018/19
Male Female Total Male Female Total
White collar 2,236 741 2,977 1,941 684 2,625
Category Blue collar 4,692 2,842 7,534 4,493 2,707 7,200
Europe  USA 927 653 1,580 912 667 1,579
Region Asia 6,001 2,930 8,931 5,522 2,724 8,246
Mobile Devices
 Substrates 4,542 2,759 7,301 4,069 2,543 6,612
Segment
Automotive,
Industrial, Medical 2,236 717 2,953 2,230 751 2,981
Others 150 107 257 135 97 232
Full-time 6,891 3,384 10,275 6,387 3,187 9,574
Type of employment* Part-time 29 173 202 39 184 223
Total Group 6,928 3,583 10,511 6,434 3,391 9,825
thereof attributable to
parent company 898 630 1,528 884 647 1,531
* Excl. inactive employees, e.g. parental or educational leave
ANNUAL REPORT 2019/20AT S FIRST CHOICE
FOR ADVANCED APPLICATIONS
64
COMPANY
DIVERSITY – OR THE VALUE OF
UNIQUENESS AND HOW WE PROMOTE IT
As a globally operating company, people of different ages, ­ethnic
or national origins, physical and psychological abilities, sexual
orientations, cultural and religious affiliations, political beliefs,
marital status and education levels constantly meet at ATS and
provide for a diverse mix. We consider this diversity an enrich-
ment for any team and organisation. It stimulates collaboration
through different perspectives and should be taken as an op-
portunity for development. Numerous studies have shown that
diversity has a positive impact on profitability and growth rates,
increasing innovative strength, creativity and problem-solving
skills. This leads to higher motivation among employees, caus-
ing attrition rates to decline and increasingly addressing talents.
Ambitious diversity goals
In its diversity strategy, ATS focuses on four areas: gender, cul-
ture  ethnicity, age  generations, and skills. On this basis, we
aim to position ourselves as a diverse and inclusive employer that
values the uniqueness of every single employee, promoting them
as best possible. This is supported by the ATS Code of Conduct,
which applies throughout the Group and rejects any form of dis-
crimination. This commitment to diversity is now also found on
our career page.
Our goal is to be an attractive employer for women, for people
of any age, for people of different cultural, national or ethni-
cal background as well as for people with disabilities. In a first
step, we set the quantitative goal of achieving a total share
of female employees of 45% by 2025. We aim to increase the
share of women with management responsibility to 30%. To
achieve this goal, we have taken a variety of measures, above
all in recruitment and personnel development, which will be
implemented starting in the financial year 2020/21.
At the end of the financial year 2019/20, the share of women
at ATS amounted to 34.1%, a slight decrease of 0.4 percent-
age points compared to the previous year. On the first man-
agement level, i.e., managers reporting directly to the Man-
agement Board of the ATS Group, the share of women more
than doubled from 5% in the previous year to 13.6%. ATS
employed people of 55 different nationalities at the end of
the financial year. The average length of service, at 6.4 years,
Diversity of employees (at year-end)
in %, parent company
2019/20 2018/19
White collar Blue collar White collar Blue collar
Female 34.6 46.7 34.9 47.5
Gender Male 65.4 53.3 65.1 52.5
30 years 20.5 26.9 20.0 29.3
30–50 years 54.2 42.6 59.3 44.0
Age group 50 years 25.3 30.5 20.8 26.7
Diversity of employees (at year-end)
in %, total Group
2019/20 2018/19
White collar Blue collar White collar Blue collar
Female 24.9 37.7 26.1 37.6
Gender Male 75.1 62.3 73.9 62.4
30 years 26.1 43.7 25.0 48.1
30–50 years 64.9 51.7 67.0 47.8
Age group 50 years 9.0 4.6 8.0 4.1
FIRST CHOICE
FOR ADVANCED APPLICATIONS
ANNUAL REPORT 2019/20AT S
65
COMPANY
hardly changed in comparison with the previous year, while
the average age within the Group increased again slightly to
33.6 years. In the previous year, average company affiliation
was also 6.4 years while the average age was 32.7 years. This
year the age spread between the youngest and the oldest em-
ployees is 56 years. As of 31 March 2020 we employed 49 peo-
ple with a disability worldwide, 80% of them at the Austrian
locations. In the previous year we employed 48 persons with a
disability, 81% of them in Austria.
The good news:
many measures have already been implemented
Diversity and social sustainability require interacting with all peo-
ple as equals, regardless of gender, origin, religion, physical or
mental disability. ATS strives to overcome barriers of any kind.
However, barriers go beyond physical constraints and restricted
mobility, and often begin with language, for example. Like lan-
guage, different cultural characteristics can also represent a bar-
rier between people. Therefore it is in ATS’s interest to launch
initiatives which counter such barriers. Consequently, we offer
intercultural training and language courses aiming to convey dif-
ferent values, cultures and behaviour patterns of different coun-
tries to our employees. We currently offer language courses in
German, English and Mandarin.
As an inclusive, diverse employer, ATS is open to gender equal-
ity. For example, we reacted to a ruling of the Austrian Constitu-
tional Court of 15 June 2018, which grants intersexual persons a
right to an adequate designation in the register of persons and
is based on Article 8 of the European Human Rights Convention.
Consequently, ATS advertises job vacancies in Europe in such a
way that we address all genders using m/f/d. As mentioned be-
fore, the career page on our website includes a clear statement in
accordance with our Code of Conduct and the Responsible Busi-
ness Alliance (RBA) expressing that we value and promote diversi-
ty in all areas of the company.
The coordination of different areas of life such as work, spare time
and family poses a challenge for many people. As a responsible
employer, ATS strives to support the compatibility of job and
family. This increases motivation while reducing attrition. ATS
therefore offers more than 100 different working time models. A
child care facility was set up at the production site in India. But
employees also face plenty of requirements and challenges in
their everyday work. To enable them to overcome stress situations
successfully and react competently in tense situations, ATS offers
courses and seminars on dealing with challenging situations.
Equality does not stop at our governing bodies
Equality, non-discrimination and the promotion of women are
core topics of diversity and fundamental framework conditions
for a future-oriented employer, which also comprises the gov-
erning bodies of ATS such as the Supervisory Board and the
Management Board.
Therefore, we pursue the following targets when filling Super-
visory Board mandates: At least 30% women and 30% men
should be represented. The age spread of the Supervisory
Board members should exceed 25 years and experience in in-
ternational companies is mandatory. The expertise of the mem-
bers should comprise at least technology/research, electronics/
semiconductor industry, law, company and human resource
management as well as sustainable management. With these
targets, ATS meets the requirement of Section 7 para. 86 of
the Austrian Stock Corporation Act (AktG). The share of women
in the Supervisory Board was raised from 16.7% to 25% with the
election of Gertrude Tumpel-Gugerell. As in the previous year,
one of the three Management Board positions is held by a wom-
an. Regardless of job advertisement and position, vacancies are
filled on the basis of best qualifications; all qualifications being
equal, preference will be given to the underrepresented gender
in the specific case. For further information regarding age and
gender of the governing bodies, please refer to the Corporate
Governance Report.
ANNUAL REPORT 2019/20AT S FIRST CHOICE
FOR ADVANCED APPLICATIONS
66
COMPANY
3,58310,511
Employees total_
Absolute
Number of female employees_
Absolute
69.0
14.5
13.3
Proportionally represented in the following countries
China
Austria
India
South Korea 2.4
0.8Other
in %
Proportionally represented in
Supervisory Board
Management Board
Total staff
First management level
25
33.3
34.1
13.6
20.7Management positions
in %
As of 31 March 2020
55
Number of nationalities_
Absolute
34
Average age_
of all employees in years
Average age_
by country in years
32
India
37
South Korea
32
China
41
Austria
FIRST CHOICE
FOR ADVANCED APPLICATIONS
ANNUAL REPORT 2019/20AT S
67
COMPANY
TECHNOLOGY LEADERSHIP IS
ONLY POSSIBLE WITH KNOWLEDGE AND
EXCELLENTLY TRAINED EMPLOYEES
As a result of the company’s continuous development and strategic
orientation, the complexity of activities and the demands placed
onouremployeesalsoincrease.Tothisend,weofferextensivepro-
fessional, technical and personal development opportunities. We
consider learning a lifelong process, which ATS supports based on
target group and competence-oriented training and development.
ATS’s open communication and feedback culture promotes
­dialogue with employees. The annual appraisal and development
interviews are a key instrument in personnel development facil-
itating both individual development planning and the support
of the communication and feedback culture. Our corporate val-
ues – open-mindedness, commitment and responsibility – serve
as a platform for reflection in these interviews. They represent
an important contribution to the promotion of individuals and
personal development within the company. Appraisal interviews
were conducted with 97% of the salaried employees in the finan-
cial year 2019/20. The completion rate of the development inter-
views, which take place in autumn, was 89%. The fulfilment rates
were therefore at a similarly high level as in the previous year. The
development needs determined have a direct influence on the
preparation of the training offered.
The training offer is extensive, multi-faceted and tailored to the
needs of the respective sites. In addition to numerous in-house
training sessions held by our experts and workplace training, we
also invested € 1.86 million in external training and development
measures. These costs fall under the expense type “Other” in the
consolidated statement of profit or loss in the notes to the con-
solidated financial statements.
In addition to local training requirements, there is also a growing
need for global training for employees, parts of which are man-
datory. In order to ensure this, ATS uses a learning management
system, which allows allocating content, recording progress and
generating reports along with other advantages. In Europe, the
entire and very comprehensive training catalogues can now be
accessed via the Learning Management System, and training can
be directly booked there. For global training, ATS uses different
forms of e-learning to keep up with the times in this area, too.
Along with employee development, ATS also focuses on pro-
moting young professionals in different areas including appren-
tice training in chemistry, physics, IT, mechatronics with a focus
on manufacturing or automation technology, process technology,
industrial business management and office administration. At the
end of the financial year 2019/20, ATS employed 41 apprentic-
es, 40 in Austria and one in Germany. 6 apprentices successful-
ly completed their apprentice training in the past financial year,
while the final exam for another 5 apprentices had to be post-
poned to the financial year 2020/21 as a result of the measures
taken by the Austrian Federal Government due to the COVID-19
pandemic. 13 new apprentices started their training.
Motivated people who already have professional experience or
have completed science and technology studies at university have
the opportunity at ATS to gain international experience. As part
of our International Trainee Program we continuously look for
international talents for sales or technical positions. The trainee
programme comprises 12-month vocational training in Austria
followed by a 3-year international assignment to one of the ATS
production sites in China or India or one of our sales locations.
Expenditures on external training
in thousand €
2019/20 2018/19 Change in %
Mobile Devices  Substrates segment 997 639 56.1
Automotive, Industrial, Medical segment 393 408 (3.7)
Others 471 364 29.7
Total Group 1,861 1,410 32.0
thereof attributable to parent company 821 724 13.3
ANNUAL REPORT 2019/20AT S FIRST CHOICE
FOR ADVANCED APPLICATIONS
68
COMPANY
THE HEALTH AND SAFETY OF OUR
EMPLOYEES IS OUR FIRST PRIORITY
Only employees who are in good health and feel good at their
workplace can do their job productively and to the best of their
abilities. Satisfaction and well-being help employees to opti-
mally unfold their capabilities, thus creating added value for
the company. ATS strives to promote employees’ health and
to prevent potential risks and hazards. In addition to preventive
measures based on targeted training, ATS meets the require-
ments of the RBA with respect to occupational health and safe-
ty. High safety standards which are certified in accordance with
ISO 45001 or OHSAS 18001 apply at all sites. Management sys-
tems and due diligence processes such as continuous workplace
inspections and evaluations are part of these certifications. If
necessary, regulation measures are initiated.
As a result of the COVID-19 pandemic, the last quarter of the
financial year 2019/20 was particularly challenging for our EHS
teams, which did an outstanding job. All efforts were directed at
maintaining operations at our locations or to restart as soon as
possible, thus being a safe employer for roughly 10,000 employ-
ees. Top priority was always attached to our employees’ safety.
Therefore, all employees whose presence is indispensable at
the site were equipped with protective masks and strict safety
measures were taken.
Our two Chinese locations in Shanghai and Chongqing were ini­
tially affected. ATS was one of the first companies allowed to
reopen its plants after the lockdown imposed by the govern-
ment. This was based on the fact that, according to the existing
provisions of the emergency plan and crisis management, a task
force was set up immediately. The main task of these teams in-
cluded the monitoring and evaluation of information, analysis of
guidelines, inventory and supply chain management, commu-
nication with customers and safety in production. Professional-
ism, team spirit, strict safety precautions and meeting all official
requirements enabled us to resume production quickly. Man-
datory protective masks, temperature measurements before
entering the company premises, strict distancing rules at the
workplace as well as separation walls and special procedures
in the canteens are some of the measures taken to mitigate the
risk of infection.
Later, we benefited from our experience at the Chinese sites in
Europe and India. Where possible, employees at the European
sites can increasingly work from home to reduce personal con-
tact and minimize a potential transmission of the virus. ATS
provides the required equipment and technical support, which
initially also posed challenges for our IT departments. In addi-
tion, we also provided all employees of the Austrian locations
with protective masks for private use.
Occupational safety
Ratio of accidents
(with ≥1 lost working day per 1 million working hours)
Ratio of average monthly lost working days
(per 1,000 FTE)
2019/20 2018/19 Change 2019/20 2018/19 Change
Mobile Devices  Substrates segment 2.1 2.8 (0.6) 7.0 13.0 (6.0)
Automotive, Industrial,
Medical segment  Others 3.2 4.0 (0.7) 4.3 7.0 (2.7)
Total Group 2.5 3.1 (0.7) 6.2 11.2 (5.0)
attributable to parent company 4.6 6.2 (1.5) 6.0 11.1 (5.1)
FIRST CHOICE
FOR ADVANCED APPLICATIONS
ANNUAL REPORT 2019/20AT S
69
COMPANY
The site in India also focuses on maximum protection of the em-
ployees, which starts with a special seating order and halving
the number of passengers on the company busses. In addition
to specific seating rules at the canteen, mandatory face masks,
the provision of hand sanitiser and continuous cleaning of en-
trance areas, door knobs and working surfaces, an emergency
service was set up, which is on call round the clock for corona-
virus emergencies. If an employee were to be tested positive
for COVID-19, ATS would pay for all medical expenses for the
person affected and their family members.
Thanks to these and other measures taken by ATS the com-
pany already had positive media coverage, pointing out the ex-
emplary approach, extensive protective measures and the early
response of ATS to the challenges arising from the COVID-19
pandemic. The strong cohesion and great cooperation across
locations is underpinned by ATS’s internal communication
campaign ALL.TOGETHER.STRONG. The campaign supports the
cohesion across plants and gives the employees insights into
how the respective sites cope with production operations and
virtual collaboration.
However, the health and safety of our employees is also an im-
portant focus in normal operations. Personal protective equip-
ment from safety glasses to coats and safety shoes, noise meas-
urements, annual fire drills, training and safety instructions
especially with respect to dealing with dangerous substances,
and regular breaks are only a few examples of the high safe-
ty standards at all ATS locations. For employees who spend
a large part of their everyday work sitting, a healthy, intact
musculoskeletal system is important. Sitting for hours without
any physical activity may increase the risk of cardiovascular dis-
eases or osteoporosis. ATS promotes employees’ sports and
community activities including tennis tournaments, biking and
skiing trips or participation in various business runs. This helps
minimise physical and psychological stress and maintain good
health. In coordination with the plant management, the works
council offers health days at the Austrian sites. The offer rang-
es from various examinations such as lung function, eyesight,
hearing, or measuring blood sugar levels and blood pressure to
free-of-charge vaccinations such as TBE.
ATS India also supported the participation of 119 employees
in a running event, promoting team spirit and sports activities
among the staff. In addition, a wellness programme for female
employees, stress management training and health-support-
ing activities were held in the last financial year. Annual health
checks and financial support in case of hospitalisation are also
offered for employees at ATS’s plant in South Korea.
Occupational accidents declined from 3.1 to 2.5, while the aver-
age monthly days lost were nearly halved from 11.2 in the pre-
vious year to 6.2. At 0.9%, the rate of absences was also down
on the previous year. No fatal accident occurred throughout the
Group. This is a sign of a working occupational safety manage-
ment and a high awareness level among employees. However,
occupational accidents cannot be fully prevented. Even the
slightest inattention may have a major effect. We continuously
work on protecting our employees’ health and on preventing
work-related stress and occupational accidents as far as possi-
ble. All work safety indicators are location-related and include
contract workers. Occupational accidents do not include acci-
dents on the way to and from the workplace.
ANNUAL REPORT 2019/20AT S FIRST CHOICE
FOR ADVANCED APPLICATIONS
70
COMPANY
OUR COMMITMENT IS WELL WORTH IT –
AS PROVEN BY OUR NUMEROUS AWARDS
ATS’s excellence in its operating activities in general, and in the
highest quality, production, environmental and social standards
as well as best customer service in particular, is reflected by the
roughly 20 awards and prizes we received from different stake-
holder groups in the financial year 2019/20 alone. The National
Green Plant Certificate and Production Safety Excellence Award
for ATS plant in Shanghai, the Environment Protection Cred-
ible Enterprise Award for the plant in Chongqing, the Arogya
Seva Ratna Award for occupational health and safety, numer-
ous awards from our customers, the ALC award as the best Sty-
rian company in the category “International” and the Diversity
Award of the Boston Consulting Group, which we received only
recently, are only a few examples.
Social commitment connects us with the
communities of our locations
Apart from awards and prizes, some of which are attributable
to the social commitment and ecological awareness of ATS,
the company also engages in social projects as part of various
initiatives and institutions in the communities adjacent to our
production facilities. For example, employees of ATS Shanghai
visited a retirement home. Annual family celebrations for young
and old take place at both Chinese locations. Similar to the open
house day at the headquarters, guided tours of the plant as
well as a programme for children with game stations and fan-
tasy tours are offered under the motto “ATS Wonderland”. All
safety and data protections regulations are, of course, strictly
complied with at these events.
Since the Chongqing plant was established in 2011, the com­
pany has participated in a wide range of social activities and pro-
jects. In December 2019, employees of ATS Chongqing visited
an elementary school in the Tong Nan district, one of the poor-
est regions in the southwest of China. Our employees gave the
children winter jackets and school materials.
Commitment and dedication to a well-functioning community
also plays an important role at the ATS location in Nanjangud.
ATS therefore supports school and water supply projects every
year as well as medical care in the neighbouring villages. These
and many other activities dedicated to education, health, water
supply and hygiene have had a positive impact on the lives of
many people. During the last financial year, for example, a river
bank was developed for the people in the region, giving them
access to fresh water for cleaning and religious practices.
At the Austrian locations, ATS supports a variety of institu-
tions with monetary and in-kind donations, for example in the
areas of education, integration and healthcare. With the estab-
lishment of the ATS social fund, ATS also strengthens social
involvement and mutual support at the Austrian locations. The
fund is financed by employees and the company and is designed
to benefit employees who are suffering financial hardship
through no fault of their own. A committee specifically set up
for this purpose makes an anonymised decision about the type
and amount of support.
FIRST CHOICE
FOR ADVANCED APPLICATIONS
ANNUAL REPORT 2019/20AT S
71
COMPANY
Sustainable
Supply Chain
The economic, ecological and social responsibility of ATS goes
far beyond its own system boundaries and includes responsible
sourcing and functioning supply chain management. In general,
we see a greater risk within the supply chain, whether it is a risk
of compliance violations, human rights abuses, poor working con-
ditions or environmental offences. This is attributable to the fact
that all policies and measures within the ATS system boundaries
can be controlled directly, while the direct influence of ATS with-
in the supply chain decreases with the number of subcontractors.
Therefore, sustainable supply chain management has been de-
fined as a strategic field of action in the strategy process. The
material topic human rights has been assigned to this area.
When allocating the UN Sustainable Development Goals (SDGs),
we identified those SDGs as central which emphasise the impor-
tance of responsible entrepreneurship of our business partners.
We put great value on partnerships with suppliers who have an
equally clear position as ATS against human rights abuses, cor-
ruption and discrimination and comply with all applicable laws.
COMPLIANCE WITH OUR CODE OF
CONDUCT IS A KEY CONTROL ELEMENT
IN SUPPLY CHAIN MANAGEMENT
One of the most effective instruments to call on our suppliers to
comply with our standards is the ATS Supplier Code of Conduct.
It was prepared pursuant to the guidelines of the Responsible Busi-
ness Alliance (RBA) and is publicly accessible on the ATS website
along with the General Terms and Conditions of Purchase and the
Guidelines for the Regulation of Environmental Related Substances
inaccordancewiththeREACHRegulation.Thiscodeaimstoachieve
a balance between realising a profit and ethnic responsibility, and
provides a framework of action for our suppliers. It comprises busi-
ness ethics and management practices, occupational health and
safety, labour and human rights as well as environmental protec-
tion. 80% of the purchasing volume of ATS is distributed among
99 suppliers. At the end of the financial year 2019/20, 95% of them
had already signed our Supplier Code of Conduct. Our clear objec-
tive is to have the code signed by 100% of these suppliers, whom
we consider to be the most essential suppliers.
Proportion of Code of Conduct signed
SDGs The contribution of ATS
in the area Sustainable Supply Chain
We ensure compliance with ecological, ethical and social
standards in all our business relationships, communicate them
clearly in our Supplier Code of Conduct and examine compli­
ance in supplier audits.
Based on the ATS Supplier Code of Conduct, we promote
sustainable sourcing practices, transparent sustainability man­
agement and maximum resource efficiency, and demand these
from our suppliers.
In our Supplier Code of Conduct we require our business part-
ners to have an equally clear positioning regarding economic
inclusion, equal opportunities and anti-discrimination.
Based on the Supplier Code of Conduct and audits, we require
responsible management, a clear rejection of any form of
bribery, corruption or any form of violence, abuse or taking
advantage of children from our business partners.
ATS relies on globally effective partnerships with suppliers to
achieve the sustainability goals.
ANNUAL REPORT 2019/20AT S FIRST CHOICE
FOR ADVANCED APPLICATIONS
72
COMPANY
OUR SUPPLIER AUDITS ENHANCE
PARTNERSHIPS AND OFFER A
DEVELOPMENT OPPORTUNITY
To further reduce procurement-specific risks, new suppliers are
audited with respect to quality, supply chain management, eco-
logical and social responsibility as well as business ethics and
human rights. In the financial year 2019/20, an audit plan was
developed based on an established, risk-based approach, and
55 audits were conducted accordingly. 34 of these audits com-
prised business ethics and respect for human rights alongside
general social and ecological topics. A total of 13 slight deviations
were registered in the areas of business ethics, working condi-
tions and human rights in these 34 audits, of which four were
related to working conditions an one to human rights. Together
with the suppliers concerned we work on eliminating these devi-
ations. In the previous year, 69 supplier audits were conducted,
of which 58 comprised business ethics, working conditions and
respect for human rights.
Number of supplier audits
HOW WE ENSURE RESPECT FOR
HUMAN RIGHTS UP TO THE SOURCING
OF MINERALS
The extraction of valuable minerals is an intensive process involv-
ing a great number of social and ecological risks. The sourcing of
and trade in minerals in particular can have considerable negative
effects, including severe human rights violations, money laun-
dering and conflicts. With our commitment to the Responsible
Minerals Initiative (RMI) we help mitigate the negative impact
of the production and processing of minerals within our supply
chain. The RMI acts in line with the United Nations and the OECD
Guidelines for multinational enterprises, to which ATS is also
fully committed. ATS thus also meets the requirements of EU
Regulation 2017/821 and those of the Dodd Frank Acts Section
1502 of the US Congress. We comply with both the due diligence
process of the RMI and the other definition of so-called conflict
minerals, of which gold, tin and cobalt are used at ATS.
ATS contacts all gold, tin and cobalt suppliers at regular inter-
vals, at least once a year and as necessary in case of suspicion.
We demand transparent reporting using the CMRT (Conflict
Minerals Reporting Template) of the RMI for the entire sup-
ply chain. RMI continuously publishes and updates the list of
smelting plants and mines conforming to the rules, which have
been audited. ATS exclusively accepts an RMI-compliant sup-
ply chain. We are proud that we were able to report a 100%
RMI-compliant supply chain last year, with a 100% response rate
on the part of our suppliers.
RMI compliance of our supply chain
These requirements are also included in the Supplier Code of
Conduct. It can be downloaded from the ATS website along with
the CMRT of the ATS Group.
FIRST CHOICE
FOR ADVANCED APPLICATIONS
ANNUAL REPORT 2019/20AT S
73
COMPANY
GRI content index
GRI standard (2016) Disclosure Page in the report, URL or reason for omission
Organisational profile
102-1 Name of the organisation p. 192
102-2 Activities, brands, products, and services inside front cover
102-3 Location of headquarters inside front cover
102-4 Location of operations p. 100 f.
102-5 Ownership and legal form p. 77 and 192
102-6 Markets served inside front cover
102-7 Scale of the organisation inside front cover
102-8 Information on employees and other workers p. 63; disclosure on fixed-term employment contracts internationally
not consistently possible
102-9 Supply chain p. 45 f.
102-10 Significant changes to the organisation and its supply chain none
102-11 Precautionary principle or approach p. 49 f. and 107 ff.
102-12 External initiatives p. 45
102-13 Membership of associations p. 45
Strategy
102-14 Statement from senior decision maker p. 44
102-15 Key impact, risks and opportunities p. 49 f. and 107 ff.
Ethics and integrity
102-16 Values, principles, standards and norms of behaviour p. 45, 47 and 62
102-17 Mechanisms for advice and concerns about ethics p. 62
Governance
102-18 Governance structure p. 44
Stakeholder engagement
102-40 List of stakeholder groups p. 48
102-41 Collective bargaining agreements p. 63
102-42 Identifying and selecting stakeholders p. 48
102-43 Approach to stakeholder engagement p. 48
102-44 Key topics and concerns raised p. 48
Reporting practice
102-45 Entities included in the consolidated financial statements p. 122
102-46 Defining report content and topic boundaries p. 48 ff.
102-47 List of material topics p. 50 f.
102-48 Restatement of information none
102-49 Changes in reporting p. 48
102-50 Reporting period 01/04/2019–31/03/2020
102-51 Date of most recent report 06/06/2019
102-52 Reporting cycle annual
102-53 Contact points for questions regarding the report Annual Report: Gerda Königstorfer
Non-financial Report: Nadja Noormofidi
102-54 Claims of reporting in accordance with GRI Standards p. 45
102-55 GRI content index p. 73 f.
102-56 External assurance p. 33
205 Anti-corruption
103-1;-2;-3 Management Approach p. 62 f.
205-2 Communication and training about anti-corruption policies and procedures p. 63
205-3 Confirmed incidents of corruption and actions taken p. 62
ANNUAL REPORT 2019/20AT S FIRST CHOICE
FOR ADVANCED APPLICATIONS
74
COMPANY
GRI standard (2016) Disclosure Page in the report, URL or reason for omission
301 Materials
103-1;-2;-3 Management Approach p. 58 f.
301-1 Materials used by weight or volume p. 58 f.; distinction renewable/non-renewable not available
302 Energy
103-1;-2;-3 Management Approach p. 52 ff.
302-1 Energy consumption within the organization p. 54; distinction renewable/non-renewable and consumption types
not available
302-3 Energy intensity p. 54 f.
302-4 Reduction of energy consumption p. 53; for further information see CDP Climate Change Report
(www.cdp.net)
303 Water
103-1;-2;-3 Management Approach p. 56 f.
303-1 Water withdrawal by source see CDP Water Security Report (www.cdp.net)
305 Emissions
103-1;-2;-3 Management Approach p. 52 ff.
305-1 Direct (Scope 1) GHG emissions p. 53 ff.
305-2 Energy indirect (Scope 2) GHG emissions p. 53 ff.
305-3 Other indirect (Scope 3) GHG emissions p. 53 ff.
305-4 GHG emissions intensity p. 55 f.
305-5 Reduction of GHG emissions p. 53; for further information see CDP Climate Change Report
(www.cdp.net)
306 Effluents and waste
103-1;-2;-3 Management Approach p. 56 f.
306-1 Water discharge by quality and destination see CDP Water Security Report (www.cdp.net)
306-2 Waste by type and disposal method p. 57; distinction by disposal method not available
403 Occupational Health and Safety
103-1;-2;-3 Management Approach p. 68 ff.
403-2 Types of injury and rates of injury, occupational diseases, lost days,
and absenteeism, and number of work-related fatalities
p. 68 f.; split by region, gender, permanent/temporary staff,
­occupational diseases and types of injury not available
404 Training and Education
103-1;-2;-3 Management Approach p. 67 f.
404-2 Programmes for upgrading employee skills and transition assistance
­programmes
p. 67 f.
404-3 Percentage of employees receiving regular performance and career
­development reviews
p. 67 f.
405 Diversity and Equal Opportunity
103-1;-2;-3 Management Approach p. 64 ff. and 36 ff.
405-1 Diversity of governance bodies and employees p. 64 ff. and 36 ff.
406 Non-discrimination
103-1;-2;-3 Management Approach p. 62
406-1 Incidents of discrimination and corrective actions taken p. 62
414 Supplier Social Assessment
103-1;-2;-3 Management Approach p. 71 f.
414-2 Negative social impacts in the supply chain and actions taken p. 71 f.
FIRST CHOICE
FOR ADVANCED APPLICATIONS
ANNUAL REPORT 2019/20AT S
75
COMPANY
ATS ON THE CAPITAL MARKET
INTERNATIONAL STOCK MARKETS
CONFRONTED WITH DIFFICULT
ENVIRONMENT IN 2019/20
While topics such as the trade dispute between the USA and ­China,
the global economic slowdown and the developments around
­Brexit dominated the economy and capital markets in 2019, the
outbreak of the COVID-19 pandemic caused massive turmoil on the
stock exchanges in early 2020.
Againstthisbackground,theEuroSTOXX50showedavolatiledevel-
opment up until the late summer of 2019, but then also reached its
high for the reporting period in mid-February 2020. The Dow Jones
Industrial Average showed a similar pattern, also marking its high in
mid-February. However, as a result of the spread of the COVID-19
pandemic, both indices suffered massive losses and reached their
low in March. Although they subsequently recovered, both the Euro
STOXX 50 (-20.3%) and the Dow Jones Industrial Average (-15.5%)
showed a loss during the reporting period. The indices on the Vi-
enna Stock Exchange recorded a more negative development, with
substantial losses for both the Austrian lead index ATX (-34.0%) and
the more broadly based ATX Prime (-32.9%).
PERFORMANCE OF THE ATS SHARE
The ATS share started the new financial year at a price of € 15.9
in April 2019 and recorded significant gains until early May. How-
ever, in a stock market environment marked, among other things,
by trade conflicts and more cautious economic forecasts and driv-
en by subdued signals from ATS’s customer industries, the share
price dropped again in the late summer. Following that, a generally
friendlier stock market environment provided more momentum
as positive market assessments, for example for smartphones and
IC substrates, also had a positive effect. On 22 January 2020, the
Share price development
ATS compared to ATX and TecDAX
▪ATS
▪ATX
▪TecDAX
60
70
80
90
100
110
120
130
04/2019 05/2019 06/2019 07/2019 08/2019 09/2019 10/2019 11/2019 12/2019 01/2020 02/2020 03/2020
50
140
150
ANNUAL REPORT 2019/20AT S FIRST CHOICE
FOR ADVANCED APPLICATIONS
76
COMPANY
ATS share marked its high of the financial year at € 23.6. The out-
break of the COVID-19 pandemic and the measures imposed by
the authorities in China caused temporary disruptions of produc-
tion, leading to a downwards revision of the revenue and earnings
projections for the financial year 2019/20. Pressure on the share
consequently increased significantly and was further intensified by
growing uncertainty on the global stock markets. Accordingly, the
share recorded its annual low of € 9.2 on 16 March 2020. After a
phase of recovery, the ATS share closed at € 13.4 on 31 March
2020, recording a loss of 12.4% in the financial year 2019/20.
CONVEYING THE GROWTH STORY
In the past year, Investor Relations focused its capital market
communication activities on further boosting investors’ trust
in the company, the industry and the growth story “More than
ATS“. The latter was consistently advanced with the entry into
the module integration business and the initiated expansion of IC
substrate activities in Chongqing.
The company engaged in an intense exchange with existing and
potential investors through a variety of different formats. These
activities focused on the USA and Europe in the past year. At road
shows and investor conferences as well as in one-on-one conver-
sations the company also informed the capital market about the
business development, progress made in the implementation of
the strategy and the status of important operational projects.
When the COVID-19 pandemic broke out, ATS reacted promptly.
Changes were made to active interaction with investors and an-
alysts, using the broad spectrum of communication tools offered
by modern technology including conference calls, webcasts, vir-
tual roadshows and conferences as well as videos. The company
also ensured that all capital market participants received infor-
mation in a transparent, equal and proactive manner through its
communication activities.
ATS provides interested capital market participants with regu-
larly updated documents relevant to the capital market such as
annual and quarterly reports and presentations on its Investor
Relations page at www.ats.net/investors, for viewing and down-
load. Channels on Twitter, LinkedIn, Instagram and YouTube serve
as additional sources of information.
Key share figures
Unit 2019/20 2018/19
Closing price on 31 March € 13.4 15.3
High € 23.6 24.1
Low € 9.2 14.6
Market capitalisation
(end of reporting period)
€ in
millions
521.0 594.4
Average share turnover per day
€ in
thousands 1.569.7 2.313.2
Average number of shares traded
per day – 96,739 124,279
Dividend per share*
€ 0.25 0.60
Dividend yield (at the closing price) % 1.9 3.9
Earnings per share € 0.34 2.08
Book value per share € 19.6 20.7
Price-earnings ratio per share – 39.4 7.4
* 2019/20: proposal to the Annual General Meeting
ATS bond
Due on Coupon Issue size
Hybrid bond
ISIN: XS1721410725
24/11/2022 4.75% € 175 million
ATS share
Securities Identification No./ISIN 922230 / AT0000969985
Ticker symbols
Thomson Reuters: ATSV.VI
Bloomberg: ATS:AV
Stock listing Vienna
Indices ATX, ATX GP, WBI, VÖNIX
Number of ordinary shares 38,850,000
Analyses of the ATS share
Analyst recommendations*
Erste Group Buy
Raiffeisen Centrobank Hold
Berenberg Bank Hold
HSBC Buy
* As on date of publication
FIRST CHOICE
FOR ADVANCED APPLICATIONS
ANNUAL REPORT 2019/20AT S
77
COMPANY
Shareholder structure
in %
* Including direct and indirect holdings
Free Float
Dörflinger Private foundation*
Androsch Private foundation *
64.6
17.8
17.6
0.50
0.30
0.20
0.10
Dividend development
Dividend and dividend yield
▪Dividend per share (in €)
▪Dividend yield (rhs, in %)
0.70
0.60
4.5
4.0
3.5
3.0
2.5
2.0
1.5
1.0
0.5
0.0
0.40
0.00
2015/16 2016/17 2017/18 2018/19 2019/20*
* Proposal to the Annual General Meeting
CAPITAL MARKET TRANSACTIONS
In the financial year 2019/20, ATS did not carry out any capital
market transactions. Rather, the focus during the reporting peri-
od was on financing the capital requirements of the coming years
early in order to secure the favourable financing environment in
the long term. To this end, a credit line of an aggregate volume
of € 300 million as part of an OeKB equity financing programme
and a promissory note loan transaction totalling € 80 million were
successfully concluded.
All of these activities serve the general financing of the compa-
ny at very favourable terms and conditions and are long-term
components of the value-increasing mid-term strategy “More
than ATS”. With a clear focus on new interconnect solutions by
combining existing and new technologies, the aim is to generate
revenue of € 2 billion in the medium term.
Contact/Shareholder hotline:
▪  Gerda Königstorfer
Director Investor Relations
Phone: +43 3842 200-5925
Mail: g.koenigstorfer@ats.net
▪  Johannes Mattner
Manager Investor Relations
Phone: +43 3842 200-5450
Mail: j.mattner@ats.net
ATS financial calendar
29/06/2020 Record Date Annual General Meeting
09/07/2020 26th Annual General Meeting
28/07/2020 Ex-Dividend Day
29/07/2020 Record Date Dividend
30/07/2020 Dividend Payment Day
04/08/2020 Publication of the first quarter 2020/21
03/11/2020 Publication of the first half-year 2020/21
02/02/2021 Publication of the first three quarters 2020/21
18/05/2021 Publication Preliminary Annual Results 2020/21
GroupMAN
AGE
MENT
REPO
RT
80 _ Market and industry
­environment
87 _ Economic report
100 _ Other statutory information
104 _ Research and development
107 _ Opportunities and risks
115 _ Outlook
80
GROUP MANAGEMENT REPORTANNUAL REPORT 2019/20AT S FIRST CHOICE
FOR ADVANCED APPLICATIONS
ATS ANNUAL REPORT 2019 /20 GROUP MANAGEMENT REPORT FIRST CHOICE
FOR ADVANCED APPLICATIONS
2
1.1.General economic
environment
Economic slowdown followed by COVID-19 crisis
A downturn in line with the economic cycle and intensified by
factors such as the US-China trade conflict and Brexit was
already visible in 2019. The COVID-19 pandemic, which set in at
the beginning of 2020, and the associated crisis measures put a
brake on global economic activity and led to substantial
downgrades of the GDP projections for 2020. By the end of April
2020, the global GDP growth forecast for 2020 had already
declined from 2.9% to 0.4% in the most important economies
due to the impact of the crisis measures (OECD, March and April
20201
). Each additional month of restrictions should further
curb global GDP growth by another 2 percentage points in 2020
(OECD, April 20202
). Other forecasts already project globally
negative GDP growth of -2.8% in 2020 (Oxford Economics, April
20203
) up to -4.2% (IC Insights, April 20204
). These deviations
reflect the enormous volatility of the current situation. A
recovery of the global economy is currently expected for the
year 2021 (OECD, March 20205
).
1
OECD Economic Outlook, Interim Report March 2020, OECD Publishing, Paris,
https://doi.org/10.1787/7969896b-en.
“OECD updates G20 summit on outlook for global economy”, April 2020,
http://www.oecd.org/newsroom/oecd-updates-g20-summit-on-outlook-for-global-economy.htm
2
“OECD updates G20 summit on outlook for global economy”, April 2020,
http://www.oecd.org/newsroom/oecd-updates-g20-summit-on-outlook-for-global-economy.htm
1.2.Industry environment
Industry trends: short-term effects of COVID-19,
strong medium-term growth perspective for
artificial intelligence, 5G, automation, electrification
of mobility and module integration
A health crisis as caused by COVID-19 can have a significant
impact on the markets in the short term. The long-term trends
up to 2025 and beyond are primarily driven by overcoming long-
term social challenges and should remain largely unaffected
by COVID-19 based on current estimates (Prismark and Yole,
April 2020).
Digital technologies and electronics are increasingly gaining
importance for people’s lifestyle. Information and
communication media, for example, have to be available
anytime, anywhere; devices should be able to perform tasks to
support people as autonomously and efficiently as possible,
which requires a growing number of mobile electronic devices
equipped with sensors, artificial intelligence, high-speed data
transmission capabilities, etc. Moreover, mobility is supposed to
be safe without any limitations and eco-friendly at the same
time, and personal safety and health should be improved
continuously as the population keeps aging.
3
Oxford Economics World Economic Prospects (April 2020),
http://resources.oxfordeconomics.com/world-economic-prospects-executive-summary
4
IC Insights, McClean Report update, April 2020.
5
OECD Economic Outlook, Interim Report March 2020, OECD Publishing, Paris,
https://doi.org/10.1787/7969896b-en.
1. MARKET AND INDUSTRY
ENVIRONMENT
81
GROUP MANAGEMENT REPORT FIRST CHOICE
FOR ADVANCED APPLICATIONS
ANNUAL REPORT 2019/20AT SATS ANNUAL REPORT 2019/20 GROUP MANAGEMENT REPORT FIRST CHOICE
FOR ADVANCED APPLICATIONS
3
The smallest possible mobile devices such as smartphones,
smartwatches, wireless earphones and virtual reality glasses
support people in a wide variety of tasks. Thanks to mobile
diagnostics and therapy devices, it is also becoming easier to
monitor health better. In all of this, users expect an increasing
number of functions on ever-smaller space with longer battery
life to support such a mobile lifestyle. As mobile devices are
getting smaller, have more additional functions per device and
require more battery space for longer battery life,
“miniaturisation” of the electronics contained in the device is
becoming a necessity.
While the cycles of developing and launching products on the
market are getting shorter, quality requirements are increasing
at the same time. This challenge can be met by combining
predeveloped, multiple-use system parts with one or several
system functions in electronic modules (“modularisation”).
Examples of such modules include sensor modules, computing
or artificial intelligence (AI) modules, storage modules, and
radio frequency (RF) modules for wireless communication and
data transmission.
The trend of modularisation increasingly manifests itself not
only in consumer, computer and communication products such
as smartphones, smartwatches, smart speakers, notebooks,
etc. but also in all other areas of electronics including
automotive, industrial and medical applications.
Interconnect solutions consisting of printed circuit boards and
IC substrates using embedding as one of the key technologies
for the integration of modules with a growing number of
functions make a significant contribution to supporting the
trend of modularisation. They shorten electrical lines between
the components and save space.
Printed circuit boards and interconnect solutions for consumer,
communication and computer applications (“CCC”) are
additionally subject to the necessity to provide minimum trace
widths for high levels of integration in large production
volumes. Automotive, industrial and medical applications
(“AIM”) use high-end technologies with reduced trace widths
from CCC as a platform for further innovation. The focus is on
the introduction of new materials (e.g. high-frequency printed
US$ 546 BILLION
SMARTPHONE
US$ 2,831 BILLION
SMART AUTOMOTIVE
US$ 13 BILLION
HEALTHCARE
US$ 40 BILLION
AUGMENTED REALITY
VIRTUAL REALITY
US$ 180 BILLION
INDUSTRY 4.0
MARKET SIZE BY APPLICATION
2025
Source: Yole, ATS Analysis (April 2020)
US$ 17 BILLION
ARTIFICIAL INTELLIGENCE
MACHINE LEARNING
US$ 58 BILLION
5G BASE STATION
US$ 125 BILLION
DATA CENTRES
+
INCLUDING 70 %
5G SMARTPHONES
82
GROUP MANAGEMENT REPORTANNUAL REPORT 2019/20AT S FIRST CHOICE
FOR ADVANCED APPLICATIONS
ATS ANNUAL REPORT 2019/20 GROUP MANAGEMENT REPORT FIRST CHOICE
FOR ADVANCED APPLICATIONS
4
circuit boards for radar applications in the automotive sector),
process control within even tighter limits and further
technological improvements to meet very high quality
requirements.
The application trend towards smart autonomous devices
supporting a mobile lifestyle and the automation of production
requires omnipresent connectivity to exchange huge data
volumes (Internet of Things, machine-to-machine
communication) or artificial intelligence. Such systems must
have particularly high data processing and computing capability.
They also have to interact with the environment via sensors and
actuators. Such sensors and actuators comprise optical sensors,
position and environmental sensors, miniaturised light sources
and displays, miniaturised speakers, etc., which further increase
the data volume and, consequently, the computing and storage
requirements.
Significant improvements in connectivity are expected following
the introduction of the 5G telecommunication standard (data
rates of high gigabit/s with latencies (= reaction times) of
 1ms). This will allow de facto real time applications for mobile
devices, robotics and autonomous driving, to name only a few
examples.
Another important trend is the introduction of technologies to
prevent emissions, which drives the electrification of vehicles
for example. Along with autonomous driving, this is another key
application driver for more electronics in vehicles. More
efficient networks in vehicles (48V electrical system) as well as
electrical motors require the transmission and switching of
ever-increasing power, which requires measures to cool the
electronics and minimise switching losses.
Depending on the development stage of individual electronic
applications, the related markets will have a significant size by
2025. End customer application markets such as vehicles with
automated driving capabilities (“Smart Automotive”) and
smartphones offer great opportunities for electronic systems.
Other interesting opportunities arise in data centres, 5G base
stations and in industrial automation (Industry 4.0). New
applications such as AI (artificial intelligence) components,
sensors as a part of health electronics and AR/VR devices
(augmented reality/virtual reality) represent comparatively
smaller markets, however, with a particularly strong potential
for growth.
All of these applications can only be realised with highly
advanced interconnect solutions as an increasingly significant
part of the system as a whole. Modularisation is opening up
considerable growth potential for high-end printed circuit
board and IC substrate producers like ATS by proactively
entering into development partnerships with customers.
Electronics market: further growth through
digitalisation and new functions such as artificial
intelligence, 5G connectivity and automation
The solution of social tasks by means of electronic hardware and
software (“digitalisation”) is gaining increasing importance as
has been noticeable over the past decades. Electronics are used
in an ever-growing number of applications in order to make
them “smart”, thus also continuously driving growth of the total
electronics market. The total electronics market comprises all
manufactured electronic devices and electronic systems. Like
macroeconomic data, estimates regarding the total electronics
market as well as all other following market estimates are
subject to high volatility due to the COVID-19 pandemic. This
applies in particular to the year 2020. As a result of the COVID-
19 effects expected to date, the entire electronics market,
which totalled US$ 2,143 billion in 2019, should shrink by
slightly more than 10% in 2020 (Prismark, April 2020). The
strongest declines in the total electronics market are projected
for the industrial, automotive and consumer segments as
consumers and companies are likely to spend less on non-
essential goods (Prismark, April 2020). The computer and
communication segments will also be significantly affected by
the COVID-19 pandemic in 2020 according to current estimates.
Following an initial boost in demand due to an increased need
for home office equipment, PC and notebook applications are
set to record a considerable decline. Further significant growth
is expected for servers as another key application in the
computer segment due to growing data traffic. Within the
communication segment, the strongest decline is forecast for
smartphones, while wireless infrastructure is predicted to
continue to grow substantially in 2020. In terms of whole
segments, tangible growth is only projected for the medical
83
GROUP MANAGEMENT REPORT FIRST CHOICE
FOR ADVANCED APPLICATIONS
ANNUAL REPORT 2019/20AT SATS ANNUAL REPORT 2019/20 GROUP MANAGEMENT REPORT FIRST CHOICE
FOR ADVANCED APPLICATIONS
5
sector in 2020. This is in part attributable to stable demand
independent of COVID-19 and some one-off effects such as
increased demand for life-saving ventilators.
The long-term global market forecast for electronic systems up
to 2025 will not be influenced by COVID-19 according to current
estimates. Based on long-term trends and new functions such
as artificial intelligence, 5G connectivity, automation,
electrification of mobility and renewable energy production, we
can still expect mean annual growth in the electronic systems
market of 3.2% to US$ 2,587 billion in 2025 (Prismark, April
2020). The annual growth rates of the individual segments are
expected to range between 1.6% (computers) and 6%
(automotive). Due to the increase in electronic content per
vehicle for automated driving and electrification, individual
segments of automotive electronics such as automated driving
(camera, radar, etc.) should continue to grow strongly.
However, the recovery from the COVID-19 crisis may take
longer in the automotive segment than in other segments. In
industrial electronics, a massive growth surge is expected due
to automation including robotics, digitalisation of the
manufacturing environment and machine-to-machine (“M2M”)
communication.
The new 5G wireless standard is a massive growth driver for all
segments. 5G enables wireless communication in real time with
very high data rates, allowing not only videos to be played on
mobile devices and general mobile data transmission from the
Internet without any time delay but also all types of
communication between machines (“M2M” or “machine-to-
machine” communication) or vehicles (“Vehicle-to-X” or “V2X”
communication).
The enhancement of electronic systems with artificial
intelligence (AI) is another, at least equally important growth
driver for all sectors. In addition to software, this requires highly
advanced and high-quality processor and storage hardware.
Current examples include server, PC/notebook and smartphone
processor modules with AI accelerators. Camera modules for
smartphones and microphones with AI functionality to improve
detection signals are further examples. AI technology is also
applied in automated drive systems, manufacturing robots and
intelligent “home robots”. Home robots comprise a variety of
applications ranging from AI-enhanced smart speakers,
monitoring devices, robots for household activities, robots
assisting older people or toy robots. In these cases, AI is used
for the automated evaluation and interpretation of detection
signals or images, for automated data analysis or for intelligent
decision-making based on the data collected.
Printed circuit board and IC substrate market:
medium-term growth follows that of the electronics
market, further intensified through module
integration
Printed circuit boards (PCBs) are used to provide electric
connectivity for electronic components mounted on their
surface including passive electronic components, such as
Electronics market
by segment 2019
in %
COMMUNICATION
COMPUTER
AVIATION  SECURITY
MEDICAL
CONSUMER
AUTOMOTIVE
INDUSTRIAL
26
14 10
7
11
27
5
Market size 2019: US$ 2,143 billion
Source: Prismark, April 2020
+3.2%
CAGR 2019–2025:
Market growth
84
GROUP MANAGEMENT REPORTANNUAL REPORT 2019/20AT S FIRST CHOICE
FOR ADVANCED APPLICATIONS
ATS ANNUAL REPORT 2019/20 GROUP MANAGEMENT REPORT FIRST CHOICE
FOR ADVANCED APPLICATIONS
6
resistors and capacitors as well as packaged integrated circuits
(“ICs”), electronic modules and “systems in package“, which
contain at least two components and carry out at least one
system function such as detecting or actuating, data
transmission, processing, data storage or energy management.
Based on current estimates it can be assumed that the
economic slowdown caused by COVID-19 will lead to temporary
effects on the global printed circuit board market. The market
environment, which is currently subject to by high volatility,
does not allow a more accurate assessment in figures. However,
a substantial recovery in demand can be expected, driven by an
intensified trend towards digitalisation. These effects are
currently clearly visible in the global IC substrate market due to
the resulting significant increase in data volume; it therefore
can be assumed that demand will continue to be positive in this
market segment.
As stated previously, no effect is expected on the overall
medium and long-term growth of the printed circuit board
market, which is driven by the increasing functions of the
electronics systems.
Up to 2025, mean annual growth of 4.7% to just over US$ 76
billion is expected. As in the electronics systems market, this
growth up to 2025 and beyond will be driven by the long-term
trend towards digitalisation, and new functions such as artificial
intelligence, 5G, automation, electrification of mobility and
module integration to accelerate development and reduce
costs for electronic systems.
Depending on the segment, annual growth in the printed circuit
board markets is expected to range from 2.4% (Aviation 
Security) to 5.6% (Communication) between 2019 and 2025
(Prismark, April 2020).
Segment
AUTOMOTIVE
AVIATION SECURITY
INDUSTRIAL
MEDICAL
COMMUNICATION
COMPUTER
CONSUMER
SUBSTRATES
Market risks
Strong decline in vehicles sold
Particularly strong decline in the segment of
new civil aircraft
Significantly lower investment activity
No particular risks due to COVID-19
pandemic
Strong decline in mobile devices
Slump in PC and notebook sales after a short-
term boom due to home office equipment
Change in consumer behaviour due to
COVID-19 leads to purchasing restraint
Despite significant increase in substrate size
and number of layers lower need for substra-
tes for processor modules for PCs
and notebooks
Trend Market opportunities
Electronic content in vehicles increases (automated driving, electrification of powertrain)
Growth in selective applications such as camera, radar, etc.
Growth in satellite and security applications
Public sector investment incentives for applications such as
renewable energies
Stable market development and special demand for some
applications such as ventilators
Increased data transmission requirements (remote working, online services)
Public sector investment incentives and investments in
communication infrastructure
Growth in base stations, satellites, etc.
Increased data processing requirements in data centres
(remote working, online services) and need for additional servers
Continued growth in individual applications such as wireless earphones
Especially strong growth for IC substrates for processor modules for
infrastructure (5G base stations, servers for data centres)
Source: Prismark, April 2020; Substrates: Yole, May 2019; ATS Analysis
Development of the PCB and IC substrate market in 2020
85
GROUP MANAGEMENT REPORT FIRST CHOICE
FOR ADVANCED APPLICATIONS
ANNUAL REPORT 2019/20AT SATS ANNUAL REPORT 2019/20 GROUP MANAGEMENT REPORT FIRST CHOICE
FOR ADVANCED APPLICATIONS
7
Annual growth in the IC substrate market is still estimated at
approximately 10% up to 2025. This applies in particular to the
FCBGA market segment, in which ATS is active, where
processor modules are the main application (Yole, May 2019).
As previously mentioned, this subsegment is not expected to
see a strong negative influence from COVID-19 since demand in
this market segment is currently higher than the available
supply due to the introduction of AI and 5G. Technological
changes such as heterogeneous integration of processors and
memory or chiplets drive demand due to a higher number of
substrate layers and larger form factors. Due to new chip
generations, minimal pattern sizes are becoming ever smaller.
Moreover, the components and routing layers on IC substrates
are increasingly often directly connected with each other as the
next step of system integration (“fan out”, “embedding”).
The integration of system functions in “systems in package” or
electronic modules is a trend that goes beyond processor
modules. Such functions include sensors, actuators, energy
management and RF connectivity. This trend towards module
integration is attributable to the reduction in system costs,
MEDICAL
CONSUMER
SUBSTRATES
AUTOMOTIVE
AVIATION  SECURITY
INDUSTRIAL
COMMUNICATION
COMPUTER
1.3
6.8
2.7
2.6
17.2
14.5
8.0
4.8
58.0
9.3
10.0
16.9
23.8
3.2
3.1
8.9
1.5
76.6
+2.5%
+5.6%
+3.8%
+4.5%
+3.1%
+11.4%
+2.4%
+2.8%
+4.7%
Substrates and PCB market
US$ in billions
2019 2025
Source: Prismark, April 2020;
Substrates: Yole, May 2019
CAGR
86
GROUP MANAGEMENT REPORTANNUAL REPORT 2019/20AT S FIRST CHOICE
FOR ADVANCED APPLICATIONS
ATS ANNUAL REPORT 2019/20 GROUP MANAGEMENT REPORT FIRST CHOICE
FOR ADVANCED APPLICATIONS
8
miniaturisation and faster time to market of end user products
when tested and qualified electronic modules are used.
The market for module integration services (printed circuit
boards/substrates, module production and test) will show
annual growth rates of more than 10% and reach a similar size
as the printed circuit board market within a few years. The
technology options for module integration from the ATS
toolbox include HDI, mSAP, SAP, embedding and 2.5D. This
module market thus offers ATS an important opportunity for
further growth, but requires strengthening of manufacturing
and testing service capabilities. In the short term, growth is also
expected to slow down significantly in this market because of
the COVID-19 crisis, while submarkets such as the wireless
module and sensor module segments still offer growth
opportunities.
87
GROUP MANAGEMENT REPORT FIRST CHOICE
FOR ADVANCED APPLICATIONS
ANNUAL REPORT 2019/20AT SATS ANNUAL REPORT 2019 /20 GROUP MANAGEMENT REPORT FIRST CHOICE
FOR ADVANCED APPLICATIONS
9
2.1.Overall development of
the Group
ATS successfully manages challenging environment
In the financial year 2019/20 ATS held its ground well in a
challenging market environment, which was heavily influenced
by the trade dispute of the world’s two largest economies, the
USA and China, and the related decline in global growth, as well
as uncertainties regarding the United Kingdom’s withdrawal
from the European Union. In the last quarter, the COVID-19
pandemic and the related temporary closure of plants in China
and India led to additional negative effects. As a result, the
Group’s revenue, at € 1,000.6 million, did not reach the level of
€ 1,028.0 million generated in the previous financial year
(deviation € 27.4 million or -2.7%). Sales volume increases for IC
substrates and in the Medical  Healthcare segment had a
positive impact. The Automotive segment maintained the level
of the previous year despite challenging market conditions. The
weaker development was primarily attributable to the change in
product mix for mobile devices and to the continued decline in
demand in the Industrial segment. In addition, the Automotive
and Industrial were confronted with increased price pressure.
2.2.Earnings development in
the Group
Revenue nearly at the level of the previous year
Revenue decreased by -2.7% year-on-year and amounted to
€ 1,000.6 million.
As the US dollar was stronger during the past financial year,
foreign exchange effects had a positive influence of
€ 31.8 million or 3.1% on the development of revenue. 84.3% of
revenue (previous year: 81.5%) was invoiced in foreign
currencies (primarily US dollars).
During the year, revenue developed in line with the seasonal
cycle. In the second and third quarters, revenue was significantly
higher than in the first and fourth quarters.
The effects of recognising revenue over time, which is required
for a number of customers in accordance with IFRS 15, led to a
decrease in reported revenue of € 3.1 million or 0.3% (previous
year: increase of € 22.5 million or 2.3%). For further information
please refer to the notes to the consolidated financial statements.
The regional revenue structure based on customers’
headquarters shows a share of 68.3% for America compared
with 66.4% in the previous year. The share of products
manufactured in Asia rose slightly from 85.0% to 86.5%.
814.9
991.8 1,028.0 1,000.6
16.1
22.8 24.3
19.4
2016/17 2017/18 2018/19 2019/20
Revenue
EBITDA margin
Development of revenue and EBITDA margin
€ in millions/in %
16.5 141.1
77.9
26.5
54.8683.8
Austria
Germany
Other European countries
China
Other Asian countries
Americas
Revenue broken down by region, based on customers' headquarters
€ in millions
2. ECONOMIC REPORT
88
GROUP MANAGEMENT REPORTANNUAL REPORT 2019/20AT S FIRST CHOICE
FOR ADVANCED APPLICATIONS
ATS ANNUAL REPORT 2019/20 GROUP MANAGEMENT REPORT FIRST CHOICE
FOR ADVANCED APPLICATIONS
10
share of the Mobile Devices  Substrates (MS) segment in
external revenue rose to 68.5% (previous year: 66.5%), the
share of the Automotive, Industrial, Medical (AIM) segment
declined to 31.5% (previous year: 33.0%). Further information
on the development of the segments is provided in Section 2.3
“Earnings development in the segments”.
EBITDA declines to € 195 million , EBITDA margin 19.4%
EBITDA, at € 194.5 million, was clearly below the prior-year
value of € 250.1 million. The current earnings figures are
primarily attributable to the changed product mix in the Mobile
Devices segment and to the market environment, which was
subject to uncertainties and the associated decline in demand.
This resulted in temporary underutilisation of the production
capacities and a lower operating performance, which was
exacerbated in the fourth quarter in particular due to the impact
of the COVID-19 pandemic. Furthermore, substantial
investments in the future for the strategic expansion of business
led to higher expenses. The result was supported by positive
currency effects, which result predominantly from positive
measurement effects due to the stronger US dollar and the
translation of foreign subsidiaries to the reporting currency. The
overall positive impact of the exchange rate totalled
€ 32.1 million.
The EBITDA margin declined by -4.9 percentage points from
24.3% in the previous year to 19.4%.
68.5
31.5
MS
AIM
68.5
Revenue from external customers by segments
in %
130.9
226.0
250.1
194.5
2016/17 2017/18 2018/19 2019/20
Development of EBITDA
€ in millions
Result key data
€ in millions (unless otherwise stated)
2019/20 2018/19 Change in %
Revenue 1,000.6 1,028.0 (2.7%)
Operating result before interest, tax, depreciation and amortisation (EBITDA) 194.5 250.1 (22.2%)
EBITDA margin (%) 19.4% 24.3%
Operating result (EBIT) 47.4 117.2 (59.6%)
EBIT margin (%) 4.7% 11.4%
Profit for the year 21.5 89.0 (75.9%)
Earnings per share (€) 0.34 2.08 (83.7%)
Additions to fixed assets 254.3 108.8 100%
Average number of staff (incl. leased personnel) 10,239 9,811 4.4%
89
GROUP MANAGEMENT REPORT FIRST CHOICE
FOR ADVANCED APPLICATIONS
ANNUAL REPORT 2019/20AT SATS ANNUAL REPORT 2019/20 GROUP MANAGEMENT REPORT FIRST CHOICE
FOR ADVANCED APPLICATIONS
11
Increase in expense items
The above-mentioned effects also had an impact on the
individual cost areas. The increase in production costs of
€ 36.8 million to € 897.7 million results primarily from higher
maintenance costs, research and development costs, and
depreciation and amortisation. This development was
intensified by negative currency effects.
Administrative and distribution costs exceeded the prior-year
figures by € 1.1 million or 1.7%.
Other operating income declined from € 17.4 million to
€ 12.9 million. This was mainly due to a decrease in the
exchange rate result of € 2.8 million in the financial year
2019/20, which resulted primarily from the measurement of
receivables and liabilities denominated in the stronger US dollar.
Depreciation of property, plant and equipment and amortisa-
tion of intangible assets of € 146.2 million or 15.4% of non-
current assets (previous year: € 132.9 million or 15.9% of
noncurrent assets) reflect the high technical standard and the
intensity of investment of ATS. The increase of € 13.3 million
compared with the previous year was accounted for by
€ 8.1 million from the Mobile Devices  Substrates segment
(MS), and here predominantly by higher depreciation at the
plant in Chongqing. The share of the Automotive, Industrial,
Medical segment (AIM) rose by € 4.7 million.
The operating result (EBIT) dropped by € 69.8 million or -59.6%
to € 47.4 million (previous year: € 117.2 million) due to the
above-mentioned effects.
The EBIT margin declined by -6.7 percentage points to 4.7%
(previous year: 11.4%).
Finance costs – net
Finance costs – net fell from € -2.0 million to € -6.5 million.
Interest expense on bank borrowings and bonds amounted to
€ 11.4 million (previous year: € 12.2 million). Interest on social
capital remained at the prior-year level of € 1.1 million.
The measurement of hedging instruments resulted in a loss of
€ 1.5 million (previous year: loss of € 0.1 million). The hedging
instruments swap variable for fixed interest payments which do
not meet the criteria of hedge accounting since the term and
the amount do not match the primary secured financial
liabilities.
Capitalised interest on borrowings related to the acquisition of
qualified assets increased by € 0.2 million to € 0.4 million
(previous year: € 0.2 million).
Due to the higher volume of time deposits, an increase in the
return on financial investments of € 1.8 million to € 6.7 million
(previous year: € 4.9 million) was achieved although the
environment for investments is currently unfavourable.
Positive exchange rate differences of € 3.8 million were
recognised as income in finance costs – net in the financial year
2019/20 (previous year: income of € 9.2 million). The exchange
rate differences resulted predominantly from the measurement
of liquid foreign currency funds and debts.
6.6
90.3
117.2
47.4
2016/17 2017/18 2018/19 2019/20
Development of EBIT
€ in millions
90
GROUP MANAGEMENT REPORTANNUAL REPORT 2019/20AT S FIRST CHOICE
FOR ADVANCED APPLICATIONS
ATS ANNUAL REPORT 2019/20 GROUP MANAGEMENT REPORT FIRST CHOICE
FOR ADVANCED APPLICATIONS
12
Finance costs – net are influenced by currency effects because
investments and loans from credit institutions are in part
denominated in foreign currencies. The main intragroup loans
are long-term in nature and their repayment is neither
scheduled nor probable in the foreseeable future. These loans
are therefore recorded directly in equity through the statement
of comprehensive income.
Profit for the year declines
Profit for the year declined from € 89.0 million in the previous
year by € 67.6 million to € 21.5 million. The Group’s tax expense
amounts to € 19.5 million (previous year: € 26.2 million).
Current income taxes declined to € 12.0 million (previous year:
€ 13.6 million). Deferred tax expenses dropped to € 7.5 million
(previous year: € 12.5 million). The main reasons for the
reduction were reversals of deferred tax liabilities due to tax-
free distributions within China and lower depreciation and
amortisation at ATS China than in the previous year, which led
to lower deferred tax assets at the same time.
ATS China reported the favourable tax status as a “high-tech
company” in the calendar year 2019. This tax status commenced
on 1 January 2017, is valid for three years and is dependent on
achieving certain criteria each year.
Earnings per share decreased by € 1.74 from € 2.08 to € 0.34,
with the number of shares outstanding remaining unchanged. In
the calculation of earnings per share, interest on hybrid capital
of € 8.3 million (previous year: € 8.3 million) was deducted from
the profit for the year.
2.3.Earnings development in
the segments
Mobile Devices  Substrates segment
The Mobile Devices  Substrates segment generally continued
its positive development in the financial year 2019/20.
Dampening effects of a change in product mix for mobile devices
and a decline in global growth due to the trade dispute between
the USA and China as well as the impact of the COVID-19
pandemic were only in part offset by sales volume increases in
the area of IC substrates. Positive currency effects had an
improving effect on earnings.
The increasing performance level of mobile devices would not
be possible without HDI (high density interconnection) printed
circuit boards and mSAP (modified semi-additive process)
(0.59)
1.38
2.08
0.34
2016/17 2017/18 2018/19 2019/20
Earnings per share
in €
Mobile Devices  Substrates segment – overview
€ in millions (unless otherwise stated)
2019/20 2018/19 Change in %
Segment revenue 778.5 776.0 0.3%
Revenue from external customers 685.9 683.9 0.3%
Operating result before depreciation and amortisation (EBITDA) 158.6 193.5 (18.1%)
EBITDA margin (%) 20.4% 24.9%
Operating result (EBIT) 37.7 80.8 (53.3%)
EBIT margin (%) 4.8% 10.4%
Additions to fixed assets 216.0 69.6 100%
Average number of staff (incl. leased personnel) 7,260 6,860 5.8%
91
GROUP MANAGEMENT REPORT FIRST CHOICE
FOR ADVANCED APPLICATIONS
ANNUAL REPORT 2019/20AT SATS ANNUAL REPORT 2019/20 GROUP MANAGEMENT REPORT FIRST CHOICE
FOR ADVANCED APPLICATIONS
13
printed circuit boards. ATS is one of the world’s leading HDI
technology suppliers and has achieved a leading position in
mSAP technology.
With a revenue share of 68.5% (previous year: 66.5%), the
Mobile Devices  Substrates segment is still the largest segment
of the ATS Group.
Revenue, at € 778.5 million, was up € 2.5 million or 0.3% on the
prior-year figure of € 776.0 million. Revenue was influenced by
the positive exchange rate development of the US dollar,
meaning that overall revenue growth was € 30.4 million higher
as a result. In terms of geography, a further substantial increase
in revenue with American customers was recorded.
The segment’s EBITDA amounted to € 158.6 million, down
€ 35.0 million or -18.1% on the prior-year value of
€ 193.5 million. The decrease in EBITDA was primarily
attributable to a less favourable product mix, the economic
downturn and the related temporary underutilisation. The
EBITDA margin of the Mobile Devices  Substrates segment, at
20.4%, was 4.6 percentage points lower than in the previous
year (24.9%).
The segment’s depreciation and amortisation increased by
€ 8.1 million or 7.2% from € 112.7 million to € 120.9 million. The
increase was primarily attributable to higher depreciation and
amortisation at the Chongqing site.
The operating result (EBIT) declined by € 43.1 million to
€ 37.7 million (previous year: € 80.8 million). The EBIT margin
was down 5.6 percentage points to 4.8% (previous year: 10.4%)
due to the decrease in EBIT.
Additions to fixed assets rose by € 146.4 million or 210.3% to
€ 216.0 million (previous year: € 69.6 million). Apart from
additions of € 177.3 million for ongoing expansion, replacement
and technology upgrades at the Chongqing site, fixed assets at
the Shanghai plant increased by € 38.4 million.
Automotive, Industrial, Medical segment:
at a stable level
With a decline in revenue of € 14.8 million to € 350.4 million
(previous year: € 365.2 million) the level of the previous year
could not be fully maintained in the Automotive, Industrial,
Medical segment. Strong demand was recorded above all in the
Medical  Healthcare segment. The Automotive and Industrial
segments were confronted with a difficult environment, leading
573.0
738.9
776.0 778.5
12,0
24,2 24,9
20,4
2016/17 2017/18 2018/19 2019/20
Revenue
EBITDA margin
Mobile Devices  Substrates – Development of revenue, EBITDA margin
€ in millions/in %
Automotive, Industrial, Medical segment – overview
€ in millions (unless otherwise stated)
2019/20 2018/19 Change in %
Segment revenue 350.4 365.2 (4.0%)
Revenue from external customers 314.7 338.9 (7.1%)
Operating result before depreciation and amortisation (EBITDA) 28.9 52.6 (45.1%)
EBITDA margin (%) 8.2% 14.4%
Operating result (EBIT) 5.6 34.1 (83.4%)
EBIT margin (%) 1.6% 9.3%
Additions to fixed assets 33.2 36.1 (7.9%)
Average number of staff (incl. leased personnel) 2,764 2,771 (0.2%)
92
GROUP MANAGEMENT REPORTANNUAL REPORT 2019/20AT S FIRST CHOICE
FOR ADVANCED APPLICATIONS
ATS ANNUAL REPORT 2019/20 GROUP MANAGEMENT REPORT FIRST CHOICE
FOR ADVANCED APPLICATIONS
14
to higher price pressure in both segments and also to lower
demand in the Industrial segment.
Regarding the development of the Leoben, Fehring, Ansan and
Nanjangud sites, which are assigned to the Automotive,
Industrial, Medical segment, please refer to Section 3.1 “Plants
and branch offices” of the Management Report.
EBITDA declined by € 23.7 million or -45.1% to € 28.9 million
(previous year: € 52.6 million). This reduction results from
uncertainties in the automotive market and lower demand in
the industrial sector, and was exacerbated by the impact of the
COVID-19 pandemic in the fourth quarter, which led to
temporary underutilisation of the production capacities and a
lower operating performance.
The EBITDA margin decreased by 6.2 percentage points to 8.2%
(previous year: 14.4%).
The operating result (EBIT) fell by € 28.4 million or -83.4% to
€ 5.6 million (previous year: € 34.1 million).
The EBIT margin of the Automotive, Industrial, Medical segment,
at 1.6%, was below the prior-year value of 9.3% due to the
above-mentioned effects.
Additions to fixed assets declined by € 2.9 million to
€ 33.2 million (previous year: € 36.1 million). The additions were
related to ongoing expansion, replacement and technology
upgrade investments, in particular at the locations in Austria and
India.
Others segment
The result of the general holding activities included in the Others
segment was higher than in the previous year. The embedding
technology, which was presented in this segment in the previous
year, has now been split up between the Mobile Devices 
Substrates and Automotive, Industrial, Medical segments.
351.5 364.9 365.2 350.4
14,6 12,8 14,4
8,2
2016/17 2017/18 2018/19 2019/20
Revenue
EBITDA margin
Automotive, Industrial, Medical–Development revenue, EBITDA margin
€ in millions/in %
Others segment – overview
€ in millions (unless otherwise stated)
2019/20 2018/19 Change in %
Segment revenue – 5.3 n.a.
Revenue from external customers – 5.3 n.a.
Operating result before depreciation and amortisation (EBITDA) 7.1 4.0 78.6%
EBITDA margin (%) – 75.3%
Operating result (EBIT) 4.1 2.4 71.3%
EBIT margin (%) – 45.0%
Additions to fixed assets 5.1 3.1 64.6%
Average number of staff (incl. leased personnel) 214 181 18.4%
93
GROUP MANAGEMENT REPORT FIRST CHOICE
FOR ADVANCED APPLICATIONS
ANNUAL REPORT 2019/20AT S
ATS ANNUAL REPORT 2019/20 GROUP MANAGEMENT REPORT FIRST CHOICE
FOR ADVANCED APPLICATIONS
15
2.4.Assets and financial
position
2.4.1. ASSETS
Increase in non-current assets
Total assets increased by 3.9% to € 1,853.5 million in the
financial year 2019/20.
Non-current assets increased by € 97.7 million to
€ 996.0 million. While property, plant and equipment rose by
€ 125.8 million to € 903.5 million, intangible assets declined by
€ 15.0 million to € 45.1 million. In property, plant and
equipment, additions to assets and technology upgrades of
€ 247.9 million were offset by depreciation totalling
€ 125.9 million. Property, plant and equipment as reported in
the statement of financial position also includes right-of-use
assets of € 25.0 million as a result of the first-time adoption of
IFRS 16.
The net change in non-current assets amounted to
€ 110.7 million or 13.2% to € 948.6 million (previous year:
€ 837.9 million).
Current assets declined by € 28.3 million to € 857.5 million. Cash
and cash equivalents recorded a significant increase to
€ 418.0 million (previous year: € 326.8 million). Financial assets
were reduced by € 103.5 million to € 136.2 million. Overall,
ATS thus has cash and current financial assets totalling
€ 554.2 million (previous year: € 566.6 million). The increase in
inventories of € 23.9 million to € 108.4 million results primarily
from increasing raw material inventory levels in China as a
preparation measure for COVID-19. Trade receivables, other
receivables and contract assets decreased by € 36.6 million to
€ 192.4 million, which is primarily due to additional factoring
activities.
Trade payables rose by € 37.1 million or 28.1% from
€ 131.9 million to € 169.1 million, including an increase in
liabilities from investments of € 31.7 million to € 62.9 million
(previous year: € 31.2 million).
Significant increase in net gearing
Equity decreased by € 43.2 million or -5.4% from € 803.5 million
to € 760.3 million. The positive profit for the year increased
equity by € 21.5 million, while negative effects of € 30.3 million
are due to currency differences from the translation of net asset
positions of subsidiaries and from the translation of long-term
loans to subsidiaries.
Actuarial losses of € 1.1 million (previous year: loss of
€ 5.8 million) resulting from the parameters used for the
calculation of personnel expenses and the interest expense for
the hybrid bond of € 8.3 million also reduced equity.
The dividend led to a reduction in equity of € 23.3 million.
Net working capital
€ in millions (unless otherwise stated)
31 Mar 2020 31 Mar 2019 Change in %
Inventories 108.4 84.5 28.3%
Trade receivables and contract assets 134.5 180.4 (25.4%)
Trade payables (169.1) (131.9) (28.1%)
Liabilities from investments 62.9 31.2 100%
Working capital trade 136.7 164.1 (16.7%)
Other current assets, payables, provisions 7.7 (3.6) 100%
Net working capital 144.4 160.5 (10.0%)
Net working capital in % of total revenue 14.4% 15.6%
Days outstanding (in days):
Inventories 44 36 22.2%
Receivables 49 64 (23.4%)
Payables 66 66 –
94
GROUP MANAGEMENT REPORTANNUAL REPORT 2019/20AT S FIRST CHOICE
FOR ADVANCED APPLICATIONS
ATS ANNUAL REPORT 2019/20 GROUP MANAGEMENT REPORT FIRST CHOICE
FOR ADVANCED APPLICATIONS
16
Non-current financial liabilities rose by € 16.8 million or 2.5% to
€ 695.8 million. The initial application of IFRS 16 led to an
increase of € 21.6 million. Furthermore, another promissory
note loan was concluded in the past financial year. The cash
inflow resulting from the promissory note loan transaction was
in part used to optimise and repay financial liabilities carrying
higher interest rates. The remaining cash was invested for the
short term and is consequently recognised under cash and cash
equivalents or under financial assets.
Current financial liabilities increased from € 38.0 million to
€ 105.3 million.
Net debt rose by € 96.4 million or 64.2% to € 246.7 million
(previous year: € 150.3 million), which resulted primarily from
the increase in financial liabilities.
Net gearing rose to 32.5% thus exceeding the prior-year level of
18.7%.
2.4.2. FINANCING
The focus of the financial year 2019/20 was on financing the
capital requirements of the coming years early in order to
benefit from the currently favourable financing environment in
the long term. To this end, a credit line of an aggregate volume
of € 300 million as part of an OeKB equity financing programme
and a promissory note loan of an aggregate volume of
€ 80 million were concluded very successfully.
In addition to that, several smaller financing transactions were
carried out and the financing structure was optimised further.
70.5
29.4
18.7
32.5
2016/17 2017/18 2018/19 2019/20
Net gearing
in %
Net debt
€ in millions (unless otherwise stated)
31 Mar 2020 31 Mar 2019 Change in %
Financial liabilities, current 105.3 38.0 100%
Financial liabilities, non-current 695.8 679.1 2.5%
Gross debt 801.1 717.1 11.7%
Cash and cash equivalents (418.0) (326.8) (27.9%)
Financial assets (136.4) (239.9) 43.1%
Net debt 246.7 150.3 64.2%
Operating result before interest, tax, depreciation and amortisation (EBITDA) 194.5 250.1 (22.2%)
Net debt/EBITDA ratio 1.3 0.6
Equity 760.3 803.5 (5.4%)
Total consolidated statement of financial position 1,853.5 1,784.1 3.9%
Equity ratio (%) 41.0% 45.0%
Net gearing (net debt/equity) (%) 32.5% 18.7%
95
GROUP MANAGEMENT REPORT FIRST CHOICE
FOR ADVANCED APPLICATIONS
ANNUAL REPORT 2019/20AT SATS ANNUAL REPORT 2019/20 GROUP MANAGEMENT REPORT FIRST CHOICE
FOR ADVANCED APPLICATIONS
17
Financing is based on a four-pillar strategy
The financing of ATS is based on a four-pillar strategy, which
aims to minimise dependence on individual financing
instruments. Based on the prevailing financial market
conditions, individual areas can be expedited more strongly or,
as the case may be, not used at times.
The first pillar is based on long-term, fixed-interest-bearing retail
bonds. Their advantage lies in their high predictability and
security for the company as they carry fixed interest rates and
are non-redeemable. However, their higher placement and
financing costs are a disadvantage. No standard retail bond is
issued at present.
The importance of promissory note loans as a key financing pillar
did not change in the financial year 2019/20 The advantages of
promissory note loans are their high level of predictability and
their low placement costs. Due to these advantages, ATS
intends to also promote this form of financing in the future.
At 31 March 2020, promissory note loans totalling
€ 596.4 million (previous year: € 598.5 million) were placed with
several national and international investors. The remaining
terms range between 7 months and about 9 years.
Bank loans are used as the third pillar. As of 31 March 2020,
loans totalling € 179.8 million had been taken out with national
and international banks (previous year: € 118.5 million). They
predominantly carry fixed interest rates and have maturities
between 1 and 7 years.
The fourth pillar consists of credit lines, which serve to cover
liquidity fluctuations and as a financing reserve. At the reporting
date, ATS had unused credit lines of € 490.4 million (previous
year: € 187.3 million) in the form of contracted loan
commitments made by banks. At 31 March 2020, ATS had only
used 61.7% (previous year: 79.7%) of its contracted financing
potential and still possesses sufficient financial reserves in
addition to cash and cash equivalents.
One of the most important tasks of the ATS treasury function
is to ensure sufficient liquidity reserves. Treasury also monitors
the covenants defined in the credit agreements to ensure that
these covenants are met. ATS pursues the goal of
standardising credit agreements in order to treat all lenders
equally.
Low repayment period and high equity ratio
The theoretical repayment period for debts, defined as net
debt/EBITDA, of 1.3 years was significantly lower than the
maximum of 3.0 years defined by ATS. It increased in the past
financial year (previous year: 0.6 years).
2.9
0.9
0.6
1.3
2016/17 2017/18 2018/19 2019/20
Net debt/EBITDA
Instruments
€ in millions
31 Mar 2020 in % 31 Mar 2019 in %
Promissory note loans 596.4 47.1% 598.5 66.2%
Bank borrowings 179.8 14.2% 118.5 13.1%
Gross debt 776.2 61.3% 717.0 79.3%
Credit lines 490.4 38.7% 187.3 20.7%
Committed credit lines 1,266.5 100.0% 904.4 100.0%
96
GROUP MANAGEMENT REPORTANNUAL REPORT 2019/20AT S FIRST CHOICE
FOR ADVANCED APPLICATIONS
ATS ANNUAL REPORT 2019/20 GROUP MANAGEMENT REPORT FIRST CHOICE
FOR ADVANCED APPLICATIONS
18
The equity ratio decreased from 45.0% in the previous year to
41.0%; however, it still exceeded the target value of 40.0%. For
further information regarding capital risk management, please
refer to Note 19 “Additional disclosures on financial
instruments” – subsection Capital Risk Management – in the
notes to the consolidated financial statements.
ATS pursues a financing structure that is as balanced as
possible, with an average duration. At the reporting date, the
duration was 3.2 years and thus slightly less than in the previous
year (3.7 years).
The repayment structure shows a high amount in the year
2023/24 due to the repayment of parts of the promissory note
loan and bank loans of € 338.7 million. ATS strives to finance
capital requirements early and has liquidity reserves of
€ 1,044.8 million at 31 March 2020 (previous year:
€ 754.1 million), which consist of financial resources and unused
credit facilities.
Effective interest and currency management
Minimising interest rate risk by predominantly using fixed
interest rates was defined as another treasury objective. 68.0%
(previous year: 76.9%) of financing is conducted at or was
swapped to fixed interest rates and only 32.0% (previous year:
23.1%) is based on variable interest rates.
Strategies for hedging interest rates are defined quarterly based
on interest rate expectations and adapted as necessary.
Compared with the previous year, the share of fixed interest
rates declined slightly. Overall, ATS is well protected against a
possible turnaround or an increase in interest rates in the euro
area.
ATS also intends to invest available liquid funds profitably but
risk-sensitively. At 31 March 2020, ATS had financial resources
totalling € 554.2 million (previous year: € 566.6 million). The aim
is to achieve the highest possible yields in an environment that
is currently very challenging from an investor perspective and to
avoid negative interest by optimising the terms of investment
and early conversion of liquid funds into currencies with higher
interest rates and which are also continually required by ATS.
Early conversion into foreign currencies also serves as a natural
currency hedge and a reduction of the exposure to foreign
currencies. The objective of ATS is to keep the US dollar net
risk position at a minimum. At 31 March 2020, assets
denominated in US dollar (trade receivables, financial assets and
cash denominated in US dollar) amounting to € 243.1 million
(previous year: € 270.5 million) were offset by liabilities
denominated in US dollar (trade payables and financial liabilities
denominated in US dollar) amounting to € 58.3 million (previous
year: € 43.3 million). The resulting net risk position – at
31 March 2020 this was an active balance of € 184.8 million
(previous year: € 227.2 million) – thus amounted to 10.0%
(previous year: 12.7%) of the Group’s total assets and liabilities.
141.5
87.2
338.7
45.0
62.8
102.0
 24/2524/2523/2422/2321/2220/21
Redemption
€ in millions
Treasury key data
Covenant1) Target2) 31 Mar 2020 31 Mar 2019
Net debt/EBITDA ratio 4,0 3,0 1.3 0.6
Equity ratio 35 % 40 % 41.0% 45.0%
1)
Covenants are limits included in old credit agreements which the actual figures should not exceed (Net debt/EBITDA) or undercut (equity ratio).
2)
Target values are limits defined by ATS which the actual figures, under normal circumstances, should not exceed (Net debt/EBITDA) or undercut (equity ratio).
97
GROUP MANAGEMENT REPORT FIRST CHOICE
FOR ADVANCED APPLICATIONS
ANNUAL REPORT 2019/20AT SATS ANNUAL REPORT 2019/20 GROUP MANAGEMENT REPORT FIRST CHOICE
FOR ADVANCED APPLICATIONS
19
In addition to this natural hedging and the above-mentioned
instruments for interest rate hedging, ATS occasionally hedges
foreign currency transaction risks in the short term (up to one
year).
Currency translation risks resulting from the conversion of
subsidiaries with different local currencies are not hedged.
Securing the financing network
The final treasury objective consists of optimised relationship
management with financing partners. ATS considers this to be
the selection of banks for national and international cooperation
as well as setting up and maintaining the communication
necessary for both sides. The aim is to create a high level of
transparency regarding the opportunities and risks of ATS in
order to strengthen a long-term partnership with the financing
institutions which is successful for both sides. The annual and
quarterly reports serve as the basis for this.
In addition, meetings with our financing bank partners in which
the opportunities for cooperation are discussed take place at
least once a year.
2.4.3. CASH FLOW
Earnings situation boosts liquidity
Cash flow from operating activities before changes in working
capital dropped from € 206.0 million to € 165.4 million. This
decrease is primarily attributable to the decline in the operating
result from € 117.2 million to € 47.4 million. Interest payments
declined by € 1.6 million to € 12.0 million (previous year:
€ 13.6 million), primarily due to better terms and conditions in
the promissory note loans. The interest received reflects the
currently very difficult market environment for investments in
euros, but nevertheless increased by € 1.8 million to
€ 6.7 million (previous year: € 4.9 million) due to the higher
investment volume. In contrast, income taxes paid fell by
€ 15.3 million to € 13.5 million (previous year: € 28.8 million).
Cash flow from operating activities improved to € 185.1 million
(previous year: € 170.5 million). The increase in trade payables
and other liabilities of € 5.7 million and the increase in cash flow
from trade and other receivables and contract assets of
€ 38.2 million were offset by changes in inventories of
€ -25.5 million.
Capital expenditures for property, plant and equipment and for
intangible assets of € 218.6 million were substantially higher
than in the previous year (€ 100.9 million). The main outflows
resulted from expansion, replacement and technology upgrades
in Chongqing, Shanghai and Austria.
Free cash flow from operating activities, i.e. cash flow from
operating activities less net investments in property, plant and
equipment and for intangible assets amounted to € -33.4 million
in the financial year 2019/20 (previous year: € 69.7 million).
ATS thus managed to fund the high level of investment
activities independently.
While the outflow for the acquisition of property, plant and
equipment of € 100.9 million in the previous year rose to
€ 218.6 million in the financial year 2019/20, a net inflow to
financial assets (due to the reduction of remaining terms) of
€ 101.9 million was recorded (previous year: net outflow of
€ 175.7 million). As a result, cash flow from investing activities,
at € -116.6 million, was below the prior-year level of
€ -276.6 million.
Cash flow from financing activities amounted to € 17.9 million,
down € -129.3 million on the prior-year value of € 147.2 million.
Carrying amount of financial liabilities by maturity
€ in millions
31 Mar 2020 in % 31 Mar 2019 in %
Remaining maturity
Less than 1 year 105.3 13.1 38.0 5.3%
Between 1 and 5 years 554.6 69.2 532.6 74.3%
More than 5 years 141.2 17.6 146.5 20.4%
Total financial liabilities 801.1 100.0 717.0 100.0%
98
GROUP MANAGEMENT REPORTANNUAL REPORT 2019/20AT S FIRST CHOICE
FOR ADVANCED APPLICATIONS
ATS ANNUAL REPORT 2019/20 GROUP MANAGEMENT REPORT FIRST CHOICE
FOR ADVANCED APPLICATIONS
20
This was primarily attributable to the cash inflow from
borrowings of € 77.9 million and the repayment of financial
liabilities of € -30.1 million, the dividend payment of
€ -23.3 million and the hybrid coupon payment of € -8.3 million.
Free cash flow, i.e. cash flow from operating activities plus cash
flow from investing activities, amounted to € 68.5 million, up
€ 174.5 million on the prior-year value of € -106.0 million.
€ 277.6 million of the year-on-year change resulted from the
investment and returns on the investment of cash and cash
equivalents, which were offset by an increase in investment
activity of € 117.7 million and lower cash flow from operating
activities.
Substantial liquidity available for repaying existing
financing and further investments
Despite very high levels of investment, cash and cash
equivalents increased from € 326.8 million to € 418.0 million
due to a stable, high level of cash flow from operating activities
and the above-mentioned financing and investment measures.
Moreover, ATS has current financial assets of € 136.2 million
(previous year: € 239.8 million).
Overall, ATS thus has cash and current financial assets totalling
€ 554.2 million (previous year: € 566.6 million). This amount,
which is currently very high, serves to secure the financing of the
future investment programme and short-term repayments.
2.4.4. PERFORMANCE INDICATORS
Indicators demonstrate strong operating performance
In addition to revenue and EBITDA, ATS uses the indicators
ROCE and IRR for strategic corporate management. They reflect
the operating performance vis-à-vis investors and customers.
ATS uses return on capital employed (ROCE) to measure its
operating performance from the point of view of investors,
using the ratio of the result adjusted for finance costs – net and
average capital employed. This ratio serves to derive the extent
to which ATS fulfils its investors’ interest requirements.
Average capital costs are derived from the minimum return
investors expect for providing equity or borrowings. The
weighted average cost of capital (WACC) for the printed circuit
board industry was around 8.7% before the COVID-19
pandemic. With ROCE amounting to 2.8%, ATS was below this
level in the reporting period.
ROCE deteriorated year-on-year due the decline in EBIT, which
was offset by higher average capital employed of € 980.4 million
(previous year: € 937.2 million).
The second performance indicator is related to the ability to
implement innovations in a timely manner and in response to
the market. ATS measures this ability using the innovation
revenue rate (IRR), which expresses the revenue share of
products that feature new and innovative technologies and
which have been launched on the market in the last three years.
For the financial year 2019/20 the IRR is 30.8% compared with
35.3% in the previous year. ATS strives for a medium-term
Cash flow statement (short version)
€ in millions
2019/20 2018/19 Change in %
Cash flow from operating activities
before changes in working capital 165.4 206.0 (19.7%)
Cash flow from operating activities 185.1 170.5 8.6%
Cash flow from investing activities (116.6) (276.6) 57.8%
Operating free cash flow (33.4) 69.7 (100%)
Free cash flow 68.5 (106.1) 100%
Cash flow from financing activities 17.9 147.2 (87.8%)
Change in cash and cash equivalents 86.4 41.2 100%
Currency effects on cash and cash equivalents 4.7 15.0 (68.6%)
Cash and cash equivalents at end of the year 418.0 326.8 27.9%
99
GROUP MANAGEMENT REPORT FIRST CHOICE
FOR ADVANCED APPLICATIONS
ANNUAL REPORT 2019/20AT SATS ANNUAL REPORT 2019/20 GROUP MANAGEMENT REPORT FIRST CHOICE
FOR ADVANCED APPLICATIONS
21
average IRR of at least 20%. This target was significantly
exceeded in the financial year 2019/20.
2.5.Significant events after
the reporting period
With regard to significant events after the balance sheet date,
reference is made to the notes to the consolidated financial
statements (Note 26 Significant events after the balance sheet
date).
(0.6)
7.7
9.7
2.8
2016/17 2017/18 2018/19 2019/20
ROCE
in %
Return on capital employed (ROCE)
€ in millions
2019/20 2018/19 Change in %
Operating result (EBIT) 47.4 117.2 (59.6%)
Income taxes 1)
(19.5) (26.2) 25.6%
Operating result after tax (NOPAT) 1)
27.9 91.0 (69.3%)
Equity – average 781.9 757.4 3.2%
Net debt – average 198.5 179.8 10.4%
Capital employed – average 980.4 937.2 4.6%
ROCE 1)
2.8% 9.7%
1)
2018/19 adjusted taking into account IAS 12 revised
Innovation Revenue Rate (IRR)
€ in millions
2019/20 2018/19 Change in %
Main revenue 1,000.4 1,027.8 (2.7%)
Main revenue generated by innovative products 308.6 362.5 (14.9%)
IRR 30.8% 35.3%
100
GROUP MANAGEMENT REPORTANNUAL REPORT 2019/20AT S FIRST CHOICE
FOR ADVANCED APPLICATIONS
ATS ANNUAL REPORT 2019 /20 GROUP MANAGEMENT REPORT FIRST CHOICE
FOR ADVANCED APPLICATIONS
22
3.1.Plants and branch offices
The ATS Group currently operates six production plants, which
specialise in different technologies.
Leoben and Fehring
The Austrian plants primarily supply the European market and
increasingly also the American market. In Europe, short lead
times, special applications and customer proximity are
particularly important. The plant in Leoben continued to pursue
the path of niche and prototype production started in recent
years. Among other things, the production of the embedding
technology is based in Leoben. Several important projects were
qualified with renowned customers in the financial year
2019/20 and are about to enter mass production. In addition,
investments were made in the expansion of the core line in
order to provide capacities for the Chongqing plant on the one
hand and to secure the future technologies on the other. The
plant in Fehring successfully completed its extension and all
customer qualifications of the new production hall. A stronger
focus on specific applications and markets helped create
synergies with other sites (Leoben and Nanjangud) and improve
the product mix. As a result, high-end printed circuit boards
(HDI/HF technology) can be manufactured at the Fehring site
for the Industrial, Medical and Automotive segments.
Shanghai
The plant in Shanghai manufactures leading-edge HDI (high
density interconnection) printed circuit boards in serial
production for the Mobile Devices  Substrates segment for
customers all over the world. The plant was able to successfully
meet the demand for HDI and mSAP printed circuit boards and
has established itself as a leading supplier of the latest
technology generation. The plant’s broad technological
spectrum was very well received by customers and the plant
was continuously operating at capacity during the peak season
months. Strong demand for HDI printed circuit boards
continued at a stable level in 2019/20; these were produced for
the Automotive, Industrial, Medical segment.
Chongqing
At present, two plants for high-end products are operated in
Chongqing. The plant for IC substrates (integrated circuit
substrates) is currently undergoing full expansion and capacity
has increased as planned. The plant operated at capacity
throughout the year. As demand for IC substrates is increasing
for the application in high-performance computer modules,
construction of an additional plant began in the financial year
2019/20, and is scheduled to start production at the end of
2021. High-end mSAP printed circuit boards are manufactured
at the plant for mobile applications. The production of printed
circuit boards for modules started at the site during the financial
year 2019/20. Capacity at the plant is being continuously
expanded in order to meet growing customer demand in the
high-end segment.
Ansan
The very positive development of the site in Korea continued in
the financial year 2019/20, in particular in the medical
technology segment for European and American customers. In
December 2019, the expansion of the plant began on the
neighbouring premises, which had been acquired in the
previous year. Completion is scheduled for the fourth quarter of
the financial year 2020/21.
Nanjangud
The site continued its positive development in terms of the
further technical developments regarding market and customer
requirements in the financial year 2019/20. Due to the long
qualification times for HF and HDI products, this development is
not yet reflected in revenue; however, a significant shift in the
product mix towards higher-value technologies is already
noticeable and will continue to be a strong focus. The
temporary closure in mid-March caused by COVID-19 cases in
the vicinity of the plant and the region being designated a
lockdown area, had no material impact on revenue due to the
prestart situation.
Hong Kong
The Hong Kong-based company ATS Asia Pacific is the holding
company for the Mobile Devices  Substrates segment – hence,
for the Chinese plants and the allocated sales companies – and
the headquarters of Group-wide procurement for this segment.
Customers’ proximity to the CEMs and to suppliers is a
3. OTHER STATUTORY INFORMATION
101
GROUP MANAGEMENT REPORT FIRST CHOICE
FOR ADVANCED APPLICATIONS
ANNUAL REPORT 2019/20AT SATS ANNUAL REPORT 2019 /20 GROUP MANAGEMENT REPORT FIRST CHOICE
FOR ADVANCED APPLICATIONS
23
locational advantage which is highly valued by business
partners.
The sales support companies in America, Germany, Japan and
Taiwan continued to ensure good and close contact with
customers in the financial year 2019/20.
3.2.Shareholder structure
and disclosures on
capital (disclosures
pursuant to § 243a UGB)
Capital share structure and disclosure of
shareholder rights
As of the reporting date at 31 March 2020, the Company’s
ordinary shares amount to € 42,735,000 and are made up of
38,850,000 no-par value shares with a notional value of € 1.10
per share. The voting right at the Annual General Meeting is
exercised according to no-par value shares, with each no-par
value share equalling one voting right. All shares are bearer
shares.
Significant direct and indirect shareholdings in the Group parent
company AT  S Austria Technologie  Systemtechnik
Aktiengesellschaft, which at the reporting date amount to at
least 10%, are presented below: see table below.
At the reporting date of 31 March 2020, roughly 64.68% of the
shares were in free float. With the exception of the
shareholdings stated below, no other shareholder held more
than 10% of the voting rights in ATS. No shares with special
control rights exist. The exercise of the voting right by
employees who hold shares in the Company is not subject to
any limitations.
No special provisions exist on the appointment and dismissal of
members of the Management Board and the Supervisory Board.
The contracts of all Management Board members include a
“Change of Control” clause. Such a change of control exists in
the event that a shareholder of the company has obtained
control of the company in accordance with Section 22 of the
Austrian Takeover Act (ÜbG) by holding at least 30% of the
voting rights (including the voting rights of third parties
attributable to the shareholder pursuant to the Austrian Take-
over Act), or the company has been merged with a non-Group
legal entity, unless the value of the other legal entity amounts
to less than 50% of the value of the company according to the
agreed exchange ratio. In this case, the Management Board
member is entitled to resign for good cause and terminate the
Management Board contract at the end of each calendar month
within a period of six months after the change of control takes
legal effect, subject to a notice period of three months (“special
termination right”). If the special termination right is exercised
or the Management Board contract is terminated by mutual
agreement within six months of the change of control, the
Management Board member is entitled to the payment of their
remuneration entitlements for the remaining term of this
contract, however, for a maximum of three annual gross
salaries. Other remuneration components shall not be included
in the calculation of the amount of the severance payment and
shall be excluded from it.
By resolution passed at the Annual General Meeting on 4 July
2019, the Management Board is authorised until 3 July 2024 to
increase the Company’s ordinary shares, subject to the
approval of the Supervisory Board, by up to € 21,367,500 by
way of issuing up to 19,425,000 new, no-par value bearer
shares, for contributions in cash or in kind, in one or several
tranches, also by way of indirect subscription rights, after having
been taken over by one or more credit institutions in
accordance with Section 153 (6) of the Austrian Stock
Significant direct and indirect shareholdings
Shares/in % Shares % capital % voting rights
Dörflinger-Privatstiftung:
Vienna, Austria
6,902,380 17.77% 17.77%
Androsch Privatstiftung:
Vienna, Austria
6,819,337 17.55% 17.55%
102
GROUP MANAGEMENT REPORTANNUAL REPORT 2019/20AT S FIRST CHOICE
FOR ADVANCED APPLICATIONS
ATS ANNUAL REPORT 2019 /20 GROUP MANAGEMENT REPORT FIRST CHOICE
FOR ADVANCED APPLICATIONS
24
Corporation Act (AktG). The Management Board is authorised,
subject to the approval of the Supervisory Board, to exclude
shareholders’ subscription rights and to determine the detailed
terms and conditions of issue (in particular the issue amount,
subject of the contribution in kind, the content of the share
rights, the exclusion of subscription rights, etc.) (approved
capital). The Supervisory Board is authorised to adopt
amendments to the Articles of Association resulting from the
issuance of shares from the approved capital.
Furthermore, the Management Board was authorised by the
Annual General Meeting until 3 July 2024, subject to the
approval of the Supervisory Board, to issue one or several
convertible bearer bonds at a total nominal amount of up to
€ 150,000,000 and to grant to bearers of convertible bonds
conversion rights and/or subscription rights for up to
19,425,000 new no-par value bearer shares in the Company in
accordance with the convertible bond terms and conditions to
be defined by the Management Board. The Management Board
was authorised, subject to approval of the Supervisory Board in
accordance with the provisions of the Stock Corporation Act, to
determine issue and technical characteristics as well as the
terms and conditions of the convertible bonds (in particular
interest rate, issue amount, term and denomination, dilution
protection provisions, conversion period, conversion rights and
obligations, conversion ratio and conversion price).
Furthermore, the Management Board was authorised to fully or
partially exclude shareholders’ subscription rights to the
convertible bonds.
In addition, the Company’s ordinary shares were conditionally
increased by up to € 21,367,500 by way of issuance of up to
19,425,000 new no-par value bearer shares in accordance with
Section 159 (2) No. 1 of the Austrian Stock Corporation Act
(AktG). This conditional capital increase will only be carried out
if the bearers of convertible bonds issued based on the
authorisation resolution passed at the Annual General Meeting
on 4 July 2019 claim the right to conversion and/or subscription
granted to them with regard to the Company’s shares. The
Management Board was authorised to determine, subject to
approval from the Supervisory Board, the further details of
carrying out the conditional capital increase (particularly the
issue amount and the content of the share rights).
The following definition of amount in accordance with the
aforementioned authorisations is to be observed: the sum of (i)
the number of shares currently issued or potentially to be issued
from conditional capital in accordance with the convertible
bond conditions and (ii) the number of shares issued from
approved capital shall not exceed the total amount of
19,425,000 (limitation of authorised amount).
The Articles of Association were amended in accordance with
the resolutions on approved capital and conditional capital and
on the convertible bonds in § 4 (Nominal capital).
Treasury shares
At the 25th Annual General Meeting on 4 July 2019, the
Management Board was again authorised to purchase, within a
period of 30 months from the adoption of the resolution,
treasury shares to an extent of up to 10% of the nominal share
capital. Furthermore, the Management Board was authorised,
for a period of five years, i.e. up to and including 3 July 2024,
subject to approval of the Supervisory Board and without any
further resolution by the Annual General Meeting, to sell
treasury shares by means other than via the stock exchange or
a public offering, in particular to serve employee stock options,
convertible bonds or as a consideration for the acquisition of
companies or other assets and to use them for any other legal
purpose.
The company held no treasury shares as of 31 March 2020.
There are no off-balance sheet transactions between ATS and
its subsidiaries.
ATS neither has granted any loans nor has it assumed any
liabilities in favour of board members.
For further information, reference is made to the notes to the
consolidated financial statements (Note 21 “Share capital” as
well as Note 15 “Financial liabilities”).
The Company’s Corporate Governance Report pursuant to
Section 243b of the Austrian Commercial Code is available at
http://www.ats.net/company/corporate-governance/reports/.
103
GROUP MANAGEMENT REPORT FIRST CHOICE
FOR ADVANCED APPLICATIONS
ANNUAL REPORT 2019/20AT SATS ANNUAL REPORT 2019 /20 GROUP MANAGEMENT REPORT FIRST CHOICE
FOR ADVANCED APPLICATIONS
25
3.3.Non-financial statement
In accordance with Section 243b (6) UGB (Austrian Commercial
Code), the company is exempt from the obligation to prepare a
non-financial statement in the Management Report since a
separate non-financial report has been drawn up. This non-
financial report is included in the Annual Report 2019/20 as a
separate chapter.
104
GROUP MANAGEMENT REPORTANNUAL REPORT 2019/20AT S FIRST CHOICE
FOR ADVANCED APPLICATIONS
ATS ANNUAL REPORT 2019 /20 GROUP MANAGEMENT REPORT FIRST CHOICE
FOR ADVANCED APPLICATIONS
26
Structured development of technological
opportunities
In the past financial year ATS once again focused its research
and development activities on exploring opportunities arising
from the current transformation towards modularisation in the
electronics industry and the resulting change in the value chain
in order to gradually live up to the claim “More than ATS”. The
ongoing projects in this context can be allocated to four main
development programmes:
Miniaturisation and functional integration: Not only are
electronic devices continuously getting smaller and lighter, they
are also increasingly powerful and fulfil more and more
functions. The task of ATS is to create the basis for this
development. To do so, the company is working on technologies
which increase trace density and reduce the thickness of the
systems. Another field of research covers technologies enabling
the direct integration of electronic components into printed
circuit boards and substrates, increasing the packaging density
and efficiency of the overall system.
Fast signal transmission: As digitalisation progresses, driven by
improved data transmission possibilities (5G), the data volume
to be processed will increase significantly in the coming years.
Electronic systems working at higher frequencies (e.g.
communication modules for 5G, radar systems for cars) require
new solutions for the interconnect technology. Based on
development projects in this area ATS ensures that the
products transmit signals fast, precisely and with minimal
losses.
Performance and performance efficiency: In view of the
sustainability endeavours, there is currently a strong trend
towards alternative forms of propulsion in mobility, in particular
towards electric mobility. At the same time, mechanical
solutions are increasingly replaced by energy-saving electronic
solutions in the automotive sector. ATS focuses its
development activity on systems which enable optimum power
supply with the lowest electrical losses in vehicles, can switch
and transmit high loads and may even be able to produce
energy in the future.
Manufacturing of the future: Industrial production processes
will change fundamentally in the decades to come. The
processes will increasingly be organised using artificial
intelligence (AI), and sustainability will also play a key role: the
manufacturing of products must involve minimum consumption
of natural resources, be highly reliable and enable the reuse the
materials employed. ATS is working on new solutions which
allow efficient and flexible manufacturing with minimum
resource consumption (material, water, energy, etc.). To this
end, large data volumes are put to use via digitalisation in order
to optimise and improve production processes as well product
properties and quality, and new solutions enabling the sparing
use of resources in production are developed.
Innovation rate still high
The innovation revenue rate (IRR) measures the impact of the
innovative strength of a company. It describes the share in
revenue ATS generates with innovative products launched on
the market in the past three years. Generally speaking, the IRR
is higher in the years following the successful implementation
of new technologies and lower in the development phase of
new technologies (i.e. during the phase before their market
launch).
ATS strives for a mean annual IRR of at least 20%. In the past
financial year, the IRR was still relatively high at 30.8% despite
numerous technology introductions in the past years (e.g. mSAP
and substrates). At the same time, ATS will also be in a very
21.8
40.4
35.3
30.8
2016/17 2017/18 2018/19 2019/20
Innovation Revenue Rate (IRR)
in %
4. RESEARCH AND DEVELOPMENT
105
GROUP MANAGEMENT REPORT FIRST CHOICE
FOR ADVANCED APPLICATIONS
ANNUAL REPORT 2019/20AT SATS ANNUAL REPORT 2019/20 GROUP MANAGEMENT REPORT FIRST CHOICE
FOR ADVANCED APPLICATIONS
27
intensive phase of technology development and
implementation in the future.
ATS is currently concentrating on new technologies for the
production of more powerful and energy-efficient substrates
for computer processors. Another focus is on technologies for
the production of modules (electronic units for specific tasks
connecting several components with each other) and new
solutions for the 5G wireless standard.
The innovative strength and long-term competitiveness of a
company are also reflected in the number and quality of its
patents: ATS submitted a total of 61 new patent applications
in the financial year 2019/20. At present, ATS has 343 patent
families, which result in 326 granted patents. The IP portfolio is
further strengthened by externally acquired licenses, in
particular in the area of embedding technology.
RD expense: 9.5% of revenue
The costs of research and development projects totalled € 94.8
million in the financial year 2019/20. This corresponds to a
research rate (i.e. ratio to revenue) of 9.5% compared with 7.4%
in the previous year. Based on this continuously high research
rate, ATS is securing its position as the technology leader for
the years to come.
Development centres in Leoben and Chongqing
ATS ensures efficiency in development among other things by
closely collaborating with customers, suppliers and research
institutions worldwide.
Internally, ATS pursues a two-level innovation process. In a
first step, opportunities are identified, ideas are examined for
their development potential, novel concepts are developed and
reviewed for their general feasibility. This level corresponds to
applied research and technology evaluation.
Subsequently, it is the task of the local technology development
and implementation departments at the ATS sites to continue
the experimental development of processes and products and
to integrate them into the existing production process.
In the past financial year, ATS upgraded the development unit
in Chongqing into a development centre. To this end, the set-up
of the prototype line, which had already begun, was expanded
for new processes. Moreover, a multi-year set-up plan for a
high-end prototype line was designed, covering nearly all
process steps for the production of high-end substrates and
advanced packages.
The development centre in Leoben was also further
strengthened. Currently, several new technologies are added to
the technical development capacities. Some of these devices
enable the analysis of production processes that are entirely
227
258
279
326
2016/17 2017/18 2018/19 2019/20
Number of patents granted
7,7%
6,6%
7,4%
9,5%
2016/17 2017/18 2018/19 2019/20
Research rate
i. e. ratio to revenue
106
GROUP MANAGEMENT REPORTANNUAL REPORT 2019/20AT S FIRST CHOICE
FOR ADVANCED APPLICATIONS
ATS ANNUAL REPORT 2019/20 GROUP MANAGEMENT REPORT FIRST CHOICE
FOR ADVANCED APPLICATIONS
28
new to the industry, such as physical separation processes or
photopatternable dielectric materials. These activities ensure
that ATS will continue to convince customers with new
concepts in the core development areas as a technology leader
in the years to come.
Key development projects
In the past financial year, RD activities focused on the
development of the next substrate and packaging technology.
At the locations in Chongqing and Leoben, several technology
components are currently in the implementation phase. The
main development activities consisted of the conceptual design
and specification of the required production machines, which
frequently have to be adapted to individual needs in
cooperation with the suppliers. Concepts based on which
technology components can also be used for the generation
after next are already being developed in parallel in this area.
Intensive work on projects for the new mobile communication
standard 5G continued, with one of the focus areas being the
development of system solutions specifically for the second
generation of the 5G standard, which uses radio frequencies in
the mm-wave-length range (25-30GHz). Here, entirely new
printed circuit board and interconnect systems have to be
developed to keep losses as low as possible. In doing so, ATS
is working with important companies along the value chain and
with customers.
Developments in power electronics are currently driven by
electromobility. ATS is developing innovative new electronic
systems in this area that consume very little energy and can
work with high currents and high voltages. This is made possible
by using the embedding technology, which allows optimal
cooling and electric connection of the components, resulting in
electrically efficient and highly reliable systems and modules. In
the development for this area, a special focus was placed on the
analysis of new performance semiconductors and on exploring
them in cooperation with international partners.
Cooperation with research institutions
In the past financial year, the national and international
collaboration with research institutions was further intensified.
The University of Chongqing (Chongqing, China), East China
University of Science and Technology (Shanghai, China), Virginia
Tech (Blacksburg, Virginia, USA) and Silicon Austria Labs (Graz,
Austria) joined the list of our most important research partners.
107
GROUP MANAGEMENT REPORT FIRST CHOICE
FOR ADVANCED APPLICATIONS
ANNUAL REPORT 2019/20AT SATS ANNUAL REPORT 2019 /20 GROUP MANAGEMENT REPORT FIRST CHOICE
FOR ADVANCED APPLICATIONS
29
5.1.Opportunities and risk
management
STRUCTURE AND INSTRUMENTS
Opportunities and risk management is a fundamental part of
conducting business within the ATS Group. The objective of
increasing enterprise value involves not only opportunities but
also risks. Since decisions are usually made under uncertainty, it
is the task of risk management to identify risks or negative
deviations at an early stage and deal with them in a proactive
manner. Therefore, ATS operates a Group-wide Risk
Management (RM) system in accordance with the Austrian
Code of Corporate Governance (ACCG), an Internal Control
System (ICS) in accordance with COSO standards, as well as
Internal Audit based on the IIA standard.
From an organisational perspective, Risk Management, Internal
Control System and Internal Audit functions fall within the
responsibility of the CFO. The Group Risk Manager reports
quarterly to the full Management Board at a Management
Board meeting. The Supervisory Board is included within the
framework of the Audit Committee meeting, which takes place
at least twice a year. The proper functioning of the risk
management system is assessed annually by the external
5. OPPORTUNITIES AND RISKS
ATS RISK LEVELS AND RISK CONTROLLING
RM: Risk Management; ICS: Internal Control System; BU: Business Unit
Figure 2: ATS Risk Levels and Risk Controlling
_ICS  RM
management of process risk
(risk level 1–2) supported by the
internal control system. At Group
level, relevant risks (risk level ≥ 3)
are managed and reported through
the risk management process.
_Risk exposure  risk level
The ATS risk levels are derived
from operating cash flow and the
equity ratio as an indicator of the
risk capacity of the Group.
_Risk mitigation
clear assignment of responsible
­decision levels based on risk level
(see left).
SUPERVISORY
BOARD
MANAGEMENT BOARD
BU MANAGEMENT
PLANT MANAGEMENT
PROCESS MANAGEMENT
RISK LEVEL RISK CONTROLLING PROCESS
1
2
3
4
5
6
RM
IKS
ATS RISK MANAGEMENT PROCESS
RISK AND OPPORTUNITY STRATEGY
Risk/Opportunity Management Process
Risk/Opportunity Management Software
RISK/OPPORTUNITY
CONTROL
CONTROL
_Reporting
_Monitoring
_Control
RISK/OPPORTUNITY
ANALYSIS
Figure 1: ATS Risk Management Process
ANALYSIS
_Identification
_Assessment
_Aggregation
_Risk strategy
defined by the Management Board
and process owners.
_Risk identification 
Group-wide survey with subsequent
evaluation. Immediate reporting of
significant new risks (≥3).
_Risk evaluation
consistent Group-wide evaluation of
all risks with respect to their monetary
impact, probability of occurring, and
resulting risk rating of 1 (low) ­to 6
(critical).
_Aggregation  reporting
aggregation and regular reports on
all significant risks (risk level ≥3) to
the Management Board and Audit
Committee by the Risk Manager.
_Risk mitigation  monitoring
in accordance with defined reporting
and decision levels (based on risk
level, see Figure 2).
_Risk management software
Group-wide for risks and
ICS controls.
108
GROUP MANAGEMENT REPORTANNUAL REPORT 2019/20AT S FIRST CHOICE
FOR ADVANCED APPLICATIONS
ATS ANNUAL REPORT 2019 /20 GROUP MANAGEMENT REPORT FIRST CHOICE
FOR ADVANCED APPLICATIONS
30
auditor in the course of the annual audit of financial statements
pursuant to Rule 83 ACCG.
The risk management process shown in Figure 1 is conducted at
least twice a year.
Risk management is conducted based on the risk strategy and
risk exposure at the hierarchy level assigned to the relevant
level of risk (see Figure 2).
RISK MANAGEMENT IN 2019/20
In the financial year 2019/20, risk management focused on the
evaluation and selection of a software-based GRC solution
alongside the management of risks arising from operating
business. The objective of this further development is to
strengthen the links between governance, risk and compliance
processes and to use synergies. The implementation of this tool
will start in the financial year 2020/21.
The integration of non-financial risk management into the
Group-wide risk management system was another focus in the
financial year 2019/20. The goal was to identify and assess risks
related to the environment, social matters and responsible
management in line with Group-wide risk management.
5.2.Explanation of individual
risks
The risks, uncertainties and opportunities facing the Group are
generally based on worldwide developments in the printed
circuit board and substrate market and the Group’s own
operating performance. An overview of the ATS risk
categories, significant individual risks, risk mitigation measures
and the expected trend in the coming year is shown in Figure 3
and explained in further detail below.
Significant risks  opportunitiesRisk category Risk mitigation  opportunity realisationTrend
STRATEGY
MARKET
PROCUREMENT
BUSINESS
ENVIRONMENT
OPERATIONS
ORGANISATION
FINANCE
▪ Sales price development
▪ Capacity utilisation
▪ Technology development
▪ Investments
▪ Market and segment development
▪ Development of key customers
▪ Sales strategy and implementation
▪ Development of procurement prices
▪ Single-source risk
▪ Confidentiality breach
▪ Catastrophe, fire
▪ Political risk
▪ Pandemic
▪ Quality performance
▪ Intellectual property
▪ Project management
▪ Operating costs
▪ Loss of key personnel
▪ Foreign exchange risk
▪ Financing  liquidity
▪ Tax risk
▪ Impairment
▪ Consistent focus on high-end technologies  target applications
▪ Customer proximity and early customer contact
▪ Technology development projects  technology roadmap
▪ Market analysis, strategy review and adaption
▪ Balanced segment portfolios and diversification of the customer portfolio
▪ New customer acquisition  share increases with existing customers
▪ Consistent acquisition of defined target applications
▪ Procurement strategy (negotiation, allocation, technical changes)
▪ Supplier risk assessment  multi-sourcing
▪ Increased security level based on the implementation of an information security manage-
ment system (ISO 27001)
▪ Internal  external audits, emergency practice
▪ Business continuity management
▪ Containment actions (e.g. protective measures, distancing regulations, remote working)
▪ Black Belt programme, continuous quality improvement measures
▪ Continuous expansion and protection of the IP portfolio
▪ Rigorous project management
▪ Cost reduction and efficiency enhancement programmes at all sites
▪ Employee retention, deputy regulation  succession planning
▪ Natural FX hedging through long-term CF planning
▪ Long-term planning for financing and liquidity, interest swaps
▪ Continuous monitoring of compliance with tax laws
▪ Project controlling, impairment tests, strategy review and adaptation
FX: Foreign Exchange; CF: Cash Flow
Figure 3: ATS Risk Categories, Significant Individual Risks, Risk Trends and Risk Mitigation Measures
109
GROUP MANAGEMENT REPORT FIRST CHOICE
FOR ADVANCED APPLICATIONS
ANNUAL REPORT 2019/20AT SATS ANNUAL REPORT 2019 /20 GROUP MANAGEMENT REPORT FIRST CHOICE
FOR ADVANCED APPLICATIONS
31
STRATEGY
Investment risk
In order to use growth potential and remain competitive, ATS
undertakes substantial investments in new technologies (IC
substrates) as well as in the further development and capacity
expansion of existing technologies (SLP, MSap, HDI) and will
continue to do so in the future. In order to establish the IC
substrate business as a strategic cornerstone, ATS invests in a
new plant in Chongqing and expands existing capacities at the
Leoben plant. The investment is based on the growing demand
for IC substrates for the application in high-performance
computer modules.
Incorrect assessments of technological developments, changes
in demand, restrictions through third-party patents, negative
price developments, customer-specific technologies, shorter
technology cycles or problems in the technical implementation
may have severe adverse effects on the intrinsic value of such
investments. These effects could relate, in particular, to the
substrate business, the production capacity for the mSAP
technology in Shanghai and Chongqing, the capacity expansion
for high-frequency printed circuit boards in Nanjangud and
Fehring and generally all current ATS business activities. If
there are any indications of such adverse effects, impairment
tests of these investments are performed as required, which
may lead to high impairment requirements due to the high
investments made.
Competition risk
The clear focus on the high-tech segment coupled with the
highest quality standards and consistent cost controls has so far
enabled ATS to successfully withstand the effects of intense
competition, overcapacity in the market, and persistent
“commodification” with a corresponding margin reduction in
the HDI (high-density interconnect) technology segment. This
was complemented by the successful transfer of HDI technology
from smartphone applications and other mobile devices to
further applications, such as those in the automotive industry.
The technology upgrade of part of the HDI lines to the mSAP
technology ensures the transfer of competitive advantages of
HDI to the next technology generation. Delays in switching over
to the new technology on the customer side and volatile market
developments may pose challenges for ATS and lead to excess
supply, overcapacities and underutilisation.
The opportunities of the Austrian plants of ATS are based on
high flexibility, high quality standards and the ability to react
very quickly to changing specifications and technologies. These
capabilities are absolutely imperative for prevailing in the
competitive environment, especially in the industrial segment,
which is subject to diverse technological requirements among a
large number of customers. To ensure our competitive edge,
ATS constantly pursues new forms of technology and projects
in close cooperation with our customers.
New technological developments and excess capacity in the
market pose great challenges for ATS in the IC substrate
segment. The focus on a higher-value product portfolio and the
successful realisation of the planned cost reduction are
essential for this business segment. The market for IC substrates
is strongly influenced by technological changes. The investment
in the Chongqing site enables strategic development in this
business segment. The development of new technologies
serves to mitigate the market risks of IC substrates. However,
this technological progress also entails the general risk of new
technological developments.
Competitor risks arise due to potential quality improvements
and technological developments in countries with low
production costs. This could lead to a loss of competitiveness at
ATS sites, especially in Austria and possibly also at other
production sites like those in South Korea and China.
In addition, a difficult market environment in the financial year
2020/21 could have an adverse effect on the Group’s results.
Stagnating smartphone sales, weak demand in the Automotive
and Industrial segments as well as unfavourable market
developments in the other core segments could lead to a
decline in revenue. In particular, the impact of the COVID-19
pandemic on the global economy cannot be fully projected due
to the low visibility. The broad-based positioning of ATS in the
Mobile Devices  Substrates segment and in the Automotive,
Industrial, Medical segment with their different production
cycles can partially cushion market risks. Along with controlling
risks, crisis-proof applications are pushed based on customer
110
GROUP MANAGEMENT REPORTANNUAL REPORT 2019/20AT S FIRST CHOICE
FOR ADVANCED APPLICATIONS
ATS ANNUAL REPORT 2019 /20 GROUP MANAGEMENT REPORT FIRST CHOICE
FOR ADVANCED APPLICATIONS
32
and application analyses. A positive post-crisis market
development could offer increased business opportunities and
especially high growth opportunities.
MARKET
Potential loss of key customers
With the help of advanced production technologies and high
quality standards, ATS has managed to establish itself as a
reliable provider to some of the world’s most renowned players
in the electronics industry. Due to the focus on high-end
technology, the number of customers is limited to technology
leaders. The revenue generated with the five largest customers
accounts for 68% of total revenue. Our long-term relationships
with these customers also offer excellent opportunities for the
future. However, concentration of this kind also poses risks in
the event that there is a significant reduction in business volume
or profitability from these customers. This is particularly critical
in the areas of IC substrates and mSAP. The ongoing
improvement of ATS’s competitiveness, the expansion of the
customer base and the development of new products were
recently successfully continued and support the rapid
compensation of potential negative development among
individual key customers.
PROCUREMENT
Procurement prices
Price fluctuations in energy and raw materials (gold, copper and
laminates) can have both a positive and a negative impact on
achievable margins in the short term. Rising raw material prices
in the financial year 2019/20 were partially cushioned by the
targeted implementation of the procurement strategy and
process optimisations. Due to the current uncertainties in the
market, coupled with the COVID-19 pandemic, the price
development for raw materials cannot be reliably projected for
the coming financial year.
Suppliers
The sourcing strategy of ATS focuses on a wide and clearly
diversified base of carefully selected suppliers in order to
reduce dependencies on individual suppliers. Long-standing
and stable customer-supplier relations are in place with key
suppliers with particular expertise and competitive standing. To
avoid supply shortages, ATS conducts rigorous supplier risk
management, taking account of regional cluster risks, various
supply routes, and alternative procurement options. Customer
specifications may limit the raw materials used to certain
suppliers, which may result in a dependency for ATS. However,
with few exceptions – for example in the IC substrates and ECP
areas, where the supplier base is smaller – alternative supplier
options are usually available in order to respond to supply risks.
BUSINESS ENVIRONMENT
Location-specific risks
The large majority of ATS’s operating activities are based at
sites outside of Austria, particularly in China. This means that
the Group might be subject to potential legal uncertainties,
state intervention, trade restrictions or political unrest.
Irrespective of the above, any production site of the Group may
furthermore be exposed to disruptive events such as fire,
natural disasters, acts of war, shortages of supply or other
elementary events. The termination of land use rights, permits
or the lease contracts for specific plants might also have a
considerable negative impact on the production output of the
Group.
To minimise the effects of such risks, the Group has instituted
business continuity management. ATS also conducts active
insurance management by means of weighing the risks and
associated costs. It has concluded insurance contracts to the
extent customary for a company of this size wherever such
contracts were available at costs which are reasonable in
relation to the impending risks.
The spread of the COVID-19 pandemic is currently influencing
the production of ATS. Numerous protective measures have
been taken aiming to optimally protect employees from the
SARS-CoV-2 virus while at the same time keeping up ongoing
operations. In doing so, ATS uses the rich experience gained in
China, where the company acquired valuable knowledge in
dealing with the exceptional situation. The measures taken in
China are also applied to the other locations. Mandatory face
masks were introduced on the company premises, remote
working regulations massively extended, canteen operations
111
GROUP MANAGEMENT REPORT FIRST CHOICE
FOR ADVANCED APPLICATIONS
ANNUAL REPORT 2019/20AT SATS ANNUAL REPORT 2019 /20 GROUP MANAGEMENT REPORT FIRST CHOICE
FOR ADVANCED APPLICATIONS
33
limited and business travel stopped. In addition, a designated
info point has been set up on the ATS intranet to keep all
employees informed and a telephone hotline for all employee
questions has been installed. A task force has been set up at the
respective locations for the implementation, monitoring and,
where necessary, adaptation of these measures.
An aggravation of the current conditions, the provision of
production materials and personnel, the supply processes and
demand may influence the business development in the coming
months. The global effects of the pandemic can lead to weaker
demand in some customer segments. At present, it is not
possible to quantify these impacts due to low visibility and high
volatility.
Political risks
The electronics industry is characterised by highly integrated,
transnational supply chains which are based on the free trade
of goods and services. Potential protectionism or growing
political tensions can lead to discontinuities in the supply chain
and to competitive advantages for competitors in specific
countries.
In Europe, there are currently uncertainties regarding the
withdrawal of the United Kingdom from the European Union,
especially with respect to legal situation after the transition
period expires in January 2021. ATS has only a few business
relationships with customers and suppliers based in the United
Kingdom. Nevertheless, ATS has taken measures due to the
existing uncertainties to ensure a smooth process in the supply
chain. The precautions taken include close contact with
customers, an increase in inventories and the preparation of
internal systems for the withdrawal. Nonetheless, the effects of
the United Kingdom’s withdrawal on the European economy
may also have an impact on the business development of ATS.
The partial de-escalation of the trade conflict between the USA
and China has led to a reduction of punitive tariffs on imports of
certain goods in both countries. From the current perspective,
ATS will not be significantly affected by the conflict since
further processing of the products largely takes place in China.
Nevertheless, ongoing monitoring of the affected goods is
necessary. In addition, macroeconomic developments resulting
from the trade conflict may have an adverse effect on the
business of ATS.
Compliance
Any amendments to regulatory requirements, such as the
prohibition of specific processes or materials, might lead to a
rise in production costs. ATS might be subject to payment of
substantial penalties should any breach of customer
confidentiality agreements or statutory provisions occur. ATS
has implemented organisational measures aimed at preventing
or minimising the occurrence of compliance risks. The extension
of such measures is ongoing. As a rule, ATS follows a zero-
tolerance policy and expects 100% compliance on the part of its
employees with all applicable laws and regulations. The
Governance, Risk  Compliance Committee (GRC Committee)
pursues the objective of identifying and mitigating potentially
relevant compliance and governance risks. In addition, ATS
introduced the whistleblowing platform “We Care”, which
enables employees and external third parties to report potential
compliance violations. In the financial year 2019/20 an intranet
campaign was launched throughout the Group to raise
awareness among employees.
Fraud, data security and cybercrime
To continue to successfully prevent attempted fraud, internal
controls were further intensified in the past few financial years
and initiatives to raise awareness among employees with regard
to such fraud schemes were increased. Moreover, ATS
continually works to expand data and information security. In
the financial year 2018/19, a project regarding the EU General
Data Protection Regulation was implemented. Based on an
analysis of internal processes regarding the use of personal
data, the required measures were assessed and implemented
in order to ensure the protection of sensitive data. After the
successful certification of all European locations in accordance
with ISO 27001, the focus in the financial year 2019/20 was on
the establishment of a corresponding information security
management system (ISMS) at the other ATS locations.
Alignment with international IT standards ensures safe handling
and appropriate access to information, and the availability of
reliable systems. Certification of all locations is planned for the
financial year 2020/21.
112
GROUP MANAGEMENT REPORTANNUAL REPORT 2019/20AT S FIRST CHOICE
FOR ADVANCED APPLICATIONS
ATS ANNUAL REPORT 2019 /20 GROUP MANAGEMENT REPORT FIRST CHOICE
FOR ADVANCED APPLICATIONS
34
Based on the measures taken in the context of the COVID-19
pandemic, employees increasingly worked from home. The
resulting security-relevant risks were minimised through the
provision of guidelines, training material, intranet campaigns
and technical measures. The objective of these measures is to
raise awareness among employees about information security
even in times of crisis.
OPERATIONS
Quality and delivery performance
As in the past, it will be the high quality of products, adherence
to delivery deadlines and service quality which will offer the
Group an opportunity to differentiate itself from the
competition and exploit growth opportunities in the future. At
the same time, ATS has to make substantial contractual
commitments, especially to key customers, with respect to
capacity reserves and volume guarantees, adherence to
delivery deadlines and quality performance. Any technical
defects, quality deficiencies, difficulties in delivering products or
failure to provide volume guarantees granted may expose ATS
to warranty claims, claims for damages and contractual
penalties. In the Mobile Device business, quality deficiencies
may even lead to delivery stops for certain part numbers. Even
if such quality deficiencies were not caused in the production
process of ATS but within the supply chain, such delivery stops
may lead to significant drops in revenue. Substantial quality
deficiencies could also result in product recalls and the loss of
customers. ATS has established a quality management and
planning system designed to rule out or minimise deficiencies in
product quality and planning mistakes and their negative
consequences as far as possible. In order ensure high product
quality, ATS not only meets general international quality
standards (ISO 9001) but also further standards for the
automotive, aviation and medical sectors. Furthermore, the
Group is insured against major risks by virtue of an (extended)
product liability insurance policy taking into account exclusions
of coverage and customary coverage limits.
Intellectual property
ATS endeavours to exploit any opportunities for obtaining
intellectual property as well as gaining access to promising
patents through the development of its own projects,
cooperation schemes with partners, and investments. Risks
arise if ATS fails to protect its intellectual property, thus
enabling the competition to utilise these technologies. Legal
disputes about intellectual property can prevent ATS from
using or selling disputed technologies. Furthermore, legal
disputes with regard to the unauthorised use of external
intellectual property can have considerable negative financial
consequences.
Technology and project development
The establishment and expansion of capacity for IC substrates
in Chongqing lead to specific risks for the Chongqing site given
the significant investment volume. Complications in the further
development and project implementation could result in major
burdens on business development and the existing financial and
administrative resources. In the coming financial year, the focus
will be on continuous performance improvement, on building a
new plant at the Chongqing site and on expanding capacity at
the Leoben plant.
Cost control
Continuous cost reduction and efficiency increases in all
business segments are crucial to the Group’s profitability. If cost
reduction measures and performance increases cannot be
implemented as planned (or if the costs cannot be passed on to
customers), this may have a negative impact on the
competitiveness of the Group.
ORGANISATION
Employees
The collective industry experience and management expertise
of the employees of the ATS Group form the foundation for
taking advantage of future opportunities. The business of the
Group might suffer if employees in leading positions were to
terminate their employment relations with ATS or if ATS
were unable to continue to recruit highly qualified personnel in
all areas of value creation and retain them long-term. ATS
continuously develops strategies for retaining key employees,
recruiting valuable personnel and further expanding the skills of
its staff.
113
GROUP MANAGEMENT REPORT FIRST CHOICE
FOR ADVANCED APPLICATIONS
ANNUAL REPORT 2019/20AT SATS ANNUAL REPORT 2019 /20 GROUP MANAGEMENT REPORT FIRST CHOICE
FOR ADVANCED APPLICATIONS
35
FINANCE
Foreign exchange risk
Exchange rate fluctuations in EUR, RMB and USD – and to a
lesser extent in JPY, KRW and INR – can have considerable
positive or negative effects on the results of the Group. To
minimise these effects, the Group employs a hedging strategy
by generating opposing cash flows in the respective currencies.
The high investments in China of the past few years result in
significant currency risks related to the RMB, which could
increase or decrease the Group’s equity. Hedging against this
risk would involve high costs and is not carried out.
Financing and liquidity
To secure the financial needs for the expansion strategy, the
Group uses long-term financial and liquidity planning. However,
negative business developments (for example related to the
COVID-19 pandemic), significant deviations from assumptions
in business cases, exchange rate fluctuations or valuation
adjustments may cause failure to achieve the targeted equity
ratio and the net debt/EBITDA ratio, and subsequently lead to
additional financing requirements under more difficult terms
and higher costs, or the loss of existing financing facilities.
Interest rates are hedged centrally for the Group as a whole by
Group Treasury, in part through the use of appropriate financial
instruments.
For more information on financial, liquidity, credit and foreign
exchange risks, please refer to Note 19 “Additional disclosures
on financial instruments” in the notes to the consolidated
financial statements.
Tax risk
The Company is active on a global basis and thus subject to
different tax systems. Unless the requirements for the
formation of a provision or liability are met, both national and
international tax risks are incorporated within financial risks and
monitored accordingly. At present, the material tax risks are
related to the company in India. In order to minimise future tax
risks, the Group continuously monitors compliance with
national tax laws and international guidelines such as the BEPS
(Base Erosion and Profit Shifting) guideline of the OECD.
Although ATS strives to comply with all tax laws and
regulations, there is a risk of different interpretations of
international transactions in different countries, which may lead
to double taxation and additional tax burdens.
5.3.Internal control and risk
management system
with regard to
accounting
The accounting-related Internal Control and Risk Management
system is an integral part of the Group-wide risk management
system. According to the framework concept of COSO (The
Committee of Sponsoring Organizations of the Treadway
Commission), the actual risk management as well as the Internal
Control System (ICS) are subsumed under the concept of
company-wide risk management. The main criteria of the Risk
Management, Internal Control System and Internal Audit of
ATS are specified in a Group-wide risk management and audit
manual.
The documentation of the internal controls (business processes,
risks, control measures and those responsible) is made
principally in the form of control matrices, which are archived in
a central management database. The accounting-related
Internal Control System includes principles, procedures and
measures to ensure the compliance of accounting in terms of
the control targets described for financial reporting.
The accounting procedures are documented in separate
process instructions. These processes are standardised across
the Group and are presented in a standardised documentation
format. Additional requirements for accounting procedures
result from specific local regulations. The basic principles of
accounting and reporting are documented in the process
descriptions and also in detailed process instructions, which are
also filed in the central management manual. In addition,
guidelines on measurement procedures and organisational
requirements in connection with the processes of accounting
and preparing the financial statements are compiled and
updated on a regular basis. Schedules are set in accordance with
Group requirements.
114
GROUP MANAGEMENT REPORTANNUAL REPORT 2019/20AT S FIRST CHOICE
FOR ADVANCED APPLICATIONS
ATS ANNUAL REPORT 2019 /20 GROUP MANAGEMENT REPORT FIRST CHOICE
FOR ADVANCED APPLICATIONS
36
The internal financial reporting is done on a monthly basis as
part of Group reporting, with the financial information being
reviewed and analysed by the Corporate Accounting and
Corporate Controlling department. The monthly budget/actual
variance with corresponding comments on the results of the
segments, of the plants as well as of the Company, is reported
internally to the executives and to the members of the
Supervisory Board.
The annual preparation of the budget is carried out by the
Corporate Controlling department. Quarterly forecasts are
drawn up during the year for the remaining financial year based
on the quarterly results and current planning information. The
forecasts, with comments on the budget comparison and
presentations on the impact of opportunities and risks up to the
end of the financial year, are reported to the Supervisory Board.
In addition to regular reporting, multiple-year planning, project-
related financial information or calculations on investment
projects are prepared and submitted to the Supervisory Board.
115
GROUP MANAGEMENT REPORT FIRST CHOICE
FOR ADVANCED APPLICATIONS
ANNUAL REPORT 2019/20AT SATS ANNUAL REPORT 2019 /20 GROUP MANAGEMENT REPORT FIRST CHOICE
FOR ADVANCED APPLICATIONS
37
The COVID-19 pandemic, which started at the beginning of
2020, and the resulting crisis measures slowed down economic
activity worldwide and led to substantial downgrades of GDP
projections for 2020. The global GDP growth forecast for 2020
is set to decline from 2.9% to 0.4% (OECD, March and April 2020)
in the most important economies by the end of April 2020 as a
result of the crisis measures taken. Other forecasts project
globally negative GDP growth in the range of -2.8% (Oxford
Economics, April 2020) to -4.2% (IC Insights, April 2020). These
variances reflect the high volatility of the current situation. At
present, the global economy is expected to recover in 2021
(OECD, March 2020).
ATS remains on track
Thanks to its strategic alignment, ATS considers itself well
prepared to successfully overcome the current crisis and to
positively participate in the intact market trends in the medium
term. Even though the company has so far not been essentially
affected by disruptions in the value chain, there may be
influences on customer demand in the coming months.
Due to very limited visibility, coupled with high volatility in the
markets, ATS will take measures in the coming quarters
enabling it to act flexibly and rapidly to reflect the changing
framework conditions. These measures include, among others,
strict control of costs and expenses and close interaction with
customers and business partners. At the same time, the
company works on systematically preparing scenarios for the
time after the crisis.
The expectations for the individual segments of ATS are as
follows: product launches may be delayed in the Mobile Devices
segment due to the low visibility. In the Automotive segment,
visibility is also limited so that specific developments remain to
be seen. The Industrial segment will continue to develop at a low
level as in the previous year, while stable development is
expected for medical applications. The demand for IC substrates
is expected to remain strong according to current forecasts.
Operationally, ATS will concentrate on optimally utilising
existing and building new capacities, especially for IC substrates
in Chongqing, and above all continue to drive the expansion of
its business performance.
Based on current information and anticipating the usual
seasonality, ATS expects a solid performance in the first quarter,
with revenue and EBITDA at the level of the previous year.
The economic impact of the COVID-19 pandemic is difficult to
predict and consequently leads to significant uncertainty in the
forecasts. ATS will therefore report on recent events in the
markets and in the company on an ongoing basis throughout the
financial year and update the outlook as soon as the economic
framework conditions can be better quantified.
Investments
The Management Board considers the market trends to be fully
intact. Therefore, ATS will continue its investment programme
for new capacities and technologies in the current financial year
as previously announced. In line with spending discipline, a
reduced budget of up to € 80 million is planned for basic
investments (maintenance and technology upgrades)
depending on market development.
As part of the strategic projects, the management is planning
investments totalling up to € 410 million for the financial year
2020/21 – depending on the progress of projects.
Leoben-Hinterberg, 13 May 2020
The Management Board
Andreas Gerstenmayer m.p.
Monika Stoisser-Göhring m.p.
Heinz Moitzi m.p.
6. OUTLOOK
financial
statements
CON
SO
LIDA
TED
24
28
31
34
45
63
118 _ Consolidated statement of profit or loss
118 _ Consolidated statement of comprehensive income
119 _ Consolidated statement of financial position
120 _ Consolidated statement of cash flows
121 _ Consolidated statement of changes in equity
122 _ Notes to the consolidated financial statements
179 _ Statement of all legal representatives
180 _ Auditor’s report
118
CONSOLIDATED FINANCIAL ­STATEMENTSANNUAL REPORT 2019/20AT S FIRST CHOICE
FOR ADVANCED APPLICATIONSATS ANNUAL REPORT 2019/20 CONSOLIDATED FINANCIAL STATEMENT FIRST CHOICE
FOR ADVANCED APPLICATIONS
39
€ in thousands Note 2019/20 2018/19
Revenue 1 1,000,577 1,027,983
Cost of sales 2 (897,668) (860,828)
Gross profit 102,909 167,155
Distribution costs 2 (30,891) (30,723)
General and administrative costs 2 (37,558) (36,593)
Other operating income 4 18,048 18,858
Other operating costs 4 (5,106) (1,487)
Other operating result 12,942 17,371
Operating result 47,402 117,210
Finance income 5 10,998 15,172
Finance costs 5 (17,463) (17,190)
Finance costs - net (6,465) (2,018)
Profit before tax 40,937 115,192
Income taxes1)
6 (19,481) (26,165)
Profit for the year 1)
21,456 89,027
Attributable to owners of hybrid capital 1)
8,313 8,313
Attributable to owners of the parent company 13,143 80,714
Earnings per share attributable to equity holders
of the parent company (in € per share): 25
- basic 0.34 2.08
- diluted 0.34 2.08
1)
2018/19 adjusted taking into account IAS 12 revised
CONSOLIDATED STATEMENT
OF COMPREHENSIVE INCOME
€ in thousands 2019/20 2018/19
Profit for the year 1)
21,456 89,027
Items to be reclassified:
Currency translation differences, net of tax (30,292) 24,466
(Losses) from the fair value measurement of hedging instruments for
cash flow hedges, net of tax (1,642) (3,730)
Items not to be reclassified: (1,091) -5797
Remeasurement of post-employment obligations, net of tax (1,091) (5,797)
Other comprehensive income for the year (33,025) 14,939
Total comprehensive income for the year 1)
(11,569) 103,966
Attributable to owners of hybrid capital 1)
8,313 8,313
Attributable to owners of the parent company (19,883) 95,653
1)
2018/19 adjusted taking into account IAS 12 revised
CONSOLIDATED STATEMENT
OF PROFIT OR LOSS
CONSOLIDATED FINANCIAL ­STATEMENTS
119
FIRST CHOICE
FOR ADVANCED APPLICATIONS
ANNUAL REPORT 2019/20AT S
ATS ANNUAL REPORT 2019/20 CONSOLIDATED FINANCIAL STATEMENTS FIRST CHOICE
FOR ADVANCED APPLICATIONS
40
€ in thousands Note 31 Mar 2020 31 Mar 2019
ASSETS
Property, plant and equipment 7 903,509 777,742
Intangible assets 8 45,075 60,121
Financial assets 12 193 193
Deferred tax assets 6 25,984 35,555
Other non-current assets 9 21,258 24,664
Non-current assets 996,019 898,275
Inventories 10 108,373 84,465
Trade and other receivables and contract assets 11 192,433 229,045
Financial assets 12 136,242 239,752
Current income tax receivables 2,493 5,728
Cash and cash equivalents 13 417,950 326,841
Current assets 857,491 885,831
Total assets 1,853,510 1,784,106
EQUITY
Share capital 21 141,846 141,846
Other reserves 22 9,419 42,444
Hybrid capital 23 172,887 172,887
Retained earnings 436,107 446,274
Equity attributable to owners of the parent company 760,259 803,451
Total equity 760,259 803,451
LIABILITIES
Financial liabilities 15 695,834 679,076
Provisions for employee benefits 16 51,244 48,409
Deferred tax liabilities 6 3,166 5,547
Other liabilities 14 13,596 16,196
Non-current liabilities 763,840 749,228
Trade and other payables 14 214,017 179,954
Financial liabilities 15 105,299 37,967
Current income tax payables 4,858 9,331
Other provisions 17 5,237 4,175
Current liabilities 329,411 231,427
Total liabilities 1,093,251 980,655
Total equity and liabilities 1,853,510 1,784,106
CONSOLIDATED STATEMENT
OF FINANCIAL POSITION
120
CONSOLIDATED FINANCIAL ­STATEMENTSANNUAL REPORT 2019/20AT S FIRST CHOICE
FOR ADVANCED APPLICATIONSATS ANNUAL REPORT 2019/20 CONSOLIDATED FINANCIAL STATEMENTS FIRST CHOICE
FOR ADVANCED APPLICATIONS
41
€ in thousands 2019/20 2018/19
Operating result 47,402 117,210
Depreciation, appreciation, amortisation and impairment of property, plant and equipment and intangible assets 147,127 132,888
Gains/losses from the sale of fixed assets 732 37
Changes in non-current provisions 3,246 10,833
Non-cash expense/(income), net (14,315) (17,523)
Interest paid (12,049) (13,624)
Interest received 6,710 4,939
Income taxes paid (13,486) (28,788)
Cash flow from operating activities before changes in working capital 165,367 205,972
Inventories (25,462) 20,755
Trade and other receivables and contract assets 38,192 (23,405)
Trade and other payables 5,747 (30,898)
Other provisions 1,279 (1,890)
Cash flow from operating activities 185,123 170,534
Capital expenditure for property, plant and equipment and intangible assets (218,597) (100,913)
Proceeds from the sale of property, plant and equipment and intangible assets 70 77
Capital expenditure for financial assets (44,263) (275,669)
Proceeds from the sale of financial assets 146,161 99,926
Cash flow from investing activities (116,629) (276,579)
Proceeds from borrowings 77,888 355,278
Repayments of borrowings (30,089) (190,892)
Proceeds from government grants 1,748 5,112
Dividends paid (23,310) (13,986)
Hybrid cupon paid (8,313) (8,313)
Cash flow from financing activities 17,924 147,199
Change in cash and cash equivalents 86,418 41,154
Cash and cash equivalents at beginning of the year 326,841 270,729
Exchange gains on cash and cash equivalents 4,691 14,958
Cash and cash equivalents at the end of the year 417,950 326,841
CONSOLIDATED STATEMENT
OF CASH FLOWS
CONSOLIDATED FINANCIAL ­STATEMENTS
121
FIRST CHOICE
FOR ADVANCED APPLICATIONS
ANNUAL REPORT 2019/20AT S
ATS ANNUAL REPORT 2019/20 CONSOLIDATED FINANCIAL STATEMENT FIRST CHOICE
FOR ADVANCED APPLICATIONS
42
€ in thousands
Share
capital
Other
reserves
Hybrid
capital
Retained
earnings
Equity
attributable
to owners
of the parent
company
Non-
controlling
interests
Total
equity
31 Mar 2018 141,846 27,505 172,887 369,153 711,391 – 711,391
Adjustments IFRS 15, IFRS 9 – – – 10,393 10,393 – 10,393
1 Apr 2018 141,846 27,505 172,887 379,546 721,784 – 721,784
Profit for the year 1)
– – – 89,027 89,027 – 89,027
Other comprehensive income for the year – 14,939 – – 14,939 – 14,939
thereof currency translation differences,
net of taxes – 24,466 – – 24,466 – 24,466
thereof remeasurement of post-employment
obligations, net of tax – (5,797) – – (5,797) – (5,797)
thereof change in hedging instruments for
cash flow hedges, net of tax – (3,730) – – (3,730) – (3,730)
Total comprehensive income for the year
2018/19 1)
– 14,939 – 89,027 103,966 – 103,966
Dividends paid relating to 2017/18 – – – (13,986) (13,986) – (13,986)
Hybrid cupon paid – – – (8,313) (8,313) – (8,313)
Tax effect hybrid cupon 1)
– – – – – – –
31 Mar 2019 141,846 42,444 172,887 446,274 803,451 – 803,451
Profit for the year – – – 21,456 21,456 – 21,456
Other comprehensive income for the year – (33,025) – – (33,025) – (33,025)
thereof currency translation differences,
net of tax – (30,292) – – (30,292) – (30,292)
thereof remeasurement of post-employment
obligations, net of tax – (1,091) – – (1,091) – (1,091)
thereof change in hedging instruments for
cash flow hedges, net of tax – (1,642) – – (1,642) – (1,642)
Total comprehensive income for the year
2019/20 – (33,025) – 21,456 (11,569) – (11,569)
Dividends paid relating to 2018/19 – – – (23,310) (23,310) – (23,310)
Hybrid cupon paid – – – (8,313) (8,313) – (8,313)
31 Mar 2020 141,846 9,419 172,887 436,107 760,259 – 760,259
1)
Adjusted taking into account IAS 12 revised
CONSOLIDATED STATEMENT
OF CHANGES IN EQUITY
122
CONSOLIDATED FINANCIAL ­STATEMENTSANNUAL REPORT 2019/20AT S FIRST CHOICE
FOR ADVANCED APPLICATIONS
ATS ANNUAL REPORT 2019/20 CONSOLIDATED FINANCIAL STATEMENTS FIRST CHOICE
FOR ADVANCED APPLICATIONS
43
A. General
AT  S Austria Technologie  Systemtechnik Aktiengesellschaft (hereinafter referred to as “the Company”, and with its subsidiaries referred
to as “the Group”) was incorporated in Austria. The Company is headquartered in Austria, Fabriksgasse 13, 8700 Leoben-Hinterberg.
The Group manufactures and distributes printed circuit boards and provides related services in the segments Mobile Devices  Substrates,
Automotive, Industrial, Medical and Others. The products are manufactured in the European and Asian markets and are directly distributed
to original equipment manufacturers (OEM) as well as to contract electronic manufacturers (CEM).
Since 20 May 2008, the Company has been listed in the Prime Market segment of the Vienna Stock Exchange, Austria, and, after a period
of double listing on the previous exchange in Frankfurt am Main, Germany, has been traded exclusively on the Vienna Stock Exchange since
15 September 2008. Prior to changing stock exchange, the Company had been listed on the Frankfurt Stock Exchange since 16 July 1999.
Since 19 March 2018, the Company’s shares have been included in the Austrian ATX index. According to Section 245a of the Austrian
Commercial Code (UGB), theconsolidatedfinancialstatements werepreparedinaccordance withtheInternationalFinancialReportingStandards
(IFRS) and interpretations (IFRIC and SIC) of the International Accounting Standards Board (IASB) as adopted by the European Union (EU).
B. Accounting and measurement policies
The consolidated financial statements have been prepared under the historical cost convention, except for securities and derivative
financial instruments, which are measured at their fair values.
a. Consolidation principles
The balance sheet date for all consolidated companies is 31 March 2020, with the following exceptions: due to the legal situation in China,
the financial year of ATS (China) Company Limited and ATS (Chongqing) Company Limited corresponds to the calendar year (balance
sheet date: 31 December 2019), meaning that they were consolidated on the basis of the interim financial statements as of 31 March 2020.
The consolidated financial statements were approved for issue by the Management Board on 13 May 2020. The separate financial
statements of the Company, which are included in the consolidation after reconciliation to the applicable accounting standards, will be
presented for approval to the Supervisory Board on 4 June 2020. The separate financial statements of the Company can be modified by
the Supervisory Board and, in case of presentation to the Annual General Meeting, by the Company’s shareholders in a way that might also
affect the presentation of the consolidated financial statements.
Group of consolidated entities The Company controls an entity when the Group is exposed to risks or has rights to variable returns from its
involvement with the entity and has the ability to affect those returns through its power over the entity. In addition to the Company itself,
the consolidated financial statements comprise the following fully consolidated subsidiaries:
 ATS Asia Pacific Limited, Hong Kong, China (hereinafter referred to as ATS Asia Pacific), share 100%
 ATS (China) Company Limited, China (hereinafter referred to as ATS China), 100% subsidiary of ATS Asia Pacific
 ATS (Chongqing) Company Limited, China (hereinafter referred to as ATS Chongqing), 100% subsidiary of ATS Asia Pacific
 ATS Japan K.K., Japan, 100% subsidiary of ATS Asia Pacific
 ATS (Taiwan) Co., Ltd., Taiwan (hereinafter referred to as ATS Taiwan), 100% subsidiary of ATS Asia Pacific
 ATS India Private Limited, India (hereinafter referred to as ATS India), share 100%
 ATS Korea Co., Ltd., South Korea (hereinafter referred to as ATS Korea), share 100%
 ATS Americas LLC, USA (hereinafter referred to as ATS Americas), share 100%
 ATS Deutschland GmbH, Germany, share 100%
NOTES TO THE CONSOLIDATED
FINANCIAL STATEMENTS
I. GENERAL INFORMATION
CONSOLIDATED FINANCIAL ­STATEMENTS
123
FIRST CHOICE
FOR ADVANCED APPLICATIONS
ANNUAL REPORT 2019/20AT S
ATS ANNUAL REPORT 2019/20 CONSOLIDATED FINANCIAL STATEMENTS FIRST CHOICE
FOR ADVANCED APPLICATIONS
44
There were no changes in the consolidation group in financial year 2019/20.
The Group applies the acquisition method to account for business combinations. The consideration transferred for the acquisition of a
subsidiary is the fair value of the assets transferred, the equity interests issued and the liabilities incurred and/or assumed at the acquisition
date. The consideration transferred also includes the fair value of any asset or liability resulting from a contingent consideration
arrangement. Acquisition-related costs are expensed as incurred. Identifiable assets acquired and liabilities and contingent liabilities
assumed in a business combination are measured initially at their fair values at the acquisition date.
For each business combination, the Group measures any non-controlling interest in the acquiree either at fair value or at the non-
controlling interest’s proportionate share of the acquiree’s identifiable net assets and, accordingly, recognises the full or proportional
goodwill. If the consideration transferred is less than the fair value of the net assets of the subsidiary acquired, the difference is recognised
directly in profit or loss.
When the Group ceases to have control or significant influence over a company, any retained interest in the entity is remeasured to its fair
value, with the change in carrying amount recognised in profit or loss. The fair value is the fair value determined at initial recognition of an
associate, joint venture or financial asset. In addition, any amounts recognised in other comprehensive income in respect of that entity are
accounted for as if the parent company had directly disposed of the related assets or liabilities.
Methods of consolidation All significant intercompany balances and transactions have been eliminated so that the consolidated financial
statements present the accounting information of the Group as if it were one single company.
Capital consolidation is made in accordance with IFRS 3 “Business Combinations” and IFRS 10 “Consolidated Financial Statements”.
Intercompany accounts receivable and payable as well as expenses and income are eliminated. Unless immaterial, intercompany results in
non-current assets and inventories are eliminated. Furthermore, uniform accounting and measurement methods are applied to all
consolidated subsidiaries.
b. Segment reporting
The definition of operating segments and the presentation of segment results are based on the management approach and follow internal
reports to the Management Board as the chief operating decision-maker, i.e. the body that decides on the allocation of resources to the
individual segments. An operating segment is a component of an entity that engages in business activities and whose operating results are
reviewed regularly by the entity’s chief operating decision-maker. Business activities involve earning revenues and incurring expenses, and
these may also relate to business transactions with other operating segments of the entity. Separate financial information is available for
the individual operating segments.
The ATS Group structures the operating activities in three segments:
 Mobile Devices  Substrates
 Automotive, Industrial, Medical
 Others
The business unit Mobile Devices  Substrates is responsible for the production of printed circuit boards for mobile end-user devices such
as smartphones, tablets, notebooks and consumer products such as digital cameras as well as substrates for desktop PCs and servers. The
printed circuit boards for these applications are largely produced at our Shanghai (ATS China) and Chongqing (ATS Chongqing) plants.
124
CONSOLIDATED FINANCIAL ­STATEMENTSANNUAL REPORT 2019/20AT S FIRST CHOICE
FOR ADVANCED APPLICATIONSATS ANNUAL REPORT 2019/20 CONSOLIDATED FINANCIAL STATEMENTS FIRST CHOICE
FOR ADVANCED APPLICATIONS
45
The business unit Automotive, Industrial, Medical supplies customers in the fields of automotive supplies, industrial applications, medical
technology, aerospace, security and other sectors. Production for this business segment mainly takes place at our plants in India,
South Korea and Austria.
The business unit Others covers corporate and holding activities. Embedding technology, which was reported under the business unit
Others in the previous year, has now been split between the business unit Mobile Devices  Substrates and the Automotive, Industrial,
Medical business unit.
c. Foreign currencies
The Group’s presentation currency is the euro (€). The functional currency of the foreign subsidiaries is the respective local currency.
Foreign subsidiaries With the exception of equity positions (historical exchange rate), the balance sheets of ATS India, ATS China, ATS
Asia Pacific, ATS Japan K.K., ATS Korea, ATS Americas, ATS Chongqing and ATS Taiwan are translated at the exchange rates on the
balance sheet date. The profit or loss statements are translated at the average exchange rates of the financial year. The effect of changes
in the exchange rate with regard to the foreign subsidiaries’ net assets is recognised directly in equity.
Foreign currency transactions In the financial statements of each of the Group’s entities, foreign currency items are translated at the
exchange rates prevailing on the day of the transaction. Monetary items are translated at the respective exchange rate ruling at the balance
sheet date; non-monetary items which were recognised according to the historical cost principle are carried at the rate of their initial
recognition. Translation adjustments from monetary items, with the exception of financial assets classified as “at fair value through other
comprehensive income”, are recognised in profit or loss.
Closing rate Average rate
31 Mar 2020 31 Mar 2019 Change in %
01 Apr 2019 -
31 Mar 2020
01 Apr 2018 -
31 Mar 2019 Change in %
Chinese yuan renminbi 7.7575 7.5618 2.6% 7.7181 7.7751 (0.7%)
Hong Kong dollar 8.4879 8.8159 (3.7%) 8.6850 9.1080 (4.6%)
Indian rupee 82.5500 77.6621 6.3% 78.7460 80.6668 (2.4%)
Japanese yen 118.9200 124.3700 (4.4%) 120.8538 128.4076 (5.9%)
South Korean won 1,341.0773 1,275.6888 5.1% 1,312.8898 1,287.1060 2.0%
Taiwan dollar 33.1667 34.6394 (4.3%) 34.1504 35.3469 (3.4%)
US dollar 1.0949 1.1230 (2.5%) 1.1110 1.1613 (4.3%)
d. Revenue recognition
Revenue comprises the fair value of considerations received in the course of the Groups ordinary activities. Revenue is recognised net of
VAT, discounts and price reductions, and after elimination of intercompany sales. Revenue is realised as follows:
Revenue from product sales In accordance with IFRS 15, revenue must be recognised when control over agreed goods and services passes
to the customer and the customer obtains a benefit from them. Revenue can be recognised at a point in time or over time. When products
are manufactured specifically tailored to the customer’s needs and there is consequently no alternative use for such products and the
entity has an enforceable right to payment for performance completed to date including a margin, control of these products passes to the
customer according IFRS 15.35 c. Some of the ATS Group’s customers meet these criteria; therefore revenue is recognised over time in
such cases. Progress is measured based on the cost incurred to date in relation to total cost.
CONSOLIDATED FINANCIAL ­STATEMENTS
125
FIRST CHOICE
FOR ADVANCED APPLICATIONS
ANNUAL REPORT 2019/20AT S
ATS ANNUAL REPORT 2019/20 CONSOLIDATED FINANCIAL STATEMENTS FIRST CHOICE
FOR ADVANCED APPLICATIONS
46
In cases where customers do not meet these criteria revenue is recognised at a point in time when control over delivery has passed to the
buyer (depending on the agreed incoterms).
e. Income taxes
The income tax burden is based on the profit for the year and includes deferred income taxes.
The Group provides for deferred income taxes using the balance-sheet oriented method. Under this method, the expected tax effect of
differences arising between the carrying amounts in the consolidated financial statements and the taxable carrying amounts are taken into
account by recognising deferred tax assets and tax liabilities. These differences will be reversed in the future. Deferred income tax is
determined using tax rates (and laws) that have been enacted or substantively enacted on the balance sheet date and are expected to
apply when the related deferred income tax asset is realised or the deferred income tax liability is settled. A future change in tax rates
would also have an impact on the deferred tax assets capitalised at the current balance sheet date.
Deferred income taxes arise from the measurement of specific assets and liabilities, as well as tax loss carryforwards and amortisation of
goodwill.
Deferred taxes on not yet realised profits/losses of equity instruments and on not yet realised profits/losses from hedging instruments for
cash flow hedges that are recognised in equity are also directly recognised in equity.
In accordance with IFRS, deferred income tax assets on loss carryforwards have to be recognised to the extent that it is probable that they
will be utilised against future taxable profits.
Deferred taxes are not recognised for temporary differences in connection with holdings in subsidiaries provided that the Group is able to
control the timing of the reversal of the temporary differences and it is likely that the temporary differences will not be reversed in the
foreseeable future.
f. Property, plant and equipment
Items of property, plant and equipment are measured at cost. Expenditure directly attributable to an acquisition and the subsequent
expenditure is capitalised; repairs and maintenance costs, however, are expensed as incurred.
Borrowing costs directly attributable to the acquisition, construction or production of a qualifying asset are capitalised as part of the
acquisition or production costs of this asset in accordance with IAS 23.
From the time of their availability for use, the assets are depreciated on a straight-line basis over their expected useful lives. Depreciation
is charged on a pro rata temporis basis. Land is not subject to depreciation.
Scheduled depreciation is based on the following useful lives applicable throughout the Group:
Plants and buildings 10–50 years
Machinery and technical equipment 4–15 years
Tools, fixtures, furniture and office equipment 3–15 years
Depreciation periods and methods are reviewed annually at the end of the financial year.
126
CONSOLIDATED FINANCIAL ­STATEMENTSANNUAL REPORT 2019/20AT S FIRST CHOICE
FOR ADVANCED APPLICATIONSATS ANNUAL REPORT 2019/20 CONSOLIDATED FINANCIAL STATEMENTS FIRST CHOICE
FOR ADVANCED APPLICATIONS
47
Profits or losses resulting from the closure or retirement of non-current assets, which arise from the difference between the net realisable
value and the carrying amounts, are recognised in profit or loss.
g. Leases
A lease is a contract which transfers the right to use an asset (leasing asset) for and agreed period of time against a consideration. Since
1 April 2019, the Group recognises, for all leases, right-of-use assets in the statement of financial position and liabilities for the payment
obligations entered into at present value. Lease payments are discounted at the rate implicit in the lease if that can be readily determined.
Otherwise the incremental borrowing rate is used. Lease liabilities include fixed payments, variable index-linked payments and the exercise
price of a purchase option, if the exercise is considered to be sufficiently certain.
The subsequent measurement is made at amortised cost. Right-of-use assets are depreciated on a straight-line basis over the period of
the contract.
For leases in which the underlying asset is of low value (€ 5 thousand) and for short-term leases (up to 12 months or less) the practical
expedients are used and payments are recognised on a straight-line basis as an expense in the statement of profit or loss. In addition, the
provisions are not applied to leases of intangible assets.
In particular, leases of real estate include extension and termination options. When determining the term of the contract, all facts and
circumstances offering an economic incentive to exercise extension options or not to exercise termination options are taken into account.
Changes in the term resulting from the exercise or non-exercise of such options are only considered if they are sufficiently certain.
The Group only acts as a lessee. Transactions in which the Group is the lessor do not take place.
h. Intangible assets
Patents, trademarks and licenses Expenditure on acquired patents, trademarks and licenses is capitalised at cost, including incidental
acquisition expenses, and amortised on a straight-line basis over the asset’s useful life, generally between two and ten years. Amortisation
terms and methods are reviewed annually at the end of the financial year.
Research and development costs Research costs are expensed as incurred and charged to cost of sales.
Development costs are also expensed as incurred. An intangible asset arising from development is recognised if, and only if, an entity can
demonstrate all of the following:
 The technical feasibility of completing the intangible asset so that it will be available for use or sale.
 Its intention to complete the intangible asset and use or sell it.
 Its ability to use or sell the intangible asset.
 How the intangible asset will generate probable future economic benefits is verifiable.
 The availability of adequate technical, financial and other resources to complete the development and to use or sell the intangible asset.
 Its ability to reliably measure the expenditure attributable to the intangible asset during its development.
Capitalised development projects include all the directly attributable costs incurred as a result of development processes. Borrowing costs
are capitalised if the development project is a qualifying asset in accordance with IAS 23. Development costs are amortised on a straight-
line basis over a useful life from six to seven years, which is derived from the expected sales periods.
CONSOLIDATED FINANCIAL ­STATEMENTS
127
FIRST CHOICE
FOR ADVANCED APPLICATIONS
ANNUAL REPORT 2019/20AT S
ATS ANNUAL REPORT 2019/20 CONSOLIDATED FINANCIAL STATEMENTS FIRST CHOICE
FOR ADVANCED APPLICATIONS
48
i. Impairment losses and appreciation of property, plant and equipment and intangible assets
The Group regularly reviews property, plant and equipment and intangible assets for possible impairment. If evidence for impairment
exists, an impairment test is carried out without delay. Intangible assets in the development phase are tested annually for impairment. If
the recoverable amount of the respective asset is below its carrying amount, an impairment loss amounting to the difference is recognised.
The recoverable amount is the higher of an asset’s fair value less costs to sell and its value in use. The value in use corresponds to the
estimated future cash flows expected from the continued use of the asset and its disposal at the end of its useful life. The discount rates
applied correspond to the weighted cost of capital based on externally available capital market data that are typical in the industry and
have been adapted to the specific risks.
If the reason for the impairment recognised in the past no longer exists, with the exception of goodwill, an appreciation up to amortised
cost is made.
j. Inventories
Inventories are stated at the lower of cost or net realisable value. Net realisable value is the estimated selling price in the ordinary course
of business, less variable costs necessary to make the sale. Cost is determined by the first-in, first-out (FIFO) method. The cost of finished
goods and work in progress comprises raw materials, direct labour, other direct costs and related production overheads. Interest on
borrowed capital is not recognised.
k. Trade and other receivables and contract assets
Receivables not including a material financing component are initially measured at the transaction price in accordance with IFRS 15 and
subsequently recognised at amortised cost, if necessary less impairment for expected and actual credit losses. The receivables are
measured in accordance with the simplified model (lifetime expected credit losses). For this purpose, the required impairment is
determined within the scope of a provision matrix by analysing historical data and estimating future developments. All receivables are due
within less than one year and therefore do not include a financing component in the form of interest.
l. Financial assets
Financial assets are recognised and derecognised using settlement date accounting. The fair values recognised in the statement of financial
position generally correspond to market prices of financial assets. Except for financial assets at fair value through profit or loss, they are
initially recognised including transaction costs.
Financial assets are divided into two categories in accordance with IFRS 9, those which are valued at amortised cost and those valued at
fair value. When financial assets are valued at fair value, expenses and income are recognised through profit or loss or other comprehensive
income.
At amortised cost This category includes all financial assets held as part of a business model whose objective is the collection of contractual
cash flows and the contractual terms of the financial asset give rise on specified dates to cash flows that are solely payments of principal
and interest on the principal amount outstanding.
At the time of acquisition, the financial asset is measured at fair value in accordance with IFRS 15 (contract assets and trade receivables).
The financial asset is subsequently measured at amortised cost less any impairment. Impairments are recognised through profit or loss.
128
CONSOLIDATED FINANCIAL ­STATEMENTSANNUAL REPORT 2019/20AT S FIRST CHOICE
FOR ADVANCED APPLICATIONSATS ANNUAL REPORT 2019/20 CONSOLIDATED FINANCIAL STATEMENTS FIRST CHOICE
FOR ADVANCED APPLICATIONS
49
ATS applies the simplified impairment model for trade receivables and contract assets from contracts with customers, which takes into
account expected credit losses during the full life time. Credit loss is determined on the basis of a provision matrix created based on a
rating of the customers.
Financial assets at fair value through other comprehensive income This category includes those financial assets held as part of a business
model whose objective is the collection of contractual cash flows and the sale of financial assets, and the contractual terms of the financial
asset give rise on specified dates to cash flows that are solely payments of principal and interest on the principal amount outstanding.
In the ATS Group, trade receivables are in part sold to banks as part of factoring agreements. The part of receivables as of 31 March which
is sold to banks at nominal value after this date is measured at fair value through other comprehensive income. The measurement at fair
value has no significant impact on the consolidated financial statements. Therefore it is assumed that the fair value corresponds the
previous measurement standard of amortised cost.
All equity instruments for which IFRS 9 has to be applied are recognised at fair value; value changes are recognised through profit or loss.
If an equity instrument is not held for trading an entity can choose for the first time recognition the irrevocable decision to recognise value
changes through OCI; than only income from dividends are recognised through profit or loss, insofar as they do not represent a capital
repayment.
In accordance with IFRS 9 the irrevocable option of measurement through other comprehensive income was used. Value changes will
consequently continue to be recognised in other comprehensive income.
Financial assets at fair value through profit or loss This category includes financial assets which were classified neither at amortised cost
nor at fair value through other comprehensive income. At the time of their acquisition, they are stated at fair value, excluding transaction
costs, and, in subsequent periods, at their respective fair values. Realised and unrealised gains and losses are recognised in profit or loss in
“Finance costs - net”. This relates primarily to securities held for trading. Derivative financial instruments also fall into this category, unless
hedge accounting is applied (refer to “Derivative financial instruments”).
Derivative financial instruments Where possible, the Group uses derivative financial instruments to hedge against interest fluctuations.
These instruments mainly include interest rate swaps. They are entered into in order to protect the Group against interest rate fluctuations.
Currency swaps (mainly in US dollar) are also entered in order to protect the Group against currency fluctuations.
The Group does not hold any financial instruments for speculative purposes.
The first-time recognition at the conclusion of the contract and the subsequent measurement of derivative financial instruments are made
at their fair values. ATS continues to apply the provisions of IAS 39 with respect to hedge accounting. “Hedge accounting” in accordance
with IAS 39 “Financial Instruments: Recognition and Measurement”, according to which changes in fair values of hedging instruments are
recognised in equity, is applied when there is an effective hedging relationship pursuant to IAS 39 for hedging instruments for cash flow
hedges. The assessment of whether the derivative financial instruments used in the hedging relationship are highly effective in offsetting
the changes in cash flows of the hedged item is documented at the inception of the hedging relationship and on an ongoing basis. When
“hedge accounting” in equity is not applicable, unrealised gains and losses from derivative financial instruments are recognised in profit or
loss in “Finance costs - net”.
CONSOLIDATED FINANCIAL ­STATEMENTS
129
FIRST CHOICE
FOR ADVANCED APPLICATIONS
ANNUAL REPORT 2019/20AT S
ATS ANNUAL REPORT 2019/20 CONSOLIDATED FINANCIAL STATEMENTS FIRST CHOICE
FOR ADVANCED APPLICATIONS
50
Interest and dividend income Interest income is recognised on a pro rata temporis basis, taking into account the effective interest rate of
the asset. Dividend income from financial assets is recognised in profit or loss when the Group’s right to receive payments is established.
Impairment of financial assets The new impairment expected credit loss (ECL) model according to IFRS 9 has to be applied for financial
assets which are measured at amortised cost, for contract assets and debt instruments measured at fair value through OCI.
In accordance with IFRS 9, impairment must be determined using either the twelve-month model, which takes into account expected credit
losses within the next twelve months, or the lifetime expected credit loss model which takes into account expected credit losses that result
from possible default events within the whole lifetime.
ATS applies the simplified impairment model for trade receivables and contract assets from contracts with customers, which takes into
account expected credit losses during the full lifetime of the asset. The credit loss is determined on the basis of a provision matrix created
based on rating of the customers.
m. Cash and cash equivalents
Cash and cash equivalents comprise cash, time deposits, deposits held at call with banks and short-term, highly liquid investments with an
original maturity of up to three months (commercial papers and money market funds).
n. Non-controlling interests
The Company does not have any non-controlling interests.
The profit for the year and other comprehensive income are attributed to the owners of the parent company and the holders of the hybrid
capital.
o. Provisions
Provisions are recognised if the Group has a legal or de facto obligation to third parties, which is based on past events, where it is probable
that this will result in an outflow of resources and the amount can be estimated reliably. The provisions are remeasured at each balance
sheet date and their amounts adjusted accordingly.
Non-current provisions are reported at the discounted amount to be paid at each balance sheet date if the interest effect resulting from
the discounting is material.
p. Provisions for employee benefits
Pension obligations The Group operates various defined contribution and defined benefit pension schemes.
A defined contribution plan is a pension plan under which the Group pays fixed contributions into a special purpose entity (fund). These
contributions are charged to staff costs. No provision has to be set up, as there are no additional obligations beyond the fixed amounts.
For individual members of the Management Board and certain executive employees, the Group has defined benefit plans that are valued
by qualified and independent actuaries at each balance sheet date. The Group’s obligation is to meet the benefits committed to current
and former members of the Management Board and executive employees as well as their dependents. The pension obligation calculated
according to the projected unit credit method is reduced by the plan assets of the fund in the case of a funded pension scheme. The present
value of the future pension benefit is determined on the basis of years of service, expected remuneration and pension adjustments.
130
CONSOLIDATED FINANCIAL ­STATEMENTSANNUAL REPORT 2019/20AT S FIRST CHOICE
FOR ADVANCED APPLICATIONSATS ANNUAL REPORT 2019/20 CONSOLIDATED FINANCIAL STATEMENTS FIRST CHOICE
FOR ADVANCED APPLICATIONS
51
To the extent that the plan assets of the fund do not cover the obligation, the net liability is accrued under pension provisions. If the net
assets exceed the pension obligation, the exceeding amount is capitalised under “Overfunded pension benefits”.
Staff costs recognised in the respective financial year are based on expected values and include the service costs. Net interest on net
liabilities is recognised in “Finance costs - net”. Remeasurements of the net liability are recognised in other comprehensive income and
comprise gains and losses arising from the remeasurement of post-employment obligations.
Provisions for severance payments Pursuant to Austrian labour regulations, severance payments have to be paid primarily on termination
of employment by the employer or on the retirement of an employee. The liabilities are measured by qualified and independent actuaries
at each balance sheet date.
For employees who joined Austrian companies up to and including 2002, the Company has direct obligations that account for the major
part of the Group’s severance payment obligations. In accordance with IAS 19, these liabilities are calculated using the projected unit credit
method as described above and represent severance payment obligations not covered by plan assets. For employees who joined the
Company as of or after 1 January 2003, the severance payment obligation is met by regular contributions to a staff provision fund
(“Mitarbeitervorsorgekasse”). These contributions are included in staff costs. The Company has no further payment obligations once the
contributions have been paid.
For employees of the company in India, obligations for severance payments are covered by life insurance policies. Furthermore, severance
payment obligations exist for employees in South Korea and China. These obligations are measured in accordance with IAS 19 using the
projected unit credit method as described above and represent severance payment obligations not covered by plan assets.
Other employee benefits Other employee benefits include provisions for anniversary bonuses and relate to employees in Austria and China.
Anniversary bonuses are special one-off payments stipulated in the Collective Agreement which are dependent on remuneration and
duration of service. Eligibility is determined by a certain minimum length of employment. The respective liability is calculated in accordance
with the projected unit credit method based on the same parameters used for severance payments.
Staff costs recognised in the respective financial year include entitlements acquired and the actuarial results. The interest component is
recognised in “Finance costs - net”. The liabilities are measured by qualified and independent actuaries at each balance sheet date.
q. Stock appreciation rights
The Group introduced a long-term incentive programme based on stock appreciation rights (SAR). Stock appreciation rights relate to value
increases in share prices based on the performance of the share price. These rights are accounted for in accordance with IFRS 2 “Share-
based Payment”.
The fair value of the employee services rendered as consideration for the granting of SAR is recognised as an expense. Upon initial
recognition and at every balance sheet date until the liabilities are settled, SAR liabilities are measured at fair value through profit or loss,
applying the option price model. Reference is made to Note 14 “Trade and other payables”.
r. Liabilities
Financial liabilities are initially measured at fair value less transaction cost and, in subsequent periods, at amortised cost using the effective
interest rate method. Foreign currency liabilities are translated at the average exchange rate prevailing at the balance sheet date.
CONSOLIDATED FINANCIAL ­STATEMENTS
131
FIRST CHOICE
FOR ADVANCED APPLICATIONS
ANNUAL REPORT 2019/20AT S
ATS ANNUAL REPORT 2019/20 CONSOLIDATED FINANCIAL STATEMENTS FIRST CHOICE
FOR ADVANCED APPLICATIONS
52
s. Government grants
Government grants are recognised at their fair value where there is a reasonable assurance that the grants will be received and the Group
will comply with all attached conditions.
Government grants relating to costs are deferred and recognised in profit or loss over the period necessary to match them with the costs
that they are intended to compensate. Government grants relating to investments in property, plant and equipment are included in
liabilities as deferred government grants; they are recognised in profit or loss on a straight-line basis over the expected useful life of the
related assets. Government grants relating to costs and property, plant and equipment are recognised in profit or loss under other
operating result.
t. Contingent liabilities, contingent assets and other financial obligations
Contingent liabilities are not recognised in the statement of financial position, but disclosed in Note 20 in the notes to the consolidated
financial statements. They are not disclosed if an outflow of resources with economic benefit is unlikely.
A contingent asset is not recognised in the consolidated financial statements, but disclosed if the inflow of an economic benefit is likely.
u. First-time adoption of accounting standards
The following new and/or amended standards and interpretations were applied for the first time in the financial year 2019/20 and pertain
to the International Financial Reporting Standards (IFRS) as adopted by the EU.
 IFRS 16: Leases
 IFRS 9: Prepayment features with negative compensation
 IAS 28: Long-term interests in associates and joint ventures
 IAS 19: Plan amendments, curtailments and settlements
 IFRIC 23: Uncertainty over income tax treatments
 Annual improvements: IFRS 2015 – 2017: IAS 12, IAS 23, IFRS 3, IFRS 11
The changes resulting from the entry into force of these standards are explained below.
v. Future amendments to accounting standards and impact of first-time adoption
The IASB and IFRIC issued additional standards and interpretations not yet effective in the financial year 2019/20.
These have already been adopted in part by the European Union. The following standards and interpretations had already been published
by the time these consolidated financial statements were prepared and are not yet effective; they have not been adopted early in the
preparation of these consolidated financial statements:
132
CONSOLIDATED FINANCIAL ­STATEMENTSANNUAL REPORT 2019/20AT S FIRST CHOICE
FOR ADVANCED APPLICATIONSATS ANNUAL REPORT 2019/20 CONSOLIDATED FINANCIAL STATEMENTS FIRST CHOICE
FOR ADVANCED APPLICATIONS
53
Standard/Interpretation
(Content of the regulation)
Effective
date 1) EU 2)
Expected impacts on the
consolidated financial statements
IFRS 14 Regulatory Defferral Accounts Waiting for final
standard
No No major changes are expected
IFRS 17 Insurance contracts 1/1/2022 No No major changes are expected
IFRS 3 Definition of a Business Combination 1/1/2020 Yes No major changes are expected
IAS 1, IAS 8 Definition of material 1/1/2020 Yes No major changes are expected
IAS 39, IFRS 9,
IFRS 7
Interest rate benchmark reform 1/1/2020 Yes No major changes are expected
IAS 28, IFRS
10
Investments in Associates: Sales or contributions of assets
between an investor and ist associate/joint venture
Postponed
indefinitely
No No major changes are expected
Frame Work: Changes in the references of the IFRS Standards 1/1/2020 Yes No major changes are expected
1)
The Group intends to apply the new regulations for the first time in the fiscal year beginning subsequent to the effective date.
2)
Status of adoption by the EU.
IFRS 16 Leases IFRS 16 specifies the recognition of leases. This standard replaces IAS 17 and previous interpretations. Due to the new
provisions it is no longer necessary to distinguish between finance and operating leases. The standard provides a single lessee accounting
model requiring the lessee to recognise assets and liabilities for all leases in the statement of financial position, unless the term of the lease
is twelve months or less or the underlying asset has a low value of less than € 5 thousand. The simplifications are optional and applied by
ATS.
Application of this new standard is mandatory for reporting periods starting on or after 1 January 2019. Hence, the ATS Group is required
to apply IFRS 16 as of 1 April 2019 and uses the modified retrospective method. A restatement of comparative information is not necessary.
The following table shows the effects of the first-time application of IFRS 16 Leases on the opening balance at 1 April 2019:
€ in thousands 31 Mar 2019 Adjustment IFRS 16 01 Apr 2019
Assets
Land, plants and buildings 91,597 23,770 115,367
Machinery and technical equipment 624,571 – 624,571
Tools, fixtures, furniture and office equipment 9,117 2,819 11,936
Prepayments and construction in progress 52,457 – 52,457
Liabilities
Long term financial liabilities 679,076 23,409 702,485
Short term financial liabilities 37,967 3,180 41,147
CONSOLIDATED FINANCIAL ­STATEMENTS
133
FIRST CHOICE
FOR ADVANCED APPLICATIONS
ANNUAL REPORT 2019/20AT S
ATS ANNUAL REPORT 2019/20 CONSOLIDATED FINANCIAL STATEMENTS FIRST CHOICE
FOR ADVANCED APPLICATIONS
54
The operating lease obligations at 31 March 2019 resulted in the following reconciliation to the opening balance value of the lease liabilities
at 1 April 2019:
€ in thousands
Obligation from non-cancellable operating leases as at 31 March 2019 5,326
Recognition exemption for short-term leases (346)
Recognition exemption for low-value assets (656)
Adjustment due to cancellation or extension options 23,042
Lease liabilities before discounting 27,366
Discounting (777)
Lease liabilities as at 1 April 2019 according IFRS 16 26,589
The item “Adjustments arising from termination or extension options” mainly includes obligations arising from the rental of factory
premises and buildings amounting to € 17.7 million. The remaining amount primarily consists of rentals of office space as well as furniture
and office equipment. The Group assessed the underlying extension and termination options and took them into account accordingly. The
assumptions made in this context may deviate from the original estimates in the future and may have an effect on right-of-use assets and
lease liabilities.
For contracts concluded prior to the date of transition, an analysis was conducted to determine whether a lease according to IFRS 16 exists.
Direct costs were not taken into account in the measurement of right-of-use assets at the time of initial application. Moreover, previous
assessments were adopted as to whether a lease is onerous as an alternative to conducting impairment tests. As of 1 April 2019 no onerous
contracts existed.
Lease liabilities were discounted using the incremental borrowing rate at 1 April 2019. The weighted average interest rate amounted to 1.37%.
Annual improvements to IFRS 2015 – 2017 In the course of the annual improvements of IFRS (Improvements Project 2015-2017)
clarifications were made with regard to IAS 12 Income Taxes. All income tax consequences of dividend payments must be considered in
the same way as the earnings on which the dividends are based. They must therefore be recognised through profit or loss, unless the
dividends are based on income which is recognised directly through other comprehensive income or in equity.
These changes are mandatory for financial years starting on or after 1 January 2019. The application of these changes is therefore
mandatory for the ATS Group as of 1 April 2019, i.e. for the first time for the financial year 2019/20. The application must be retrospective.
Consequently, the comparative values of the previous year must be adjusted.
The positive income tax effect on hybrid capital interest of € 2,078 thousand in the financial year 2018/19 was retrospectively recognised
under the item “Income taxes” in the statement of profit or loss rather than directly in equity.
134
CONSOLIDATED FINANCIAL ­STATEMENTSANNUAL REPORT 2019/20AT S FIRST CHOICE
FOR ADVANCED APPLICATIONSATS ANNUAL REPORT 2019/20 CONSOLIDATED FINANCIAL STATEMENTS FIRST CHOICE
FOR ADVANCED APPLICATIONS
55
The following table shows the effects of the application of IAS 12 on the relevant items of the consolidated statement of profit or loss for
the financial year 2018/19:
1 Apr 2018—31 March 2019
€ in thousands
Before IAS 12
adjustment
Remeasurement
After IAS 12
adjustment
Revenue 1,027,983 – 1,027,983
Costs of sales (860,828) – (860,828)
Gross profit 167,155 – 167,155
Operating result 117,210 – 117,210
Profit/(loss) before tax 115,192 – 115,192
Income taxes (28,243) 2,078 (26,165)
Profit/(loss) for the period 86,949 2,078 89,027
The changes in IAS 12 had no effect on the consolidated statement of financial position and the consolidated statement of cash flows for
the financial year 2018/19.
The first-time adoption of the other amended standards did not result in any material effects.
C. Critical accounting estimates and assumptions used in accounting and measurement
The Group uses estimates and assumptions to determine the reported amounts of assets, liabilities, revenue and expenses, as well as
other financial liabilities, and contingent assets and liabilities. All estimates and assumptions are reviewed on a regular basis and are based
on past experiences and additional factors, including expectations regarding future events that seem reasonable under the given
circumstances. In the future, actual results may differ from these estimates. Management believes that the estimates are reasonable.
Development costs Capitalised development costs largely relate to the development of a new technology for the production of substrates
for silicon semiconductor chips at the new site in Chongqing, China. This technology was available for use from March 2016 onwards and
amortisation began. In financial year 2019/20 development costs for the new substrate generation in the amount of € 2,892 thousand
were capitalised. The use of this new production method is expected to begin in the first half of 2021/22. For the purpose of assessing
impairment of capitalised development costs, the management made assumptions in the financial year 2019/20 regarding the amount of
expected future cash flows from the project, the applicable discount rate and the period of inflow of the expected future benefit.
An increase in material assumptions would have the following impact to the impairment test as of 31 March 2020:
Pre-tax discount
Interest rate EBIT margin
+5.00% +1,5 pp
Capitalised development costs no impairment required no impairment required
CONSOLIDATED FINANCIAL ­STATEMENTS
135
FIRST CHOICE
FOR ADVANCED APPLICATIONS
ANNUAL REPORT 2019/20AT S
ATS ANNUAL REPORT 2019/20 CONSOLIDATED FINANCIAL STATEMENTS FIRST CHOICE
FOR ADVANCED APPLICATIONS
56
A reduction of material assumptions would have the following impact to the impairment test as of 31 March 2020:
Pre-tax discount
Interest rate EBIT margin
-5.00% -1,5 pp
Capitalised development costs no impairment required no impairment required
Calculation of the present values of projected employee benefit obligations The present value of non-current employee benefit obligations
depends on various factors that are based on actuarial assumptions (refer to I.B.o. “Provisions for employee benefits”).
These actuarial assumptions used to calculate the pension expenses and the expected defined benefit obligations were subjected to stress
tests using the following parameters: An increase in the interest rate, in the expected remuneration and/or in future pensions for the
Austrian entities by the percentage points stated in the table below would affect the present values of the projected pension and severance
payment obligations as follows as at 31 March 2020:
Interest rate
Increase in
remuneration Increase in pensions
€ in thousands +0.50% +0.25% +0.25%
Pension obligation (1,318) 94 620
Severance payments (1,449) 731 –
A decrease in the same parameters for the Austrian companies would have the following effects on the present value of pension and
severance payment obligations as at 31 March 2020:
Interest rate
Increase in
remuneration Increase in pensions
€ in thousands -0.50% -0.25% -0.25%
Pension obligation 1,483 (92) (553)
Severance payments 1,577 (705) –
Reference is made to Note 16 “Provisions for employee benefits”.
Measurement of deferred income tax and current tax liabilities Deferred income tax assets and liabilities are determined using the tax rates
(and laws) that have been enacted or substantively enacted by the balance sheet date and are expected to apply when the related deferred
income tax asset is realised or the deferred income tax liability is settled. A future change in tax rates would also have an impact on the
deferred tax capitalised at the balance sheet date.
Deferred income tax assets in the amount of € 61,349 thousand were not recognised for income tax loss carryforwards in the Group of
€ 408,992 thousand. If the tax losses were subsequently expected to be realised, these deferred income tax assets would have to be
recognised and a related tax income reported. Reference is made to Note 6 “Income taxes”.
Moreover, a different interpretation of tax laws by fiscal authorities could also lead to a change in income tax liabilities.
136
CONSOLIDATED FINANCIAL ­STATEMENTSANNUAL REPORT 2019/20AT S FIRST CHOICE
FOR ADVANCED APPLICATIONSATS ANNUAL REPORT 2019/20 CONSOLIDATED FINANCIAL STATEMENTS FIRST CHOICE
FOR ADVANCED APPLICATIONS
57
Other estimates and assumptions Further estimates, if necessary, relate to impairments of non-current assets and provisions, as well as
the measurement of derivative financial instruments, allowances for doubtful accounts receivable and measurements of inventory.
Reference is particularly made to Note 4 “Other operating result”, Note 7 “Property, plant and equipment”, Note 8 “Intangible assets” and
Note 17 “Other provisions”.
CONSOLIDATED FINANCIAL ­STATEMENTS
137
FIRST CHOICE
FOR ADVANCED APPLICATIONS
ANNUAL REPORT 2019/20AT S
ATS ANNUAL REPORT 2019/20 CONSOLIDATED FINANCIAL STATEMENTS FIRST CHOICE
FOR ADVANCED APPLICATIONS
58
The segment information presented below is prepared in accordance with the management approach concept as depicted in the Group’s
internal reporting (refer to Section I.B.b. “Segment Reporting”).
The reportable segments consist of the business units Mobile Devices  Substrates, Automotive, Industrial, Medical and Others. The Others
segment further includes the general holding activities of the Group. The central operating result performance indicator is the operating
result before depreciation and amortisation. The respective reconciliation to Group figures also includes the corresponding consolidation.
Transfers and transactions between the segments are executed at arm’s length, as with independent third parties. Segment reporting is
prepared in accordance with the principles set out in I.B. “Accounting and measurement policies”.
€ in thousands
Mobile Devices 
Substrates
Automotive,
Industrial, Medical Others
Elimination/
Consolidation Group
2019/20 2018/19 2019/20 2018/19 2019/20 2018/19 2019/20 2018/19 2019/20 2018/19
Segment revenue 778,457 775,959 350,446 365,219 – 5,268 (128,326) (118,463) 1,000,577 1,027,983
Internal revenue (92,589) (92,094) (35,737) (26,369) – – 128,326 118,463 – –
External revenue 685,868 683,865 314,709 338,850 – 5,268 – – 1,000,577 1,027,983
Operating result before
depreciation/amortisation 158,561 193,507 28,881 52,622 7,087 3,969 – – 194,529 250,098
Depreciation/amortisation
incl. appreciation (120,862) (112,720) (23,240) (18,570) (3,025) (1,598) – – (147,127) (132,888)
Operating result 37,699 80,787 5,641 34,052 4,062 2,371 – – 47,402 117,210
Finance costs - net (6,465) (2,018)
Profit before tax 40,937 115,192
Income taxes 1)
(19,481) (26,165)
Profit for the year 1)
21,456 89,027
Property, plant and equipment and
intangible assets 788,225 711,119 151,553 122,043 8,806 4,701 – – 948,584 837,863
Additions to property, plant and
equipment and intangible assets 215,984 69,614 33,245 36,105 5,073 3,077 – – 254,302 108,796
1)
2018/19 revised according to IAS 12
II. SEGMENT REPORTING
138
CONSOLIDATED FINANCIAL ­STATEMENTSANNUAL REPORT 2019/20AT S FIRST CHOICE
FOR ADVANCED APPLICATIONSATS ANNUAL REPORT 2019/20 CONSOLIDATED FINANCIAL STATEMENTS FIRST CHOICE
FOR ADVANCED APPLICATIONS
59
Information by geographic region
Revenue broken down by region, based on customer’s headquarters:
€ in thousands 2019/20 2018/19
Austria 16,489 19,704
Germany 141,092 173,687
Other European countries 77,932 81,153
China 26,507 14,149
Other Asian countries 54,770 56,771
Americas 683,787 682,519
Revenue 1,000,577 1,027,983
67.6% of total revenue (previous year: 64.0%) is attributable to the five largest customers in terms of revenue, where the range is between
2% and 33% as in the previous year.
Property, plant and equipment and intangible assets broken down by domicile:
€ in thousands 31 Mar 2020 31 Mar 2019
Austria 106,173 73,275
China 787,932 711,064
Others 54,479 53,524
Total 948,584 837,863
CONSOLIDATED FINANCIAL ­STATEMENTS
139
FIRST CHOICE
FOR ADVANCED APPLICATIONS
ANNUAL REPORT 2019/20AT S
ATS ANNUAL REPORT 2019/20 CONSOLIDATED FINANCIAL STATEMENTS FIRST CHOICE
FOR ADVANCED APPLICATIONS
60
1. Revenue
€ in thousands 2019/20 2018/19
Main revenue 1,000,421 1,027,829
Incidental revenue 156 154
Revenue 1,000,577 1,027,983
The main revenue is achieved by selling printed circuits boards, which are produced by ATS.
The following table shows the distribution of revenue recognised at a point in time and over time by segment:
Mobile Devices 
Substrates
Automotive, Industrial,
Medical
Others Group
€ in thousands 2019/20 2018/19 2019/20 2018/19 2019/20 2018/19 2019/20 2018/19
Segment revenue 685,868 683,865 314,709 338,850 – 5,268 1,000,577 1,027,983
Type of revenue recognition
Point in time 355,456 421,005 – – – 355,456 421,005
Over time 330,412 262,860 314,709 338,850 – 5,268 645,121 606,978
2. Types of expenses
The expense types of cost of sales, distribution costs and general and administrative costs are as follows:
€ in thousands 2019/20 2018/19
Cost of materials 404,323 377,284
Staff costs 252,513 237,781
Depreciation/amortisation 146,075 132,852
Purchased services incl. leased personnel 14,022 18,291
Energy 48,842 46,829
Maintenance (incl. spare parts) 75,071 64,950
Transportation costs 15,183 14,147
Rental and leasing expenses 6,651 8,199
Change in inventories (29,026) 1,373
Other 32,463 26,438
Total 966,117 928,144
In the financial years 2019/20 and 2018/19, the item “Other” mainly relates to travel expenses, insurance expenses, IT service costs, legal
and consulting fees.
III. NOTES TO THE CONSOLIDATED
STATEMENT OF PROFIT OR LOSS
140
CONSOLIDATED FINANCIAL ­STATEMENTSANNUAL REPORT 2019/20AT S FIRST CHOICE
FOR ADVANCED APPLICATIONSATS ANNUAL REPORT 2018/19 CONSOLIDATED FINANCIAL STATEMENTS FIRST CHOICE
FOR ADVANCED APPLICATIONS
61
3. Research and development costs
In the financial year 2019/20, the Group incurred research and development costs in the amount of € 94,765 thousand (previous year:
€ 75,650 thousand). The stated amounts represent only costs which can be directly allocated and which are recognised in the profit or loss
under cost of sales. In these consolidated financial statements, development costs of € 2,892 thousand (previous year: € 0 thousand) were
capitalised. Reference is made to Note 8 “Intangible assets”.
4. Other operating result
€ in thousands 2019/20 2018/19
Income from the reversal of government grants 1,949 1,940
Government grants for expenses 9,423 6,143
Income from exchange differences 5,730 8,464
Income from reversal of accruals/provision 65 –
Miscellaneous other income 881 2,311
Other operating income 18,048 18,858
Impairments of property, plant and equipment (912) –
Start-up losses (3,452) (1,247)
Losses from the disposal of non-current assets (732) (37)
Other costs (10) (203)
Other operating costs (5,106) (1,487)
Other operating result 12,942 17,371
In the financial years 2019/20 and 2018/19, government grants for expenses mainly relate to export refunds, research and development
grants as well as funding for industry and employment development. Start-up losses in the financial year 2019/20 resulted from the
extensions of a production line in the plant in Leoben, Austria, and in the plants in Chongqing, China, and in financial year 2018/19 from
the extensions of the plant in Fehring, Austria, and the plant in Nanjangud, India. In the financial year 2019/20 and 2018/19, the item
“Miscellaneous other income” mainly relates to write-offs of other liabilities, payments of impaired receivables, and similar to last year, to
grants for employees, and services in kind for miscellaneous projects.
CONSOLIDATED FINANCIAL ­STATEMENTS
141
FIRST CHOICE
FOR ADVANCED APPLICATIONS
ANNUAL REPORT 2019/20AT S
ATS ANNUAL REPORT 2018/19 CONSOLIDATED FINANCIAL STATEMENTS FIRST CHOICE
FOR ADVANCED APPLICATIONS
62
5. Finance costs - net
€ in thousands 2019/20 2018/19
Interest income from financial assets at fair value through profit or loss and financial assets at amortised cost 20 24
Other interest income 6,689 4,915
Gains from the measurement of derivative financial instruments at fair value, net 462 1,031
Foreign exchange gains, net 3,827 9,202
Finance income 10,998 15,172
Interest expense on bank borrowings and bonds (11,420) (12,172)
Net interest expense on personnel-related liabilities (1,124) (1,066)
Realised losses from derivative financial instruments, net (2,007) (1,133)
Other financial expenses (2,912) (2,819)
Finance costs (17,463) (17,190)
Finance costs - net (6,465) (2,018)
In accordance with IAS 23, the item “Interest expense on bank borrowings and bonds” includes capitalised borrowing costs in the amount
of € 398 thousand (previous year: € 236 thousand), net.
6. Income taxes
Income tax expenses are broken down as follows:
€ in thousands 2019/20 2018/19
Current income taxes 1)
11,981 13,623
Deferred taxes 7,500 12,542
Total tax expense 19,481 26,165
1)
2018/19 adjusted taking into account IAS 12 revised
The difference between the Group’s actual tax expense and the theoretical amount that would arise using the Austrian corporate income
tax rate is as follows:
€ in thousands 2019/20 2018/19
Expected tax expense at Austrian tax rate 10,235 28,797
Effect of different tax rates in foreign countries (1,536) (5,617)
Non-creditable foreign withholding taxes 2,501 1,857
Effect of change in valuation allowance of deferred income tax assets 10,879 4,418
Effect of the change in tax rate 3,118 3,349
Effect of permanent differences 1)
(5,975) (6,594)
Effect of taxes from prior periods 259 (45)
Total tax expense 19,481 26,165
1)
2018/19 adjusted taking into account IAS 12 revised
The effect of the change in tax rates mainly results from the reduced tax rate of 15% , which is applicable once again, with regard to the
subsidiary ATS China compared to the regular tax rate of 25%. In the course of the annual improvements of the IFRS (Improvements
Project 2015-2017), clarifications were made regarding IAS 12 Income Taxes. Therefore, the positive income tax effect on hybrid capital
142
CONSOLIDATED FINANCIAL ­STATEMENTSANNUAL REPORT 2019/20AT S FIRST CHOICE
FOR ADVANCED APPLICATIONSATS ANNUAL REPORT 2018/19 CONSOLIDATED FINANCIAL STATEMENTS FIRST CHOICE
FOR ADVANCED APPLICATIONS
63
interest of € 2,078 thousand in the financial year 2018/19 was retroactively recognised through profit or loss under “Income taxes” rather
than directly in equity. Reference is made to I. “General information”.
Deferred income tax assets and liabilities are offset when there is a legally enforceable right to offset current tax assets against current tax
liabilities and when the deferred taxes and liabilities relate to taxes levied by the same taxation authority. The amounts after setting off
deferred income tax assets against deferred liabilities are as follows:
€ in thousands 31 Mar 2020 31 Mar 2019
Assets Liabilities Assets Liabilities
Non-current assets 8,152 (10,901) 16,266 (5,083)
Provisions for employee benefits 7,258 – 6,687 –
Financial liabilities 6,443 – – –
Income tax loss carryforwards including taxable goodwill 81,001 – 68,479 –
Deferred income tax from long-term assets/liabilities 102,854 (10,901) 91,432 (5,083)
Inventories 12,790 – 12,423 –
Trade and other receivables and contract assets 51 (12,975) 56 (13,358)
Trade and other payables 1,496 – 1,587 –
Others 897 (274) 1,291 (190)
Temporary differences arising from shares in subsidiaries – (3,166) – (5,547)
Deferred income tax from short-term assets/liabilities 15,234 (16,415) 15,357 (19,095)
Deferred income tax assets/liabilities 118,088 (27,316) 106,789 (24,178)
Unrecognised deferred taxes (67,954) – (52,603) –
Deferred income tax assets/liabilities, offsetting against
the same taxation authority (24,150) 24,150 (18,631) 18,631
Deferred income tax assets/liabilities, net 25,984 (3,166) 35,555 (5,547)
As of 31 March 2020, the Group has income tax loss carryforwards and tax-deductible amortisation of goodwill amounting to a total of
€ 487,544 thousand (previous year: € 395,769 thousand). For loss carryforwards amounting to € 408,992 thousand (previous year:
€ 305,538 thousand) included in this figure, deferred income tax assets in the amount of € 61,349 thousand (previous year:
€ 45,831 thousand) were not recognised since it is unlikely that they will be realised in the foreseeable future. In addition, for temporary
differences amounting to € 44,034 thousand (previous year: € 45,147 thousand) included in this figure, deferred income tax assets in the
amount of € 6,605 thousand (previous year: € 6,772 thousand) were not recognised since it is likewise unlikely that they will be realised in
the foreseeable future.
The tax loss carryforwards, which were not recognised, can be carried forward as follows:
€ in thousands 2019/20 2018/19
Carried forward up to 5 years – 280,433
Carried forward between 6 and 10 years 377,564 25,105
Carried forward more than 10 years 31,428 –
Total unrecognised tax loss carryforwards 408,992 305,538
CONSOLIDATED FINANCIAL ­STATEMENTS
143
FIRST CHOICE
FOR ADVANCED APPLICATIONS
ANNUAL REPORT 2019/20AT S
ATS ANNUAL REPORT 2018/19 CONSOLIDATED FINANCIAL STATEMENTS FIRST CHOICE
FOR ADVANCED APPLICATIONS
64
Deferred income taxes (net) changed as follows:
€ in thousands 2019/20 2018/19
Carrying amount at the beginning of the financial year 30,008 40,461
Adjustment IFRS 15, 9 – (2,686)
Currency translation differences (427) 361
Expense recognised in profit or loss (7,500) (12,542)
Income taxes recognised in equity 737 4,414
Carrying amount at the end of the financial year 22,818 30,008
Income taxes in connection with the components of other comprehensive income are as follows:
2019/20 2018/19
€ in thousands
Income/
(expense)
before taxes
Tax
income/
(expense)
Income/
(expense)
after taxes
Income/
(expense)
before taxes
Tax
income/
(expense)
Income/
(expense)
after taxes
Currency translation differences (30,617) 325 (30,292) 26,567 (2,101) 24,466
Gains/(losses) on the measurement of hedging instruments
for cash flow hedges (2,189) 547 (1,642) (4,973) 1,243 (3,730)
Remeasurements of post-employment obligations (1,418) 327 (1,091) (7,714) 1,917 (5,797)
Other comprehensive income (34,224) 1,199 (33,025) 13,880 1,059 14,939
144
CONSOLIDATED FINANCIAL ­STATEMENTSANNUAL REPORT 2019/20AT S FIRST CHOICE
FOR ADVANCED APPLICATIONSATS ANNUAL REPORT 2019/20 CONSOLIDATED FINANCIAL STATEMENTS FIRST CHOICE
FOR ADVANCED APPLICATIONS
65
7. Property, plant and equipment
€ in thousands
Land, plants
and buildings
Machinery and
technical equipment
Tools, fixtures,
furniture and
office equipment
Prepayments and
construction
in progress Total
Carrying amount 31 Mar 2018 90,008 627,973 8,556 39,841 766,378
Exchange differences 2,315 15,550 139 1,290 19,294
Additions 6,351 48,482 3,401 48,176 106,410
Disposals ‒ (811) (43) ‒ (854)
Transfers 244 36,226 380 (36,850) ‒
Depreciation, current (7,321) (102,849) (3,316) ‒ (113,486)
Carrying amount 31 Mar 2019 91,597 624,571 9,117 52,457 777,742
Thereof
Acquisition cost 153,882 1,542,539 31,427 52,457 1,780,305
Accumulated depreciation (62,285) (917,968) (22,310) ‒ (1,002,563)
Adjustment IFRS 16 23,770 ‒ 2,819 ‒ 26,589
Carrying amount 1 Apr 2019 115,367 624,571 11,936 52,457 804,331
Exchange differences (2,573) (15,792) (206) (1,943) (20,514)
Additions 3,028 89,598 3,449 151,865 247,940
Disposals (42) (1,316) (11) (2) (1,371)
Transfers 1,888 27,516 110 (29,539) (25)
Impairment ‒ (912) ‒ ‒ (912)
Depreciation, current (10,389) (111,136) (4,415) ‒ (125,940)
Carrying amount 31 Mar 2020 107,279 612,529 10,863 172,838 903,509
Thereof
Acquisition cost 178,227 1,605,493 36,179 172,838 1,992,737
Accumulated depreciation (70,948) (992,964) (25,316) ‒ (1,089,228)
The value of the land included in “Land, plants and buildings” amounts to € 6,077 thousand (previous year: € 6,293 thousand).
The following table shows the usage rights reported separately in accordance with IFRS 16, which are included in property, plant and
equipment as of 31 March, 2020:
€ in thousands
Land, plants
and buildings
Machinery and
technical equipment
Tools, fixtures,
furniture and
office equipment
Prepayments and
construction
in progress Total
Acquisition Cost 25,367 ‒ 3,261 ‒ 28,628
Thereof additions 1,597 ‒ 442 ‒ 2,039
Depreciation (2,715) ‒ (917) ‒ (3,632)
Carrying amount 31 Mar 2020 22,652 ‒ 2,344 ‒ 24,996
IV.NOTES TO THE CONSOLIDATED
STATEMENT OF FINANCIAL POSITION
CONSOLIDATED FINANCIAL ­STATEMENTS
145
FIRST CHOICE
FOR ADVANCED APPLICATIONS
ANNUAL REPORT 2019/20AT S
ATS ANNUAL REPORT 2019/20 CONSOLIDATED FINANCIAL STATEMENTS FIRST CHOICE
FOR ADVANCED APPLICATIONS
66
In the 2019/20 financial year, the following lease expenses were showed in the income statement:
€ in thousands 2019/20 2018/19
Lease expenses from the short-term lease agreement 1,891 –
Lease expenses from the low-value lease agreements 455 –
Depreciation of rights of use 3,632 –
Interest expenses of the lease liabilities 336 –
Depreciation in the current financial year is recognised mainly in cost of sales, as well as in distribution costs, general and administrative
costs, and in start-up losses recognised under other operating result.
In the financial year 2019/20, borrowing costs on qualifying assets of € 398 thousand were capitalised (previous year: € 236 thousand).
Interest rates between 1.58% and 3.5% were applied (previous year: 3.5% and 5.0%).
There is no restraint on disposal for the recognised fixed assets.
Impairment/Reversal of impairment Impairment of machinery and technical equipment amounted to € 912 thousand (previous year:
€ 0 thousand) in the financial year 2019/20. This impairment resulted from machines that are no longer usable in the segment Mobile
Devices  Substrates.
146
CONSOLIDATED FINANCIAL ­STATEMENTSANNUAL REPORT 2019/20AT S FIRST CHOICE
FOR ADVANCED APPLICATIONSATS ANNUAL REPORT 2019/20 CONSOLIDATED FINANCIAL STATEMENTS FIRST CHOICE
FOR ADVANCED APPLICATIONS
67
8. Intangible assets
€ in thousands
Industrial property
and similar rights and
assets, and licenses in
such rights and assets
Capitalised
development costs Goodwill Prepayments
Other intangible
assets Total
Carrying amount 31 Mar 2018 11,128 64,728 ‒ ‒ ‒ 75,856
Exchange differences 26 1,254 ‒ ‒ ‒ 1,280
Additions 2,162 ‒ ‒ ‒ 224 2,386
Amortisation, current (3,364) (15,813) ‒ ‒ (224) (19,401)
Carrying amount 31 Mar 2019 9,952 50,169 ‒ ‒ ‒ 60,121
Thereof
Acquisition cost 34,113 97,396 7,255 ‒ ‒ 138,764
Accumulated amortisation (24,161) (47,227) (7,255) ‒ ‒ (78,643)
Exchange differences (23) (1,135) ‒ 1 ‒ (1,157)
Additions 3,015 2,892 ‒ 21 434 6,362
Transfers 25 ‒ ‒ ‒ ‒ 25
Amortisation, current (3,919) (15,923) ‒ ‒ (434) (20,276)
Carrying amount 31 Mar 2020 9,050 36,003 ‒ 22 ‒ 45,075
Thereof
Acquisition cost 36,933 97,957 6,902 22 ‒ 141,814
Accumulated amortisation (27,883) (61,954) (6,902) ‒ ‒ (96,739)
Amortisation for the current financial year is charged to cost of sales, distribution costs, general and administrative costs and other
operating result.
Development costs of € 2,892 thousand (previous year: € 0 thousand) were capitalised in the financial year 2019/20.
Impairment In the financial year 2019/20 no impairment was recognised on intangible assets. The impairment test for the cash-generating
unit Substrates for the not yet completed development of the next substrate generation is based on calculations of the value in use. The value
in use is determined using a DCF method. The main measurement assumptions are:
 Long-term growth rate: 0%
 (Pre-tax) discount rate: 13.04%
Due to the long-term nature of the project and to adequately account for cash outflows from the substrate business expected in future
periods, the calculation of the value in use was based on the expected cash flows for the next 6 years. A consideration over a shorter period
of time would lead to a disproportionately increased weighting of cash inflows.
CONSOLIDATED FINANCIAL ­STATEMENTS
147
FIRST CHOICE
FOR ADVANCED APPLICATIONS
ANNUAL REPORT 2019/20AT S
ATS ANNUAL REPORT 2019/20 CONSOLIDATED FINANCIAL STATEMENTS FIRST CHOICE
FOR ADVANCED APPLICATIONS
68
9. Other non-current assets
€ in thousands 31 Mar 2020 31 Mar 2019
Prepayments 5,203 5,482
Deposits made 7,893 7,333
Other non-current receivables 8,162 11,849
Carrying amount 21,258 24,664
Prepayments relate to factory premises in China. Other non-current receivables comprise input tax reimbursements in China for the plant
in Chongqing, which will be recovered gradually through VAT liabilities during the operating phase.
10. Inventories
€ in thousands 31 Mar 2020 31 Mar 2019
Raw materials and supplies 69,012 50,446
Work in progress 19,716 10,601
Finished goods 19,645 23,418
Carrying amount 108,373 84,465
The balance of inventory write-downs recognised as an expense amounts to € 22,437 thousand as of 31 March 2020 (previous year:
€ 27,489 thousand). The immaterial write-downs amounting to € 578 thousand (previous year: € 774 thousand) resulted from the
measurement of inventories at net realisable value in the financial year 2019/20. The write-downs are recognised in the cost of sales in the
statement of profit or loss.
148
CONSOLIDATED FINANCIAL ­STATEMENTSANNUAL REPORT 2019/20AT S FIRST CHOICE
FOR ADVANCED APPLICATIONSATS ANNUAL REPORT 2019/20 CONSOLIDATED FINANCIAL STATEMENTS FIRST CHOICE
FOR ADVANCED APPLICATIONS
69
11. Trade and other receivables and contract assets
The carrying amounts of trade and other receivables and contract assets are as follows:
€ in thousands 31 Mar 2020 31 Mar 2019
Trade receivables 67,413 108,488
Impairments of trade receivables (653) (390)
Contract assets 67,882 72,447
Impairments of contract assets (119) (140)
VAT receivables 42,025 35,759
Other receivables from authorities 5,227 4,375
Prepayments 6,162 5,001
Energy tax refunds 2,083 1,394
Deposits 1,423 1,353
Other receivables 990 758
Total 192,433 229,045
As at 31 March 2020 and 31 March 2019, other receivables mainly include receivables resulting from prepaid expenses and accrued
charges.
Trade receivables amounting to € 10,000 thousand (previous year: € 10,000 thousand) act as collateral in connection with various financing
agreements. Reference is made to Note 15 “Financial liabilities”.
Taking impairment into account, the carrying amounts of trade and other receivables and contract assets approximate their fair values.
Remaining maturities of receivables All receivables as at 31 March 2020 and 31 March 2019 have remaining maturities of less than one
year.
Factoring As of 31 March 2020, trade receivables totalling € 98,567 thousand (previous year: € 40,595 thousand) were assigned to banks
to the amount of 100% of the nominal value and are fully derecognised in accordance with the regulations of IFRS 9 on the basis of the
cessions of the essential opportunities and risks and on the basis of the transfer of the right to use to the acquiring party. The default risk
was assigned to the purchaser. ATS assumes a liability for default to the amount of the retention level from the credit insurance. The
maximum risk associated with liability for default was € 9,857 thousand as of 31 March 2020 (previous year: € 4,060 thousand) less
coverage of the credit insurance applied. Claims of existing credit insurances were transferred to the purchaser. The part of the purchasing
price not yet paid by the acquiring party is shown under the item “Financial assets”. Payments from customers of assigned trade receivables
are presented in the short term financial liabilities.
CONSOLIDATED FINANCIAL ­STATEMENTS
149
FIRST CHOICE
FOR ADVANCED APPLICATIONS
ANNUAL REPORT 2019/20AT S
ATS ANNUAL REPORT 2019/20 CONSOLIDATED FINANCIAL STATEMENTS FIRST CHOICE
FOR ADVANCED APPLICATIONS
70
Contract assets have developed as follows:
€ in thousands 2019/20 2018/19
Contract assets at the beginning of the financial year 72,307 48,702
Utilisation (72,307) (48,702)
Addition 67,882 72,447
Impairment according to IFRS 9 (119) (140)
Contract assets at the end of the financial year 67,763 72,307
Development of past due receivables and impairments of trade receivables
The age structure of trade receivables and impairment is shown in the table below:
31 Mar 2020
€ in thousands Gross receivables Impairments Carrying amount
not due 61,630 (183) 61,447
1 - 15 days overdue 2,563 (16) 2,547
16 - 30 days overdue 1,427 (13) 1,414
31 - 60 days overdue 866 (13) 853
61 - 90 days overdue 169 (1) 168
more than 90 days overdue 758 (427) 331
Trade receivables 67,413 (653) 66,760
31 Mar 2019
€ in thousands Gross receivables Impairments Carrying amount
not due 100,579 (177) 100,402
1 - 15 days overdue 5,574 (29) 5,545
16 - 30 days overdue 916 (8) 908
31 - 60 days overdue 971 (15) 956
61 - 90 days overdue 183 (3) 180
more than 90 days overdue 265 (158) 107
Trade receivables 108,488 (390) 108,098
There were no indications at the balance sheet date that overdue trade receivables not impaired would not be paid.
Impairments of trade receivables are recognised if there are indications (past due, insolvency) that it is unlikely that the total amount can
be collected. Receivables are derecognised if, on a legal basis, it can be assumed that no payment is to be expected anymore. There was
no write-off of trade receivables in the financial year 2019/20.
150
CONSOLIDATED FINANCIAL ­STATEMENTSANNUAL REPORT 2019/20AT S FIRST CHOICE
FOR ADVANCED APPLICATIONSATS ANNUAL REPORT 2019/20 CONSOLIDATED FINANCIAL STATEMENTS FIRST CHOICE
FOR ADVANCED APPLICATIONS
71
Impairments of trade receivables have developed as follows:
€ in thousands 2019/20 2018/19
Impairments at the beginning of the financial year 390 168
Adjustment IFRS 9 – 211
Impairments after adjustment IFRS 9 390 379
Utilisation – (17)
Reversal (93) (76)
Addition 372 92
Currency translation differences (16) 12
Impairments at the end of the financial year 653 390
Expected credit losses in accordance with the expected credit loss model according to IFRS 9 account for € 231 thousand of the impairments
of the financial year (previous year: € 236 thousand).
12. Financial assets
The carrying amounts of the financial assets are as follows:
€ in thousands 31 Mar 2020 thereof non-current thereof current
Financial assets at fair value through profit or loss 893 – 893
Financial assets at fair value through OCI 193 193 –
Financial assets at amortised cost 135,275 – 135,275
Derivatives 74 – 74
Total 136,435 193 136,242
€ in thousands 31 Mar 2019 thereof non-current thereof current
Financial assets at fair value through profit or loss 896 – 896
Financial assets at fair value through OCI 193 193 –
Financial assets at amortised cost 238,856 – 238,856
Total 239,945 193 239,752
Financial assets at fair value through profit or loss
€ in thousands 31 Mar 2020 31 Mar 2019
Bonds 893 896
Total 893 896
All bonds are denominated in euro (nominal currency).
CONSOLIDATED FINANCIAL ­STATEMENTS
151
FIRST CHOICE
FOR ADVANCED APPLICATIONS
ANNUAL REPORT 2019/20AT S
ATS ANNUAL REPORT 2019/20 CONSOLIDATED FINANCIAL STATEMENTS FIRST CHOICE
FOR ADVANCED APPLICATIONS
72
Financial assets at fair value through OCI
€ in thousands 2019/20 2018/19
Carrying amount at the beginning of the year 193 193
Additions/(Disposals) – –
Carrying amount at the end of the year 193 193
All financial assets at fair value through OCI are denominated in euro (nominal currency).
Financial assets at amortised cost Financial assets at amortised cost are denominated in euros, US dollars and Chinese yuan renminbi
(nominal currencies). They mainly consist of notice deposits with a maturity of more than three months and factored receivables against
banks.
Derivative financial instruments
€ in thousands 31 Mar 2020 31 Mar 2019
Derivative financial instruments 74 –
Total 74 –
13. Cash and cash equivalents
€ in thousands 31 Mar 2020 31 Mar 2019
Bank balances and cash on hand 417,950 326,841
Carrying amount 417,950 326,841
The reported carrying amounts correspond to the respective fair values.
152
CONSOLIDATED FINANCIAL ­STATEMENTSANNUAL REPORT 2019/20AT S FIRST CHOICE
FOR ADVANCED APPLICATIONSATS ANNUAL REPORT 2019/20 CONSOLIDATED FINANCIAL STATEMENTS FIRST CHOICE
FOR ADVANCED APPLICATIONS
73
14. Trade and other payables
Remaining maturity
€ in thousands 31 Mar 2020 Less than 1 year
Between
1 and 5 years More than 5 years
Trade payables 169,060 169,060 ‒ ‒
Government grants 14,381 1,000 8,315 5,066
Liabilities to fiscal authorities and other state authorities 5,499 5,499 ‒ ‒
Liabilities to social security authorities 8,120 8,120 ‒ ‒
Liabilities from unconsumed leave 6,300 6,300 ‒ ‒
Liabilities from stock appreciation rights 199 4 195 ‒
Liabilities to employees 17,763 17,763 ‒ ‒
Other liabilities 6,291 6,271 20 ‒
Carrying amount 227,613 214,017 8,530 5,066
Remaining maturity
€ in thousands 31 Mar 2019 Less than 1 year
Between
1 and 5 years More than 5 years
Trade payables 131,936 131,936 ‒ ‒
Government grants 16,486 1,122 7,524 7,840
Liabilities to fiscal authorities and other state authorities 3,307 3,307 ‒ ‒
Liabilities to social security authorities 5,057 5,057 ‒ ‒
Liabilities from unconsumed leave 5,888 5,888 ‒ ‒
Liabilities from stock appreciation rights 1,000 190 810 ‒
Liabilities to employees 25,170 25,170 ‒ ‒
Other liabilities 7,306 7,284 22 ‒
Carrying amount 196,150 179,954 8,356 7,840
The carrying amounts of the reported liabilities approximate the respective fair values.
Government grants Government grants mainly relate to grants for land-use rights and property, plant and equipment and are released to
profit or loss according to the useful life of the related property, plant and equipment.
Furthermore, the Group received grants for project costs for several research projects which are recognised in income on a pro rata basis
according to the costs incurred and the grant ratio. Associated deferred amounts are included in government grants.
Liabilities from stock appreciation rights Due to the expiry of the stock option plan (2009 to 2012), the 81st Supervisory Board meeting on
3 July 2014 passed a resolution to introduce a long-term incentive programme based on stock appreciation rights (SARs). SARs relate to
the value increase in share prices based on the development of the share price. SAR were granted in the period between 1 April 2014 and
1 April 2016. Due to the expiry of the stock appreciation rights plan (2014 to 2016), the 91st Supervisory Board meeting on 6 June 2016
extended the resolution to introduce a long-term incentive programme based on stock appreciation rights (SAR plan 2017) to run for three
years. The stock appreciation rights were granted between 1 April 2017 and 1 April 2019.
Each SAR entitles the holder the right to a cash settlement at the remaining amount between the exercise price and the closing price of
the ATS share on the main stock exchange on which it is listed (currently the Vienna Stock Exchange) at the date the subscription right is
exercised. The difference amount is limited to 200% of the exercise price.
CONSOLIDATED FINANCIAL ­STATEMENTS
153
FIRST CHOICE
FOR ADVANCED APPLICATIONS
ANNUAL REPORT 2019/20AT S
ATS ANNUAL REPORT 2019/20 CONSOLIDATED FINANCIAL STATEMENTS FIRST CHOICE
FOR ADVANCED APPLICATIONS
74
The exercise price of SAR is determined at the respective date of grant, corresponding to the average closing price of the ATS share on
the Vienna Stock Exchange or at the main stock exchange on which the ATS share is listed over a period of six calendar months
immediately preceding the date of grant.
SARs may be exercised in full or in part after the respective completion of a three-year period following the date of grant, but not during a
restricted period. Granted stock appreciation rights not exercised within five years after the grant date become invalid and forfeit without
compensation.
SARs may only be exercised by the beneficiaries if the following requirements are met at the date of exercise:
 The beneficiary’s employment contract with a company in the ATS Group remains valid. Subject to certain conditions, rights may also
be exercised within a year after termination of the employment contract.
 The required personal investment in the amount of 20% of the first amount granted (in SARs) in ATS shares is held. If the personal
investment is not fully established by the end of the three-year waiting period, all previously granted SARs become forfeited in full. The
established personal investment must be held over the complete period of participation in the programme and also applies to the grant
in subsequent years. The personal investment may only be wound down when exercise is no longer possible.
 The earnings per share (EPS) performance target was met. The level of attainment of the earnings per share performance indicator
determines how many of the granted SAR may actually be exercised. The target value is the EPS value determined in the mid-term plan
for the balance sheet date of the third year after the grant date. If the EPS target is attained at 100% or surpassed, the granted SARs may
be exercised in full. If attainment is between 50% and 100%, the granted SAR may be exercised on a pro rata basis. If the EPS value
attained is below 50%, the granted SARs become forfeited in full.
Number and allocation of granted SAR:
Date of grant
1 April 2019 1 April 2018 1 April 2017 1 April 2016 1 April 2015
Exercise price (in €) 17.25 21.94 9.96 13.66 10.70
31 Mar 2018 – – 290,000 110,000 95,000
Number of stock appreciation rights granted – 270,000 – – –
Number of stock appreciation rights exercised – – – – 71,967
Number of stock appreciation rights expired – – 15,000 – 14,565
31 Mar 2019 – 270,000 275,000 110,000 8,468
Number of stock appreciation rights granted 267,500 – – – –
Number of stock appreciation rights exercised – – – 56,336 8,468
Number of stock appreciation rights expired 32,500 47,500 47,500 40,662 –
31 Mar 2020 235,000 222,500 227,500 13,002 –
Remaining contract period of stock appreciation
rights granted 4 years 3 years 2 years – –
Fair value of granted stock appreciation rights as
at the balance sheet date (in € thousands)
31 Mar 2019 – 393 883 137 39
31 Mar 2020 450 49 – 4 –
154
CONSOLIDATED FINANCIAL ­STATEMENTSANNUAL REPORT 2019/20AT S FIRST CHOICE
FOR ADVANCED APPLICATIONSATS ANNUAL REPORT 2019/20 CONSOLIDATED FINANCIAL STATEMENTS FIRST CHOICE
FOR ADVANCED APPLICATIONS
75
SARs are measured at fair value at the respective balance sheet date using the Monte Carlo method and based on the model assumptions
and valuation parameters stated below. The values determined for calculation of the liabilities may differ from the values later realised on
the market.
Risk-free interest rate -0.84 to -0.91%
Volatility 42.75 to 45.80%
Volatility is calculated based on the daily share prices from 1 March 2017 until the balance sheet date.
The expenses for the stock appreciation rights are included in the administration costs.
The fair value of the SAR granted is recognised as an expense over their term.
Other liabilities Other liabilities mainly include debtors with credit balances, accrued legal, audit and consulting fees, as well as other accruals.
15. Financial liabilities
Remaining maturity
€ in thousands 31 Mar 2020 Less than 1 year
Between 1 and 5
years More than 5 years
Nominal interest
rate in %
Export loans 10,000 10,000 – – 0.24
Loans from state authorities 4,392 2,054 2,338 – 0.75 –1.00
Other bank borrowings 754,362 89,586 527,571 137,205 1.00 –4.75
Liabilities from finance leases IFRS16 24,956 3,307 21,481 168
Derivative financial instruments 1)
7,423 352 3,203 3,868
Carrying amount 801,133 105,299 554,593 141,241
Remaining maturity
€ in thousands 31 Mar 2019 Less than 1 year
Between 1 and 5
years More than 5 years
Nominal interest
rate in %
Export loans 10,000 10,000 – – 0.24
Loans from state authorities 5,494 1,751 3,402 341 0.75 –1.00
Other bank borrowings 695,927 26,216 525,969 143,742 0.85 –4.75
Liabilities from finance leases IFRS16 – – – –
Derivative financial instruments 1)
5,622 – 3,194 2,428
Carrying amount 717,043 37,967 532,565 146,511
1)
Reference is made to Note 18 “Derivative financial instruments”
With the initial application of IFRS 16 as of 1 April 2019, additional lease liabilities were recognised. In the financial year 2019/20, financial
debt from leases amounting to € 3,671 thousand was repaid and interest of € 336 thousand was paid.
Other bank borrowings mainly include long-term investment financing in addition to the current liquidity needs.
Other bank borrowings mainly include the following contracts:
CONSOLIDATED FINANCIAL ­STATEMENTS
155
FIRST CHOICE
FOR ADVANCED APPLICATIONS
ANNUAL REPORT 2019/20AT S
ATS ANNUAL REPORT 2019/20 CONSOLIDATED FINANCIAL STATEMENTS FIRST CHOICE
FOR ADVANCED APPLICATIONS
76
 Promissory note loan in FY 2013/14
 Promissory note loan in FY 2015/16
 Promissory note loan in FY 2016/17
 OeKB equity financing programme in FY 2016/17
 OeKB equity financing programme in FY 2018/19
 Promissory note loan in FY 2018/19
Financial contracts in FY 2019/20:
 Promissory note loan of € 80 million with a term to maturity of five years
 OeKB equity financing programme for a total amount of € 300 million with a term to maturity of six years, as at 31 March 2020 shown
as unused credit lines
The contractually agreed (undiscounted) interest and redemption payments of the financial liabilities as at 31 March 2020, including
interest rate hedging, are as follows in the coming financial years:
€ in thousands Export loans
Loans from state
authorities
Other bank
borrowings
Liabilities from
finance lease IFRS16
Derivative
financial
instruments
2020/21
Redemption 10,000 2,054 89,620 3,298 352
Fixed interest – 34 3,921 – –
Variable interest 24 – 5,868 275 –
2021/22
Redemption – 970 61,857 20,031 –
Fixed interest – 15 2,398 – –
Variable interest – – 5,868 175 –
2022/23
Redemption – 180 44,857 986 –
Fixed interest – 11 2,269 – –
Variable interest – – 5,293 36 –
2023/24
Redemption – 663 334,857 267 3,204
Fixed interest – 9 1,420 – –
Variable interest – – 3,643 17 –
2024/25
Redemption – 546 86,607 153 –
Fixed interest – 5 707 – –
Variable interest – – 1,993 9 –
after 2024/25
Redemption – – 137,607 167 3,868
Fixed interest – – 1,465 – –
Variable interest – – 828 4 –
No significant deviations from the agreed interest and redemption payments are expected regarding term or amount.
156
CONSOLIDATED FINANCIAL ­STATEMENTSANNUAL REPORT 2019/20AT S FIRST CHOICE
FOR ADVANCED APPLICATIONSATS ANNUAL REPORT 2019/20 CONSOLIDATED FINANCIAL STATEMENTS FIRST CHOICE
FOR ADVANCED APPLICATIONS
77
At the previous year’s balance sheet date of 31 March 2019, the contractually agreed (undiscounted) interest and redemption payments
of the financial liabilities, including interest rate hedging, were as follows for the coming financial years:
€ in thousands Export loans
Loans from state
authorities
Other bank
borrowings
Liabilities from
finance leases IFRS16
Derivative
financial
instruments
2019/20
Redemption 10,000 1,751 23,456 – –
Fixed interest – 47 4,277 – –
Variable interest 24 – 5,068 – –
2020/21
Redemption – 2,054 85,214 – 740
Fixed interest – 29 3,910 – –
Variable interest – – 5,068 – –
2021/22
Redemption – 970 61,857 – –
Fixed interest – 10 2,398 – –
Variable interest – – 5,068 – –
2022/23
Redemption – 113 44,857 – –
Fixed interest – 6 2,269 – –
Variable interest – – 4,493 – –
2023/24
Redemption – 301 334,857 – 2,454
Fixed interest – 4 1,420 – –
Variable interest – – 2,877 – –
after 2023/24
Redemption – – 144,214 – 2,428
Fixed interest – – 2,172 – –
Variable interest – – 2,273 – –
Some of the financial liabilities have interest rates that deviate from the market interest rates. For this reason, differences may arise
between their fair values and carrying amounts.
Carrying amounts Fair values
€ in thousands 31 Mar 2020 31 Mar 2019 31 Mar 2020 31 Mar 2019
Export loans 10,000 10,000 10,000 10,000
Loans from state authorities 4,392 5,494 4,424 5,542
Other bank borrowings 754,362 695,927 762,312 700,630
Liabilities from finance leases IFRS16 24,956 – 24,956 –
Derivative financial instruments 7,423 5,622 7,423 5,622
Total 801,133 717,043 809,115 721,794
The calculation of the fair values is based on the discounted value of future payments using current market interest rates, or the fair values
are determined on the basis of quoted prices.
CONSOLIDATED FINANCIAL ­STATEMENTS
157
FIRST CHOICE
FOR ADVANCED APPLICATIONS
ANNUAL REPORT 2019/20AT S
ATS ANNUAL REPORT 2019/20 CONSOLIDATED FINANCIAL STATEMENTS FIRST CHOICE
FOR ADVANCED APPLICATIONS
78
The carrying amounts of financial liabilities by currency are as follows:
€ in thousands 31 Mar 2020 31 Mar 2019
Euros 787,439 703,535
US dollars 13,694 13,508
Total 801,133 717,043
The Group’s unused credit lines are as follows:
€ in thousands 31 Mar 2020 31 Mar 2019
Export credit 22,000 22,000
Other credit 468,357 165,325
Total 490,357 187,325
16. Provisions for employee benefits
Provisions for employee benefits relate to pension commitments, severance payments and other employee benefits.
Defined contribution plans The majority of the Group’s employees in Austria and some of its employees in India are covered by defined
contribution pension plans that have been outsourced to a pension fund. For employees in Austria, the pension plans are supplemented
by death and endowment insurance policies. Employer contributions are determined on the basis of a certain percentage of current
remuneration. Employer contributions under these plans amounted to € 557 thousand in the financial year 2019/20 and to € 534 thousand
in the financial year 2018/19.
Defined benefit plans The Group operates defined benefit plans for several current and former members of the Management Board and
former executive employees with no employee contribution required. The board members’ and other executive employees’ plans are
partially funded through assets in pension funds and partially unfunded. Pension benefits of board members and executive employees are
based on their salaries and years of service. Essentially, these obligations expose the Group to life expectancy and inflation risks due to
future increases in pay and pensions, and, in the case of funded pension plans, to deviations in income.
Funded severance payments The employees in India are entitled to severance payments upon retirement or, under certain circumstances,
upon leaving the company prematurely, the amount of which depends on years of service and the remuneration received by the respective
member of staff. Severance payments range between half themonthly remuneration per year of service and a fixed maximum. Severance
payment obligations are covered by a life insurance policy. The main risk to which the Group is exposed from these obligations is the risk
of inflation due to future pay increases.
Unfunded severance payments Employees in Austria, South Korea and China are entitled to receive severance payments, which are based
upon years of service and remuneration received by the respective member of staff and are generally payable upon retirement and, under
certain circumstances, upon leaving the Company. For staff members who joined the Company before 1 January 2003, the severance
payments in Austria range from two to twelve months of monthly salary, with staff members in South Korea and China also entitled to a
158
CONSOLIDATED FINANCIAL ­STATEMENTSANNUAL REPORT 2019/20AT S FIRST CHOICE
FOR ADVANCED APPLICATIONSATS ANNUAL REPORT 2019/20 CONSOLIDATED FINANCIAL STATEMENTS FIRST CHOICE
FOR ADVANCED APPLICATIONS
79
fixed amount depending on years of service and salary. The main risk to which the Group is exposed from these obligations is the risk of
inflation due to future pay increases.
For employees in Austria who joined on or after 1 January 2003, regular contributions are paid to a staff provision fund
(“Mitarbeitervorsorgekasse”) without any further obligations on the part of the Group. The contributions for the financial year 2019/20
amounted to € 515 thousand and for the financial year 2018/19 to € 462 thousand.
Other employee benefits The employees of the companies in Austria and China are entitled to anniversary bonuses for long-term service,
the eligibility to and amount of which in Austria are stipulated in the Collective Agreement.
Expenses for (defined benefit) pension obligations, severance payments and other employee benefits consist of the following:
Retirement benefits Severance payments
Other
employee benefits
€ in thousands 2019/20 2018/19 2019/20 2018/19 2019/20 2018/19
Current service cost 141 118 2,109 2,025 2,141 2,084
Interest expense 156 42 557 582 201 210
Remeasurement of obligations from other employee benefits – – – – 846 1,874
Expenses recognised in profit for the period 297 160 2,666 2,607 3,188 4,168
Remeasurement of obligations from post-employment benefits (856) 6,503 2,274 1,210 – –
Expenses/(Income) recognised in other comprehensive income (856) 6,503 2,274 1,210 – –
Total (559) 6,663 4,940 3,817 3,188 4,168
Expenses for retirement, severance payments and other employee benefits are recognised in profit or loss under cost of sales, distribution
costs, general and administrative costs and in other comprehensive income. Net interest expense on personnel-related liabilities is
presented in “Finance costs - net”.
Amounts accrued in the statement of financial position are:
€ in thousands 31 Mar 2020 31 Mar 2019
Funded pension benefits 6,714 7,305
Unfunded pension benefits 1,353 1,388
Total pension benefits 8,067 8,693
Unfunded severance payments 31,378 28,317
Funded severance payments 529 383
Total severance payments 31,907 28,700
Other employee benefits 11,270 11,016
Provisions for employee benefits 51,244 48,409
CONSOLIDATED FINANCIAL ­STATEMENTS
159
FIRST CHOICE
FOR ADVANCED APPLICATIONS
ANNUAL REPORT 2019/20AT S
ATS ANNUAL REPORT 2019/20 CONSOLIDATED FINANCIAL STATEMENTS FIRST CHOICE
FOR ADVANCED APPLICATIONS
80
Pension obligations and severance payments are as follows:
Retirement benefits Severance payments
€ in thousands 31 Mar 2020 31 Mar 2019 31 Mar 2020 31 Mar 2019
Present value of funded obligations 16,840 16,684 1,766 1,590
Fair value of plan assets (10,126) (9,379) (1,237) (1,207)
Funded status of funded obligations 6,714 7,305 529 383
Present value of unfunded obligations 1,353 1,388 31,378 28,317
Provisions recognised in the statement of financial position 8,067 8,693 31,907 28,700
The present value of projected pension benefits, the movement in plan assets (held to cover the pension benefits) and funded status are
as follows:
Funded
retirement benefits
Unfunded
retirement benefits
€ in thousands 2019/20 2018/19 2019/20 2018/19
Present value of pension obligation:
Present value at the beginning of the financial year 16,683 12,952 1,388 1,180
Current service cost 141 118 – –
Interest expense 300 259 25 24
Remeasurement from the change in demographic assumptions – 1,991 – 122
Remeasurement from the change in financial assumptions – 1,956 134 124
Remeasurement from adjustments based on past experience 187 (130) (127) 4
Benefits paid (471) (463) (67) (66)
Present value at the end of the financial year 16,840 16,683 1,353 1,388
Fair value of plan assets:
Fair value at the beginning of the financial year 9,378 12,036
Investment result 1,050 (2,436)
Interest income 169 241
Benefits paid (471) (463)
Fair value at the end of the financial year 10,126 9,378
Funded status of funded pension benefits 6,714 7,305
As at 31 March 2020, the average maturity of funded pension benefits is 16 years and unfunded pension benefits 12 years.
Plan assets held to cover the pension obligations have been transferred to pension funds. The diversification of the portfolio is as follows:
in % 31 Mar 2020 31 Mar 2019
Debt securities 34% 30%
Equity securities 54% 58%
Real estate 5% 5%
Cash and cash equivalents 7% 7%
Total 100% 100%
160
CONSOLIDATED FINANCIAL ­STATEMENTSANNUAL REPORT 2019/20AT S FIRST CHOICE
FOR ADVANCED APPLICATIONSATS ANNUAL REPORT 2019/20 CONSOLIDATED FINANCIAL STATEMENTS FIRST CHOICE
FOR ADVANCED APPLICATIONS
81
A significant portion of plan assets is traded in an active market.
The aggregate movement in funded and unfunded severance payments is as follows:
Funded
severance payments
Unfunded
severance payments
€ in thousands 2019/20 2018/19 2019/20 2018/19
Present value of severance payment obligation:
Present value at the beginning of the financial year 1,589 1,427 28,317 25,932
Exchange differences (109) 51 (238) 92
Service cost 106 90 2,003 1,936
Interest cost 117 104 530 548
Remeasurement from the change in demographic assumptions – (19) (121) (285)
Remeasurement from the change in financial assumptions 107 (145) 2,447 1,211
Remeasurement from adjustments based on past experience 55 126 (211) 335
Benefits paid (99) (45) (1,349) (1,452)
Present value at the end of the financial year 1,766 1,589 31,378 28,317
Fair value of plan assets:
Fair value at the beginning of the financial year 1,206 934
Exchange differences (77) 40
Contributions 115 195
Investment result 2 13
Interest income 90 69
Benefits paid (99) (45)
Fair value at the end of the financial year 1,237 1,206
Funded status of funded severance payments 529 383
As at 31 March 2020, the average maturity of unfunded severance payments is 12 years.
The aggregate movement in other employee benefits (anniversary bonuses) is as follows:
€ in thousands 2019/20 2018/19
Present value at the beginning of the financial year 11,016 8,801
Exchange differences (141) 150
Service cost 2,141 2,084
Interest expense 201 211
Remeasurement from the change in demographic assumptions (183) 1,116
Remeasurement from the change in financial assumptions 210 231
Remeasurement from adjustments based on past experience 819 527
Benefits paid (2,793) (2,104)
Present value at the end of the financial year 11,270 11,016
At 31 March 2020, the average maturity of other employee benefits is 11 years.
CONSOLIDATED FINANCIAL ­STATEMENTS
161
FIRST CHOICE
FOR ADVANCED APPLICATIONS
ANNUAL REPORT 2019/20AT S
ATS ANNUAL REPORT 2019/20 CONSOLIDATED FINANCIAL STATEMENTS FIRST CHOICE
FOR ADVANCED APPLICATIONS
82
The following weighted actuarial parameters were used for the measurement at the balance sheet date:
Retirement benefits Severance payments
Other employee benefits
(anniversary bonuses)
31 Mar 2020 31 Mar 2019 31 Mar 2020 31 Mar 2019 31 Mar 2020 31 Mar 2019
Discount rate 1.80% 1,80% 1.90% 2.22% 1.93% 2.18%
Expected rate of remuneration increase 2.25% 2.25% 3.62% 3.26% 5,01% 4.06%
Expected rate of pension increase 1.80% 1.80% – – – –
Retirement age 65 65 1) 1) – –
‘1)
Individual according to respective local legislation
Attrition rates and biometric data are included in the calculation of the provisions.
17. Other provisions
€ in thousands Total Warranty Others
Carrying amount 31 Mar 2019 4,175 1,053 3,122
Utilisation (1,701) (200) (1,501)
Reversal (234) (218) (16)
Addition 3,214 2,547 667
Exchange differences (217) (129) (88)
Carrying amount 31 Mar 2020 5,237 3,053 2,184
€ in thousands Total Warranty Others
Carrying amount 31 Mar 2018 5,942 2,526 3,416
Utilisation (1,397) (97) (1,300)
Reversal (1,830) (1,811) (19)
Addition 1,338 415 923
Exchange differences 122 20 102
Carrying amount 31 Mar 2019 4,175 1,053 3,122
€ in thousands 31 Mar 2020 31 Mar 2019
thereof non-current – –
thereof current 5,237 4,175
Carrying amount 5,237 4,175
Warranty provision This item relates to the costs of existing and expected complaints about products still under warranty. The accrued
amount is the best estimate of these costs based on past experience and actual facts, and is not yet recognised as a liability due to the
uncertainty as to amount and timing. The amount of expected costs includes amounts assumed from product liability insurance.
Others This item relates substantially to provisions for risks from pending losses on onerous contracts and to provisions for the risks
associated with pension scheme contributions in Asia resulting from the uncertain legal situation there.
162
CONSOLIDATED FINANCIAL ­STATEMENTSANNUAL REPORT 2019/20AT S FIRST CHOICE
FOR ADVANCED APPLICATIONSATS ANNUAL REPORT 2019/20 CONSOLIDATED FINANCIAL STATEMENTS FIRST CHOICE
FOR ADVANCED APPLICATIONS
83
18. Derivative financial instruments
Derivative financial instruments relate to interest rate swaps and currency swaps. Payments related to loans and receivables and trade
receivables are hedged. Currency swaps are also used to temporarily balance out liquidity between different currencies. The currency swap
included as of 31 March 2020 serves exclusively for short-term liquidity balancing between the euro and the US dollar. The volume amounts
to € 7.0 million.
The carrying amounts of the Group’s derivative financial instruments correspond to their fair values. The fair value corresponds to the
amount that would be incurred or earned if the transaction had been settled at the balance sheet date.
The fair values of the derivative financial instruments are as follows at the balance sheet date:
31 Mar 2020 31 Mar 2019
€ in thousands Assets Liabilities Assets Liabilities
Currency swaps at fair value 74 – – –
Interest rate swaps at fair value – 7,423 – 5,622
Total market values 74 7,423 – 5,622
Current portion 74 352 – –
Non-current portion – 7,071 – 5,622
As of 31 March 2020, the fixed interest rates for interest rate swaps range between 0.1719% and 0.545%, the variable interest rate is based
on the six-month EURIBOR.
Based on the various scenarios, the Group hedges its cash flow interest rate risk using interest rate swaps. Such interest rate swaps have
the economic effect of converting loans from floating rates to fixed rates. If the Group takes out loans at floating rates, it uses swaps to
convert such loans into fixed rate loans. Under these interest rate swaps, the Group agrees with other parties to exchange, at specified
intervals, the difference between the fixed and variable interest rates calculated by reference to the agreed nominal amounts. Through
the prepayment of the variable parts of the promissory note loan in the financial year 2015/16 from 2014, the basis for hedge accounting
was eliminated. The existing interest rate swaps are now used for other floating rate loans. Due to different maturities and amounts, no
effective hedging relationship can be established pursuant to IAS 39, which is a prerequisite for recognising gains and losses in other
comprehensive income. Subsequent measurement of interest rate swaps is recognised in profit or loss under “Finance costs”.
The nominal amounts and the fair values of derivative financial instruments relating to not effective hedges against interest rate
fluctuations are as follows at the balance sheet date, presented by currency:
31 Mar 2020 31 Mar 2019
Currency
Nominal amount
in 1,000 local currency
Market value
€ in thousands
Nominal amount
in 1,000 local currency
Market value
€ in thousands
Euro 22,500 (352) 22,500 (740)
CONSOLIDATED FINANCIAL ­STATEMENTS
163
FIRST CHOICE
FOR ADVANCED APPLICATIONS
ANNUAL REPORT 2019/20AT S
ATS ANNUAL REPORT 2019/20 CONSOLIDATED FINANCIAL STATEMENTS FIRST CHOICE
FOR ADVANCED APPLICATIONS
84
The remaining terms of derivative financial instruments of not effective hedges are as follows at the balance sheet date:
in months 31 Mar 2020 31 Mar 2019
Interest rate swaps 11 23
In the financial years 2017/18 and 2018/19 new interest rate swaps were signed, which are used for floating rate loans and recognised as
financial liabilities. As they have the same maturity and amount, there is an effective hedging relationship, which is a precondition according
IAS 39 that assumes no influence of gains and losses on profit or loss. As a consequence the gains and losses from the ongoing subsequent
measurement are recognised in the other comprehensive income.
The terms of the interest rate swaps employed as hedging instruments are as follows:
€ in thousands, in months, in % Nominal volume Maturity
Average hedged interest rate
during the period
Interest rate swaps 258,000 37 - 64 months 0,1719% - 0,5450%
The value of the interest rate swaps employed as hedging instruments developed as follows:
Carrying amount of the hedging instrument 1)
€ in thousands Assets Liabilities
Change in fair value of
the hedging instrument
on which the calculation
of ineffectiveness is
based
Change in fair value of
the hedging instrument
recognised in the cash
flow hedge reserve
as per 31 Mar 2020 – 7,071 – (2,190)
as per 31 Mar 2019 – 4,882 – (4,983)
1)
Interest rate swaps are reported under financial liabilities.
The development of value of the hedged items (floating rate loans) and the cash flow hedge reserve in equity are shown in the following table:
€ in thousands
Change in fair value of
the hedged item on
which the calculation of
ineffectiveness is based
Hedge ineffectiveness
recognised in PL
during the period
Cash flow hedge reserve
as of 31 Mar 2020
Amounts reclassified
from the cash flow
hedge reserve to PL
during the period 1)
31 Mar 2020 – – 7,071 –
31 Mar 2019 – – 4,882 –
1)
Amounts reclassified from the cash flow hedge reserve to the statement of profit or loss are recognised in finance costs.
19. Additional disclosures on financial instruments
Carrying amounts and fair values by measurement category The carrying amounts and fair values of financial instruments included in
several items in the statement of financial position by measurement category are as follows at the balance sheet date. Unless otherwise
stated, carrying amounts correspond approximately to the fair values:
164
CONSOLIDATED FINANCIAL ­STATEMENTSANNUAL REPORT 2019/20AT S FIRST CHOICE
FOR ADVANCED APPLICATIONSATS ANNUAL REPORT 2019/20 CONSOLIDATED FINANCIAL STATEMENTS FIRST CHOICE
FOR ADVANCED APPLICATIONS
85
31 Mar 2020
€ in thousands
Measurement categories in accordance
with IFRS 9 or measurement in accord.
with other IFRSs 1)
Level Carrying amount Fair value
Assets
Non-current assets
Derivative financial instruments DHI 2 – –
Other financial assets FAAFVOCI 2 193 193
Financial assets 193 193
Current assets
Trade receivables less impairments FAAC 63,142 66,760
Trade receivables FAAFVOCI 3 3,618 3,618
Contract assets less impairments – 3 67,763
Other receivables FAAC 991 991
Other receivables – 56,919 124,682
Trade and other receivables 192,433 192,433
Derivative financial instruments DHI 2 74
Financial assets FAAFVPL 1 893 893
Financial assets FAAC 135,275 135,276
Financial assets 136,242 893
Cash and cash equivalents FAAC 417,950 417,950
Cash and cash equivalents 417,950 417,950
Liabilities
Other financial liabilities FLAAC 2 793,710 801,692
Derivative financial instruments DHI 2 7,423 7,423
Non-current and current financial liabilities 801,133 809,115
Trade payables FLAAC 169,060 169,060
Other payables FLAAC 17,763 17,763
Other payables – 40,790 40,790
Trade and other non-current and current payables 227,613 227,613
Aggregated by measurement categories
Assets
At amortised cost FAAC 617,358 –
Financial assets at fair value through OCI FAAFVOCI 3,811 –
Financial assets at fair value through profit or loss FAAFVPL 893 –
Derivatives as hedging instruments DHI 74 –
Liabilities
Financial liabilities at amortised cost FLAAC 980,533 –
Derivatives as hedging instruments DHI 7,423 –
1)
FAAC: Financial assets at amortised costs
FAAFVOCI: Financial assets at fair value through OCI
FAAFVPL: Financial assets at fair value through profit or loss
DHI: Derivatives as hedging intruments
FLAAC: Financial liabilities at amortised cost
CONSOLIDATED FINANCIAL ­STATEMENTS
165
FIRST CHOICE
FOR ADVANCED APPLICATIONS
ANNUAL REPORT 2019/20AT S
ATS ANNUAL REPORT 2019/20 CONSOLIDATED FINANCIAL STATEMENTS FIRST CHOICE
FOR ADVANCED APPLICATIONS
86
31 Mar 2019
€ in thousands
Measurement categories in accordance
with IAS 39 or measurement in accord.
with other IFRSs 1)
Level Carrying amount Fair value
Assets
Non-current assets
Derivative financial instruments DHI 2 – –
Other financial assets FAAFVOCI 2 193 193
Financial assets 193 193
Current assets
Trade receivables less impairments FAAC 108,098 108,098
Contract assets less impairments – 72,307
Other receivables FAAC 757 757
Other receivables – 47,883 120,190
Trade and other receivables 229,045 229,045
Financial assets FAAFVPL 1 896 896
Financial assets FAAC 238,856 238,856
Financial assets 239,752 896
Cash and cash equivalents FAAC 326,841 326,841
Cash and cash equivalents 326,841 326,841
Liabilities
Other financial liabilities FLAAC 2 711,421 716,172
Derivative financial instruments DHI 2 4,882 4,882
Derivative financial instruments FVPL 2 740 740
Non-current and current financial liabilities 717,043 721,794
Trade payables FLAAC 131,936 131,936
Other payables FLAAC 25,170 25,170
Other payables – 39,044
Trade and other non-current and current payables 196,150 196,150
Aggregated by measurement categories
Assets
At amortised costs FAAC 674,552 –
Financial assets at fair value through OCI FAAFVOCI 193 –
Financial assets at fair value through profit or loss FAAFVPL 896 –
Derivatives as hedging instruments DHI – –
Liabilities
Financial liabilities at amortised costs FLAAC 868,527 –
Derivatives as hedging instruments DHI 4,882 –
Derivatives FVPL 740 –
1)
FAAC: Financial assets at amortised cost
FAAFVOCI: Financial assets at fair value through OCI
FAAFVPL: Financial assets at fair value through profit or loss
DHI: Derivatives as hedging instruments
FLAAC: Financial liabilities at amortised cost
FVPL: Derivates at fair value through profit or loss
166
CONSOLIDATED FINANCIAL ­STATEMENTSANNUAL REPORT 2019/20AT S FIRST CHOICE
FOR ADVANCED APPLICATIONSATS ANNUAL REPORT 2019/20 CONSOLIDATED FINANCIAL STATEMENTS FIRST CHOICE
FOR ADVANCED APPLICATIONS
87
When measuring fair value, a distinction needs to be made between three valuation hierarchies:
 Level 1: The fair values are determined based on quoted market prices in an active market for identical financial instruments.
 Level 2: If quoted market prices in active markets are not available, the fair values are determined based on the results of a measurement
method that is based to the greatest possible extent on market prices.
 Level 3: In this case, the fair values are determined using measurement models which are not based on observable market data.
Net results relating to financial instruments by measurement category Net gains or net losses relating to financial assets and liabilities by
measurement category are as follows:
€ in thousands 2019/20 2018/19
Amortised cost 17,269 27,770
Fair value through other comprehensive income 9 9
Fair value through profit or loss (1,537) 2,314
Financial liabilities at amortised cost (13,654) (18,196)
Total 2,087 11,897
The net results relating to financial instruments include dividend income, interest income and expenses, foreign exchange gains and losses,
realised gains and losses on the disposal and sale, as well as income and expenses recognised in profit or loss from the measurement of
financial instruments.
€ 5,261 thousand in net income (previous year: € 8,365 thousand in net income) of the total net result from financial instruments is
included in the operating result and contains mainly foreign exchange effects, and € 3,174 thousand in net expenses (previous year:
€ 3,532 thousand in net income) in “Finance costs – net”.
Financial risks
In the following, the financial risks, which comprise the financing risk, the liquidity risk, the credit risk, and the foreign exchange risk, are
addressed. In the Group Management Report, further risk categories and the related processes and measures are outlined.
Risk management of financial risks is carried out by the central treasury department (Group Treasury) under policies approved by the
Management Board. Responsibilities, authorisations and limits are governed by these internal guidelines. Group Treasury identifies,
evaluates and hedges financial risks in close cooperation with the Group’s operating units.
Financing risk The financing risk relates to securing the long-term funding of the Group and to fluctuations in the value of financial
instruments.
On the assets side, the Group is exposed to low interest rate risks with regard to its securities portfolio. Other liquid funds are mainly
invested short-term. Reference is made to Note 12 “Financial assets” and Note 13 “Cash and cash equivalents”.
On the liabilities side, 68.0% (previous year: 76.9%) of the total bonds and bank borrowings are subject to fixed interest rates, taking into
account interest rate hedging instruments. Reference is made to Note 15 “Financial liabilities”.
CONSOLIDATED FINANCIAL ­STATEMENTS
167
FIRST CHOICE
FOR ADVANCED APPLICATIONS
ANNUAL REPORT 2019/20AT S
ATS ANNUAL REPORT 2019/20 CONSOLIDATED FINANCIAL STATEMENTS FIRST CHOICE
FOR ADVANCED APPLICATIONS
88
The financial liabilities of the Group are linked to loan commitments that are customary in the market. These commitments are reviewed
on a quarterly or an annual basis. In the event of non-compliance with these commitments, the lenders have a right of notice.
Liquidity risk In the Group, liquidity risk refers to the circumstance of insolvency. Therefore, sufficient liquidity shall be available at all times
to be able to meet the current payment obligations on time.
As of 31 March 2020, the Group has liquidity reserves of € 1.044.8 million (previous year: € 754.1 million). This comprises € 554.4 million
(previous year: € 566.8 million) in cash and cash equivalents, held-to-maturity investments, securities held for trading and available-for-
sale, and € 490.4 million (previous year: € 187.3 million) in available unused credit facilities. Thus, the liquidity reserves increased by
€ 290.7 million year-on-year and include € 39.3 million (previous year: € 43.4 million) in current reserves, which relate to ATS in China
and are subject to specific liquidity requirements.
Credit risk In the Group, credit risk refers to the potential for payment default by customers. The Group has always managed to establish
strong partnerships with its largest customers.
The credit risk is kept to a minimum by means of a comprehensive process. Customers are subject to regular credit assessments and their
receivables are covered by insurance to a large extent. Non-insured receivables are continuously monitored and, if any risks are identified,
the deliveries are made only against advance payments or bank guarantees. In the financial year 2019/20, € 0.7 million (previous year:
€ 0.4 million) or 1.0% (previous year: 0.4%) of receivables were impaired.
Reference is made to the detailed disclosures in Note 11 “Trade and other receivables”.
Foreign exchange risk As a globally operating entity, the ATS Group is exposed to foreign exchange risk. “Natural hedges” exist in part
through local added value created at the various sites. Within the Group, transaction risks are initially managed by closing positions
(netting). Open positions are continuously analysed and hedged using different hedging instruments such as forward contracts, currency
options and currency swaps. No such instruments exist on the balance sheet date.
Sensitivity analyses are performed to assess the foreign exchange risk, with – all else being equal – the effects of percentage changes in
foreign exchange rates being simulated against each other.
Financial market risks Detailed information on financial market risks and derivative financial instruments is contained in Section I.B.I.
“Accounting and measurement policies: Derivative financial instruments” and in Note 18 “Derivative financial instruments”. The Group
uses derivative financial instruments, such as forward contracts, options and swaps, exclusively for hedging purposes.
Evaluation of financial market risks using sensitivity analyses The Group applies sensitivity analyses to quantify the interest rate and
currency risks. In gap analyses, the potential change in profit/loss resulting from a 1% change in price (exchange rate or interest rate) of
the foreign currency or net interest position is determined. Correlations between different risk elements are not included in these analyses.
The impact on profit/loss is determined taking into account income tax effects on the profit for the year after tax.
There are two different risks regarding changes in interest. In case of financing with fixed interest rates, the risk arises if the interest rate
decreases and, in case of financing with variable interest rates, the risk consists of increasing interest rates (converse relating to disposition).
The impact on profit/loss only results from changes in variable interest rates. ATS counteract interest rate risks with two measures: by
168
CONSOLIDATED FINANCIAL ­STATEMENTSANNUAL REPORT 2019/20AT S FIRST CHOICE
FOR ADVANCED APPLICATIONSATS ANNUAL REPORT 2019/20 CONSOLIDATED FINANCIAL STATEMENTS FIRST CHOICE
FOR ADVANCED APPLICATIONS
89
using derivative financial instruments and by increasing the risk spread of interest development due to financing in different currencies.
The table below shows the effect on financial liabilities:
€ in thousands 31 Mar 2020
Before Hedging EUR USD Others Total In %
Fixed interest rate 228,191 13,694 – 241,885 31.5%
Variable interest rate 526,869 – – 526,869 68.5%
Total 755,060 13,694 – 768,754 100.0%
In % 98.2% 1.8% – 100.0%
After Hedging
Fixed interest rate 508,691 13,694 – 522,385 68.0%
Variable interest rate 246,369 – – 246,369 32.0%
Total 755,060 13,694 – 768,754 100.0%
In % 98.2% 1.8% – 100.0%
€ in thousands 31 Mar 2019
Before Hedging EUR USD Others Total In %
Fixed interest rate 252,758 13,509 – 266,267 37.4%
Variable interest rate 445,155 – – 445,155 62.6%
Total 697,913 13,509 – 711,422 100.0%
In % 98.1% 1.9% – 100.0%
After Hedging
Fixed interest rate 533,258 13,509 – 546,767 76.9%
Variable interest rate 164,655 – – 164,655 23.1%
Total 697,913 13,509 – 711,422 100.0%
In % 98.1% 1.9% – 100.0%
If the EUR interest rates at the balance sheet date had been 100 basis points higher, based on the financing structure at the balance sheet
date, the profit for the year would have been € 1.3 million lower (previous year: € 1.0 million), provided all other variables remained
constant. A decline in the EUR interest rates would not have had any impact on the profit for the year. If the USD interest rates at the
balance sheet date had been 100 basis points higher (or lower), based on the financing structure at the balance sheet date, the profit for
the year would have been € 0.0 million lower (previous year: € 0.0 million) or € 0.0 million higher (previous year: € 0.0 million), provided
all other variables remained constant.
The effect of this interest rate sensitivity analysis is based on the assumption that the interest rates would deviate by 100 basis points
during an entire financial year and the new interest rates would have to be applied to the amount of equity and liabilities at the balance
sheet date.
According to IFRS 7, the impact of hypothetical changes in exchange rates on the profit for the year results from monetary financial
instruments which are not denominated by the functional currency of the reporting company. Hence, the effect on profit/loss is calculated
based on receivables, payables and financial balances respectively foreign currency derivatives. At ATS, the risk primarily contains USD
balances. Therefore, a sensitivity analysis is only carried out for this currency. The average changes in USD/EUR closing rates in the last 5
years amount to 6.0% (previous year: 9.0%). An increase in the US dollar exchange rate of 6.0% against the euro would have had a positive
CONSOLIDATED FINANCIAL ­STATEMENTS
169
FIRST CHOICE
FOR ADVANCED APPLICATIONS
ANNUAL REPORT 2019/20AT S
ATS ANNUAL REPORT 2019/20 CONSOLIDATED FINANCIAL STATEMENTS FIRST CHOICE
FOR ADVANCED APPLICATIONS
90
impact on the profit for the year in the amount of € 11.1 million (previous year: € 20.5 million). Devaluation of the US dollar exchange rate
against the euro would have reduced the profit for the year by € 11.1 million (previous year: € 20.5 million).
Capital risk management The objectives of the Group in respect of capital management include, firstly, securing the Company as a going
concern in order to be able to continue providing the shareholders with dividends and the other stakeholders with their due services and,
secondly, maintaining an appropriate capital structure in order to optimise capital costs. Therefore, the amount of the dividend payments
is adjusted to the respective requirements, capital is repaid to shareholders (withdrawal of treasury shares), new shares are issued or the
portfolio of other assets is changed.
Based on the covenants defined in the credit agreements, the Group monitors its capital based on the equity ratio as well as the ratio of
net debt to EBITDA (theoretical payback period for debts).
The Group’s strategy is not to fall below an equity ratio of 40% and not to exceed a theoretical payback period for debts of 3.0 years,
creating sufficient leeway to cushion the effects of adverse business developments and to secure the Company as a going concern even in
times of crisis. Temporary deviations from the values are acceptable.
At the balance sheet date, the equity ratio was 41.0% and thus below the previous year’s figure of 45.0%. At 1.3 years, the theoretical
payback period for debts was above the previous year’s figure of 0.6 years.
20. Contingent liabilities and other financial commitments
As of 31 March 2020, the Group has other financial commitments amounting to € 225,552 thousand (previous year: € 100,136 thousand)
in connection with contractually binding investment projects. As of 31 March 2020, the maximum risk associated with liability for default
was € 9,857 thousand (previous year: € 4,060 thousand) less coverage of the credit insurance applied. The liability for default corresponds
to the theoretical maximum loss if a default of all transferred receivables incurs. The probability of needing to fall back on this liability is
extremely low. The fair value of this risk is not material. Furthermore, at the balance sheet date the Group has no contingent liabilities from
bank guarantees (previous year: € 0 thousand). There were no contingent liabilities from guarantees at the balance sheet date (previous
year: € 0 thousand).
21. Share capital
Outstanding shares
in thousand shares
Ordinary shares
€ in thousands
Share premium
€ in thousands
Share capital
€ in thousands
31 Mar 2018 38,850 42,735 99,111 141,846
31 Mar 2019 38,850 42,735 99,111 141,846
31 Mar 2020 38,850 42,735 99,111 141,846
Ordinary shares The ordinary shares of the Company as of 31 March 2020 amounting to € 42,735 thousand are fully paid in (previous year:
€ 42,735 thousand) and are made up of 38,850,000 (previous year: 38,850,000) no-par value bearer shares with a notional value of € 1.10
each.
170
CONSOLIDATED FINANCIAL ­STATEMENTSANNUAL REPORT 2019/20AT S FIRST CHOICE
FOR ADVANCED APPLICATIONSATS ANNUAL REPORT 2019/20 CONSOLIDATED FINANCIAL STATEMENTS FIRST CHOICE
FOR ADVANCED APPLICATIONS
91
Approved capital and conditional capital increase By way of a resolution passed at the 25th
Annual General Meeting on 4 July 2019, the
Management Board was authorised until 3 July 2024 to increase the Companys ordinary shares, subject to the approval of the Supervisory
Board, by up to € 21,367,500 by way of issuing up to 19,425,000 no-par value bearer shares, for contributions in cash or kind, in one or
several tranches, also by way of indirect subscription rights, after having been taken over by one or more credit institutions in accordance
with Section 153 (6) of the Austrian Stock Corporation Act (AktG). The Management Board was authorised, subject to the approval of the
Supervisory Board, to determine the detailed terms and conditions of issue (in particular the issue amount, what the contribution in kind
entails, the content of the share rights, the exclusion of subscription rights, etc.) (approved capital). The Supervisory Board was authorised
to adopt amendments to the Articles of Association resulting from the issuance of shares from the approved capital.
Furthermore, by resolution of the 25th
Annual General Meeting of 4 July 2019, the Management Board was authorised until 3 July 2024,
subject to the approval of the Supervisory Board, to issue one or several convertible bearer bonds at a total nominal amount of up to
€ 150,000,000 and to grant to bearers of convertible bonds conversion rights and/or subscription rights for up to 19,425,000 new no-par
value bearer shares in the Company in accordance with the convertible bond conditions to be defined by the Management Board. The
Management Board was also authorised to completely or partially exclude shareholders’ subscription rights to the convertible bonds.
Furthermore, in doing so, the Company’s ordinary shares were conditionally increased by up to € 21,367,500 by way of issuance of up to
19,425,000 new no-par value bearer shares in accordance with Section 159 (2) No. 1 of the Austrian Stock Corporation Act (AktG). This
conditional capital increase will only be carried out if the bearers of convertible bonds issued based on the authorisation resolution passed
at the Annual General Meeting on 4 July 2019 claim the right to conversion and/or subscription granted to them with regard to the
Company’s shares. Furthermore, the Management Board was authorised to determine, subject to approval from the Supervisory Board, the
further details of carrying out the conditional capital increase (particularly the issue amount and the content of the share rights). The
Supervisory Board was authorised to adopt amendments to the Articles of Association resulting from the issuance of shares from the
conditional capital. The same applies in case the authorisation to issue convertible bonds is not exercised or the conditional capital is not used.
With regard to the approved capital and the conditional capital, the following definition of the amount in accordance with the resolutions
passed at the 25th
Annual General Meeting on 4 July 2019, is to be observed: the sum of (i) the number of shares currently issued or
potentially to be issued from conditional capital in accordance with the convertible bond conditions and (ii) the number of shares issued
from approved capital shall not exceed the total amount of 19,425,000 (limitation of authorised amount).
The Annual General Meeting also resolved to amend the Articles of Association in § 4 (Nominal capital) to reflect these changes.
Outstanding shares The number of shares issued amounts to 38,850,000 at 31 March 2020 (previous year: 38,850,000).
Treasury shares By a resolution passed at the 25th Annual General Meeting on 4 July 2019, the Management Board was again authorised
to purchase, within a period of 30 months from the adoption of the resolution by the General Meeting, treasury shares to an of up to 10%
of the nominal share capital of the Company for a minimum consideration per share at the most 30% lower than the average, unweighted
stock exchange closing price over the preceding ten trading days and a maximum consideration per share at the most 30% higher than the
average, unweighted stock exchange closing price over the preceding ten trading days. The treasury shares may be purchased via the stock
exchange, by means of a public offering or any other legally permitted way and for any legally permitted purpose. The Management Board
was also authorised to withdraw repurchased treasury shares and treasury shares already held by the Company without any further
resolution by Annual General Meeting. The Supervisory Board was authorised to adopt amendments to the Articles of Association resulting
from the withdrawal of the shares. Furthermore, the Management Board was authorised, for a period of five years, i.e. up to and including
3 July 2024, subject to approval of the Supervisory Board, to sell or use the repurchased treasury shares or treasury shares currently held
by the Company other than via the stock exchange or by public offer in particular for the purposes of stock transfer programmes,
CONSOLIDATED FINANCIAL ­STATEMENTS
171
FIRST CHOICE
FOR ADVANCED APPLICATIONS
ANNUAL REPORT 2019/20AT S
ATS ANNUAL REPORT 2019/20 CONSOLIDATED FINANCIAL STATEMENTS FIRST CHOICE
FOR ADVANCED APPLICATIONS
92
convertible bonds or as a consideration for the acquisition of entities, investments or other assets or for any other legal purpose, and to
exclude a general purchase opportunity for shareholders. The authorisations granted by the resolution of the 23rd Annual General Meeting
on 6 July 2017 on agenda items 8 and 9 were revoked.
As at 31 March 2020, the Group held no treasury shares.
Dividend per share In the financial year 2019/20, a dividend of € 0.60 was paid per share (previous year: € 0.36).
22. Other reserves
The reclassification adjustments of the other comprehensive income realised in the profit for the year and the movement in other reserves
are as follows:
€ in thousands
Currency translation
differences
Financial assets at
fair value through OCI
Hedging
instruments for
cash flow hedges
Remeasurement of
obligations from
post-employment
benefits
Other
reserves
Carrying amount 31 Mar 2018 30,419 17 68 (2,999) 27,505
Balance of unrealised changes before
reclassification, net of tax 24,466 – (3,730) – 20,736
Remeasurement of obligations from post-
employment benefits – – – (5,797) (5,797)
Carrying amount 31 Mar 2019 54,885 17 (3,662) (8,796) 42,444
Balance of unrealised changes before
reclassification, net of tax (30,292) – (1,642) – (31,934)
Remeasurement of obligations from post-
employment benefits, net of tax – – – (1,091) (1,091)
Carrying amount 31 Mar 2020 24,593 17 (5,304) (9,887) 9,419
With regard to the presentation of income taxes attributable to the individual components of the other comprehensive income, including
reclassification adjustments, reference is made to Note 6 “Income taxes”.
23. Hybrid capital
On 17 November 2017, a hybrid bond was issued at a nominal amount of € 175,000 thousand and with an annual coupon of 4.75% which
was paid out on 24 November 2017. The subordinated bond has a perpetual maturity and can be first called in and redeemed by AT  S
Austria Technologie  Systemtechnik Aktiengesellschaft, but not by the creditors, after five years. If the bond is not called in and redeemed
after five years, the mark-up increases by 5.0% on the actual coupon.
As the hybrid bond satisfies the IAS 32 criteria for equity, the proceeds from the bond issue are recognised as part of equity. Accordingly,
coupon payments are also presented as part of the appropriation of profit. The issue costs of the hybrid bond amounted to
€ 2,113 thousand. Therefore hybrid capital amounts to € 172,887 thousand (previous year: € 172,887 thousand).
172
CONSOLIDATED FINANCIAL ­STATEMENTSANNUAL REPORT 2019/20AT S FIRST CHOICE
FOR ADVANCED APPLICATIONSATS ANNUAL REPORT 2019/20 CONSOLIDATED FINANCIAL STATEMENTS FIRST CHOICE
FOR ADVANCED APPLICATIONS
93
24. Cash flow
In accordance with IAS 7, cash and cash equivalents comprise cash on hand and demand, deposits and current, liquid investments that can
be converted into known cash amounts at any time and which are only subject to an insignificant risk of changes in value. The indirect
method was used to prepare the Consolidated Statement of Cash Flows.
Cash flow from operating activities before changes in working capital in the financial year 2019/20 was € 165,367 thousand (previous year:
€ 205,972 thousand), cash flow from operating activities was € 185,123 thousand (previous year: € 170,534 thousand). The first-time
application of IFRS 16 results in a positive effect on the cash flow from operating activities, as the previous operating lease payments,
unless they are payments from short-term or low-value leases, are now shown under cash outflow from financing activities.
Cash flow from investing activities in the financial year 2019/20 amounts to € -116,629 thousand (previous year: € -276,579 thousand) and
comprises investment activities in Leoben, Chongqing, Shanghai and India (€ -218,597 thousand) as well as investments of or return of
liquid funds (€ 101,898 thousand). As of 31 March 2020, there are existing liabilities due to investments in the amount of
€ 62,866 thousand (previous year: € 31,172 thousand).
Cash flow from financing activities in the financial year 2019/20 amounts to € 17,924 thousand. The previous year’s figure of
€ 147,199 thousand is mainly attributable to the cash inflow from the issue of a promissory note loan.
€ in thousands 2019/20 2018/19
Cash flow from operating activities before changes in working capital 165,367 205,972
Cash flow from operating activities 185,123 170,534
Cash flow from investing activities (116,629) (276,579)
Free cash flow 68,494 (106,045)
Cash flow from financing activities 17,924 147,199
Change in cash and cash equivalents 86,418 41,154
Currency effects on cash and cash equivalents 4,691 14,958
Cash and cash equivalents at the end of the year 417,950 326,841
The balance of cash and cash equivalents at the end of the financial year 2019/20 was € 417,950 thousand (previous year:
€ 326,841 thousand). This currently high amount is used to ensure further investments in affiliated entities.
The non-cash expense/income is as follows:
€ in thousands 2019/20 2018/19
Release of government grants (3,470) (2,880)
Other non-cash expense/(income), net (10,845) (14,643)
Non-cash expense/(income), net (14,315) (17,523)
CONSOLIDATED FINANCIAL ­STATEMENTS
173
FIRST CHOICE
FOR ADVANCED APPLICATIONS
ANNUAL REPORT 2019/20AT S
ATS ANNUAL REPORT 2019/20 CONSOLIDATED FINANCIAL STATEMENTS FIRST CHOICE
FOR ADVANCED APPLICATIONS
94
Net debt reconciliation:
€ in thousands 2019/20 2018/19
Cash and cash equivalents 417,950 326,841
Financial assets 136,435 239,945
Financial liabilities, current (105,299) (37,967)
Financial liabilities, non-current (695,834) (679,076)
Net debt (246,748) (150,257)
Other assets
€ in thousands Cash Financial assets Financial Liabilities Total
Net debt 31 Mar 2018 270,729 59,918 (539,884) (209,237)
Cash flows 41,154 176,891 (164,386) 53,659
Foreign exchange adjustments 14,958 3,106 (3,853) 14,211
Other non-cash movements – 30 (8,920) (8,890)
Net debt 31 Mar 2019 326,841 239,945 (717,043) (150,257)
Adoption of IFRS16 Leases (26,589) (26,589)
Cash flows 86,418 (101,768) (59,679) (75,029)
Foreign exchange adjustments 4,691 (1,812) (279) 2,600
Other non-cash movements – 70 2,457 2,527
Net debt 31 Mar 2020 417,950 136,435 (801,133) (246,748)
174
CONSOLIDATED FINANCIAL ­STATEMENTSANNUAL REPORT 2019/20AT S FIRST CHOICE
FOR ADVANCED APPLICATIONSATS ANNUAL REPORT 2019/20 CONSOLIDATED FINANCIAL STATEMENTS FIRST CHOICE
FOR ADVANCED APPLICATIONS
95
25. Earnings per share
Earnings per share is calculated in accordance with IAS 33 “Earnings per Share”.
Weighted average of outstanding shares The number of shares issued is 38,850,000. As of 31 March 2020, no treasury shares are held,
which would have had to be deducted in the calculation of earnings per share.
The weighted average number of outstanding shares for the basic earnings per share calculation amounts to 38,850 thousand in the
financial year 2019/20 and to 38,850 thousand in the financial year 2018/19.
The weighted average number of outstanding shares for the diluted earnings per share calculation amounts to 38,850 thousand in the
financial year 2019/20 and to 38,850 thousand in the financial year 2018/19.
The following table shows the composition of the diluted weighted average number of outstanding shares in the respective periods:
in thousands 2019/20 2018/19
Weighted average number of shares outstanding – basic 38,850 38,850
Diluting effect – –
Weighted average number of shares outstanding – diluted 38,850 38,850
Basic earnings per share Basic earnings per share are calculated by dividing the profit for the period attributed to the shareholders of the
Company by the weighted average number of outstanding ordinary shares in the same period.
2019/20 2018/19
Profit for the year attributable to owners of the parent company (€ in thousands) 13,143 80,714
Weighted average number of shares outstanding – basic (in thousands) 38,850 38,850
Basic earnings per share (in €) 0.34 2.08
Diluted earnings per share Diluted earnings per share are calculated by dividing the profit for the period attributed to the shareholders of
the Company by the weighted average number of outstanding shares including the number of potentially outstanding ordinary shares in
the same period. The potentially outstanding ordinary shares comprise the additional shares to be issued for exercisable options or
subscription rights and are included in diluted earnings per share.
2019/20 2018/19
Profit for the year attributable to owners of the parent company (€ in thousands) 13,143 80,714
Weighted average number of shares outstanding – diluted (in thousands) 38,850 38,850
Diluted earnings per share (in €) 0.34 2.08
26. Material events after the balance sheet date
Until 13 May 2020 no events or developments had incurred, which would have led to a material change regarding the presentation or
valuation of the single assets and liabilities compared with 31 March 2020.
V. OTHER DISCLOSURES
CONSOLIDATED FINANCIAL ­STATEMENTS
175
FIRST CHOICE
FOR ADVANCED APPLICATIONS
ANNUAL REPORT 2019/20AT S
ATS ANNUAL REPORT 2019/20 CONSOLIDATED FINANCIAL STATEMENTS FIRST CHOICE
FOR ADVANCED APPLICATIONS
96
The global spread of the corona virus (SARS-CoV-2) since January 2020 has led to some significant measures by governments worldwide to
contain the pandemic. The resulting effects on the global economy as well as on the financial statement for 2020/21 are difficult to predict
from today’s perspective. At the moment we assume a recovery in future financial years. The forecasts in this report have been drawn up
with this proviso.
Monika Stoisser-Göhring has decided to retire from the ATS Management Board as of the end of the financial year 2019/20 for reasons
of health in agreement with the supervisory board and the company. Andreas Gerstenmayer will become the interim CFO.
27. Related party transactions
In connection with various projects, the Group received consulting services from companies in which Supervisory Board chairman Mr.
Androsch (AIC Androsch International Management Consulting GmbH) is operativ:
€ in thousands 2019/20 2018/19
AIC Androsch International Management Consulting GmbH 363 376
Frotz Riedl Rechtsanwälte – 1
Total 363 377
Members of the Management Board and the Supervisory Board
In the financial year 2019/20 and until the issue date of these consolidated financial statements, the following persons served on the
Management Board:
 Andreas Gerstenmayer (Chairman)
 Monika Stoisser-Göhring (Deputy Chairwoman)
 Heinz Moitzi
In the financial year 2019/20, the following persons were appointed members of the Supervisory Board:
 Hannes Androsch (Chairman)
 Willibald Dörflinger (First Deputy Chairman)
 Regina Prehofer (Second Deputy Chairwoman)
 Karl Fink
 Albert Hochleitner
 Gerhard Pichler (until 4 July 2019)
 Georg Riedl
 Karin Schaupp
 Gertrude Tumpel-Gugerell (since 4 July 2019)
Delegated by the Works Council:
 Wolfgang Fleck
 Siegfried Trauch
 Günter Pint
 Günther Wölfler
176
CONSOLIDATED FINANCIAL ­STATEMENTSANNUAL REPORT 2019/20AT S FIRST CHOICE
FOR ADVANCED APPLICATIONSATS ANNUAL REPORT 2019/20 CONSOLIDATED FINANCIAL STATEMENTS FIRST CHOICE
FOR ADVANCED APPLICATIONS
97
The number of outstanding stock appreciation rights and staff costs from stock appreciation rights granted are as follows:
Number of outstanding
stock appreciation rights
Staff costs
(€ in thousands)
31 Mar 2020 31 Mar 2019 2019/20 2018/19
Andreas Gerstenmayer 150,000 150,000 137 (113)
Monika Stoisser-Göhring 90,000 65,000 (40) (49)
Heinz Moitzi 90,000 60,000 (63) (17)
Total Management Board 330,000 275,000 34 (179)
Karl Asamer 1)
30,000 60,000 (150) (507)
Total other executive employees 338,002 328,468 (226) (253)
Total 698,002 663,468 (342) (939)
1)
Former member of the Management Board
Reference is made to the comments on the stock option plans under Note 14 “Trade and other payables”.
Total compensation to the members of the Management Board and to executive employees in the financial year in accordance with IAS 24:
2019/20 2018/19
€ in thousands Fixed Variable Total Fixed Variable Total
Andreas Gerstenmayer 532 284 816 532 714 1,246
Monika Stoisser-Göhring 1)
423 – 423 391 175 566
Heinz Moitzi 429 – 429 417 186 603
Karl Asamer 2)
– – – – 142 142
Executive employees 5,796 136 5,932 5,212 1,443 6,655
Total 7,180 420 7,600 6,552 2,660 9,212
1)
Exercises of stock appreciation rights, which were granted before the appointment of the Management Board member, are not included.
2)
Former member of the Management Board
The variable compensation of Andreas Gerstenmayer includes remuneration from stock appreciation rights of € 284 thousand (previous
year: € 427 thousand).
Besides the above mentioned compensation € 52 thousand (previous year: € 52 thousand) for Andreas Gerstenmayer and € 41 thousand
(previous year: € 38 thousand) for Monika Stoisser-Göhring were paid into a pension fund.
In accordance with IAS 24, these are key management personnel who have direct or indirect authority and responsibility for planning,
directing and controlling the activities of the entity; this includes managing directors of that entity.
CONSOLIDATED FINANCIAL ­STATEMENTS
177
FIRST CHOICE
FOR ADVANCED APPLICATIONS
ANNUAL REPORT 2019/20AT S
ATS ANNUAL REPORT 2019/20 CONSOLIDATED FINANCIAL STATEMENTS FIRST CHOICE
FOR ADVANCED APPLICATIONS
98
Expenses for severance payments and retirement benefits for currentl and former members of the Management Board, executive
employees and their surviving dependants are as follows:
Severance payments
Financial year
Pensions
Financial year
€ in thousands 2019/20 2018/19 2019/20 2018/19
Expenses recognised in profit for the period 195 261 443 299
Remeasurement recognised in other comprehensive income 78 174 (856) 6,503
Total remuneration for services rendered personally by members of the Supervisory Board attributable to the financial year and proposed
to the Annual General Meeting:
2019/20 2018/19
€ in thousands Fixed Variable Total Fixed Variable Total
Hannes Androsch 67 – 67 65 14 79
Willibald Dörflinger 53 – 53 51 9 60
Regina Prehofer 55 – 55 53 9 62
Karl Fink 30 – 30 30 7 37
Albert Hochleitner 30 – 30 30 7 37
Gerhard Pichler 8 – 8 34 7 41
Georg Riedl 40 – 40 38 7 45
Karin Schaupp 30 – 30 30 7 37
Gertrude Tumpel-Gugerell 24 – 24 – – –
Total 337 – 337 331 67 398
Shareholdings of the Management Board and the Supervisory Board at 31 March 2020:
Shares % capital
Management Board members:
Andreas Gerstenmayer 10,000 0.03
Monika Stoisser-Göhring 6,000 0.01
Heinz Moitzi 8,001 0.02
Total Management Board members 24,001 0.06
Supervisory Board members:
Hannes Androsch 120,258 0.31
Other members of the Supervisory Board 15,482 0.04
Total Supervisory Board members 135,740 0.35
Private foundations:
Androsch Privatstiftung 6,819,337 17.55
Dörflinger Privatstiftung 6,902,380 17.77
Total private foundations 13,721,717 35.32
Total 13,881,458 35.73
178
CONSOLIDATED FINANCIAL ­STATEMENTSANNUAL REPORT 2019/20AT S FIRST CHOICE
FOR ADVANCED APPLICATIONSATS ANNUAL REPORT 2019/20 CONSOLIDATED FINANCIAL STATEMENTS FIRST CHOICE
FOR ADVANCED APPLICATIONS
99
28. Expenses for the Group auditor
The expenses for the financial year for the Group auditor are as follows:
€ in thousands 2019/20 2018/19
Audit of consolidated and separate financial statements 137 137
Other assurance services 27 4
Other services 46 69
Total 210 210
This item does not include expenses for other network members of the Group auditor, e.g. for the audit of financial statements of
subsidiaries or tax consulting services.
29. Number of staff
The average numbers of staff in the financial year are as follows:
2019/20 2018/19
Waged workers 7,437 7,321
Salaried employees 2,802 2,490
Total 10,239 9,811
The calculation of the number of staff includes an average of 256 leased personnel for the financial year 2019/20 and an average of 371
for the financial year 2018/19.
Leoben-Hinterberg, 13 May 2020
The Management Board
Andreas Gerstenmayer m.p. Monika Stoisser-Göhring m.p. Heinz Moitzi m.p.
CONSOLIDATED FINANCIAL ­STATEMENTS
179
FIRST CHOICE
FOR ADVANCED APPLICATIONS
ANNUAL REPORT 2019/20AT S
ATS ANNUAL REPORT 2019 /20 STATEMENT OF ALL LEGAL REPRESENTATIVES FIRST CHOICE
FOR ADVANCED APPLICATIONS
100
We confirm to the best of our knowledge that the consolidated financial statements give a true and fair view of the assets, liabilities,
financial position and profit or loss of the Group as required by the applicable accounting standards and that the Group Management
report gives a true and fair view of the development and performance of the business and the position of the Group, together with a
description of the principal risks and uncertainties the Group faces.
Leoben-Hinterberg, 13 May 2020
The Management Board
Andreas Gerstenmayer m.p.
Chief Executive Officer
Monika Stoisser-Göhring m.p.
Chief Financial Officer
Heinz Moitzi m.p.
Chief Operations Officer
STATEMENT OF
ALL LEGAL REPRESENTATIVES
180
CONSOLIDATED FINANCIAL ­STATEMENTSANNUAL REPORT 2019/20AT S FIRST CHOICE
FOR ADVANCED APPLICATIONSATS ANNUAL REPORT 2019/20 AUDITOR’S REPORT FIRST CHOICE
FOR ADVANCED APPLICATIONS
101
We draw attention to the fact that the English translation of this auditor’s report according to Section 274 of the Austrian Commercial
Code (UGB) is presented for the convenience of the reader only and that the German wording is the only legally binding version.
Report on the Consolidated Financial Statements
Audit Opinion
We have audited the consolidated financial statements of AT  S Austria Technologie  Systemtechnik Aktiengesellschaft, Leoben-
Hinterberg, and its subsidiaries (the Group), which comprise the Consolidated Statement of Financial Position as at March 31, 2020, the
separate Consolidated Statement of Profit or Loss, the Consolidated Statement of Comprehensive Income, the Consolidated Statement of
Cash Flows and the Consolidated Statement of Changes in Equity for the fiscal year then ended, and the Notes to the Consolidated Financial
Statements.
In our opinion, the accompanying consolidated financial statements comply with legal requirements and give a true and fair view of the
financial position of the Group as at March 31, 2020, and of its financial performance and cash flows for the year then ended in accordance
with the International Financial Reporting Standards (IFRSs) as adopted by the EU and the additional requirements under Section 245a
Austrian Commercial Code.
Basis for Opinion
We conducted our audit in accordance with Regulation (EU) No. 537/2014 (hereinafter EU Regulation) and Austrian generally accepted
auditing standards. Those standards require the application of the International Standards on Auditing (ISAs). Our responsibilities under
those provisions and standards are further described in the “Auditor’s Responsibilities for the Audit of the Consolidated Financial
Statements” section of our report. We are independent of the Group in accordance with Austrian Generally Accepted Accounting Principles
and professional requirements, and we have fulfilled our other ethical responsibilities in accordance with these requirements. We believe
that the audit evidence we have obtained is sufficient and appropriate to provide a basis for our opinion.
Key Audit Matters
Key audit matters are those matters that, in our professional judgment, were of most significance in our audit of the consolidated financial
statements of the fiscal year. These matters were addressed in the context of our audit of the consolidated financial statements as a whole,
and in forming our opinion thereon, and we do not provide a separate opinion on these matters.
We have structured key audit matters as follows:
 Description
 Audit approach and key observations
 Reference to related disclosures
AUDITOR’S REPORTAUDITOR’S REPORT
CONSOLIDATED FINANCIAL ­STATEMENTS
181
FIRST CHOICE
FOR ADVANCED APPLICATIONS
ANNUAL REPORT 2019/20AT S
ATS ANNUAL REPORT 2019/20 AUDITOR’S REPORT FIRST CHOICE
FOR ADVANCED APPLICATIONS
102
1. Deferred tax assets from tax loss carry-forwards and other deductible temporary differences
 Description
The Group capitalized deferred tax assets in a total amount of EUR 25,984k (prior year: EUR 35,555k). This amount includes deferred tax
assets from tax loss carry-forwards and amortization of goodwill under tax law in the amount of EUR 19,652k (prior year: EUR 22,648k) as
well as deductible temporary differences in the amount of EUR 6,332k (prior year: EUR 12,907k).
Deferred tax assets are capitalized based on the assumption that sufficient taxable income will be generated within a planning period of at
least 5 years against which tax loss carry-forwards and other deductible temporary differences can be offset. These assumptions are based
on estimates of current and planned taxable results and any future measures implemented by the companies concerned that will have an
effect on tax.
The assessment of the matter described requires professional judgment and involves estimation uncertainties and thus includes the risk
of a material misstatement in the consolidated financial statements, therefore constituting a key audit matter.
 Audit approach and key observations
We:
 Identified, for significant companies, the process used to determine the future taxable results that serve as a basis for the calculation
of deferred tax assets,
 Performed plausibility checks for significant companies to evaluate if the budgeted figures used are plausible when compared to our
knowledge of the planned course of business,
 Received tax advisor confirmation letters to confirm the existence and accuracy of the tax loss carry-forwards,
 Analyzed and confirmed samples of the accounting assumptions on the possibility to utilize tax loss carry-forwards and deductible
temporary differences, and
 Audited the presentation and disclosures in the notes to the consolidated financial statements.
We consider the capitalization of deferred tax assets from tax loss carry-forwards and other deductible temporary differences to be
justified and reasonable in amount.
 Reference to related disclosures
For further related information, we refer to the notes to the consolidated financial statements, section I. B. (e.) on accounting and
measurement policies in respect of income taxes, section I. C. critical accounting estimates and assumptions concerning recognition and
measurement, measurement of deferred tax assets and current income tax liabilities, as well as section III. 6. comments on income taxes.
182
CONSOLIDATED FINANCIAL ­STATEMENTSANNUAL REPORT 2019/20AT S FIRST CHOICE
FOR ADVANCED APPLICATIONSATS ANNUAL REPORT 2019/20 AUDITOR’S REPORT FIRST CHOICE
FOR ADVANCED APPLICATIONS
103
2. Revenue recognition over time under IFRS 15
 Description
Pursuant to IFRS 15 Revenue from Contracts with Customers, the Group recognizes revenue over time for part of the customers. Pursuant
to IFRS 15.35 c, revenue must be recognized over time when products specifically tailored to the needs of the customers are produced and
thus have no alternative use and the entity has an enforceable right to payment for performance of the service completed to date, including
a margin.
As at March 31, 2020, the Group states contract assets in the amount of EUR 67,763k (prior year: EUR 72,307k) after considering any
impairment pursuant to IFRS 9. Revenue from revenue recognition over time amounts to EUR 645,121k in the fiscal year 2019/20 (prior
year: EUR 606,978k).
From our perspective, recognizing contracts with customers (over time) pursuant to IFRS 15 represents an area with major risk of material
misstatements (including the possible risk of executive employees evading controls) and thus poses a key audit matter since in the required
group-wide consideration of the contractual framework with regard to the new accounting-relevant criteria for determining the respective
customers, management’s judgments have a major impact, and partly complex calculation methods are used in determining the stage of
completion. Additionally, in applying the accounting standard IFRS 15 on a group-wide basis, the respective revenue recognition and
deferral of revenue was to be considered as complex.
 Audit approach and key observations
We:
 Assessed management’s conclusions with regard to the implementation of IFRS 15 by evaluating samples of various contract analyses
and the correctness of the modified accounting principles of the Group, taking into account industry-typical circumstances and our
understanding of the business,
 Tested the appropriateness of accounting based on samples and evaluated the adjustments to the opening balance resulting
therefrom,
 Tested the effectiveness of selected key controls for revenue recognized in the course of the year and performed audit procedures to
obtain sufficient audit evidence for revenue recognition of customer contracts over time,
 Assessed samples of costs included in contract assets by comparing the amounts to the source data, evaluating mathematical accuracy
of the calculations and testing their recoverability by comparing their net realizable values with the total costs estimated in accordance
with the agreements, and
 Moreover, assessed the correctness of the disclosures under IFRS 15.
Our audit procedures did not result in any objections with regard to the accounting of customer contracts over time and revenue
recognition pursuant to IFRS 15 resulting therefrom.
 Reference to related disclosures
For further related information, we refer to the notes to the consolidated financial statements, section I. B. (d.) on accounting and
measurement policies in respect of recognition of revenues from contracts with customers. In addition, we refer to the disclosures on
revenue in the notes to the consolidated financial statements, section III. 1. as well as those on contract assets in section IV. 11.
CONSOLIDATED FINANCIAL ­STATEMENTS
183
FIRST CHOICE
FOR ADVANCED APPLICATIONS
ANNUAL REPORT 2019/20AT S
ATS ANNUAL REPORT 2019/20 AUDITOR’S REPORT FIRST CHOICE
FOR ADVANCED APPLICATIONS
104
Responsibilities of Management and the Audit Committee for the Consolidated Financial Statements
Management is responsible for the preparation and fair presentation of these consolidated financial statements in accordance with
International Financial Reporting Standards (IFRSs) as adopted by the EU, and the additional requirements under Section 245a UGB, and
for such internal control as management determines is necessary to enable the preparation of consolidated financial statements that are
free from material misstatement, whether due to fraud or error.
In preparing the consolidated financial statements, management is responsible for assessing the Group’s ability to continue as a going
concern, disclosing, as applicable, matters related to going concern and using the going concern basis of accounting unless management
either intends to liquidate the Group or to cease operations, or has no realistic alternative but to do so.
The audit committee is responsible for overseeing the Group’s financial reporting process.
Auditor’s Responsibilities for the Audit of the Consolidated Financial Statements
Our objectives are to obtain reasonable assurance about whether the consolidated financial statements as a whole are free from material
misstatement, whether due to fraud or error, and to issue an auditor’s report that includes our opinion. Reasonable assurance is a high
level of assurance, but is not a guarantee that an audit conducted in accordance with the EU Regulation and with Austrian generally
accepted auditing standards, which require the application of ISAs, will always detect a material misstatement when it exists.
Misstatements can arise from fraud or error and are considered material if, individually or in the aggregate, they could reasonably be
expected to influence the economic decisions of users taken on the basis of these consolidated financial statements.
As part of an audit in accordance with the EU Regulation and with Austrian generally accepted auditing standards, which require the
application of ISAs, we exercise professional judgment and maintain professional skepticism throughout the audit.
We also:
 identify and assess the risks of material misstatement of the consolidated financial statements, whether due to fraud or error, design
and perform audit procedures responsive to those risks, and obtain audit evidence that is sufficient and appropriate to provide a basis
for our opinion. The risks of not detecting a material misstatement resulting from fraud is higher than for one resulting from error, as
fraud may involve collusion, forgery, intentional omissions, misrepresentations, or the override of internal control.
 obtain an understanding of internal control relevant to the audit in order to design audit procedures that are appropriate in the
circumstances, but not for the purpose of expressing an opinion on the effectiveness of the Group’s internal control.
 evaluate the appropriateness of accounting policies used and the reasonableness of accounting estimates and related disclosures made
by management.
 conclude on the appropriateness of management’s use of the going concern basis of accounting and, based on the audit evidence
obtained, whether a material uncertainty exists related to events or conditions that may cast significant doubt on the Group’s ability to
continue as a going concern. If we conclude that a material uncertainty exists, we are required to draw attention in our auditor’s report
to the related disclosures in the consolidated financial statements or, if such disclosures are inadequate, to modify our opinion. Our
conclusions are based on the audit evidence obtained up to the date of our auditor’s report. However, future events or conditions may
cause the Group to cease to continue as a going concern.
 evaluate the overall presentation, structure and content of the consolidated financial statements, including the disclosures, and whether
the consolidated financial statements represent the underlying transactions and events in a manner that achieves fair presentation.
184
CONSOLIDATED FINANCIAL ­STATEMENTSANNUAL REPORT 2019/20AT S FIRST CHOICE
FOR ADVANCED APPLICATIONSATS ANNUAL REPORT 2019/20 AUDITOR’S REPORT FIRST CHOICE
FOR ADVANCED APPLICATIONS
105
 obtain sufficient appropriate audit evidence regarding the financial information of the entities or business activities within the Group to
express an opinion on the consolidated financial statements. We are responsible for the direction, supervision and performance of the
group audit. We remain solely responsible for our audit opinion.
We communicate with the audit committee regarding, among other matters, the planned scope and timing of the audit and significant
audit findings, including any significant deficiencies in internal control that we identify during our audit.
We also provide the audit committee with a statement that we have complied with all relevant ethical requirements regarding
independence, and to communicate with them all relationships and other matters that may reasonably be thought to bear on our
independence, and where applicable, related safeguards.
From the matters communicated with the audit committee, we determine those matters that were of most significance in the audit of the
consolidated financial statements of the current period and are therefore the key audit matters. We describe these matters in our auditor’s
report unless law or regulation precludes public disclosure about the matter or when, in extremely rare circumstances, we determine that
a matter should not be communicated in our report because the adverse consequences of doing so would reasonably be expected to
outweigh the public interest benefits of such communication.
Report on Other Legal and Regulatory Requirements
Comments on the Group Management Report
Pursuant to the Austrian Commercial Code, the group management report is to be audited as to whether it is consistent with the
consolidated financial statements and as to whether the group management report was prepared in accordance with the applicable legal
requirements.
Management is responsible for the preparation of the group management report in accordance with the Austrian Commercial Code.
We conducted our audit in accordance with Austrian Standards on Auditing for the audit of the group management report.
Opinion In our opinion, the group management report was prepared in accordance with the applicable legal requirements, includes
accurate disclosures pursuant to Section 243a UGB and is consistent with the consolidated financial statements.
Statement Based on the findings during the audit of the consolidated financial statements and due to the obtained understanding
concerning the Group and its circumstances no material misstatements in the group management report came to our attention.
Other information
Management is responsible for the other information. The other information comprises the information included in the annual report, but
does not include the consolidated financial statements, the group management report and the auditor’s report. The annual report is
expected to be made available to us after the date of this auditor’s report.
Our opinion on the consolidated financial statements does not cover the other information and we will not express any form of assurance
conclusion thereon.
CONSOLIDATED FINANCIAL ­STATEMENTS
185
FIRST CHOICE
FOR ADVANCED APPLICATIONS
ANNUAL REPORT 2019/20AT S
ATS ANNUAL REPORT 2019/20 AUDITOR’S REPORT FIRST CHOICE
FOR ADVANCED APPLICATIONS
106
In connection with our audit of the consolidated financial statements, our responsibility is to read the other information identified above
when it becomes available and, in doing so, consider whether the other information is materially inconsistent with the consolidated
financial statements or our knowledge obtained in the audit, or otherwise appears to be materially misstated.
Additional Information in Accordance with Article 10 of the EU Regulation
We were appointed as statutory auditor at the general meeting dated July 4, 2019. We were subsequently engaged by the supervisory
board. We have audited the Company for an uninterrupted period of more than 20 years.
We confirm that the audit opinion in the “Report on the Consolidated Financial Statements” section is consistent with the additional report
to the audit committee referred to in Article 11 of the EU Regulation.
We declare that we did not provide any prohibited non-audit services (Article 5 (1) of the EU Regulation) and that we remained independent
of the audited company in conducting the audit.
Responsible Engagement Partner
Responsible for the proper performance of the engagement is Mr. Jürgen Schauer, Austrian Certified Public Accountant.
Vienna, May 13, 2020
PwC Wirtschaftsprüfung GmbH
signed:
Jürgen Schauer
Austrian Certified Public Accountant
This report is a translation of the original report in German, which is solely valid. Publication and sharing with third parties of the consolidated financial statements together with our auditor’s report is only allowed if
the consolidated financial statements and the group management report are identical with the German audited version. This auditor’s report is only applicable to the German and complete consolidated financial
statements with the group management report. For deviating versions, the provisions of Section 281 (2) UGB apply
10
INF
ORM
AT
ION10-year timeline
24
28
31
34
45
63
188 _ 10-year timeline
190 _ Glossary
192 _ Imprint
ANNUAL REPORT 2019/20AT S FIRST CHOICE
FOR ADVANCED APPLICATIONS
188
IFRS Unit 2010/11 2011/12 2012/131)
2013/14
EARNINGS DATA AND GENERAL INFORMATION
Revenue € in millions 487.9 514.2 541.7 589.9
thereof produced in Asia 69% 73% 74% 76%
thereof produced in Europe 31% 27% 26% 24%
Cost of sales € in millions 398.2 430.7 464.6 471.1
Gross profit € in millions 89.8 83.5 77.1 118.8
Gross profit margin 18.4% 16.2% 14.2% 20.1%
EBITDA € in millions 95.9 103.4 102.4 127.2
EBITDA margin 19.7% 20.1% 18.9% 21.6%
EBIT € in millions 46.5 42.1 31.4 53.9
EBIT margin 9.5% 8.2% 5.8% 9.1%
Profit for the period2)
€ in millions 35.0 26.5 14.6 38.2
Profit for the period attributable to owners of the parent company € in millions 35.2 26.6 14.6 38.2
Cash earnings € in millions 84.6 87.8 85.6 111.4
ROE (Return on equity)3)
16.0% 10.3% 5.0% 11.0%
ROCE (Return on capital employed)2), 3)
9.8% 7.7% 5.6% 9.6%
ROS (Return on sales) 7.2% 5.2% 2.7% 6.5%
IRR (Innovation revenue rate) – 15.0% 19.2% 26.5%
Cash flow from operating activities (OCF) € in millions 70.7 87.2 71.7 104.8
Net CAPEX € in millions 115.1 113.1 40.5 90.3
Operating free cash flow € in millions (44.4) (25.9) 31.2 14.5
Free cash flow € in millions (46.0) (26.4) 31.1 14.5
Employees (incl. leased personnel), end of reporting period 7,486 7,478 7,011 7,129
Employees (incl. leased personnel), average 6,987 7,417 7,321 7,027
BALANCE SHEET DATA
Total assets € in millions 575.3 694.6 726.7 916.1
Total equity € in millions 229.8 283.1 304.8 390.7
Equity attributable to owners of the parent company € in millions 229.5 283.2 304.9 390.7
Equity ratio 39.9% 40.8% 42.0% 42.7%
Net debt € in millions 193.7 242.5 217.4 110.9
Net gearing 84.3% 85.7% 71.3% 28.4%
Net working capital € in millions 79.4 92.3 102.7 91.7
Net working capital per revenue 16.3% 18.0% 19.0% 15.6%
STOCK EXCHANGE DATA
Shares outstanding end of reporting period 23,322,588 23,322,588 23,322,588 38,850,000
Weighted average number of shares outstanding 23,322,588 23,322,588 23,322,588 30,820,545
Earnings per shares outstanding end of reporting period € 1.51 1.14 0.62 0.98
Earnings per average number of shares outstanding € 1.51 1.14 0.62 1.24
Cash earnings per average number of shares € 3.63 3.76 3.67 3.61
Dividend per share4)
€ 0.36 0.32 0.20 0.20
Closing price € 15.84 9.15 6.79 8.75
Dividend yield (at the closing price)4)
2.3% 3.5% 2.9% 2.3%
Market capitalisation, end of reporting period € in millions 369.4 213.4 158.4 339.9
Market capitalisation per equity5)
161.0% 75.4% 51.9% 87.0%
1) Adjusted in application of IAS 19 revised.
2) 2018/19: Adjusted taking into account IAS 12 revised.
3) Calculated on the basis of average values.
4) 2019/20: Proposal to the Annual General Meeting.
5) Equity attributable to owners of the parent company.
INFORMATION
KEY DATA 10-YEAR TIMELINE
FIRST CHOICE
FOR ADVANCED APPLICATIONS
ANNUAL REPORT 2019/20AT S
189
2014/15 2015/16 2016/17 2017/18 2018/19 2019/20
Change prior year
Compound Annual
Growth Rate
10 years
667.0 762.9 814.9 991.8 1,028.0 1,000.6 (2.7%) 7.4%
79% 81% 82% 84% 85% 87% – –
21% 19% 18% 16% 15% 13% – –
511.6 611.2 760.2 829.5 860.8 897.7 4.3% 8.5%
155.4 151.6 54.7 162.3 167.2 102.9 (38.4%) 1.4%
23.3% 19.9% 6.7% 16.4% 16.3% 10.3% – –
167.6 167.5 130.9 226.0 250.1 194.5 (22.2%) 7.3%
25.1% 22.0% 16.1% 22.8% 24.3% 19.4% – –
90.1 77.0 6.6 90.3 117.2 47.4 (59.6%) 0.2%
13.5% 10.1% 0.8% 9.1% 11.4% 4.7% – –
69.3 56.0 (22.9) 56.5 89.0 21.5 (75.9%) (4.8%)
69.3 56.0 (22.9) 53.6 80.7 13.1 (83.7%) (9.4%)
146.8 146.5 101.8 192.2 213.6 160.3 (25.0%) 6.6%
13.9% 9.5% (4.1%) 9.0% 11.5% 2.7% – –
12.0% 8.2% (0.6%) 7.7% 9.7% 2.8% – –
10.4% 7.3% (2.8%) 5.7% 8.5% 2.1% – –
29.2% 19.6% 21.8% 40.4% 35.3% 30.9% – –
143.9 136.9 136.4 143.2 170.5 185.1 8.6% 10.1%
164.8 254.3 240.7 141.7 100.8 218.5 100% 6.6%
(20.9) (117.3) (104.3) 1.5 69.7 (33.4) – n.a.
(20.9) (205.3) (24.7) (50.2) (106.0) 68.5 – –
8,120 9,116 9,778 9,734 9,624 10,319 7.2% 3.3%
7,638 8,759 9,526 9,981 9,811 10,239 4.4% 3.9%
1,220.8 1,344.7 1,436.7 1,530.4 1,784.1 1,853.5 3.9% 12.4%
604.4 568.9 540.1 711.4 803.5 760.3 (5.4%) 12.7%
604.3 568.9 540.1 711.4 803.5 760.3 (5.4%) 12.7%
49.5% 42.3% 37.6% 46.5% 45.0% 41.0% – –
130.5 263.2 380.5 209.2 150.3 246.7 64.2% 2.4%
21.6% 46.3% 70.5% 29.4% 18.7% 32.5% – –
95.3 88.4 24.4 72.4 160.5 144.4 (10.0%) 6.2%
14.3% 11.6% 3.0% 7.3% 15.6% 14.4% – –
38,850,000 38,850,000 38,850,000 38,850,000 38,850,000 38,850,000 – 5.2%
38,850,000 38,850,000 38,850,000 38,850,000 38,850,000 38,850,000 – 5.2%
1.78 1.44 (0.59) 1.38 2.08 0.34 (83.7%) (13.9%)
1.78 1.44 (0.59) 1.38 2.08 0.34 (83.7%) (13.9%)
3.78 3.77 2.62 4.95 5.50 4.13 (24.9%) 1.3%
0.36 0.36 0.10 0.36 0.60 0.25 (58.3%) (3.6%)
14.62 12.90 10.29 22.00 15.30 13.41 (12.4%) (1.7%)
2.5% 2.8% 1.0% 1.6% 3.9% 1.9% – –
568.0 501.2 399.8 854.7 594.4 521.0 (12.4%) 3.5%
94.0% 88.1% 74.0% 120.1% 74.0% 68.5% – –
INFORMATION
ANNUAL REPORT 2019/20AT S FIRST CHOICE
FOR ADVANCED APPLICATIONS
190
INFORMATION
ATS Toolbox
Combination of existing and new technologies which enables
new interconnect solutions and the functional integration at all
connection levels.
CMRT
Conflict Minerals Reporting Template – Questionnaire to collect
information on conflict minerals.
COSO standard
Internationally recognised standard for Internal Control Sys-
tems (ICS) and risk management published by the Committee of
Sponsoring Organizations of the Treadway Commission (COSO).
Embedding
Integrating active and/or passive electronic components inside
printed circuit boards.
FanOut
“FanOut” is a technology in which additional wiring layers are
applied to a chip, which extend beyond the chip area. This en-
larged area thus enables better distribution of contacts to the
printed circuit board.
FCBGA
Flip Chip Ball Grid Array – Technology in which the chip surface
is brought into direct contact with the substrate surface via sol-
der balls.
Functional integration
Refers to the integration of several functions of an electronic
system in a module.
IIA standard
Standards for measures and the assessment of the quality of in-
ternal auditing specified by the Institute of Internal Auditors (IIA).
ILO
International Labour Organization.
Intellectual property
In contrast to tangible property, intellectual property is the right
to intangible property such as a technical invention.
IRR
The Innovation Revenue Rate represents the share of total reve-
nue generated from products that feature new, innovative tech-
nologies and have been introduced in the past three years.
GLOSSARY
FIRST CHOICE
FOR ADVANCED APPLICATIONS
ANNUAL REPORT 2019/20AT S
191
INFORMATION
Lean Six Sigma
Management system for efficiency and process improvement.
The core element of the system is the description, measure-
ment, analysis, improvement and monitoring of business pro-
cesses using statistical methods.
mSAP/SAP
Modified semi-additive process or semi-additive process.
Net CAPEX
Capital expenditure net of receipts from the disposal of prop­
erty, plant and equipment and intangible assets.
NOPAT
Net operating profit after tax represents annual profit adjusted
to exclude net finance costs. For calculation, please refer to the
Group Management Report.
RBA
Responsible Business Alliance – Code of Conduct (former-
ly ­Electronic Industry Citizenship Coalition (EICC)) for working
­conditions in the supply chain of the electronics industry.
REACH
European Regulation on Registration, Evaluation, Authorisation
and Restriction of Chemicals.
RMI
Responsible Minerals Initiative – Principles for the responsible
sourcing of conflict minerals.
RoHS
Restriction of Hazardous Substances in electrical and electronic
Equipment.
SDGs
Sustainable Development Goals of the United Nations.
System in Package (SiP)
Consists of one or more semiconductors and passive compo-
nents that form a system or a functional block.
TCFD
Task Force on Climate-related Financial Disclosure – Initiative for
corporate reporting on climate-related financial opportunities
and risks.
WACC
Weighted Average Cost of Capital represents the average cost
that a company has to pay to obtain equity or debt capital.
ANNUAL REPORT 2019/20AT S FIRST CHOICE
FOR ADVANCED APPLICATIONS
192
Published by and responsible for content
AT  S Austria Technologie  Systemtechnik Aktiengesellschaft
Fabriksgasse 13
8700 Leoben, Austria
www.ats.net
Contact
Gerda Königstorfer
Phone.: +43 (0)3842 200-0
ir@ats.net
Concept and design (general section)
Berichtsmanufaktur GmbH, Hamburg
Photos
Lukas Johannes Aigner: page 22
Getty images: inside cover 4, pages 2, 2/3, 6/7, 10/11, 11,
12/13, 14/15
iStock: page 16
Fotostudio Werner Krug: pages 8/9, 12, 17
Kanizaj Marija: pages 20, 25, 26
Daniel Alexander Novotny: page 32
unsplash: cover, pages 4/5, 7, 8/9, 12, 17
IMPRINT
IMPRINT
Disclaimer
This report contains forward-looking statements which were
made on the basis of the information available at the time of
publication. These can be identified by the use of such expres-
sions as “expects”, “plans”, “anticipates”, “intends”, “could”,
“will”, “aim” and “estimation” or other similar words. These
statements are based on current expectations and assumptions.
Such statements are by their very nature subject to known and
unknown risks and uncertainties. As a result, actual develop-
ments may vary significantly from the forward-looking state-
ments made in this report. Recipients of this report are express-
ly cautioned not to place undue reliance on such statements.
Neither ATS nor any other entity accept any responsibility for
the correctness and completeness of the forward-looking state-
ments contained in this report. ATS undertakes no obligation
to update or revise any forward-looking statements, whether as
a result of changed assumptions or expectations, new informa-
tion or future events.
Percentages and individual items presented in this report are
rounded, which may result in rounding differences.
This report in no way represents an invitation or recommenda-
tion to buy or sell shares in ATS.
The report is published in German and English. In case of doubt,
the German version is binding.
No responsibility accepted for errors or omissions.
Published on 10 June 2020
Sustainability
Driving
THE STRATEGIC ORIENTATION leads to a high
level of social, ecological and economic responsi-
bility. In addition to long-term economic success
and expanding the ability to innovate, ATS is
also focusing on strong and sustainable relation-
ships and the creation of stakeholder value.
FIRST CHOICE
FOR ADVANCED
APPLICATIONS
STRONGFOR
tomorrow
SUSTAINABILITYATATS
The SDGs that guide us_
WE FOLLOW!
We have rated 9 of the 17 SDGs as relevant to us.
RBA
RMI
SDGs
OECD guidelines
ILO
ISO
We are
committed to_
_Sustainability strategy with ambitious energy
and diversity goals
_Strong crisis management
	 in the COVID-19 crisis
_Non-financial risk management
	 integrated into group-wide risk management
_High standards in environment, energy,
quality, health  safety
_Expansion of reporting
	 for more transparency
_Share of women in
leadership positions of 21%
What we are
proud of_
OPEN-MINDEDNESS, RESPONSIBILITY, COMMITMENT
are the values guiding us in achieving our strategic goals.
4strategic fields of
action and allocated
material topics_
ATSSustainability
strategy
2025
Environment
 Resources
_ Efficient production
Sustainable
Innovation
_ Innovation
Employees 
Society
_ Occupational health
and safety
_ Knowledge
_ Diversity
_ Anti-corruption
Sustainable
Supply Chain
_ Human rights
Stakeholder
SDGs
Global
trends
Opportunities
and risks
Corporate
strategy
_80% renewable energies
_Life cycle assessment of product groups
_30% share of women in leadership positions
_Strengthening partnerships with suppliers
What we are
aiming for_
www.ats.net

AT&S Annual Report 2019/20

  • 1.
  • 2.
    KEY FIGURES Employees Equity ratio Revenue Approx.10,200 41% More than € 1billion € 195million EBITDA Unit 2016/17 2017/18 2018/19 2019/20 Change prior year in % Revenue € in millions 814.9 991.8 1,028.0 1,000.6 (2.7) EBITDA € in millions 130.9 226.0 250.1 194.5 (22.2) EBITDA margin % 16.1 22.8 24.3 19.4 – EBIT € in millions 6.6 90.3 117.2 47.4 (59.6) EBIT margin % 0.8 9.1 11.4 4.7 – Profit/(loss) for the period € in millions (22.9) 56.5 89.0 21.5 (75.9) ROCE % (0.6) 7.7 9.7 2.8 – Net CAPEX € in millions 240.7 141.7 100.8 218.5 >100 Operating free cash flow € in millions (104.3) 1.5 69.7 (33.4) – Net debt € in millions 380.5 209.2 150.3 246.7 64.2 Earnings per share € (0.59) 1.38 2.08 0.34 (83.7) Dividend per share1) € 0.10 0.36 0.60 0.25 (58.3) Employees2) – 9,526 9,981 9,811 10,239 4.4 1) 2019/20: Proposal to the Annual General Meeting 2) incl. contract staff, average AT&S AT A GLANCE MISSION AT&S sets the highest quality standards in the industry, industrialises ­leading-edge technologies, cares about people, reduces its ecological ­footprint – AT&S creates value. PROFILE—MARKETSANDAPPLICATIONS
  • 3.
    Digital networking isbringing the world and ­industries closer together, opening up paths to new applications and new growth for AT&S. Products are becoming increasingly powerful while taking up less space, because the growing data volumes still need to be securely processed, stored and transported. AT&S ­supports customers with increasingly ­comprehensive solutions – these are the ele- ments they need to successfully develop their business models. FIRST CHOICE FOR ADVANCED APPLICATIONS
  • 4.
    3 1 2 3 1 2 4 5 6 6 5 4 HEADQUARTERS AT&S is oneof the globally leading manufacturers of high-end printed circuit boards and IC substrates. At its locations in Europe and Asia, AT&S develops and produces high-tech solutions for its global partners, especially for applications in the areas of communication, computer and consumer electronics, mobility, industry and medical technology. AT&S will continue to drive the digital megatrends and grow profitably in the coming years. To do so, AT&S will increase vertical integration and work even more closely together with its customers as a system supplier. PROFILE PRODUCTION PLANTS 1 – LEOBEN, AUSTRIA 2 – FEHRING, AUSTRIA 3 – NANJANGUD, INDIA 4 – CHONGQING, CHINA 5 – SHANGHAI, CHINA 6 – ANSAN, SOUTH KOREA 1 – SAN JOSE, USA 2 – DÜREN, GERMANY 3 – BANGALORE, INDIA 4 – TOKYO, JAPAN 5 – TAIPEI, TAIWAN 6 – HONG KONG, CHINA (HOLDING) SALES SUPPORT OFFICES
  • 5.
    MARKETS AND APPLICATIONS Mobile Devices& Substrates Segment EBITDA Automotive, Industrial, Medical Segment EBITDA Segment revenueSegment revenue SEGMENTS € 779million € 350million € 29million€ 159million MOBILE DEVICES _ Smartphones _ Wearables (smart­glasses, earphones, smart­watches) _ Notebooks _ Cameras _ Tablets _ SSDs IC SUBSTRATES _ High-performance ­computers _ Microservers _ Client PCs _ Edge computing _ 5G base stations INDUSTRIAL _ Smart building, ­farming, grid, lighting, ­manufacturing, retail and transportation _ Telecom infrastructure _ Power management _ Robots _ Drones AUTOMOTIVE _ Advanced driver­assistance systems _ Safety applications (radar, lidar, camera, vehicle-to-X communi­cation) _ Power supply for motor systems MEDICAL _ Diagnostics and ­imaging systems (X-ray, MRI, ­ultrasound) _ Therapy devices/applica- tions (pacemakers, neuro­ stimulators, hearing aids, prostheses, drug delivery) _ Patient monitoring (­activity trackers, ­glucose monitors)
  • 6.
    2 10 6Networking across all areasof life and work makes everyday life easier. Data transfer in real time throws the door wide open to new applications. Smart society 5G GESCHÄFTSBERICHT 2019/20AT S ANNUAL REPORT 2019/20AT S
  • 7.
    3 14 18 78 116 186 GO BIG 6– Smart society 10 – 5G 14 – Medical technology Company 20 – Management interview 28 – Strategy 32 – Report of the Supervisory Board 35 – Consolidated corporate governance report 44 – Non-financial report 75 – ATS on the capital market Group management report 80 – Market and industry environment 87 – Economic report 100 – Other statutory information 104 – Research and development 107 – Opportunities and risks 115 – Outlook Consolidated financial ­statements 118 – Consolidated statement of profit or loss 118 – Consolidated statement of comprehensive income 119 – Consolidated statement of financial position 120 – Consolidated statement of cash flows 121 – Consolidated statement of changes in equity 122 – Notes to the consolidated financial statements 179 – Statement of all legal representatives 180 – Auditor’s report Information 188 – Ten-year timeline 190 – Glossary 192 – Imprint People stay healthy for ­longer. Physical restrictions are compensated for. Medical technology 4 FIRST CHOICE FOR ADVANCED APPLICATIONS
  • 8.
    4 175With the increasingnet- working of devices, data volume will climb by 26% annually, up to a level of 175 zettabytes by 2025. In bytes that would be 175 plus 21 zeros. GESCHÄFTSBERICHT 2019/20AT S ANNUAL REPORT 2019/20AT S
  • 9.
    5 GO BIG FIRST CHOICE FOR ADVANCEDAPPLICATIONS Digital networking is bringing the world and industries closer together. For us, this opens up paths to new ­appli­cations – and new growth. Our products are becoming increasingly powerful while taking up less space, because the growing data volumes still need to be securely processed, stored and transported. And we support our customers with comprehensive solutions – these are the elements they need to successfully develop their ­business models.
  • 10.
    6 IETY 7SOC.8billion people live onEarth in 2020. Smart society – Humans and machines as a team Digital transformation is leading the economy into a new era: many new business models are no longer just technology-­ based but increasingly also driven by people’s everyday life. This is made possible by smart networking across all areas of work and life. GESCHÄFTSBERICHT 2019/20AT S ANNUAL REPORT 2019/20AT S
  • 11.
    7 56 Intelligent devices andmachines are ­connected with one another, and with the Internet. They collect information about their environment, linking and ­analysing it. As early as 2008, more ­devices were connected to the Internet than there were people. devices will be connected to the Internet in 2025. The new model of society is techno- logy-based, focuses on people and comprises a variety of smart application scenarios. billion Two decades ago, technology pioneer Kevin Ashton used the term “Internet of Things” (IoT) for the first time in a presentation at the ­Massachusetts Institute of Technology. The IoT ­connects physical objects with the virtual world. FIRST CHOICE FOR ADVANCED APPLICATIONS
  • 12.
    8 -- DATA VOLUME EXPLODES Thevolume of data to be processed will see a massive increase in the coming years. As a result, computing performance in cloud and decen- tralised structures will also surge. Likewise, demand for high-performance micro­processors will also grow. In preparation for this development, ATS takes a forward-looking approach – with high investments and a targeted ex- pansion of the value chain. Interconnectedness is driven by the opportunities of mobile communication, social media and the Internet. In addition to texts, enormous data volumes are generated with photos and videos and frequently distribut- ed over the Internet or mobile communication networks. Such data are then processed and stored in data centres and all types of mobile devices (smart- phones, notebooks, etc.). The 5G mobile communication technology enables transmission of higher data volumes not only via telephone and glass fibre lines – it will also make mobile transmission possible at high speed (data rate) and quality. Apart from pure mobile communication, many other segments, including automotive, industrial, trade, transport, media, entertainment, healthcare and administration, can benefit from the transfer and processing possibilities of large data volume. This is referred to as big data. With the increasing networking of devices, the volume of data will climb by 26% annually, up to a level of 175 zettabytes by 2025. Here are two examples to illustrate the size of this number: a digitally connected air- plane alone produces the same amount of data in a single day as the Hubble telescope does in five months. And the data created in a smart factory in one day correspond to 500 billion pages of text. COVID-19 is causing an ­additional shift of companies’ business activities into the net: online conferences and remote working are increasing digital data exchange. The market for IC substrates is ­growing. ATS continues to ex- pand this segment, thus providing for sustainable growth. 5G BIG DATA AI IOT Game changers for innovative applications_ GESCHÄFTSBERICHT 2019/20AT S ANNUAL REPORT 2019/20AT S
  • 13.
    9 11PAVING THE WAYTO AUTONOMOUS DRIVING The automotive industry will also ben- efit greatly from the digital development. The number of digital functionalities keeps growing year by year. Advanced driver assistance systems (ADAS) require many sensors such as radar, lidar, GPS or cameras with local data processing. In the coming five years, electronic components will account for 35% of the cost of vehicles, which is twice as much as today. With the Vehicle-to-X (V2X) technology, vehicles will com- municate with their environment in real time in the future. The combination of sensor data, externally transmitted data and internal data processing will en- able completely autonomous driving. By 2025, more than 100 million vehicles worldwide will be digitally connected and data transmission will grow to up to 100 million gigabytes per month. Even if we still have to wait for a few years to see self-driving cars in everyday traffic: digital networking is growing exponentially in the automo- tive sector. annual growth for the IC substrate segment is forecast by experts for the coming years.The transmission, processing and storage of increasingly ­advanced data and processes requires powerful printed circuit boards and IC substrates. Given its technology and market ­leadership in these segments, ATS is in an excellent position to also benefit from this promising market. Growth % A new plant in China is already under construction. The planned investment volume of up to € 1 billion underlines ATS’s aspiration to significantly expand its market position. ATS will expand its IC substrate capacities over the coming years. FIRST CHOICE FOR ADVANCED APPLICATIONS
  • 14.
    10 5GThe new network –fast, ­reliable, available The commercial roll-out of 5G, the next generation of mobile broadband, is imminent. The 5G network brings exponentially higher speeds and significantly lower ­latencies. Secure data transmission, effectually in real time, allows completely new, previously unthinkable appli­cations. This opens up significant potential for ATS. GESCHÄFTSBERICHT 2019/20AT S ANNUAL REPORT 2019/20AT S
  • 15.
    11 24 NoresThe transmission rate ofthe fifth-generation mobile Internet will be more than ten times faster by 2025 than the current LTE standard. 5G makes it possible: in the future, vehicles will use the new standard to communi- cate with their environment in real time. countries have already introduced 5G. Most of them are in East Asia. STEP BY STEP TO A NEW LEVEL OF INTERCONNECTEDNESS As the markets became increasingly integrated, the global economy developed very successfully in recent years. The new 5G mobile communication standard will once again significantly boost this develop- ment in the years to come. According to calculations of consulting firm ­McKinsey, economic output will increase by up to US$ 2 trillion in the next ten years with the introduction and utilisation of the standard. The advantages of 5G will become apparent step by step: initially, the focus will be on the use of devices with very high data trans- mission rates of up to 10 gigabit/s. This includes, for example, the area of (mobile) communication. Subsequently, applications for time-critical and fail-safe uses such as autonomous driving will follow. A third step will mainly comprise applications where a large number of machines connected with one another exchange data autonomously and efficiently – the Internet of Things. One example is the automated tracking of goods. So it is not only network equipment and mobile communication providers that benefit from the growth of 5G applications but a wide variety of industries and seg- ments – from mechanical engineering to automation enterprises and public organisations such as hospitals, universities and authorities. In other words: 5G will provide a gigantic boost for productivity. The 5G standard will be crucial to the Internet of Things (IoT): according to projections of the GSM Association (GSMA), the number of global IoT connec- tions will more than ­double ­between 2019 and 2025, ­increasing to nearly 25 billion. 10times faster Everything is connected to everything – today, this is still a vision of the future. In only a few years, this vision will have started to take shape. FIRST CHOICE FOR ADVANCED APPLICATIONS
  • 16.
    12 5.2 billion peopleused mobile services in late 2019 according to the GSMA. That is 67% of the world’s population. In combination with other connected devices this offers enormous potential for the Internet of Things. billionsmartphones will be sold globally by 2025 according to market research ­company IDC. This figure is expected to ­increase to 5.8 billion by 2025. ­Consequently, the need for the 5G standard, which makes high data transfer rates possible in mobile communication, is also growing. The introduction of 5G will in turn continue to boost the global exchange of data. 1.5 GESCHÄFTSBERICHT 2019/20AT S ANNUAL REPORT 2019/20AT S
  • 17.
    13 THE DAWNING OFA NEW ERA IN MOBILE COMMUNICATION The new standard is now entering the acceleration phase in the mobile communication markets: compared with 2019, the number of smart- phones sold will increase by roughly 200 million to 1.5 billion in 2025. More than half will be 5G-capable by 2025. In 2019, only about 20 million mobile devices had 5G capability. Although the current COVID-19 pandemic puts these forecasts into perspective, the direction is clear: 5G will prevail in mobile communication sooner rather than later. According to the GSMA, the network is currently available in 24 countries with South Korea in the leading position. It was the first country to introduce a nationwide commercial 5G network in April 2019. The USA, Australia, ­Qatar, Switzerland, Finland, Spain, China and the United Arab ­Emirates are also well on track setting up their infrastructure. In terms of geographic ­regions, East Asia has made the biggest progress, while Europe lags behind due to its hetero- geneous infrastructures and outstanding frequency allocation processes in many countries. To support the leap to the new standard and further increase con- sumers’ interest, network providers are expected to invest roughly US$ 1.1 trillion between 2020 and 2025; about 80% of these investments will target the 5G tech- nology, demonstrating the market’s great expectations of the new standard. As transmission speed and data volume grow, the requirements placed on devices will also increase. Ever more complex systems and electron- ic circuits require particularly powerful IC substrates and printed circuit boards. mSAP (modified Semi-Additive Process) and HDI (High Density Interconnect) are leading technologies for the production of printed circuit boards. ATS is the technology and market leader for both. Recently ATS has also achieved a top technology position for IC substrates used in processors and is currently investing massively in building further capacity, and in research and development. Features such as minimum width and spacing between traces as well as the most accurate control of the trace profile and the use of new materials enable significant im- provements in electromagnetic signal transmission as required for state-of-the-art 5G technology. Year by year, ATS’s products are becoming more powerful, relia- ble and compact. This is also attributable to ATS’s broad experience. Our solu- tions can be found in the products of a wide range of industries and applications. With each adaptation, ATS gains new knowledge, which can then be used for solutions in other ­application areas. Businesses will not be the only ones to benefit from the 5G network – an ever increasing number of applications are also available to private users. FIRST CHOICE FOR ADVANCED APPLICATIONS
  • 18.
    14 Control and regulationunits of prostheses require particularly flexible printed circuit boards. ATS uses an extremely flexible base material with rolled copper to guarantee the required ben- ding cycles and small bend radii. GESCHÄFTSBERICHT 2019/20AT S ANNUAL REPORT 2019/20AT S
  • 19.
    15 As the world’spopulation keeps growing and aging, the need for healthcare applications will continue to increase and many new – especially digital – products will enter the market. ATS has every­thing it takes to participate in this development and expand its position in this market segment. Digital health – the patient at the centre of digital solutions TECHNO LOGY ME DI CAL FIRST CHOICE FOR ADVANCED APPLICATIONS
  • 20.
    16 Highly complex printedcircuit board ­solutions are used to meet the high require- ments of diagnostic imaging. Mobile collection and processing of patient data requires ever more functions on ever ­smaller space – and consequently a miniatu- risation of electronics. Artificial intelligence ­makes it possible that 20% of ­medical services can also be performed ­digitally. GESCHÄFTSBERICHT 2019/20AT S ANNUAL REPORT 2019/20AT S
  • 21.
    17 28%annual growth is projectedfor the overall digital health market. The digital health market will therefore be worth just over US$ 500 billion in 2025. Priority is given to technical inno­ vations: ATS aims to utilise roughly 8,000 ­additional square metres for new production lines at its site in Ansan, South Korea, to manufacture printed circuit boards for applications in medical technology by the end of 2020. If everything goes according to plan, the new production facilities will have obtained all required customer qualifications by mid- 2021. Overall, this project involves an investment of roughly € 30 million in this site. DIGITAL TRANSFORMATION IN HEALTHCARE Digitalisation will fundamentally change the healthcare system in the years to come. Over the past years, digital data collection directly on the patient as well as digital health checks and the demand for digital healthcare services by patients – in other words: digital health – have gained growing importance. Along with companies currently repre- sented in the healthcare market such as medical technology and therapy device manufacturers, digital companies selling smartwatches in addition to software will play an important role – mainly because such consum- er devices are getting continuously better at measuring and processing health data and some of them already have medical certification. Smartwatches are increasingly used as devices for mobile patient data collection. In addition, a wide variety of sensors are being developed which can either be applied to human skin or implanted near the surface to take a person’s temperature, pulse, blood pressure or blood sugar level. The measuring data can often be read via smartphones in an easy and contactless process. Examples of therapy devices are pacemak- ers or implants for neurostimulation. Miniaturisation in electronics can be achieved using a va- riety of printed circuit boards, substrate and module integration technol- ogies such as embedding. Also, ATS is one of just a few companies cer- tified in accordance with the EN ISO 13485 standard for medical devices. Particularly high demands are placed on pacemakers and defibrillators. The printed circuit boards integrated into implants are highly advanced and subject to special qualification tests. ATS also creates innovative solutions for private use: the Cycle Tracker for example, which was co-developed by ATS, helps women to record and predict their menstruation cycle. The user places temperature-sensitive sensor electronics under the arm with a plaster and enables an app on her smartphone. Information is then continuously transmitted to the phone via NFC (Near Field Communication). Another example: patients with type 1 diabetes use a smart insulin pump supported by elements made by ATS. It is fixed directly to the body with a plaster. By pumping insulin into the body continuously, the blood sugar level is controlled and stabilised. The application consists of two main units – the plaster with the needle, and the insulin cartridge, which is renewed on a regular basis. The pump and the electronic control unit remain functional together throughout the lifetime of the product. In December 2019, ATS broke ground on its site in Ansan, South Korea, for an upgrade and the expansion of its production. This un- derpins ATS’s claim to be one of the leading suppliers of printed circuit boards and interconnect solutions in the medical segment in the future. FIRST CHOICE FOR ADVANCED APPLICATIONS
  • 22.
  • 23.
    24 28 31 34 45 63 20 _ Managementinterview 28 _ Strategy 32 _ Report of the Supervisory Board 35 _ Consolidated corporate governance report 44 _ Non-financial report 75 _ ATS on the capital market
  • 24.
    FIRST CHOICE FOR ADVANCEDAPPLICATIONS 20 ANNUAL REPORT 2019/20AT S MANAGEMENT INTERVIEW In view of the COVID-19 pandemic, we have not carried out a ­Management Board photo shoot this year and ­instead are making use of existing photo material.
  • 25.
    FIRST CHOICE FOR ADVANCEDAPPLICATIONS 21 ANNUAL REPORT 2019/20AT S MANAGEMENT INTERVIEW We are on a very ­promising path. INT ERV IEW
  • 26.
    ANNUAL REPORT 2019/20ATS FIRST CHOICE FOR ADVANCED APPLICATIONS 22 MANAGEMENT INTERVIEW The financial year 2019/20 is behind us. Looking back, how did it develop overall? Andreas Gerstenmayer Operationally, we can be quite satisfied. We dealt with the issues we intended to address. We made progress on the implementation of our strategy and our plants are well on track. In terms of volume, our capacity was not utilised to the extent planned, but I think we used the year well to prepare for future challenges. Economically, we certainly did not meet all our goals. However, we were also faced with a challenging operating environment. In the automotive sector, uncertainties about the future of the powertrain dampened demand. The trade conflict between the USA and China continued, though at a lower level. And Euro­ pean industry investment behaviour remained at an unex- pectedly weak level. On top of that, we saw the outbreak of ­COVID-19 in the final quarter, which forced us to temporarily close plants in China. What does that mean in terms of actual figures? Monika Stoisser-Göhring That we fell short of expectations on the earnings side. We surpassed the one-billion-­ euro revenue mark once again. However, revenue was 2.7% lower than in the previous year. At least the EBITDA margin, at 19.4%, was within our adjusted target corridor of 18 to 20%. Earnings per share amounted to € 0.34 after interest on hybrid capital, which was significantly lower than last year. Along with unexpectedly difficult market conditions, this was also due to the intense prep­ aration for the strategic expansion of our business. Andreas Gerstenmayer At the beginning of the fourth quarter, we were still confident in the Management Board that we would meet our guidance for revenue and earnings. And we have done everything possible in the last few months to achieve this goal. In particular, we reacted very rapidly to ­COVID-­19. Wherever we could influence something, we did. I even think that we were able to keep the economic impact low due to our measures. This could well have ended very differently. We were among the first companies, if not the first, to resume production. At our Chongqing I plant we never stopped produc- tion, even with all the official measures imposed. Despite low earnings figures you are planning to pay out a dividend again this year. Monika Stoisser-Göhring That’s correct. Against the background of the solid business development, we will pro- pose a dividend of € 0.25 per share to this year’s Annual General Meeting, together with the Supervisory Board. Even though the current market situation is currently rather unclear due to the ex- ceptional circumstances. And because we are deeply convinced that based on our position and the course we are pursuing, we are excellently prepared for the future. We are deeply convinced that based on our position and the course we are pursuing, we are excellently pre- pared for the future. “ Monika Stoisser-Göhring, CFO Monika Stoisser-Göhring
  • 27.
    FIRST CHOICE FOR ADVANCEDAPPLICATIONS ANNUAL REPORT 2019/20AT S 23 MANAGEMENT INTERVIEW How are ATS’s activities in the strategic areas 5G, IC substrates and big data developing? Andreas Gerstenmayer We made considerable progress in all three areas. In the area of 5G we used to focus primarily on mainboards for mobile devices. We now have the first contracts for printed circuit boards for modules and are dis- cussing topics such as 5G base stations and antenna technology with infrastructure providers. That means that we can address significantly more applications today than even a year ago. In the area of IC substrates, we made major investment decisions and created the basis enabling us to be present in precisely those markets that will grow in the coming years. This is also underscored by the decision to build Chongqing III. We will be able to produce large volumes of the latest technologies very soon. And thanks to our strength in the area of IC substrates, we are also in a good position for big data. As data volumes explode, we will see very attractive jobs in the years to come. Which industries will be the first to recover from the crisis? Andreas Gerstenmayer Similar to the damage in the industries, it is also very difficult to estimate which sector will be the first to bounce back: will it be capital goods or rather consumer goods? One thing we can perhaps say is that anything related to infrastructure will pick up sooner. This is because, from experience, states deliberately provide impetus in these areas to reduce unemployment, increase purchasing power and ultimately boost the economy again. Heinz Moitzi We can also assume that the topic of 5G will gain momentum: we are currently experiencing how fast people get used to digital communication in everyday busi- ness. For many employees, working from home and video con- ferences did not even feature as a topic only a few months ago. Today they use these tools as a matter of course – with all the restrictions this entails. One thing has become clear: today’s net- work infrastructure is not at all sufficient for digital working. This will be the next big push. The automotive industry has been particularly hard hit by the shutdown. How do you see this situation from the angle of ATS? Andreas Gerstenmayer This is another area where it is difficult to assess how strong the impact is – and to what extent we will be affected at the end of the day. But we definitely assume that there will be effects. In the car market in particular, we will have to watch the development very carefully in the coming months. This is a market with a complex supply chain, which has recently ground to a halt. I think that this seg- ment will tend to take longer to recover. Have you adapted or sharpened your strategy at all in view of COVID-19? Andreas Gerstenmayer We have worked very intensively on our strategy over the past few years. We are sure that the topics we aim to implement as part of our mid-term strategy are still valid. I don’t see any aspect in any of our stra- tegic ­focus areas that would make the topics obsolete. On the contrary: the trends we see are sustainably intact. Only in terms of timing there may be delays in one place or another due to the extraordinary situation the global economy is facing. 5G “Today’s network infrastructure is not at all sufficient for digital working.” Heinz Moitzi
  • 28.
    ANNUAL REPORT 2019/20ATS FIRST CHOICE FOR ADVANCED APPLICATIONS 24 MANAGEMENT INTERVIEW And with respect to the economic positioning – do you see any need for adjustment? Monika Stoisser-Göhring No. ATS continues to be very stable economically: our equity ratio is very solid at 41% and our debt repayment period – at 1.3 years – is significantly below our self-imposed maximum of three years. In terms of investments, everything is consistent with our plans; because of changes in the content of our projects, we spent around € 90 million less in the past financial year than originally budgeted. In accordance with our scheduling, we were able to largely fi- nance our investments from our own resources in the past fi- nancial year. Should we actually require additional funds for our projects, we have different options. It goes without saying that we put a particular focus on costs in times like these. As a pre- caution, but also because we still aspire to serve the main part of our capital requirements for our projects from our cash flow. Ms Stoisser-Göhring, you recently received the CFO Award. That proves that you do many things right … Monika Stoisser-Göhring It shows that ATS does many things right. Within the Management Board we act based on good cooperation and a shared understanding. Against this background, a lot can be done in finance. I think that finance tools such as hybrid bonds and promissory note loans, which were recently introduced at ATS, are part of the standard portfolio in modern corporate finance. Starting busi- ness relationships with Chinese banks has also been a logical step for us. The vast majority of our non-current assets is based in Asia and we know the market and the mentality of its people well. By working together in finance we gain important trust, not only among the banks. To what extent will the changed market situation bring new opportunities for ATS, for example in medical technology? Andreas Gerstenmayer Of course we look at the markets differently in a changed situation and check out additional opportunities, also in the medical sector. We have to admit, however, that many of the things which are in great demand right now use standard technologies that we very de- liberately did not address in the past. But of course we are also looking for ways to help in the current situation. This is why we are now producing components for local medical technology manufacturers at our plant in India despite the shutdown. Advanced applications, for example for pacemakers, hearing aids or insulin pumps, continue to be very interesting for us. This is where our future market lies, and consequently we are focusing on this market with our comprehensive technology upgrade at our plant in Ansan, South Korea. With the investments in Ansan and, above all, in Chongqing, ATS is opening the door to its second billion in revenue. Where will your employees come from? Monika Stoisser-Göhring That is a demanding task, especially since it is important to recruit employees with the appropriate skills. We need people who deal with the tech- nical side of megatrends such as autonomous driving and digi- tal networking. To bring these people on board, we have set up the “Talent Mapping” project. We have defined the expertise we will need in the future within this project so that we can now address professionals in areas like microelectronics, RF/IC design, chemistry and physics in a targeted manner. The pro- ject will be accompanied by an international talent programme, through which we send graduates of technical studies to China for a ­period of time after they have completed a year of training with us. 41% “Our equity ratio is very solid at 41% and our debt repay- ment period – at 1.3 ­years – is significantly below our self-­ imposed maximum of three years.” Monika Stoisser-Göhring
  • 29.
    FIRST CHOICE FOR ADVANCEDAPPLICATIONS ANNUAL REPORT 2019/20AT S 25 MANAGEMENT INTERVIEW The young generation nowadays increasingly chooses employers based on their value profile … Monika Stoisser-Göhring That is a good thing, because values are also important to us. We believe that a ­stable foundation of values is a necessary prerequisite for long- term success. That is why we put a strong focus on topics such as sustainability, governance and diversity and set ambitious targets: for example, we aim to raise the share of women from 21% today to 30% by 2025. Heinz Moitzi In our production, we are already operating at a high level in terms of environmental matters and work safety. But we also see room for improvement in this area: we aim to cover 80% of our energy supply with renewable en- ergies in the future. And we are planning a life cycle assessment for our product groups in the future. You are also entering aerospace technology now. What are the prospects in this segment? Heinz Moitzi This has evolved over the last few years and shows that we can keep adding “new” segments to our core business. We have acquired a very demanding certification (NADCAP) which is required for supplying the aerospace industry, because we are aware that part of the communication infrastruc- ture also goes into space. We have learned that our technologies can help these industries to cost-effectively implement miniatur- isation and weight reduction, which are increasingly gaining im- portance in this segment, too. Andreas Gerstenmayer In this context, the 5G de- velopment should also be mentioned. How will network providers cost-effectively reach those who do not live in conurbations in the future? At the end of the day, it will only be possible using satel- lite technology. Communication satellites, transmission stations, antenna technology, satellite launches – we can make a small, but important contribution with our solutions in all of these areas. Communication satellites, transmission stations, antenna technology, satellite launches – we can make a small, but important contribution. “ Andreas Gerstenmayer, CEO Andreas Gerstenmayer
  • 30.
    ANNUAL REPORT 2019/20ATS FIRST CHOICE FOR ADVANCED APPLICATIONS 26 MANAGEMENT INTERVIEW Europe is occasionally said to have a need to catch up as a location for innovation. To what extent does that limit ATS in its development? Heinz Moitzi I would not quite put it that way that Europe lags behind other continents. Working on electronic innovation is a global business for a company of our size today. Thanks to its global positioning, ATS can combine the advan- tages of Asia, the USA and Europe well. We collaborate with uni- versities and electronics institutions on different continents: in Germany, for example, we work with the Fraunhofer Institute and in the USA with the International Electronics Manufactur- ing Initiative (iNEMI), and of course we also collaborate with ­Austrian universities. On top of that, we work very closely with our customers in development. Industrial production is where Europe has a need to catch up: a region which only does research but has no production is blind on one eye. However, the EU has now realised that and is promoting basic technologies again. This creates the basis for bringing back some parts of the supply chain, after it moved to Asia around the turn of the millennium. As digitalisation in- creases, cost differences can be balanced out better in Europe. Here, ATS is already in a very good position. Leoben has been, and will remain, a central location for us as a production site and research centre for special applications. What new technological potential do you see for the future? Heinz Moitzi First of all, let me say that ATS is moving in technology segments today that we could only dream of even a few years ago. And our development is rapidly pro- gressing. Let’s take miniaturisation for example: Today we op- erate in the range of trace widths of 10μm and with more than 1,000 laser drillings per second, with a diameter of 40μm or less. In some areas we are already advancing to the nano seg- ment, getting in close contact with semiconductors. It has always been one of ATS’s skills to see what needs to be done and develop the right solutions. Heinz Moitzi, COO Heinz Moitzi “
  • 31.
    FIRST CHOICE FOR ADVANCEDAPPLICATIONS ANNUAL REPORT 2019/20AT S 27 MANAGEMENT INTERVIEW That means that we are currently on the thresh- old to new technological territory. Developing the appropriate technologies for this is a demanding job. But it has always been one of ATS’s skills to see what needs to be done and develop the right solutions. Where possible, we do this on our own, and where useful, we collaborate with partners. COVID-19 has put the industry in crisis mode over night. How did the crisis management work out at ATS? Andreas Gerstenmayer I think we can pay a huge compliment to all our teams at all locations. In China, we managed to at least produce at one plant, even during the peak of the crisis – even if it was not with the full staff. We were also able to restart operations at the other plants after a relatively short period of time. While other factories were still shut down, we were able to produce significant volumes again. Heinz Moitzi What helped us was that we had been properly sensitised after SARS in 2003. We responded quickly and took initial measures in December and were able to cope with a variety of issues based on sophisticated crisis management within a very short period of time: implementing safety concepts, reorganising logistics and meeting official re- quirements. The well-coordinated processes helped us not only in China, but also in India, South Korea and Austria. At no time did we have problems with protective masks and to this day we don’t know of a single infection in our company. Sounds almost easy … Heinz Moitzi Of course it was not quite that easy. What I mean to say is that the critical topics were not so much the processes at our production sites – we managed to create the appropriate framework conditions very quickly at the work- places and in the canteens. Supply chain topics, for example, were more challenging. If you want to set up machines while travel restrictions are in place and service technicians have to undergo quarantine for safety reasons, no manual will have the advice you need, but you have to find effective solutions fast. The year 2020/21: How is ATS approaching the current year? Can the medium-term forecast be maintained in the current situation? Andreas Gerstenmayer In 2020/21 we will have to “drive by sight” and permanently review our assumptions – at monthly rather than quarterly intervals. With COVID-19 we are currently learning in the global economy that things can literal- ly change over night. But this situation does not mean that we will reduce capacity in production or discontinue our future pro- grammes. From today’s perspective our strategy is intact and suf- ficiently robust to support the medium-term guidance: doubling revenue with an EBITDA margin of 25% to 30%. As responsible entrepreneurs, we of course have to review this again and again, and make decisions: are our key indicators still correct or do we have to make adjustments? What we can do right now is to get through the current phase as well as possible. To this end, we are very restrictive on current spending. At the same time, we keep driving our strategic projects for IC substrates and modules. “From today’s perspective our strategy is intact and sufficiently robust to support the medium-term guidance: doubling revenue with an EBITDA margin of Andreas Gerstenmayer 25%to 30%
  • 32.
    ANNUAL REPORT 2019/20ATS FIRST CHOICE FOR ADVANCED APPLICATIONS 28 STRATEGY COMPANY STRATEGIC GOALS 4 SUSTAINABLE MANAGEMENT _80% renewable energy _Life cycle assessment of product groups _30% women in leadership positions FIRST CHOICE FOR ADVANCED APPLICATIONS 1 EXPANSION OF TECHNOLOGY LEADERSHIP _Leading provider of advanced interconnect solutions _Innovation revenue rate: 20% 2 FOCUS ON SUSTAINABLE PROFITABLE GROWTH _Medium-term revenue target of € 2 billion _Continuation of constant and sustainable improvement in margins _Medium-term EBITDA margin target of 25% to 30% 3 CREATE SHAREHOLDER VALUE _Long-term ROCE of ≥12% “MORE THAN ATS”: GROWING PROFITABLY WITH THE MARKETS As digitalisation progresses, the requirements on digital infra- structure will grow massively in the next several years – both with respect to the devices themselves (modularisation, miniaturisa- tion) and to their environment (data storage, transmission and processing). The new 5G mobile communication standard will exponentially increase the data volume transmitted and take the capacity requirements for decentralised computing performance to a new level. Consequently, the demand for high-end IC substrates, modules and high-performance microprocessors will also grow dispropor- tionately. As a leading manufacturer of high-end printed circuit boards and IC substrates, ATS aims to leverage this potential. Our company is excellently positioned in the market and in- tends to significantly expand its leading edge through capacity, per­formance and technology enhancements. Once the markets pick up again, this should enable us to double our revenue to € 2 billion in the medium term (time horizon: 5 years), with a target EBITDA margin of 25% to 30%. VISION AND STRATEGIC GOALS Our growth strategy is based on our vision “First choice for ad- vanced applications”. This is closely linked with our aspiration to be the contact of choice for customers in our market segment based on our top performance – for high-end printed circuit boards and IC substrates, and in the future also for modules and appropriate system and interconnect solutions. On our path to implementation, we are guided by four strategic goals: 1. Expansion of technology leadership We strive to be the leading provider of advanced interconnect solutions. To achieve this, we aim for an innovation revenue rate of 20%. When it comes to strategic implementation, we use a dual ap- proach: first of all, we industrialise new interconnect solutions by combining existing and new technologies as part of the ATS Toolbox (high-end printed circuit boards, IC substrates, embed- ding). In the course of this approach, we increasingly position ourselves as a proactive system development partner for our
  • 33.
    FIRST CHOICE FOR ADVANCEDAPPLICATIONS ANNUAL REPORT 2019/20AT S 29 COMPANY customers who will take over the entire production process for them  – from the production of printed circuit boards and IC substrates to the manufacturing of modules and design, manu- facturing and test services. As a result, ATS will evolve from a manufacturer to an interconnect solution provider. 2. Sustainable profitable growth We intend to increase our company’s revenue to € 2 billion in the coming years, aiming for an EBITDA margin in the range of 25% to 30%. We use four levers for the strategic implementation: a) Customer orientation and highest service level: We sup- port our customers by providing technical advice as well as ad- ditional design, simulation and test services in order to enable the optimum interconnect solution. b) Operational excellence: In our processes, we focus on effi- ciency, productivity with highest capacity utilisation and a com- petitive cost structure. In doing so, we are also prepared for par- ticularly complex and individual manufacturing requirements in different lot sizes in premium quality. c) Focus on fast-growing and profitable applications: We concentrate on technologically advanced applications with ­disproportionately high market growth and double-digit EBITDA margin potential. d) Focus on cash flow generation and optimisation of the fi- nancing structure: We strengthen our internal financing power for further investment cycles by maintaining our key figures at a high level: We aim for an equity ratio 40% and a debt repay- ment period 3 years. 3. Creation of shareholder value The interest on the capital employed by our shareholders (ROCE) should amount to at least 12% in the long term. The return on capital employed thus exceeds the weighted average cost of cap- ital of roughly 8.7% of comparable companies. At the same time, we pursue a transparent dividend policy based on investment cy- cles and profit for the year. 4. Sustainable management We will only be able to expand our technology leadership and achieve sustainable profitable growth if our actions are value-­ based and we generate added value for all stakeholder groups. Compliance with high standards in the areas of ethics, working conditions, health and safety, environment and quality are basic requirements on the road to success. The Responsible Business Alliance, the OECD Guidelines for Multinational Enterprises, the Sustainable Development Goals of the United Nations (SDGs) and our company values serve as our compass. Our strategic focus areas are derived from the above as well as the ATS materiality analysis, customer requirements and global developments in environmental and social matters. STRATEGIC FIELDS OF ACTION One of the strengths of ATS is that the company understands its customers’ challenges and develops customised intercon- nect solutions together with them early on. This is an ability we will maintain and expand on in the future. In this context, ATS increasingly focuses on combining the possibilities of the core business with new technologies. To achieve targeted growth, we drive our business based on the following four strategic fields of action: 1. Expansion of the core business ATS strengthens its core competence in the area of high-end printed circuit boards and IC substrates and continues to de­ velop its business in the existing market segments; here, the market promises solid growth. 2. Expansion of customer and application portfolio ATS uses proven technologies to implement innovative solu- tions for other (groups of) customers and applications, thus ex- tending the life cycle of existing technologies and expanding its earnings base.
  • 34.
    ANNUAL REPORT 2019/20ATS FIRST CHOICE FOR ADVANCED APPLICATIONS 30 COMPANY EXPANSION OF CORE BUSINESS in all market segments EXPANSION OF THE PORTFOLIO to implement innovative solutions for other customers and applications PROACTIVE PRODUCT DEVELOPMENT for specific customer requirements INDUSTRIALISATION of new technologies COMBINING OUR CORE BUSINESS WITH NEW TECHNOLOGIES 3. Proactive product development ATS intensifies its collaboration with customers during early development phases and develops innovative solutions for spe- cific customer requirements by combining the core business with new technologies. 4. Industrialising new technologies ATS drives the development of new technologies and broadens its positioning in the value chain, among other things through new solutions for the module business. ATS thus generates ad- ditional revenue and increases its leading edge over competitors. MARKET GROWTH DRIVERS: EXPONENTIALLY GROWING DATA VOLUME Digitalisation and global networking generate exponentially grow- ing data volumes. Driven by a wide variety of applications such as communication, Industry 4.0, autonomous driving and smart homes, permanently increasing data volumes need to be trans- mitted, processed and analysed. This boosts, among other things, the business of data centres and cloud computing applications. For ATS this development offers significant growth opportunities “MORE THAN ATS” – CORPORATE STRATEGY in the field of IC substrates for server and network applications. The required performance and computing power of the proces- sors lead to massively growing technological requirements on IC substrates. At the same time, the digitalisation trend drives the growing need for computing performance in end devices (edge computing), which opens up interesting opportunities for ATS in terms of profitable growth in the printed circuit board business in all market segments. TECHNOLOGICAL GROWTH DRIVERS: MINIATURISATION AND FUNCTIONAL INTEGRATION The development of the electronics industry is currently strongly influenced by the trends of miniaturisation and functional inte- gration. At the same time, the life cycles of products are getting shorter – while a certain period of time is required for the de- velopment processes of new products. This boosts the trend to- wards modularisation, i.e., the development of highly integrated functional components featuring a defined performance spec- trum which can be used in different applications and devices. The use of these predeveloped modules enables suppliers of devices
  • 35.
    FIRST CHOICE FOR ADVANCEDAPPLICATIONS ANNUAL REPORT 2019/20AT S 31 COMPANY to further reduce the time to market. This process will fundamen- tally change the supply chain in the electronics industry. Based on the modules’ high integration density, a wide variety of technolo- gies will be used for the production of the modules MODULARISATION TREND: ADDITIONAL BUSINESS OPPORTUNITIES The trend towards modularisation in electronics is becoming increasingly apparent not only in consumer, computer and communication products, but also in automotive, industrial and medical applications. As part of its growth and diversification strategy, ATS addresses the growth potential on three levels: Level 0: Expansion of the classic printed circuit board business – with a continued focus on the high-end segment. Level 1: Provision of IC substrates and high-end printed circuit boards for the rapidly growing market segment of modules. Level 2: Broadening the service spectrum in the value chain through additional module integration services such as design, assembly and test services with the objective of offering com- prehensive solutions for modules. With this approach, we are expanding our position in the value chain and opening up additional business opportunities by enter- ing the field of module integration. We will finance this growth largely from our own cash flow. The implementation of the strategy will lead to further diversi- fication of our application and customer portfolio in a high-tech market segment and help ATS to establish a good position in an important future market early on. ATS has gradually built crucial capabilities required for the im- plementation of the strategy over the last few years (with the ATS Toolbox). At the same time, all possibilities for the estab- lishment of additional required technologies and capabilities are being reviewed. In this context, ATS is considering both organic and non-organic measures. 1) In 2025 2) Compounded annual growth rate until 2025 Source: Prismark, April 2020; Yole, May 2019; A.T. Kearney, August 2018; ATS Analysis MORE THAN ATS – GROWTH AND DIVERSIFICATION STRATEGY 2 0 1 MODULE INTEGRATION SERVICES Additional capabilities needed IC SUBSTRATES, PCB FOR MODULES High growth potential PCB BUSINESS Focus on high-end segment Market size1) Market growth2) Share of module value US$ 52 billion 11% 20% US$ 18 billion 11% 3% US$ 58 billion 3% MIDTERMATSTODAY
  • 36.
    ANNUAL REPORT 2019/20ATS FIRST CHOICE FOR ADVANCED APPLICATIONS 32 COMPANY REPORT OF THE SUPERVISORY BOARD Dear shareholders, The past financial year was heavily influenced by a significant economic slowdown and the outbreak of the COVID-19 pan- demic. Despite a challenging operating environment, ATS de- livered solid results in the financial year 2019/20 and generated revenue of € 1,000.6 million (previous year: € 1,028.0 million). Although ATS very successfully managed to keep the effects of the COVID-19 pandemic on ongoing production to a mini- mum at all locations, the economic impact could not be avoided completely. EBITDA, at € 194.5 million, was lower than in the previous year at € 250.1 million. The EBITDA margin declined to 19.4% (previous year: 24.3%). After finance costs – net and income taxes, a profit of € 21.5 million was recorded for the financial year 2019/20. ACTIVITIES OF THE SUPERVISORY BOARD The Supervisory Board met six times during the financial year 2019/20. After having undergone surgery, Mr Androsch did not participate in person in more than half of the meetings of the Supervisory Board. In the financial year 2019/20, the Supervisory Board performed the tasks for which it is responsible in accordance with the law, the articles of association and rules of procedure. During the financial year from 1 April 2019 to 31 March 2020, the Super- visory Board was regularly informed by the Management Board about the market situation, strategy, operating and financial position of the Group and its investments, staff situation and planned capital expenditures in plenary and committee meet- ings, as well as in comprehensive oral and written reports. The Supervisory Board made the respective decisions accordingly. At these meetings, there was a comprehensive exchange between the Management Board and the Supervisory Board about the business development and situation of the ATS Group, includ- ing the financial performance. The Chairman of the Supervisory Board and his deputies were regularly informed about relevant developments by the Management Board, also between meet- ings of the Supervisory Board. The activities of the Supervisory Board also focused on the preparation of the budget for the financial year 2020/21 and the further technological development. In the past financial year, the consulting activities and decisions of the Supervisory Board were also related to advancing the company’s strategic development, which the Management Board coordinated with the Supervisory Board in detail on a regular basis, the expansion projects at the various production sites, in particular the expan- sion project of a new plant at the Chongqing site, and the design of the Group’s financing structure. SUPERVISORY BOARD COMMITTEES Within the Supervisory Board, the Audit Committee, the Nomina- tion and Remuneration Committee as well as the Finance Com- mittee, as standing committees, exercise certain tasks assigned to them through the rules of procedure of the Supervisory Board. The respective committees carried out detailed analyses of par- ticular matters where necessary and reported their findings to the Supervisory Board: The Audit Committee, consisting of Regina Prehofer (Chairwom- an), Gertrude Tumpel-Gugerell (finance expert, from the AGM 2019), (Gerhard Pichler (finance expert, until the AGM 2019)), Georg Riedl, Wolfgang Fleck and Günther Wölfler, focused pri- marily on the review of the annual and consolidated annual fi- nancial statements for the year ended 31 March 2019, and on planning and preparation for the audit of the annual and con-
  • 37.
    FIRST CHOICE FOR ADVANCEDAPPLICATIONS ANNUAL REPORT 2019/20AT S 33 COMPANY solidated financial statements for the financial year 2019/20 and, in particular, the preparation of a proposal for the election of the statutory auditor. By means of discussions with the audi- tor, inspection of relevant documents and discussions with the Management Board, it obtained a comprehensive view. The Au- dit Committee also monitored the effectiveness of the compa- ny-wide internal control system and the Group’s internal audit and risk management systems. The Audit Committee reported to the full Supervisory Board with respect to this monitoring and found no deficiencies. The Audit Committee convened six times in the past financial year. The meetings, which were attended by all committee members, were chaired by Regina Prehofer. In accordance with a decision made by the Supervisory Board, the members of the Nomination and Remuneration Committee are Hannes Androsch (Chairman), Willibald Dörflinger (Deputy Chairman), Georg Riedl, Wolfgang Fleck and Günther Wölfler. This committee held four meetings in the past financial year, which focused in particular on matters related to succession planning for the position of the COO. The following Supervisory Board members were appointed mem- bers of the Finance Committee: The members of the Finance Committee are Hannes Androsch (Chairman), Willibald Dörflinger, Regina Prehofer, Georg Riedl, Wolfgang Fleck and Günther Wölfler. The Finance Committee met once during the financial year 2019/20 and discussed matters of general group financing as well as project financing. SELF-EVALUATION OF THE SUPERVISORY BOARD The Supervisory Board annually carries out a self-evaluation, and did so again for the financial year 2019/20. This evaluation performed by the Supervisory Board based on a digital ques- tionnaire confirmed that its practices meet the Good Govern- ance requirements and that its organisation, work practices and target orientation are efficient and effective. ANNUAL FINANCIAL STATEMENT AND DIVIDENDS The Supervisory Board of ATS proposed to the 25th Annual General Meeting that PwC Wirtschaftsprüfung GmbH, Vienna, be appointed Company and Group auditors for the financial year 2019/20. The proposal was approved by the Annual General Meeting of 4 July 2019. The annual financial statements of AT S Austria Technologie Systemtechnik Aktiengesellschaft and the consolidated finan- cial statements for the year ended 31 March 2020 were audited by PwC Wirtschaftsprüfung GmbH, Vienna, and awarded an un- qualified audit report. The Management Report and the Group Management Report for the financial year 2019/20 were consist- ent with the annual financial statements and the consolidated financial statements. Based on the prior discussions of the Audit Committee, and, following its own detailed discussions and ex- amination, the Supervisory Board approved the Company’s an- nual financial statements for the year ended 31 March 2020 in accordance with Section 96 (4) of the Austrian Stock Corpora- tion Act (AktG) at its meeting on 4 June 2020. With regard to the non-financial report, the Management Board obtained a statement by the auditor prior to the audit, which was submitted to the Supervisory Board. Moreover, based on the prior discus- sions of the Audit Committee, and after its own detailed con- sideration and examination, the Supervisory Board approved the consolidated financial statements drawn up in accordance with IFRS pursuant to Section 245a of the Austrian Commercial Code (UGB) as well as the Management Report, the Group Manage- ment Report, the Corporate Governance Report and the Non-fi- nancial Report. The Supervisory Board review, which included extensive discussions with the auditors, did not give rise to any objections. Pursuant to the recommendation of the Audit Com- mittee, the Supervisory Board of ATS will propose to the 26th Annual General Meeting that Deloitte Audit Wirtschaftsprüfung GmbH, Vienna, be appointed Company and Group auditors for the financial year 2020/21.
  • 38.
    ANNUAL REPORT 2019/20ATS FIRST CHOICE FOR ADVANCED APPLICATIONS 34 COMPANY TheSupervisoryBoardsupportstheproposaloftheManagement Board: it will be proposed to the Annual General Meeting that out of the total profit of € 105,198,064.56 a dividend of € 0.25 per no-par share outstanding on the payout date and entitled to dividend be distributed and an amount of € 95,485,564.56 be carried forward. Furthermore, the Management and the Super­ visory Board of AT S Austria Technologie Systemtechnik Aktiengesellschaft will propose to authorise the Management Board to reclassify an amount of up to € 80,000,000.00 of the aforementioned total profit carried forward to free reserves, subject to the approval of the Supervisory Board. THANKS TO THE MANAGEMENT BOARD AND ALL ATS EMPLOYEES Despite recently difficult market developments and the chal- lenges related to the COVID-19 pandemic, ATS closed a satis- factory year. Strategically, ATS is on a promising course which provides for further growth. The Supervisory Board would like to thank all those who worked with great trust and commitment to further develop the ATS Group. We are convinced that together we will continue to ad- vance the ATS Group and achieve even more success! On behalf of the Supervisory Board Leoben-Hinterberg, 4 June 2020 Hannes Androsch m.p. Chairman of the Supervisory Board
  • 39.
    FIRST CHOICE FOR ADVANCEDAPPLICATIONS ANNUAL REPORT 2019/20AT S 35 COMPANY CONSOLIDATED CORPORATE GOVERNANCE REPORT The Austrian Code of Corporate Governance is a regulatory framework for stock corporations regarding the management and supervision of the company. The objective of the Code is the responsible management and control of enterprises and groups for the purposes of sustainable, long-term value crea- tion. This is intended to achieve a high level of transparency for all stakeholders of the company. The Code is based on the pro- visions of Austrian company, stock exchange and capital market law, the EU recommendations regarding the responsibilities of supervisory board members and the remuneration of directors and the principles of the OECD Guidelines for Corporate Gov- ernance. The Code has been amended several times since 2002. COMMITMENT TO THE AUSTRIAN CODE OF CORPORATE GOVERNANCE AT S Austria Technologie Systemtechnik Aktiengesellschaft (“ATS”) has expressly committed to compliance with the rules of the Austrian Code of Corporate Governance (ACCG) since its ad- mission to listing on the Vienna Stock Exchange on 20 May 2008. This Corporate Governance Report is based on the status of the Code as amended in January 2020. In key report items, matters of the entire Group are included, if necessary. The Code can be accessed at www.corporate-governance.at. As an internationally operating listed company, ATS con­siders the responsible and sustainable management of the ATS Group a fundamental prerequisite to achieving the corporate goal of a sustainable increase in company value considering eco- logical, social and economic aspects. EXPLANATION OF DEVIATIONS (FROM C-RULES) Based on the following explanations, ATS ensures behaviour consistent with the Code in accordance with the ACCG. C-RULES 27 AND 27A AND ALL RELATED PROVISIONS These rules were amended in the course of the review of the ACCG in December 2009 and came into force on 1 January 2010. Rules 27 and 27a contained in the version of January 2010 only applied to contracts concluded after 31 December 2009. C-Rules 27 and 27a were therefore not applicable with respect to the original agreement appointing Heinz Moitzi to the Management Board as of 1 April 2005 and were also not applied in full when that agreement was extended by the Supervisory Board in 2016. Overall, it was ensured in drawing up the Management Board contracts that existing contracts would not be interfered with and Management Board contracts concluded at a later time would also be consistent with the relevant regulations regarding remu- neration. The following deviations regarding the contracts of An- dreas Gerstenmayer, Monika Stoisser-Göhring and Heinz Moitzi currently require explanation: A long-term incentive programme (“LTI programme”) for the Management Board and key staff was implemented by resolu- tion of the Supervisory Board on 3 July 2014 based on stock ap- preciation rights (“SAR”). The Management Board and Super- visory Board work continuously to increase the per­formance of the ATS Group with respect to non-financial targets and cooperate closely regarding the long-term development of the company. However, in order to maintain the transparen- cy and traceability of target achievement as it relates to var- iable long-term remuneration, no fixed non-financial criteria for remuneration are stipulated under the long-term incentive programme. This LTI programme was continued essentially un- changed for the period 2017 to 2019. Details regarding the LTI programme can be found in the section on Management Board remuneration. The variable remuneration of the Management Board (not in the formofSAR)isdependentontheachievementoftwoperformance indicators defined in the budget for the respective financial year: return on capital employed (ROCE), with a 90% weighting, and the
  • 40.
    ANNUAL REPORT 2019/20ATS FIRST CHOICE FOR ADVANCED APPLICATIONS 36 COMPANY innovation revenue rate (IRR), with a 10% weighting. The inclusion of IRR is of major importance in giving variable remuneration a long-term focus because innovation strength – the development of new technologies, products or product types – is a crucial factor for the future business success of the Group. It can also be measured reliably. IRR represents the share of total revenue generated from technologically innovative products introduced in the past three years. The three-year reference period provides a long-term com- ponent of variable remuneration. The combination of short-term and long-term incentive pro- grammes promotes the desired long-term, sustainable steering effect over several years while at the same time accentuating the targeted dynamic company growth. Management Board members are contractually entitled to ter- mination benefits in accordance with the Salaried Employees Act, applied mutatis mutandis (“old system for severance pay”), if their appointments are terminated. As a result, severance pay- ments may exceed the amount of two annual remunerations in exceptional cases. The same could also apply in the event of a premature termination of a Management Board member’s appointment by the respective Board member for reasonable cause, or where the function becomes obsolete for legal reasons. The contracts of all members of the Management Board in- clude a “Change of Control” clause, which defines the benefits related to the termination of the Management Board appoint- ment as a result of a change of control. A change of control exists in the event that a shareholder has obtained control of the company in accordance with Section 22 of the Austrian Takeover Act (ÜbG), or the company has been merged with a non-Group legal entity, unless the value of the other legal entity amounts to less than 50% of the value of the company according to the agreed exchange ratio. In the event of a change of control, the Management Board member is entitled to resign for good cause and to terminate the Management Board contract within a defined period of time (“special termination right”). If the special termination right is exercised or the Management Board contract is terminated by mutual agreement within six months of the change of control, the Management Board member is entitled to the payment of his/her remuneration entitlements for the remaining term of this contract, however, for a maximum of three annual gross salaries. Other remuneration components shall not be included in the cal- culation of the amount of the severance payment and shall be excluded from it. If a termination benefit has been agreed in the Management Board contract, the Management Board member is also entitled to this termination benefit in the event the spe- cial termination right is exercised or the Management Board con- tract is terminated by mutual consent in the event of a change of control. Beyond that, there are no entitlements. The agreement of such a contract clause is considered market standard by the Nomination and Remuneration Committee and serves to ensure that Management Board members exercise their tasks in the best interests of the company in such situations. Management Board COMPOSITION, WORKING PRACTICES AND ORGANISATION As of 31 March 2020, the Management Board consisted of ­Andreas Gerstenmayer as Chairman of the Management Board (CEO), ­Monika Stoisser-Göhring as Chief Financial Officer (CFO) and Depu- ty Chairwoman, and Heinz Moitzi as Chief Operating Officer (COO). As a collective executive body, the Management Board is jointly responsible for the management of the company. In addition to the collective responsibility, each Management Board member is also responsible for defined areas of business. The assigned corporate functions are shown in the table.
  • 41.
    FIRST CHOICE FOR ADVANCEDAPPLICATIONS ANNUAL REPORT 2019/20AT S 37 COMPANY Composition of the Supervisory Board The Supervisory Board monitors and supervises management, and is responsible for decisions that are of fundamental im­ portance to, or involve the strategic focus of, the Group. Throughout the financial year from 1 April 2019 to 31 March 2020, the Supervisory Board received written and oral reports from the Management Board on the Group’s policies and per­ formance, and was closely involved in all business issues. The Super­visory Board met six times during the financial year 2019/20. Mr Androsch did not participate in person in more than half of the Supervisory Board meetings. At these meetings, the Management Board and the Supervisory Board discussed the economic position of the ATS Group in detail. The Management Board comprehensively informed the Chairman of the Supervisory Board or his Deputy, also between Supervisory Board meetings, and the Supervisory Board as part of the Group’s ongoing reporting process and at all board meet- ings, of the Group’s operating and financial position, and of its investments in other companies, the staff situation and planned capital expenditures. In the past financial year, discussions and decisions of the Supervisory Board addressed, in particular, the Group’s future strategic development and the establishment of a new plant in Chongqing. The Supervisory Board annually carries out a self-evaluation in ac- cordance with Rule 36 of the Code of Corporate Governance, and Management Board of ATS AG Assigned Group functions Date of first appointment End of current appointment Andreas Gerstenmayer, CEO born 1965 Sales/Marketing; Communication; Investor Relations; Purchasing; Business Development/Market Intelligence; Strategy and Transformation; Compliance 01.02.2010 31.05.2021 Monika Stoisser-Göhring, CFO born 1969 Finance and Accounting; Controlling, Legal; Internal Audit; Information Technology; Human Resources; Corporate Social Responsibility 02.06.2017 15.05.2020 Heinz Moitzi, COO born 1956 Research Development (RD); Maintenance; Production; Quality Assurance; Business Process Excellence; Environment; Health Safety 01.04.2005 31.05.2021 did so again for the financial year 2019/20. This evaluation per- formed by the Supervisory Board based on a digital questionnaire confirmed that its practices meet the Good Governance require- ments and that its organisation, work practices and target orienta- tion are efficient and effective. INDEPENDENCE OF SUPERVISORY BOARD MEMBERS In accordance with C-Rule 53 of the ACCG, the Supervisory Board has established the following criteria to be used in de- termining the independence of its members: Supervisory Board members are to be regarded as independent if they have no business or personal relationships with the company or its Man- agement Board which could be cause for material conflicts of interest and therefore liable to influence the behaviour of the member in question. The detailed criteria for the assessment of a Supervisory Board member are defined in the Rules of Pro- cedure of the Supervisory Board, Appendix 1: Criteria of Inde- pendence of the members of the ATS Supervisory Board. The Rules of Procedure of the Supervisory Board can be viewed at www.ats.net/company/supervisory-board/. In March 2020, the members of the Supervisory Board appointed by the Annual General Meeting each declared in writing whether they were independent as determined by the above criteria. Sev- en of the eight members of the Supervisory Board representing shareholder interests declared that they were independent. Mr Androsch declared that he was not independent.
  • 42.
    ANNUAL REPORT 2019/20ATS FIRST CHOICE FOR ADVANCED APPLICATIONS 38 COMPANY ATS AG Supervisory Board Date of first appointment End of current appointment Membership of other Supervisory Boards Independent according to ACCG rule Hannes Androsch Chairman of the Supervisory Board born 1938 30/09/1995 26th AGM 2020 – – Willibald Dörflinger First Deputy Chairman of the Supervisory Board born 1950 05/07/2005 26th AGM 2020 Deputy Chairman of the Supervisory Board of HWA AG, Affalterbach, Germany 53 Regina Prehofer Second Deputy Chairwoman of the Supervisory Board born 1956 07/07/2011 30th AGM 2024 Member of the Supervisory Board of Wienerberger AG, Vienna, Austria 53, 54 Karl Fink Member of the Supervisory Board born 1945 05/07/2005 26th AGM 2020 – 53, 54 Albert Hochleitner Member of the Supervisory Board born 1940 05/07/2005 26th AGM 2020 – 53, 54 Georg Riedl Member of the Supervisory Board born 1959 28/05/1999 30th AGM 2024 Member of the Supervisory Board of Vienna Insurance Group AG, Vienna, Austria 53 Gertrude Tumpel-Gugerell Member of the Supervisory Board born 1952 04/07/2019 30th AGM 2024 Member of the Supervisory Board of Vienna Insurance Group AG, Vienna, Austria of OMV AG, Vienna, Austria of Commerzbank AG, Frankfurt, Germany 53, 54 Karin Schaupp Member of the Supervisory Board born 1950 07/07/2011 30th AGM 2024 – 53, 54 Appointed by the Works Council Wolfgang Fleck Member of the Supervisory Board born 1962 03/09/2008 – – n. a. Günter Pint Member of the Supervisory Board born 1976 19/09/2017 – – n. a. Siegfried Trauch Member of the Supervisory Board born 1960 28/01/2016 – – n. a. Günther Wölfler Member of the Supervisory Board born 1960 10/06/2009 – – n. a.
  • 43.
    FIRST CHOICE FOR ADVANCEDAPPLICATIONS ANNUAL REPORT 2019/20AT S 39 COMPANY C-Rule 54 specifies that, for companies with a free float in excess of 50%, at least two Supervisory Board members who are inde- pendent in accordance with C-Rule 53 should also not be share- holders with interests in excess of 10%, or representatives of such interests. Five of the eight Supervisory Board members repre- senting shareholder interests – Regina Prehofer, Karin Schaupp, Getrude Tumpel-Gugerell, Karl Fink and Albert Hochleitner – de- clared themselves independent within the meaning of this rule. DIVERSITY When selecting members of the Supervisory Board, the focus is on expertise and management experience. Diversity is also a consideration in its composition. Currently, three members of the Supervisory Board are women, representing a proportion of female members of 25%, a value below the average of listed Austrian companies. However, an increase was achieved com- pared to the previous year and the company strives to further raise this percentage in accordance with legal requirements. The age of Supervisory Board members ranges from 43 to 81 years on 31 March 2020. All members of the Supervisory Board represent- ing shareholder interests have extensive experience in interna- tional business. In the financial year 2017/18, a diversity concept was prepared, which is continuously developed further. Details regarding the diversity concept and the advancement of women in leadership roles are provided in chapter “Material topics” of the non-financial report. RELATED PARTY TRANSACTIONS In connection with various projects, the Group obtained services totalling € 363 thousand (previous year: € 376 thousand) from AIC Androsch International Management Consulting GmbH, where Chairman of the Supervisory Board Hannes Androsch has full au- thority to act on behalf of the company as its Managing Director. COMMITTEES In order to provide effective support and to properly address complex technical matters, the Supervisory Board has established three permanent committees for detailed analysis of particular issues and regular reporting to the Supervisory Board. Audit Committee In the reporting year, the Audit Committee consisted of: ▪  Regina Prehofer (Chairwoman) ▪  Gertrude Tumpel-Gugerell (Finance expert, from AGM 2019) ▪  Gerhard Pichler (Finance expert, until AGM 2019) ▪  Georg Riedl ▪  Wolfgang Fleck ▪  Günther Wölfler The Audit Committee monitors the accounting process and the work of the statutory auditor, monitors and reviews the statutory auditor’s independence, reviews the preparation and audit of the annual financial statements and reviews the proposed distribu- tion of profits, the Management Report and the Corporate Gov- ernance Report as well as other reports and declarations to be presented as part of the preparation of the annual financial state- ments. The committee is responsible for reporting on the results of its reviews to the Supervisory Board. The Audit Committee also carries out preparatory work for the Supervisory Board on all issues in connection with the audit of the consolidated finan- cial statements, consolidated management report and the con- solidated accounting process. It also submits a proposal for the appointment of the statutory auditors and reports on this matter to the Supervisory Board. The Audit Committee is responsible for monitoring the effectiveness of the Group-wide internal control system and, where appropriate, the Group’s internal audit and risk management systems. The Audit Committee convened six times in the financial year 2019/20. Its activities focused on the discussion and reviews of the annual and consolidated financial statements as of 31 March 2019, the planning and preparation of the audit of the annual and consolidated financial statements for the financial year 2019/20, the preparation of a proposal for the election of the statutory auditor as well as the discussion of the risk management, internal control and internal audit systems. Nomination and Remuneration Committee This committee consisted of the following members: ▪  Hannes Androsch (Chairman) ▪  Willibald Dörflinger (Deputy Chairman) ▪  Georg Riedl ▪  Wolfgang Fleck ▪  Günther Wölfler
  • 44.
    ANNUAL REPORT 2019/20ATS FIRST CHOICE FOR ADVANCED APPLICATIONS 40 COMPANY The Nomination and Remuneration Committee submits pro­ posals to the Supervisory Board for appointments to fill vacan- cies on the Management Board whenever necessary. It deals with succession planning issues and the remuneration of Man- agement Board members. All of the committee members rep- resenting shareholders possess knowledge of and experience in the area of remuneration policies. The Nomination and Remu- neration Committee is also authorised to make decisions in ur- gent cases. This committee met four times in the financial year 2019/20, which focused primarily on the succession planning for the position of the COO. Finance Committee In December 2018, a permanent Finance Committee of the Su- pervisory Board of ATS was established in order to address the complex and specific tasks of financing as efficiently as possible. The Members of the Finance Committee are: ▪  Hannes Androsch (Chairman) ▪  Willibald Dörflinger ▪  Regina Prehofer ▪  Georg Riedl ▪  Wolfgang Fleck ▪  Günther Wölfler The Finance Committee met once in the financial year 2019/20 and discussed matters of general Group financing as well as pro- ject financing. Remuneration Report for the Management and Supervisory Boards The following report presents the remuneration of ATS’s Management and Supervisory Board members. It should be read in conjunction with the explanations in the notes to the 2019/20 annual and consolidated financial statements. MANAGEMENT BOARD REMUNERATION Total remuneration paid to members of the Management Board in the financial year: see table below The fixed element represented 65.2% of Mr Gerstenmayer’s total remuneration, and the variable element 34.8%. The fixed element represented 100% of Mr Moitzi’s total remuneration and the variable element 0%. Finally, the fixed element repre- sented 100% of Ms Stoisser-Göhring’s total remuneration and the variable element 0%. For the current Management Board as a whole, the fixed element represented 83% in the financial year 2019/20 and the variable element 17.0%. By resolution of the Supervisory Board on 3 July 2014, a long-term incentive (“LTI”) programme for the Management Board and key staff based on stock appreciation rights (SAR) was implemented for the period from 2014 to 2016; this programme was extended largely unchanged for the period from 2017 to 2019. SAR are rights to appreciation in value based on share perfor- mance over a defined period of time. As with stock options, but without granting actual shares or an option for such granting, Management Board remuneration € in thousands Financial year 2019/20 Financial year 2018/19 Fixed Variable Total Fixed Variable Total Andreas Gerstenmayer 532 2841) 816 532 714 1,246 Monika Stoisser-Göhring2) 423 – 423 391 175 566 Heinz Moitzi 429 – 429 417 186 603 Karl Asamer3) – – – – 142 142 Total 1,384 284 1,668 1,340 1,217 2,557 1) Variable remuneration includes remuneration from share appreciation rights amounting to € 284 thousand (previous year: € 427 thousand). 2) The exercise of share appreciation rights allocated before the appointment to the Management Board on 2 June 2017 is not included. 3) Former member of the Management Board (until 2 June 2017).
  • 45.
    FIRST CHOICE FOR ADVANCEDAPPLICATIONS ANNUAL REPORT 2019/20AT S 41 COMPANY the recipient receives financial remuneration only if the per- formance of the share price is positive. In particular, the condi- tions include long-term and multiple-year performance criteria, a minimum vesting period of three years (with a subsequent exercise period of no more than two years), a minimum own investment by the recipient, and an upper limit on the potential financial benefits: Earnings per share (EPS) determines how many of the SAR al- lotted may actually be exercised once the vesting period ends. The EPS established by the medium-term plan for the report- ing date of the third year following the allotment applies as the target. If, at the end of the vesting period, less than 50% of the EPS target has been achieved, the allotted SAR are forfeited. If 100% or more of the EPS target has been achieved at the end of the vesting period, all of the allotted SAR may be exercised. If achievement of the target is between 50% and 100%, the allot- ted SAR may be exercised in linear proportion to the percentage achieved. Own investment is a mandatory prerequisite for exercising SAR. The own investment is made by purchasing shares correspond- ing to 20% of the total allotment amount in SAR for a given year (e.g. for an allotment of 5,000 SAR, the own investment is 1,000 shares). If the own investment has not been made in full by the end of the vesting period (after three years), all previously al- lotted SAR of the corresponding programme are forfeited. The own investment must be held for the entire period of participa- tion in the LTI programme. The exercise price is determined on the allotment date and is equal to the average closing price of ATS shares on the Vienna Stock Exchange during the six months preceding the respective allotment date. The performance of the share price determines the amount of the LTI awarded to the recipient: the difference between the exercise price of the relevant virtual allotment and the closing price of the ATS share on the Vienna Stock Exchange on the exercise date is multiplied by the number of SAR. There are no premiums on the exercise price and payouts are made in cash. In the event of exceptionally positive performance, the payout amount per SAR is limited to the amount represented by 200% of the respective exercise price (example: for an exercise price of € 8, the maximum value per SAR is € 16, which means that any share closing price above € 24 produces no associated in- crease in the value per SAR). Three allotment tranches were possible for the LTI programmes 2014–2016 and 2017–2019 respectively, from 1 April 2014 to 1 April 2019. The following table shows the allotted SAR which have not been exercised and have not forfeited by the year of allotment and allotment prices as of 31 March 2020: see table below The variable remuneration of the Management Board (not in the form of SAR), which is generally accounted for in total re- muneration, depends on the short-term achievement of two performance indicators defined in the budget for the respec- tive financial year: return on capital employed (ROCE), with a 90% weighting, and the innovation revenue rate (IRR), with a 10% weighting. The basic prerequisite for awarding this vari­ able remuneration is positive EBIT for the Group as a whole for the financial year and the attainment of the target EBIT margin for the Group as a whole by at least 70% (the “hurdle rate”). If these key performance indicators are exceeded, bonuses are restricted to a maximum of 200% of the annual bonus set out in the contract of employment. The inclusion of IRR is of major Total number of SARs granted, not yet exercised and not yet expired on 31 March 2020 Total 2019 2018 2017 2016 Andreas Gerstenmayer 150,000 50,000 50,000 50,000 – Monika Stoisser-Göhring 90,000 30,000 30,000 30,000 – Heinz Moitzi 90,000 30,000 30,000 30,000 – Karl Asamer1) 30,000 – – 30,000 – Exercise price (in €) 17.25 21.94 9.96 13.66 1) Former Member of the Management Board (until 2 June 2017).
  • 46.
    ANNUAL REPORT 2019/20ATS FIRST CHOICE FOR ADVANCED APPLICATIONS 42 COMPANY importance in giving variable remuneration a long-term focus. Innovative strength  – the development of new technologies, products or product types – is a crucial factor for the future business success of the Group. It can also be reliably measured: IRR represents the share of total revenue generated by techno- logically innovative products introduced in the past three years. The three-year reference period provides a long-term compo- nent of variable remuneration. With respect to the variable remuneration of selected executives in other Group companies, the same principles apply as described above for the Management Board of the parent company. Management Board members are contractually entitled to ter- mination benefits in accordance with the Salaried Employees Act, applied mutatis mutandis (“old system for severance pay”), if their appointments are terminated. In the event of prema- ture termination initiated by a Management Board member for reasonable cause, or if the function is eliminated for legal rea- sons, remuneration is payable until the end of the appointment contract. Where a Management Board member resigns the ap- pointment or is removed from office for severe breach of duty, and in the event of death, payment of salary ceases at the end of the applicable month. Mr Gerstenmayer, Ms Stoisser-Göhring and Mr Moitzi have pen- sion entitlements in the form of defined benefit or defined con- tribution plans agreed individually. For Mr Gerstenmayer and Ms Stoisser-Göhring, a contribution of 10% of the monthly gross fixed salary is paid into a pension fund. Mr Moitzi’s pension en­ titlement is 1.2% of his most recent salary for each year of service, up to a maximum of 40%. The amount of the occupational pen- sion is based on the capital accumulated in the pension fund; the annuity is determined by the pension fund’s rules. Members of the Management Board are entitled to a company car (included in the above-mentioned fixed remuneration in the amount of the additional taxable amount) and are covered by accident insurance, the premium of which is also included in the above-mentioned fixed remuneration. Health insurance is limited to what is provided under the Austrian statutory social security system. SUPERVISORY BOARD REMUNERATION Remuneration for the members of the Supervisory Board is de- termined retrospectively for the past financial year by means of a resolution at the Annual General Meeting. Remuneration paid to members of the Supervisory Board in the financial year 2019/20 for the previous financial year 2018/19 was in accord- ance with the resolution passed at the 25th Annual General Meeting of 4 July 2019: see table below The Chairman of the Supervisory Board received fixed remu- neration of € 56,240 as shown above, his Deputies € 44,160 and all other elected members €  28,120. Chairmanship of a standing committee (Nomination and Remuneration Commit- tee, Audit Committee) was remunerated with a fixed amount of €  5,000 per financial year, and membership of a standing committee with €  3,000. The attendance fee was €  400 per Supervisory Board meeting and all cash expenses were thus reimbursed. Members of the Supervisory Board also received Remuneration for the members of the Supervisory Board in € Member Fixed fee Committee fee Variable remuneration Attendance fees Total Hannes Androsch 56,240 6,667 13,800 2,400 79,107 Willibald Dörflinger 44,160 4,000 9,200 2,400 59,760 Regina Prehofer 44,160 6,000 9,200 2,400 61,760 Karl Fink 28,120 – 6,900 2,000 37,020 Albert Hochleitner 28,120 – 6,900 2,400 37,420 Gerhard Pichler 28,120 3,000 6,900 2,400 40,420 Georg Riedl 28,120 7,000 6,900 2,400 44,420 Karin Schaupp 28,120 – 6,900 2,400 37,420 Total 285,160 26,667 66,700 18,800 397,327
  • 47.
    FIRST CHOICE FOR ADVANCEDAPPLICATIONS ANNUAL REPORT 2019/20AT S 43 COMPANY variable ­remuneration based on the short-term achievement of two performance targets defined as part of the budget. These targets are return on capital employed (ROCE), with a weighting of 90%, and the innovation revenue rate (IRR), with a weighting of 10%. If the targets are achieved 100%, the Chairman receives € 15,000, his Deputies € 10,000 and other members € 7,500 per financial year. If the key performance indicators for ROCE and IRR are exceeded, variable remuneration of a maximum of 200% of the base described above is paid. Members of the Su- pervisory Board do not receive stock options in the Group or SAR. Since the targets established for variable remuneration in the budget for the financial year 2018/19 were achieved and ex- ceeded, the maximum amount of variable remuneration for the members of the Supervisory Board was provided in the financial year 2018/19. For the financial year 2019/20 the remuneration of the Supervisory Board will be determined at the 26th Annual General Meeting on 9 July 2020. The employee representatives perform their duties on the Su- pervisory Board voluntarily and therefore receive no separate remuneration for their position. DIRECTORS AND OFFICERS LIABILITY INSURANCE (DO INSURANCE) The DO insurance at ATS covers all past, present and future members of the Company’s and its subsidiaries’ managing and supervisory bodies and selected other senior staff. The insur- ance covers court and all other costs of defence against un- warranted claims, together with the satisfaction of warranted claims for pure financial loss arising from breaches of duty by the insured in their managerial or supervisory activities. The in- surance provides global cover and the annual premium is paid by ATS. Directors’ Dealings Purchases and sales carried out by members of the Man- agement Board, the Supervisory Board and related persons are reported to the Financial Market Authority in accord- ance with Art. 19 of Regulation (EU) No. 596/2014 and pub- lished via an EU-wide disclosure system as well as on the ATS website, www.ats.net/company/corporate-governance/ directors-­dealings/.
  • 48.
    ANNUAL REPORT 2019/20ATS FIRST CHOICE FOR ADVANCED APPLICATIONS 44 COMPANY NON-FINANCIAL REPORT Embedding and managing sustainability STATEMENT OF THE MANAGEMENT BOARD ATS is committed to sustainability in all its facets. With this con- densed report for the Group as a whole and for Austria Technol- ogie und Systemtechnik AG (in the following referred to as the “parent company”), we not only meet the reporting obligation in accordance with the Sustainability and Diversity Improvement Act (Section 243b, Section 267a and Section 243c of the Austrian Commercial Code, UGB). Rather, our objective is to provide trans- parency for all stakeholder groups. On the following pages, we describe the development of the sustainability strategy and the resulting fields of action in detail. The material topics are allocat- ed to these strategic fields of action with management concepts, due diligence processes and indicators. BUSINESS MODEL AND GOVERNANCE STRUCTURE STAND FOR SUSTAINABILITY Today ATS high-end printed circuit boards and substrates al- ready form the central nervous system of nearly all electronic de- vices and are just as versatile and complex as the electronic devic- es themselves. High-end interconnect solutions enable powerful and high-tech applications for our customers and are employed in the mobile devices, IC substrates, automotive, industrial and medical segments. This makes ATS the technology and quality leader in the printed circuit board and substrate industry. ATS is Management structure_ Orientation Steering Implementation Corporate functions and business segments Management Board Corporate Sustainability Sustainability Steering Committee Governance Risk Compliance Committee Working groups
  • 49.
    FIRST CHOICE FOR ADVANCEDAPPLICATIONS ANNUAL REPORT 2019/20AT S 45 COMPANY a global player with production sites in Austria, India, China and South Korea and additional sales service companies around the globe. Working with passion and diligence every day, an average of 10,239 employees make the success of ATS and its customers worldwide possible. Independent of the evolving technologies, ATS offers the interconnect technology of the future. The sustainability dimensions are firmly embedded in this busi- ness model. All decisions are made taking into account social, environmental and economic aspects and, of course, compliance with legal requirements. The Corporate Sustainability team is responsible for the devel- opment of the sustainability strategy in close alignment with the Management Board of the ATS Group, the business segments and all other corporate functions, and for the coordination of the sustainability agenda. The team is also represented in rele- vant steering committees and reports directly to the ATS Group Management Board. PARTNERSHIPS – MORE EFFECTIVE TOGETHER ATS is convinced that working together, we are more effec- tive as a society. ATS therefore relies on strong partnerships and is committed to the UN Sustainable Development Goals (SDGs), the OECD Guidelines for Multinational Enterprises, the UN Guiding Principles for Business and Human Rights, the In- ternational Labour Organization (ILO), the Responsible Business Alliance (RBA) and the Responsible Minerals Initiative (RMI). In addition, we continuously work on the increasing integration of climate-related information in accordance with the EU guideline for the disclosure of climate-related information and the Task Force on Climate-related Financial Disclosures (TCFD). This re- port was prepared based on the standards of the Global Report- ing Initiative (GRI), “Core” option. VALUE CREATION PROCESS – RESPONSIBILITY STARTS WITH THE SUPPLY CHAIN For a high-end interconnect solution provider, growth and value creation are central to economic success. ATS recognises its responsibility along the entire value chain, uses opportunities and risks and is committed to excellence in the printed circuit board and substrate industry based on the best customer ser- vice and innovative, sustainable solutions. In doing so, it is not enough to focus on selected processes; rather, the entire value chain must be viewed in an integrated manner. In procurement, it is not just the price that counts This integrated approach starts with sourcing raw materials such as copper and gold, but also covers the production of key materials such as laminates and chemicals, the choice of equip- ment as well as purchased energy and water supply. Therefore, ATS needs sustainable partnerships within the value chain with partners who pursue the same goals. That is why in ad- dition to price, non-financial factors such as delivery reliability, quality, business ethics, respect for human rights and compli- ance with environmental standards also count in the selection of our suppliers. Storage, production and transport are direct spheres of influence Spheres of influence include the transport and storage of pre- cursor materials, the production and packaging of products and, in part, the delivery to customers. Appropriate storage of the materials before the start of production as well as careful han- dling in production are indispensable for the entire manufac- turing process. ATS always strives for best-in-class approach- es in all processes. To contribute to a sustainable value chain ATS aims to continuously improve processes and build strong partnerships with our employees and supplier companies. This includes permanent efforts to reduce the consumption of ­water, energy and raw materials to a minimum through target- ed efficiency projects. Certifications and standards that are well
  • 50.
    ANNUAL REPORT 2019/20ATS FIRST CHOICE FOR ADVANCED APPLICATIONS 46 COMPANY ­established at all production sites indicate clearly that we take our responsibility regarding quality, the environment, occupa- tional safety, energy, data security and customer orientation se- riously. Regular recertification audits ensure that the standards are maintained. The table on the following page shows an over- view of all standards and norms of the ATS Group. End users are primarily responsible for the utilisation phase and disposal of the end devices Exercising influence during the utilisation phase requires strong partnerships with our customers. Regarding proper disposal after the utilisation phase, ATS calls upon end users to act responsibly. Value creation process_ Direct sphere of influence of ATS Raw material and equipment Upstream Production Downstream Customer Utilisation phaseEnd of life Disposal
  • 51.
    FIRST CHOICE FOR ADVANCEDAPPLICATIONS ANNUAL REPORT 2019/20AT S 47 COMPANY Standards and certificates Certification Description Leoben Fehring Nanjangud Ansan Shanghai Chongqing ISO 9001:2015 Certification of quality management systems to prove high quality standards of products X X X X X X EN 9100:2018 European quality standard for the aerospace industry X X – – – – DS/EN ISO 13485:2016 International quality standard for the design and production of medical devices X X – – – – DIN EN ISO 50001:2011 International standard for energy management to increase energy efficiency X X X – – – OHSAS 18001:2007 (ISO 45001) Standard for the management of occupational health and safety to minimise risks and increase productivity X X X X X X ISO 14001:2015 Global standard for environmental management systems, to optimise processes, reduce costs and minimise risks X X X X X X IATF 16949:2016 Globally recognised standard in automotive industry X X X X X – ISO/IEC 27001:2013 International standard for information security X X – – – – NADCAP Accreditation Accreditation for a uniform quality standard in the aerospace industry to harmonise production and audit processes of aircraft components X – – – – – AEO Certificate Authorised Economic Operator of the European Union X X – – – – UL Listing Standard to ensure electrical and mechanical safety of electronic components X X X X X X Sony Green Partner Certificate Sony Green Partner – – – – X – However, as far as it is in our sphere of influence, ATS does not shy away from its obligations when it comes to disposal, but ensures that waste is adequately disposed of by either returning it to the processes as part of a circular economy or by recycling it through a variety of procedures. The goal is to keep the impact of our business activities on people and the environment to a minimum and to go beyond legal minimum requirements.
  • 52.
    ANNUAL REPORT 2019/20ATS FIRST CHOICE FOR ADVANCED APPLICATIONS 48 COMPANY THE SUSTAINABILITY STRATEGY IS DERIVED FROM THE CORPORATE STRATEGY Sustainability is firmly embedded in our corporate strategy and part of our ATS mission. As a globally operating company, it is essential to view the big picture: we aim to be the first choice for advanced applications. The strategic levers to achieve this goal are expanding technology leadership through innovative solu- tions, sustainable, profitable growth, creation of stakeholder value and sustainable management. Based on this holistic and future-oriented mindset, ATS, as a leading provider of high- end interconnect solutions, aims to reconcile the interests of business, ecology and social development. Stakeholder survey as a central component of the sustainability strategy We developed the sustainability strategy in line with our Group- wide strategic orientation. ATS attached great value to involv- ing all important groups of stakeholders including employees, customers, suppliers and shareholders. The results of the stake- holder survey conducted during the 2018/19 financial year and the topics resulting from the materiality analysis take into ac- count the impact of ATS’s operating activities, our supply chain and our products, and are central elements of the sustainability strategy. In the financial year 2019/20, the results of the materi- ality matrix were reflected upon together with the Management Board, taking into account the feedback of key customers. In the course of this process we came to the conclusion that both communication and digitalisation are tools rather than drivers. Both are material instruments in achieving the strategic goals and support the other material topics, but are not an end in itself. Therefore, communication and digitalisation are not listed as separate material topics in this year’s non-financial report. UN Sustainable Development Goals and global trends considered Other influencing factors beyond that were of course also con- sidered. ATS makes a clear commitment to the Sustainable De- velopment Goals (SDGs) of the United Nations. These goals have been incorporated in the sustainability strategy insofar as the impact of ATS’s activities on all 17 goals and their 169 subgoals were assessed in detail. In doing so, three SDGs were rated as central and another six as relevant. These nine SDGs which are essential to ATS are accentuated in the illustration below. ATS thus takes both the responsibility and the opportunity to contrib- ute to climate protection, sustainable production and reduction of inequality within the meaning of the SDGs. The SDGs that guide us_ WE FOLLOW! We have rated 9 of the 17 SDGs as relevant to us.
  • 53.
    FIRST CHOICE FOR ADVANCEDAPPLICATIONS ANNUAL REPORT 2019/20AT S 49 COMPANY Moreover, global developments and trends, the risk report 2020 of the Global Economic Forum as well as the consideration of the Taxonomy Report of the technical expert group of the EU on sustainable finance, the EU Guideline for the reporting of cli- mate-related information and the Task Force on Climate-related Financial Disclosures (TCFD) were considered in the strategy de- velopment process. Integration of non-financial opportunities and risks into the existing opportunities and risk management The integration of non-financial opportunities and risk manage- ment into the existing Group-wide risk management was one of the milestones in the financial year 2019/20 (see Management Report page 107 ff.). Based on a comprehensive risk catalogue consisting of more than 600 risks, the non-financial risks were filtered. These are the risks related to the environment, social matters and responsible governance  – so-called ESG risks. A clear distinction was made between causes, risks and the im- pact on the operating activities of ATS and on the environ- ment. In the next step, these risks were assigned to existing risk categories, a reference was established between qualitative and quantitative risk assessment and all risks were assessed both in the short-term horizon of one year and in the medium-term 5-year horizon. The process is shown in the illustration below. The overview of non-financial opportunities and risks including risk categories, mitigation measures and allocation of the topics are shown in the table on page 50. Material risks are risks which in line with this risk assessment process result in a risk level greater than three in the one-year period for the environment before further mitigation measures and which are caused directly by the operations of ATS, our supply chain or products. For a detailed risk assessment with a focus on the operating activity of ATS including notes on the risks levels and management, please refer to the Group Man- agement Report, Section “Opportunities and Risks”. In addition, other relevant risks such as occupational accidents or corruption are also listed. While these risks are of course part of the risk assessment process, they were assessed at a lower risk level. This is due to the fact that the mitigation measures are so well established within the company that either the probabil- ity of occurrence or the expected impact on the environment and ATS are considered to be low. In accordance with the EU Guidelines for reporting climate-related information and the TCFD, climate-relevant risks are also part of the risk assessment. In addition to the physical risks, caused by chronic or acute ef- fects of climate change and global warming on the operating activities of ATS and the environment, risks and opportunities arising from the transition to a low-carbon, climate-resilient economy are also considered. ATS considers this transition an opportunity and accordingly de- veloped the energy strategy with ambitious decarbonisation tar- gets. This way, we counter potential transitional risks, which could arise from future laws and regulations as well as customer re- quirements. At the same time, we use the opportunity to position ourselves as a climate-resilient company and to benefit from repu- tation gains. We counter technological risks with sustainable inno- vations and, as a first step, with our life cycle assessment project. Identification of material ESG risks Allocation to existing risk categories Assessment of risks for ATS and the environment Reporting in line with Group-wide risk management Mitigation Risk management_
  • 54.
    ANNUAL REPORT 2019/20ATS FIRST CHOICE FOR ADVANCED APPLICATIONS 50 COMPANY In addition, we included risks in our assessment process which are not, or only partially, caused by ATS. These include pan- demics, extreme weather events and global warming. We are, however, aware that ATS, like any other company or individual, also contributes to these phenomena. Moreover, such events may have considerable effects on both ATS and relevant stake- holder groups and are therefore also deemed to be relevant. Deriving fields of action from the strategy process As shown in the illustration on the following page, four strate- gic fields of action were derived from the strategy development process: environment resources, sustainable innovation, em- ployees society, sustainable supply chain. The sustainability strategy underlines the stringent approach of the definition of fields of action, setting clear and ambitious goals and initiating concrete measures to achieve these goals. This is complemented by transparent management and control of the degree of target attainment. The strategy is intended to Overview of material and other relevant risks Risk category Risk Mitigation Opportunities NaDiVeG issues OPERATIONAL Inefficient use of resources Energy strategy, projects to increase efficiency and effectiveness, water recycling Cost reduction, climate-resilient business model, industry benchmark, image improvement Environmental issues ORGANISATION Discrimination and low diversity of staff Diversity strategy, Code of Conduct Inclusive, diverse employer, competitive advantage, increased profitability, inno- vative strength and employee motivation, low fluctuation Social issues, employee issues MARKET Use of ATS products in unethical applications Code of Conduct, commitment to RBA, internal guideline, training Protection of human rights, avoidance of support of armed conflicts and environ- mental degradation, image improvement, increased employee motivation Environmental issues, social issues, respect for human rights PROCUREMENT Non-compliance with ESG-relevant requirements Supplier Code of Conduct, clear processes for careful selection of suppliers, supplier audits, commitment to RBA RMI Protection of human rights, image improvement, increased attractiveness of the company for sustainable financing, avoidance of support of armed conflicts, increased employee motivation Social issues, employee issues, environmental issues, respect for human rights OPERATIONAL Disruption of operations/ pandemics Business continuity management, OHSAS 18001/ISO 45001, highest safety standards Image improvement, strong crisis management, strong cohesion and loyalty of staff Employee issues, social issues OPERATIONAL Occupational accidents OHSAS 18001/ISO 45001, protective clothing, handling of dangerous goods, training Increased employee motivation, low fluctuation Employee issues ENVIRONMENT Extreme weather events, natural disasters Business continuity management, OHSAS 18001/ISO 45001, employee sensitisation and training Strong cohesion, loyalty of staff, stronger adaptability Environmental issues, social issues ENVIRONMENT Global warming Energy strategy, projects to increase efficiency and effectiveness, employee sensitisation and training Cost reduction, climate-resilient business model, industry benchmark, image improvement Environmental issues, social issues ORGANISATION Corruption and unethical behaviour Code of Conduct, anti-corruption guideline, capital market compliance, training, GRC Committee Image improvement, trustful partnerships, competitive advantage Employee issues, combat corruption and bribery MaterialrisksOtherrelevantrisks
  • 55.
    FIRST CHOICE FOR ADVANCEDAPPLICATIONS ANNUAL REPORT 2019/20AT S 51 COMPANY make an essential contribution to mitigating the negative impact of ATS’s operating activities on the topics. At the same time, positive aspects should be maximised and opportunities used as best possible. Details regarding the qualitative and quantita- tive goals, management concepts, due diligence processes and key figures, as well as reference to the SDGs are provided in the following chapters. The report is structured according to strate- gic fields of action, to which the material topics are assigned as shown in the illustration below. In some areas it is not fully possible to clearly allocate the mate- rial topics to the strategic fields of action or chapters. For exam- ple, efficient production is possible only partially due to innovative solutions. Since all our measures regarding energy, CO2, water and waste are aimed at making production more efficient and counter- ing inefficient use of resources, efficient production is part of the chapter Environment Resources. These overlaps are even clearer in the strategic fields of action Em- ployees Society and Sustainable Supply Chain. The material topic human rights, for example, could be allocated to both Employees Society and to Sustainable Supply Chain. We chose to allocate human rights to the Supply Chain because the risk of human rights violations within the ATS system boundaries is relatively low in comparison with the supply chain. This is attributable to the direct controllability within the company and the well-established miti- gation measures. Therefore, the corresponding control measures, goals and indicators in the area of human rights are allocated to the supplychain.Inaddition,wereportonmeasurestopreventhuman rights violations within ATS in the section Employees Society. ATSSustainability strategy 2025 Environment Resources _ Efficient production Sustainable Innovation _ Innovation Employees Society _ Occupational health and safety _ Knowledge _ Diversity _ Anti-corruption Sustainable Supply Chain _ Human rights Stakeholders SDGs Global trends Opportunities and risks Corporate strategy Four strategic fields of action and allocated material topics_
  • 56.
    ANNUAL REPORT 2019/20ATS FIRST CHOICE FOR ADVANCED APPLICATIONS 52 COMPANY SDGs The contribution of ATS in the area of Environment Resources Decoupling of economic growth from environmental impact through global efficiency measures, higher productivity, techno- logical development and innovation. The copper recycling project and a number of Lean Six Sigma projects around the world contribute to this goal. Taking into account a resilient infrastructure and sustainable industrialisation, we see economic development strongly associated with SDG 17 and SDG 13. This aspect is reflected in the energy strategy, which can only be achieved through strong partnerships, higher resource efficiency and eco-friendly technologies. Stringent sustainability management with respect to environ- ment, waste, chemicals and energy in accordance with ISO 14001 and ISO 50001. This includes efficient use of resources, careful disposal, waste prevention and recycling, and the ­prevention of emissions into the air, water and soil. Transparent sustainability reporting on all aspects of sustaina- bility. Based on the ISO 14001 certification at all locations and our REACH and RoHS compliance, we commit to the prevention of water pollution as well as releasing chemicals and hazardous substances. We achieve maximum efficiency of water con- sumption in regions where water is scarce through the highest possible water recycling rates. The ATS energy strategy and the climate protection measures derived from it are central aspects of the sustainability strategy. Environment Resources Environment Resources is a strategic field of action of ATS, to which the material topic efficient production technologies is allocated. This is consistent with our analysis of the UN Sustain- able Development Goals (SDGs). The impact of ATS’s operating activities on the environment and resources, and consequently the effectiveness of the measures taken by ATS, is the greatest on SDGs 6, SDG 8, SDG 9, SDG 12, and SDG 13. Sustainability is always associated with an increasing scarcity of resources. While the economy is growing, the aim is to reduce material resource consumption. This can only be achieved with maximum efficiency. As a producing business with a large number of wet chemical processes, the topics of climate protection and water are also of great importance to us. Details on ATS’s contribution to achieving the above-mentioned SGDs are summarised in the following table. PRODUCTION EFFICIENCY MINIMISES ENVIRONMENTAL IMPACT AND ­RESOURCE CONSUMPTION WHILE CREATING MAXIMUM VALUE ATS attaches great importance to manufacturing high-end prod­ ucts based on efficient processes and technologies which stand for premium quality and reliability. This comprises minimum energy, material and water consumption and the prevention of emissions and waste while creating maximum value. The environmental im- pact is kept to a minimum based on a holistic approach. The certi- fication according to the international quality and environmental standardsISO9001andISO14001atallproductionsitesisonlyone example showing that the high quality and environmental aware­ ness is embedded in the Group-wide management systems. In ad- dition to annual recertification audits to maintain these standards, we also possess further industry- and location-specific certifica- tions for the automotive sector (ISO/TS 16949), aviation (AS/EN 9100) and the medical sector (DS/EN 13485). Our journey to a climate-resilient, low-carbon future With a focus on the market and megatrends, and taking into ac- count the needs of our stakeholders, ATS is now taking more drastic climate protection measures as part of our sustainability strategy and the energy strategies derived from it. Our goal is to cover at least 80% of the Group’s energy require- ments from renewable energy sources by 2025 and to replace all fossil fuels within our own production sites around the globe (Scope 1 emissions) by 2030. As a result of climate change and the associated global warming as well as growing resource and water scarcity, the demands on the part of customers, politics and society in this context are expected to intensify in the future.
  • 57.
    FIRST CHOICE FOR ADVANCEDAPPLICATIONS ANNUAL REPORT 2019/20AT S 53 COMPANY ATS recognises that this is a very ambitious goal. At the same time it is a categorical imperative if we are to grow profitably in the long term. Building on the existing goal of reducing rel- ative energy consumption by 5% annually, long-term goals are defined for the first time as part of the energy strategy. The targets and measures we set with respect to energy and CO2 in the past few years help us achieve this goal. Even though energy efficiency does not directly pay into the achievement of our long-term goal, energy efficiency measures are most use- ful from both an economic and an ecological perspective and therefore a crucial element of the ATS energy strategy. Our locations in Austria and India are already certified according to the energy management standard ISO 50001, with the loca- tions in China and South Korea expected to follow in the com- ing financial year. Energy audits have already been performed at all locations. Appropriate measures were derived from the resulting energy savings potential, and implemented. Optimum Our goal for 2025 waste heat utilisation, heat recovery from air compressors, var- iable speed control of motors, the use of heat pumps, regular identification and elimination of compressed air leaks, building insulation and reduction of natural gas consumption for heat and steam generation are only a few examples. Overall, savings of 13.4 GWh or 10.9 kt of CO2 were thus realised throughout the Group during the financial year 2019/20 compared with 12 GWh or 9.3 kt of CO2 in the previous year. On a cumulative basis, the energy efficiency measures of the past years have al- ready led to savings of 46.4 GWh. ATS attaches great importance to a modern, sustainable infra- structure, with efficient use of resources and increased utilisa- tion of clean, eco-friendly energy. It therefore goes without say- ing that the results of the energy audits are taken into account in the expansion of the plants in South Korea and Chongqing. We thus ensure maximum energy efficiency in the planning phase of new plants. As part of the energy strategy, further levers to accomplish goals are now being added to the energy efficiency measures already taken or planned all over the world. Innovative solutions and resilient partnerships in energy procurement are as important to us as taking completely new paths. Collaboration with inter- nal research and development, engineering and maintenance specialists as well as external stakeholders such as research partners, machine manufacturers and neighbour companies en- ables us to generate new solutions supporting the implementa- tion of the goals. All measures are evaluated taking into account profitability and feasibility. This is the only way we can achieve technological modernisation and ensure a climate-resilient, low-carbon economy and efficient use of natural resources. With the ATS energy strategy we aim to make our contribution to reaching the 2-degree goal and are considering joining the Science Based Targets initiative. In doing so, we would put our goal of decarbonising our production processes to the test and define additional goals if necessary. Until then, we will adhere to our previous key indicators and try to expand them. For example, Scope 3 emissions were added to our reporting for the financial year 2019/20, and transparency was increased in the area of en- ergy sources in order to illustrate the complexity of the climate and energy target for our stakeholders. CO2 emissions are reported in accordance with the Greenhouse Gas (GHG) Protocol. Scope 1 emissions refer to all direct emissions; in our case, this comprises the use of natural gas, liquefied gas, die- sel and heavy oil. Scope 2 emissions refer to purchased electricity while Scope 3 covers all indirect emissions, which are not direct- ly related to the company. The calculation of Scope 1 emissions is Energy savings
  • 58.
    ANNUAL REPORT 2019/20ATS FIRST CHOICE FOR ADVANCED APPLICATIONS 54 COMPANY based on the factors of the Federal Economic Agency. The other CO2 indicators are based on the conversion factors of the ecoinvent database version 3. All CO2 figures refer to CO2 equivalents. The chart above on the left shows that electricity is ATS’s main energy source, resulting in a high Scope 2 share of CO2 emissions at 48.7%. At the same time, Scope 3 emissions, which are reported in greater detail for this financial year, are substantial at 48.2%. The reporting of Scope 3 emissions was significantly improved in the financial year 2019/20. Scope 3 emissions now also cover air travel of ATS employees, the transport of our products to customers as well as 72.4% of the purchasing volume and consequently the CO2 emissions of essential materials. Scope 3 emissions are also gener- ated in the production of direct and indirect energy sources, which are now also included in Scope 3 reporting. This also explains the increase in Scope 3 emissions compared to the previous years. Energy consumption by energy source in % Electricity Natural gas Other 80.6 17.6 1.8 Split of carbon footprint by Scope in % Scope 1 Scope 2 Scope 3 48.2 3.1 48.7 At the same time, this results in a decline in Scope 2 emissions as the conversion factors used also had to be adjusted accordingly. Despite energy savings of 13.4 GWh, we did not manage to re- duce relative energy consumption in 2019/20 compared with the previous year. Rather, we recorded an increase of 12.4%, which is primarily attributable to the ATS growth strategy and the relat- ed technology developments. The expansion and qualification of production lines as well as the development of new technologies require resources, without directly generating added value. In addition, the financial year 2019/20 saw a challenging market en- vironment and the COVID-19-pandemic. However, based on the planned extensive measures as part of the energy and climate strategy we are confident that these are only temporary effects. Energy consumption Absolute energy consumption (in GWh) Relative energy consumption (in kWh per € GVA) 2019/20 2018/19 Change in % 2019/20 2018/19 Change in % Mobile Devices Substrates segment 518.2 500.2 3.6 1.68 1.53 10.0 Automotive, Industrial, Medical segment Others 146.5 147.3 (0.6) 1.02 0.87 16.1 Total Group 664.6 647.5 2.6 1.47 1.30 12.4 thereof attributable to parent company 70.0 71.1 (1.6) 0.69 0.62 11.0
  • 59.
    FIRST CHOICE FOR ADVANCEDAPPLICATIONS ANNUAL REPORT 2019/20AT S 55 COMPANY 1.74 Relative energy consumption in kWh per € GVA 2016/17 2017/18 2018/19 2019/20 1.38 1.30 1.47 Relative carbon footprint (Scope 1+2) in kg CO2 per € GVA 2016/17 2017/18 2018/19 2019/20 1.22 1.16 0.96 1.53 Carbon footprint (Scope 3) Absolute carbon footprint (Scope 3) (in kt CO2)* Relative carbon footprint (Scope 3) (in kg CO2 per € GVA)* 2019/20 2018/19 Change in % 2019/20 2018/19 Change in % Mobile Devices Substrates segment 309.8 5.3 100 1.00 0.02 100 Automotive, Industrial, Medical segment Others 92.6 5.8 100 0.64 0.03 100 Total Group 402.4 11.1 100 0.89 0.02 100 thereof attributable to parent company 32.1 0.6 100 0.32 0.01 100 * The strong increase results from the inclusion of the following categories in addition to the transportation of products to customers as of the financial year 2019/20: purchased goods and services, fuel- and energy-related activities (not included in Scope 1 or 2) and business travel. Carbon footprint (Scope 1 + 2) Absolute carbon footprint (Scope 1 + 2) (in kt CO2) Relative carbon footprint (Scope 1 + 2) (in kg CO2 per € GVA) 2019/20 2018/19 Change in % 2019/20 2018/19 Change in % Mobile Devices Substrates segment 346.5 462.7 (25.1) 1.12 1.41 (20.5) Automotive, Industrial, Medical segment Others 86.8 111.9 (22.4) 0.60 0.66 (9.4) Total Group 433.3 574.6 (24.6) 0.96 1.16 (17.4) thereof attributable to parent company 17.6 20.9 (15.5) 0.17 0.18 (4.7)
  • 60.
    ANNUAL REPORT 2019/20ATS FIRST CHOICE FOR ADVANCED APPLICATIONS 56 COMPANY Accordingly, energy expenses also increased by roughly € 2 mil- lion as explained in the consolidated statement of profit or loss in the notes to the consolidated financial statements. The reduction of the relative carbon footprint (Scope 1 + 2) by 17.4% year-on-year is primarily attributable to the removal of fuel and energy-related Scope 3 emissions as of the financial year 2019/20. Without the change in factors, the relative carbon foot- print would also increase by 3.6% in comparison to the previous year. The relative indicators refer to the gross value added (GVA), which is calculated based on EBIT plus depreciation/amortisa- tion and wage and salary expenses. Reduction of water consumption and waste as further central elements of the sustainability strategy As part of its sustainability efforts, ATS not only strives to make a significant contribution to climate protection, but also pursues the efficient use, sustainable withdrawal and provision of water, as well as the prevention and recycling of waste. The production of printed circuit boards and IC substrates re- quires a large number of wet chemical and water-intensive processes. Due to exothermal chemical production process- es, ­water is also used to cool machinery. In addition to cool- ing water, deionised and ultra-pure water is produced, which is used as process water in production. Wastewater is treated in a chemical-­physical wastewater system or fed through purifica- tion or biofilter facilities and cooling towers. This way we reduce potential environmental impacts at all locations to a minimum. We are aware that a conflict of objectives exists between the energy targets and the reduction of water consumption. There- fore, we will focus on developing a water strategy which is con- sistent with the energy strategy in the financial year 2020/21. In the course of the strategy development, we will also define long-term goals in the area of water. Until then, we will adhere to the existing target of a 3% reduction of water consumption in comparison to the target of the previous year. In any case, it is obvious to us that the water recycling rate at production sites located in high-risk areas according to the Aqueduct Water Risk Tool must be increased continuously. This will affect above all our locations in Shanghai and Nanjangud. Here, ATS can also build on extensive measures of the past few years. The water recycling rates at these locations already amount to up to 25% and 80%, respectively. Nonetheless, water consumption increased in rela- tion to gross value added in the financial year 2019/20, up 17.4% to 11.66 litres per € of gross value added. This means that the Relative water consumption in litres per € GVA 2016/17 2017/18 2018/19 2019/20 12.93 10.62 9.93 Water consumption Absolute water consumption (in m³ million) Relative water consumption (in litres per € GVA) 2019/20 2018/19 Change in % 2019/20 2018/19 Change in % Mobile Devices Substrates segment 4.70 4.28 9.8 15.22 13.06 16.6 Automotive, Industrial, Medical segment Others 0.58 0.65 (10.2) 4.03 3.84 4.9 Total Group 5.28 4.93 7.2 11.66 9.93 17.4 thereof attributable to parent company 0.18 0.30 (39.7) 1.80 2.65 (31.9) 11.66
  • 61.
    FIRST CHOICE FOR ADVANCEDAPPLICATIONS ANNUAL REPORT 2019/20AT S 57 COMPANY 3% reduction target was not met in the financial year 2019/20. Similar to the increase in relative energy consumption, this is also attributable to our growth strategy, the technology development and the market environment. The reduction of the quantity of waste, in particular hazardous waste, is another central element of the sustainability strategy and contributes significantly to achieving SDG 12, sustainable consumption and production, and indirectly to SDG 6 by pre- venting emissions and reducing wastewater. In the financial year 2019/20, the quantity of relative total waste in- creasedby15.2%afterdecliningcontinuouslyinthepreviousyears. In particular, the share of hazardous waste rose. This is addressed by the copper recycling project initiated in the last financial year. Waste amount Absolute waste amount (in kt) Relative waste amount (in kg per € GVA) 2019/20 2018/19 Change in % 2019/20 2018/19 Change in % Mobile Devices Substrates segment 31.6 29.5 7.1 0.10 0.09 13.7 Automotive, Industrial, Medical segment Others 16.2 16.0 1.6 0.11 0.09 18.6 Total Group 47.8 45.5 5.1 0.11 0.09 15.2 thereof attributable to parent company 5.7 5.7 1.1 0.06 0.05 14.1 Copper is an indispensable raw material in the production of printed circuit boards, which, at 4,066 tonnes, accounts for the largest share of production materials used. Copper-containing material flows are incurred in the production of the conductive pattern. A large part of them is fed to the com- pany’s internal wastewater treatment plants. Before disposing of the copper-containing sludge created in this process, a wide variety of chemicals are used to treat the waste. The goal of the current copper recycling project is to make the production of ATS printed circuit boards as resource-friendly as possible while preventing waste as much as possible. The aim is to move from a linear usage of copper throughout the process to a cycle of reuse of copper, preventing waste and increasing raw material efficiency. As part of the project, detailed analyses were conducted to evalu- ate possibilities to manage the flows of recyclable materials more efficiently. The focus was put on hazardous waste and acids. In ad- dition to enhancing raw material efficiency by recovering copper-­ containing acids from production processes, the project also leads to a reduction of the chemicals used and the waste produced, which is largely classified as hazardous waste. We are confident that we can scale these measures and systems in such a way in the future that the amounts of copper sludge produced at the sites in Hinterberg and Nanjangud correspond in the future. Subsequently, the concept will be rolled out to the other locations. Relative waste amount in kg per € GVA 2016/17 2017/18 2018/19 2019/20 0.15 0.11 0.09 ▪Hazardous waste ▪Non-hazardous waste 0.110.06 0.09 0.04 0.07 0.02 0.07 0.02 0.08
  • 62.
    ANNUAL REPORT 2019/20ATS FIRST CHOICE FOR ADVANCED APPLICATIONS 58 COMPANY Essential materials for the production of our products Efficient production can be seen from material usage. Overall, we recorded an increase in the purchasing volume of copper, laminates and chemicals in the financial year 2019/20, while that of gold and palladium was down on the previous year. The purchasing volumes of gold and palladium decreased above all at the production site in Shanghai, by 7.1% and 10.4%, respec- tively, the main reasons being lower production volumes and a change in product mix. The increase in the volume of copper, laminates and chemicals purchased is attributable to stocking up the inventories during the COVID-19-pandemic. This ensured that production could proceed smoothly. Purchase of significant materials Total Group Unit 2019/20 2018/19 Change in % Gold kg 508 547 (7.1) Palladium kg 154 171 (10.4) Copper t 4,066 3,764 8.0 Laminate million m² 13.8 12.8 8.0 Chemicals thousand t 147.1 138.0 6.6 Purchase of significant materials attributable to parent company Unit 2019/20 2018/19 Change in % Gold kg 99 117 (15.2) Palladium kg 0 0 n.a. Copper t 396 367 7.9 Laminate million m² 1.3 1.3 (5.2) Chemicals thousand t 9.5 9.4 1.2 Classification of chemicals purchased in % 2019/20* 2018/19* Change in % Explosive GHS01 – – n.a. Flammable GHS02 0.22 0.21 3.2 Oxidising GHS03 2.83 2.88 (1.8) Compressed gas GHS04 1.78 1.86 (4.2) Corrosive GHS05 79.11 79.33 (0.3) Toxic GHS06 0.61 0.66 (7.7) Irritant GHS07 32.02 32.75 (2.2) Health hazard GHS08 4.59 4.57 0.5 Environmental hazard GHS09 2.07 2.07 0.1 Non-hazardous – 12.18 11.28 8.0 * Since one chemical can be included in several hazardous substance categories, the total of all categories is greater than 100%.
  • 63.
    FIRST CHOICE FOR ADVANCEDAPPLICATIONS ANNUAL REPORT 2019/20AT S 59 COMPANY We permanently strive to reduce the environmental impact of ATS’s business activities to a minimum and to continuously im- prove our reporting in order to both offer our stakeholders more transparency and to enable better control. Compliance with EU Regulation 1907/2006, better known as the REACH Regulation, for all our products is a matter of course for us. (REACH stands for registration, evaluation, authorisation and restriction of chemicals and has been in force since 2007.) The same applies to the EU’s RoHS Directive, which governs the use of hazardous substances in electrical and electronic equipment. In the financial year 2019/20, we are reporting the GHS classifi- cation for purchased chemicals for the first time. GHS stands for Globally Harmonised System and refers to a standardised classi- fication and labelling of hazardous substances. This globally har- monised classification defines the danger of chemical products and comprises health and safety advice in handling them. The additional reporting of the GHS classification shows that the total quantity of purchased chemicals increased by 6.6% year-on- year, but the share of non-hazardous chemicals was 8% higher than in the previous year, while toxic chemicals were reduced by 7.7%. Sustainable Innovation Industrialising leading-edge technologies is our mission. Only with a strong team that stands for our innovative strength will this be possible. This is why our research and development departments and our engineering teams account for 11.4% of our total staff. In the course of defining the strategic fields of action and as- sessing the impact of ATS’s operations on non-financial issues and the UN Sustainable Development Goals (SDGs), there were substantial overlaps with the area of Environment Resources. This is due to the fact that many projects and programmes to achieve our climate and energy goals, waste reduction, resource efficiency or material recycling require innovative approaches in addition to efficiency and effectiveness. Nonetheless it is im- portant to us to focus on the topic of innovation as a separate strategic field of action – not only because innovation is highly relevant according to our materiality matrix from a company perspective and from the perspective of our stakeholders, but also because it is indispensable to embed sustainability in the innovation strategy and all research and development process- es. In addition, SDG 17 plays an important part in innovation be- cause especially in the area of research and development strong partnerships and joint development projects with customers as well as research institutions and suppliers are essential for suc- cessful project execution and the industrialisation of new ideas. SDGs The contribution of ATS in the area of Sustainable Innovation Our research and development departments and our engineer­ ing teams make a significant contribution to the decoupling of economic growth from environmental impact through global efficiency measures, higher productivity, technological develop- ment and innovation. One major contribution comes from the planned life cycle assessment project. Our research and development departments and our engineer­ ing teams make a significant contribution to the decoupling of economic growth from environmental impact through global efficiency measures, higher productivity, technological develop- ment and innovation. Certain approaches to waste prevention and recycling require innovative solutions. Innovative solutions can also play an important role in the course of developing a water strategy. The ATS energy strategy and the climate protection measures derived from it are central aspects of the sustainability strategy. New, innovative solutions can leverage the achievement of the climate and energy target. Global partnerships with universities, NGOs and agencies, as well as an active exchange of expert knowledge and know-how are integral parts of expanding sustainable development.
  • 64.
    ANNUAL REPORT 2019/20ATS FIRST CHOICE FOR ADVANCED APPLICATIONS 60 COMPANY SUSTAINABILITY IS ALREADY FIRMLY EMBEDDED IN THE RD PROCESSES In order to do business responsibly in the interests of future generations, it is necessary to consider sustainability aspects in the innovation strategy and in the processes. The ATS innova- tion process ensures that only leading-edge technologies reach the industrialisation phase. When evaluating projects, non-­ financial criteria are assessed along with market and strategy. For example, process efficiency, energy and resource consump- tion as well as positive effects on health and safety at work have the same weighting in the assessment. The innovation revenue rate (IRR) is an indicator of our innova- tive strength. It reflects the proportion of total revenue that ATS generates with product groups that have been on the market for less than three years. In order to further expand our technology leadership, ATS has defined the clear goal of achieving an an- nual IRR of at least 20%. In the financial year 2019/20, this target was once again exceeded by far with an IRR of 30.8%. The costs of research and development projects total € 94.8 million in the financial year 2019/20. This corresponds to a re- search rate of 9.5%. Innovation revenue rate Research rate (relative to revenue) The number of patents granted amounts to 326 at the end of the financial year 2019/20, while we recorded 61 new applications. The section “Research and Development” of the Management Re- port provides further details on due diligence processes, innova- tionrevenuerateandpatentsincludingyear-on-yearcomparisons. OUR INNOVATION AWARD BOOSTS INNOVATIVE STRENGTH AND SUSTAINABILITY To continuously drive effectiveness and efficiency and to gene- rate innovative ideas, products and technologies with minimal development times and a rapid market launch, we give centre stage to the best and brightest minds at ATS. We call on all resourceful and motivated employees from all areas across the globe to submit projects in the course of the annual Innovation Awards. This not only promotes knowledge transfer, team spirit and motivation, but also offers an opportunity across depart- ments and locations to actively participate in the innovation process. The Innovation Award has been presented since 2015. The evaluation criteria for the Innovation Award are based on the innovation process and also include economic, social and ecological aspects. In the financial year 2019/20, 23  projects were submitted for the Innovation Award: 19 technical projects and 4 administrative projects. All of the 8 finalist projects scored above average in the three clustered assessment criteria qual- ity, environment, health, safety, values and people. Four even scored higher than three in all three sustainability categories and thus above average. This is, from our perspective, anoth- Number of patents
  • 65.
    FIRST CHOICE FOR ADVANCEDAPPLICATIONS ANNUAL REPORT 2019/20AT S 61 COMPANY DIGITAL TRANSFORMATION IS GAINING FURTHER MOMENTUM The Digital Transformation Programme (DTP) continued to gain momentum in the financial year 2019/20 with the support of the Fraunhofer Institute Austria. After a detailed analysis of the content, another field of action was added. The DTP con- sequently comprises six fields of action now: management and organisation development, employee development, Industry 4.0 technology, data use and automation of production and ad- ministrative processes. Internal experts have been defined as “Digital Leaders” for these fields of action; they are responsible for and will drive the respective fields of action. The number of projects submitted to the ATS Innovation Award is also a good indicator of the topicality and importance of digitalisation. Once again, we recorded an increase in sub- missions which have digitalisation character in the financial year 2019/20. 39% of the projects submitted support digital trans­ formation, compared with 26% in the previous year. DIGITALISATION AND DATA SECURITY ARE NO CONTRADICTION Data protection is gaining increasing importance in a digital world. To protect our intangible assets and information of our key stakeholder groups, we continue to consistently pursue the path of ISO 27001 certification of our Information Security Management System. After the successful certification of our headquarters, the two plants in Austria and the branch offic- es in Europe across all company processes, the locations out- side Europe will now follow. This certification is driven by our Information Security Organisation and brings clearly noticeable improvements in our employees’ handling of confidential data. er indication of the growing importance of environmental and social responsibility, which permeates the entire organisation. Moreover, a sustainability award was presented for the most sustainable project in the financial year 2019/20. This under- lines the importance of sustainability for ATS and contributes to raising awareness among the workforce. An expert jury rates the projects submitted and chooses the winners from the pro- ject teams, many of which work together across locations. One of the winning projects of the Innovation Award 2019/20 is the “virtual printed circuit board”. The project successfully de- veloped a virtual, simulation-based tool set which contributes to accelerating product development and increasing the reliabil- ity of our products, thus minimising risk. At the same time, any simulation means a reduction in resources used and higher se- curity for the end customer. This project would therefore also be a candidate for the Sustainability Award, which, however, went to a project team from Fehring this year. They developed an in- expensive and efficient solution to prevent waste of resources caused by the carryover of chemicals and valuable materials such as gold in wet processes. In addition, the process was real- ised maintaining maximum energy efficiency. WE SET THE COURSE TOWARDS LIFE CYCLE ASSESSMENT During the financial year 2019/20 we started to increasingly ad- dress the carbon footprint of our materials. This is shown by our Scope 3 emissions, which are reported for the first time in depth in the section Environment Resources in the financial year 2019/20. A research and development project is planned for the financial year 2020/21 in cooperation with external partners. The goal is a realistic introduction of a life cycle assessment at the process, tech- nology or even product group level.
  • 66.
    ANNUAL REPORT 2019/20ATS FIRST CHOICE FOR ADVANCED APPLICATIONS 62 COMPANY Employees Society The strategic field of activity Employees Society covers all measures related to our social responsibility. The material top- ics anti-corruption, diversity, health and safety and knowledge are allocated to this segment, and the focus here is on SDG 8, SDG  4, SDG  6, SDG  10, SDG  16 and SDG  17. In this context, SDG 8 must be viewed with a clear focus on respecting human rights, our responsibility as an employer and, consequently, our strict rejection of any form of child and forced labour. As pre- viously stated, respect for human rights, as a material topic in- cluding management approach, due diligence process and key indicators, is allocated to the Sustainable Supply Chain and is addressed in that chapter. Nevertheless, we must also underline the importance of complying with social standards and respect- ing human rights as a basis for SDG 8 and decent work when it comes to our responsibility as an employer. All of this goes hand in hand with SDG 16 and our zero-tolerance policy towards any form of corruption. Details on our contributions to the relevant SDGs are provided in the following table. THE ATS CODE OF CONDUCT AS A FOUNDATION FOR DECENT WORK All our principles with respect to business ethics, working condi- tions, health and safety as well as environmental topics directly and indirectly related to people and society are governed by our Code of Conduct. This code is based on the Responsible Business Alliance (RBA) and is applicable to all activities of ATS around the globe. These ethical principles and compliance with all laws form the basis of our trustworthiness and credibility as well as for long- term partnerships and sustainable success. Any form of misconduct, whether it is abuse of human rights, sus- pected corruption, inadequate working conditions or other viola- tions of our Code Of Conduct on the part of ATS stakeholders, canandshouldbereportedviatheATS“WeCare”whistleblowing platform. Internal Audit is responsible for processing such reports confidentially. In the financial year 2019/20 five reports were filed, SDGs The contribution of ATS in the area Employees Society ATS is committed to respecting human rights and does not tolerate any form of child or forced labour. We also protect the rights of our employees through adequate working condi­ tions, remuneration and working times, stable employment relationships and the freedom of association. For ATS, decent work also includes high health and safety standards for our employees which we provide based on ISO 45001 and OHSAS 18001 certifications at all production sites. All of this is specified in our globally valid Code of Conduct. ATS is a responsible employer for roughly 10,000 employees, providing appropriate technical and professional qualification for all. It goes without saying that we do not tolerate any dis­ crimination with respect to the training offered. Moreover, we continuously work on raising awareness of the importance of all sustainability dimensions. It goes without saying that ATS provides all employees worldwide with drinking water and clean sanitary facilities. In addition, we also support water supply projects in the neigh­ bourhood of our plant in Nanjangud, India. ATS stands for economic inclusion, equal opportunities, anti-discrimination regardless of gender, skin colour, ethnicity and national origin, religion, age, sexual orientation, gender identity, pregnancy, political affiliation, trade union affiliation, marital status, type of personality, language skills, physical and mental abilities, education level, socio-economic background, former military affiliation, intercultural skills and perspective or learning differences. ATS commits to complying with the Austrian Code of Cor­ porate Governance, thus ensuring a high level of transparency. Based on our Code of Conduct we reject any form of bribery or corruption and do not tolerate any form of violence, abuse or taking advantage of children. ATS has established a whistle- blowing platform for all of these cases. ATS maintains global partnerships with universities, NGOs and agencies in order to expand sustainable development. all of them anonymously. Four of these reports required detailed investigations, but no further measures had to be initiated. ATS defends the rights to freedom of opinion and association as well as fair payment as a matter of principle, and, as a responsible employer, ensures compliance with the statutory working times.
  • 67.
    FIRST CHOICE FOR ADVANCEDAPPLICATIONS ANNUAL REPORT 2019/20AT S 63 COMPANY At the end of the financial year 2019/20, ATS employed 10,511 people; 2.3% of them are contract workers. ATS strives to continuously lower the share of contract workers as we aim to be a stable and responsible employer. Compared with the previ- ous year, we reduced the share of contract workers by another 42%. The attrition rate was further decreased from 20.4% in the pre- vious year to 15.3% – despite the fact that the attrition rate is generally higher at the Chinese locations, which is typical of the Chinese labour market. The attrition rate is an indicator of the satisfaction and motivation of our employees. Therefore, we con- duct standardised employee surveys at the Chinese sites every year in order to keep the attrition rate to a minimum. We remunerate our employees at market conditions and in ac- cordance with the applicable laws, in Austria at least according to the collective agreement. The ratio of personnel costs to rev- enue was 25.2% in the financial year 2019/20, up 9.1% on the previous year. Details are provided in the explanations regarding the consolidated statement of profit or loss in the notes to the consolidated financial statements. In addition, our Group-wide bonus system governs performance-based remuneration, which depends on the economic performance (EBIT; ROCE), innovative strength (IRR) and the personal performance of employees. ZERO TOLERANCE OF CORRUPTION ATS pursues a zero tolerance policy towards any form of corrup- tion. In order to meet the highest standards for our stakeholders at any time, in both technical and business terms, the Group’s Anti-corruption Guideline entered into force in 2016. This guide- line sets the standards for appropriate business practices and is valid for ATS executives, representatives and employees. To raise awareness among everyone, the content of the guideline is conveyed to all employees through various communication channels. Following a risk-based approach, employees who have to undergo special anti-corruption training due to their position and activity are selected. 697 people received training during the financial year 2019/20, and took a final test to ensure that the content conveyed had been understood. This corresponds to an increase of 58% over the previous year. Our Capital Market Compliance Guideline aims to prevent the abuse of compliance-relevant inside information in accordance with the applicable laws and the ACCG. This guideline is applicable to all ATS employees and corporate bodies including the Super­ visory Board. Capital market compliance training was converted to the new Learning Management System in the past financial year, which enables more comprehensive training including a final test. Of 225 persons pertaining to an area of confidentiality, 85% completed the training successfully in the financial year 2019/20. The training rate reported in the previous year was 100%. Headcount (at year-end) number of people 2019/20 2018/19 Male Female Total Male Female Total White collar 2,236 741 2,977 1,941 684 2,625 Category Blue collar 4,692 2,842 7,534 4,493 2,707 7,200 Europe USA 927 653 1,580 912 667 1,579 Region Asia 6,001 2,930 8,931 5,522 2,724 8,246 Mobile Devices Substrates 4,542 2,759 7,301 4,069 2,543 6,612 Segment Automotive, Industrial, Medical 2,236 717 2,953 2,230 751 2,981 Others 150 107 257 135 97 232 Full-time 6,891 3,384 10,275 6,387 3,187 9,574 Type of employment* Part-time 29 173 202 39 184 223 Total Group 6,928 3,583 10,511 6,434 3,391 9,825 thereof attributable to parent company 898 630 1,528 884 647 1,531 * Excl. inactive employees, e.g. parental or educational leave
  • 68.
    ANNUAL REPORT 2019/20ATS FIRST CHOICE FOR ADVANCED APPLICATIONS 64 COMPANY DIVERSITY – OR THE VALUE OF UNIQUENESS AND HOW WE PROMOTE IT As a globally operating company, people of different ages, ­ethnic or national origins, physical and psychological abilities, sexual orientations, cultural and religious affiliations, political beliefs, marital status and education levels constantly meet at ATS and provide for a diverse mix. We consider this diversity an enrich- ment for any team and organisation. It stimulates collaboration through different perspectives and should be taken as an op- portunity for development. Numerous studies have shown that diversity has a positive impact on profitability and growth rates, increasing innovative strength, creativity and problem-solving skills. This leads to higher motivation among employees, caus- ing attrition rates to decline and increasingly addressing talents. Ambitious diversity goals In its diversity strategy, ATS focuses on four areas: gender, cul- ture ethnicity, age generations, and skills. On this basis, we aim to position ourselves as a diverse and inclusive employer that values the uniqueness of every single employee, promoting them as best possible. This is supported by the ATS Code of Conduct, which applies throughout the Group and rejects any form of dis- crimination. This commitment to diversity is now also found on our career page. Our goal is to be an attractive employer for women, for people of any age, for people of different cultural, national or ethni- cal background as well as for people with disabilities. In a first step, we set the quantitative goal of achieving a total share of female employees of 45% by 2025. We aim to increase the share of women with management responsibility to 30%. To achieve this goal, we have taken a variety of measures, above all in recruitment and personnel development, which will be implemented starting in the financial year 2020/21. At the end of the financial year 2019/20, the share of women at ATS amounted to 34.1%, a slight decrease of 0.4 percent- age points compared to the previous year. On the first man- agement level, i.e., managers reporting directly to the Man- agement Board of the ATS Group, the share of women more than doubled from 5% in the previous year to 13.6%. ATS employed people of 55 different nationalities at the end of the financial year. The average length of service, at 6.4 years, Diversity of employees (at year-end) in %, parent company 2019/20 2018/19 White collar Blue collar White collar Blue collar Female 34.6 46.7 34.9 47.5 Gender Male 65.4 53.3 65.1 52.5 30 years 20.5 26.9 20.0 29.3 30–50 years 54.2 42.6 59.3 44.0 Age group 50 years 25.3 30.5 20.8 26.7 Diversity of employees (at year-end) in %, total Group 2019/20 2018/19 White collar Blue collar White collar Blue collar Female 24.9 37.7 26.1 37.6 Gender Male 75.1 62.3 73.9 62.4 30 years 26.1 43.7 25.0 48.1 30–50 years 64.9 51.7 67.0 47.8 Age group 50 years 9.0 4.6 8.0 4.1
  • 69.
    FIRST CHOICE FOR ADVANCEDAPPLICATIONS ANNUAL REPORT 2019/20AT S 65 COMPANY hardly changed in comparison with the previous year, while the average age within the Group increased again slightly to 33.6 years. In the previous year, average company affiliation was also 6.4 years while the average age was 32.7 years. This year the age spread between the youngest and the oldest em- ployees is 56 years. As of 31 March 2020 we employed 49 peo- ple with a disability worldwide, 80% of them at the Austrian locations. In the previous year we employed 48 persons with a disability, 81% of them in Austria. The good news: many measures have already been implemented Diversity and social sustainability require interacting with all peo- ple as equals, regardless of gender, origin, religion, physical or mental disability. ATS strives to overcome barriers of any kind. However, barriers go beyond physical constraints and restricted mobility, and often begin with language, for example. Like lan- guage, different cultural characteristics can also represent a bar- rier between people. Therefore it is in ATS’s interest to launch initiatives which counter such barriers. Consequently, we offer intercultural training and language courses aiming to convey dif- ferent values, cultures and behaviour patterns of different coun- tries to our employees. We currently offer language courses in German, English and Mandarin. As an inclusive, diverse employer, ATS is open to gender equal- ity. For example, we reacted to a ruling of the Austrian Constitu- tional Court of 15 June 2018, which grants intersexual persons a right to an adequate designation in the register of persons and is based on Article 8 of the European Human Rights Convention. Consequently, ATS advertises job vacancies in Europe in such a way that we address all genders using m/f/d. As mentioned be- fore, the career page on our website includes a clear statement in accordance with our Code of Conduct and the Responsible Busi- ness Alliance (RBA) expressing that we value and promote diversi- ty in all areas of the company. The coordination of different areas of life such as work, spare time and family poses a challenge for many people. As a responsible employer, ATS strives to support the compatibility of job and family. This increases motivation while reducing attrition. ATS therefore offers more than 100 different working time models. A child care facility was set up at the production site in India. But employees also face plenty of requirements and challenges in their everyday work. To enable them to overcome stress situations successfully and react competently in tense situations, ATS offers courses and seminars on dealing with challenging situations. Equality does not stop at our governing bodies Equality, non-discrimination and the promotion of women are core topics of diversity and fundamental framework conditions for a future-oriented employer, which also comprises the gov- erning bodies of ATS such as the Supervisory Board and the Management Board. Therefore, we pursue the following targets when filling Super- visory Board mandates: At least 30% women and 30% men should be represented. The age spread of the Supervisory Board members should exceed 25 years and experience in in- ternational companies is mandatory. The expertise of the mem- bers should comprise at least technology/research, electronics/ semiconductor industry, law, company and human resource management as well as sustainable management. With these targets, ATS meets the requirement of Section 7 para. 86 of the Austrian Stock Corporation Act (AktG). The share of women in the Supervisory Board was raised from 16.7% to 25% with the election of Gertrude Tumpel-Gugerell. As in the previous year, one of the three Management Board positions is held by a wom- an. Regardless of job advertisement and position, vacancies are filled on the basis of best qualifications; all qualifications being equal, preference will be given to the underrepresented gender in the specific case. For further information regarding age and gender of the governing bodies, please refer to the Corporate Governance Report.
  • 70.
    ANNUAL REPORT 2019/20ATS FIRST CHOICE FOR ADVANCED APPLICATIONS 66 COMPANY 3,58310,511 Employees total_ Absolute Number of female employees_ Absolute 69.0 14.5 13.3 Proportionally represented in the following countries China Austria India South Korea 2.4 0.8Other in % Proportionally represented in Supervisory Board Management Board Total staff First management level 25 33.3 34.1 13.6 20.7Management positions in % As of 31 March 2020 55 Number of nationalities_ Absolute 34 Average age_ of all employees in years Average age_ by country in years 32 India 37 South Korea 32 China 41 Austria
  • 71.
    FIRST CHOICE FOR ADVANCEDAPPLICATIONS ANNUAL REPORT 2019/20AT S 67 COMPANY TECHNOLOGY LEADERSHIP IS ONLY POSSIBLE WITH KNOWLEDGE AND EXCELLENTLY TRAINED EMPLOYEES As a result of the company’s continuous development and strategic orientation, the complexity of activities and the demands placed onouremployeesalsoincrease.Tothisend,weofferextensivepro- fessional, technical and personal development opportunities. We consider learning a lifelong process, which ATS supports based on target group and competence-oriented training and development. ATS’s open communication and feedback culture promotes ­dialogue with employees. The annual appraisal and development interviews are a key instrument in personnel development facil- itating both individual development planning and the support of the communication and feedback culture. Our corporate val- ues – open-mindedness, commitment and responsibility – serve as a platform for reflection in these interviews. They represent an important contribution to the promotion of individuals and personal development within the company. Appraisal interviews were conducted with 97% of the salaried employees in the finan- cial year 2019/20. The completion rate of the development inter- views, which take place in autumn, was 89%. The fulfilment rates were therefore at a similarly high level as in the previous year. The development needs determined have a direct influence on the preparation of the training offered. The training offer is extensive, multi-faceted and tailored to the needs of the respective sites. In addition to numerous in-house training sessions held by our experts and workplace training, we also invested € 1.86 million in external training and development measures. These costs fall under the expense type “Other” in the consolidated statement of profit or loss in the notes to the con- solidated financial statements. In addition to local training requirements, there is also a growing need for global training for employees, parts of which are man- datory. In order to ensure this, ATS uses a learning management system, which allows allocating content, recording progress and generating reports along with other advantages. In Europe, the entire and very comprehensive training catalogues can now be accessed via the Learning Management System, and training can be directly booked there. For global training, ATS uses different forms of e-learning to keep up with the times in this area, too. Along with employee development, ATS also focuses on pro- moting young professionals in different areas including appren- tice training in chemistry, physics, IT, mechatronics with a focus on manufacturing or automation technology, process technology, industrial business management and office administration. At the end of the financial year 2019/20, ATS employed 41 apprentic- es, 40 in Austria and one in Germany. 6 apprentices successful- ly completed their apprentice training in the past financial year, while the final exam for another 5 apprentices had to be post- poned to the financial year 2020/21 as a result of the measures taken by the Austrian Federal Government due to the COVID-19 pandemic. 13 new apprentices started their training. Motivated people who already have professional experience or have completed science and technology studies at university have the opportunity at ATS to gain international experience. As part of our International Trainee Program we continuously look for international talents for sales or technical positions. The trainee programme comprises 12-month vocational training in Austria followed by a 3-year international assignment to one of the ATS production sites in China or India or one of our sales locations. Expenditures on external training in thousand € 2019/20 2018/19 Change in % Mobile Devices Substrates segment 997 639 56.1 Automotive, Industrial, Medical segment 393 408 (3.7) Others 471 364 29.7 Total Group 1,861 1,410 32.0 thereof attributable to parent company 821 724 13.3
  • 72.
    ANNUAL REPORT 2019/20ATS FIRST CHOICE FOR ADVANCED APPLICATIONS 68 COMPANY THE HEALTH AND SAFETY OF OUR EMPLOYEES IS OUR FIRST PRIORITY Only employees who are in good health and feel good at their workplace can do their job productively and to the best of their abilities. Satisfaction and well-being help employees to opti- mally unfold their capabilities, thus creating added value for the company. ATS strives to promote employees’ health and to prevent potential risks and hazards. In addition to preventive measures based on targeted training, ATS meets the require- ments of the RBA with respect to occupational health and safe- ty. High safety standards which are certified in accordance with ISO 45001 or OHSAS 18001 apply at all sites. Management sys- tems and due diligence processes such as continuous workplace inspections and evaluations are part of these certifications. If necessary, regulation measures are initiated. As a result of the COVID-19 pandemic, the last quarter of the financial year 2019/20 was particularly challenging for our EHS teams, which did an outstanding job. All efforts were directed at maintaining operations at our locations or to restart as soon as possible, thus being a safe employer for roughly 10,000 employ- ees. Top priority was always attached to our employees’ safety. Therefore, all employees whose presence is indispensable at the site were equipped with protective masks and strict safety measures were taken. Our two Chinese locations in Shanghai and Chongqing were ini­ tially affected. ATS was one of the first companies allowed to reopen its plants after the lockdown imposed by the govern- ment. This was based on the fact that, according to the existing provisions of the emergency plan and crisis management, a task force was set up immediately. The main task of these teams in- cluded the monitoring and evaluation of information, analysis of guidelines, inventory and supply chain management, commu- nication with customers and safety in production. Professional- ism, team spirit, strict safety precautions and meeting all official requirements enabled us to resume production quickly. Man- datory protective masks, temperature measurements before entering the company premises, strict distancing rules at the workplace as well as separation walls and special procedures in the canteens are some of the measures taken to mitigate the risk of infection. Later, we benefited from our experience at the Chinese sites in Europe and India. Where possible, employees at the European sites can increasingly work from home to reduce personal con- tact and minimize a potential transmission of the virus. ATS provides the required equipment and technical support, which initially also posed challenges for our IT departments. In addi- tion, we also provided all employees of the Austrian locations with protective masks for private use. Occupational safety Ratio of accidents (with ≥1 lost working day per 1 million working hours) Ratio of average monthly lost working days (per 1,000 FTE) 2019/20 2018/19 Change 2019/20 2018/19 Change Mobile Devices Substrates segment 2.1 2.8 (0.6) 7.0 13.0 (6.0) Automotive, Industrial, Medical segment Others 3.2 4.0 (0.7) 4.3 7.0 (2.7) Total Group 2.5 3.1 (0.7) 6.2 11.2 (5.0) attributable to parent company 4.6 6.2 (1.5) 6.0 11.1 (5.1)
  • 73.
    FIRST CHOICE FOR ADVANCEDAPPLICATIONS ANNUAL REPORT 2019/20AT S 69 COMPANY The site in India also focuses on maximum protection of the em- ployees, which starts with a special seating order and halving the number of passengers on the company busses. In addition to specific seating rules at the canteen, mandatory face masks, the provision of hand sanitiser and continuous cleaning of en- trance areas, door knobs and working surfaces, an emergency service was set up, which is on call round the clock for corona- virus emergencies. If an employee were to be tested positive for COVID-19, ATS would pay for all medical expenses for the person affected and their family members. Thanks to these and other measures taken by ATS the com- pany already had positive media coverage, pointing out the ex- emplary approach, extensive protective measures and the early response of ATS to the challenges arising from the COVID-19 pandemic. The strong cohesion and great cooperation across locations is underpinned by ATS’s internal communication campaign ALL.TOGETHER.STRONG. The campaign supports the cohesion across plants and gives the employees insights into how the respective sites cope with production operations and virtual collaboration. However, the health and safety of our employees is also an im- portant focus in normal operations. Personal protective equip- ment from safety glasses to coats and safety shoes, noise meas- urements, annual fire drills, training and safety instructions especially with respect to dealing with dangerous substances, and regular breaks are only a few examples of the high safe- ty standards at all ATS locations. For employees who spend a large part of their everyday work sitting, a healthy, intact musculoskeletal system is important. Sitting for hours without any physical activity may increase the risk of cardiovascular dis- eases or osteoporosis. ATS promotes employees’ sports and community activities including tennis tournaments, biking and skiing trips or participation in various business runs. This helps minimise physical and psychological stress and maintain good health. In coordination with the plant management, the works council offers health days at the Austrian sites. The offer rang- es from various examinations such as lung function, eyesight, hearing, or measuring blood sugar levels and blood pressure to free-of-charge vaccinations such as TBE. ATS India also supported the participation of 119 employees in a running event, promoting team spirit and sports activities among the staff. In addition, a wellness programme for female employees, stress management training and health-support- ing activities were held in the last financial year. Annual health checks and financial support in case of hospitalisation are also offered for employees at ATS’s plant in South Korea. Occupational accidents declined from 3.1 to 2.5, while the aver- age monthly days lost were nearly halved from 11.2 in the pre- vious year to 6.2. At 0.9%, the rate of absences was also down on the previous year. No fatal accident occurred throughout the Group. This is a sign of a working occupational safety manage- ment and a high awareness level among employees. However, occupational accidents cannot be fully prevented. Even the slightest inattention may have a major effect. We continuously work on protecting our employees’ health and on preventing work-related stress and occupational accidents as far as possi- ble. All work safety indicators are location-related and include contract workers. Occupational accidents do not include acci- dents on the way to and from the workplace.
  • 74.
    ANNUAL REPORT 2019/20ATS FIRST CHOICE FOR ADVANCED APPLICATIONS 70 COMPANY OUR COMMITMENT IS WELL WORTH IT – AS PROVEN BY OUR NUMEROUS AWARDS ATS’s excellence in its operating activities in general, and in the highest quality, production, environmental and social standards as well as best customer service in particular, is reflected by the roughly 20 awards and prizes we received from different stake- holder groups in the financial year 2019/20 alone. The National Green Plant Certificate and Production Safety Excellence Award for ATS plant in Shanghai, the Environment Protection Cred- ible Enterprise Award for the plant in Chongqing, the Arogya Seva Ratna Award for occupational health and safety, numer- ous awards from our customers, the ALC award as the best Sty- rian company in the category “International” and the Diversity Award of the Boston Consulting Group, which we received only recently, are only a few examples. Social commitment connects us with the communities of our locations Apart from awards and prizes, some of which are attributable to the social commitment and ecological awareness of ATS, the company also engages in social projects as part of various initiatives and institutions in the communities adjacent to our production facilities. For example, employees of ATS Shanghai visited a retirement home. Annual family celebrations for young and old take place at both Chinese locations. Similar to the open house day at the headquarters, guided tours of the plant as well as a programme for children with game stations and fan- tasy tours are offered under the motto “ATS Wonderland”. All safety and data protections regulations are, of course, strictly complied with at these events. Since the Chongqing plant was established in 2011, the com­ pany has participated in a wide range of social activities and pro- jects. In December 2019, employees of ATS Chongqing visited an elementary school in the Tong Nan district, one of the poor- est regions in the southwest of China. Our employees gave the children winter jackets and school materials. Commitment and dedication to a well-functioning community also plays an important role at the ATS location in Nanjangud. ATS therefore supports school and water supply projects every year as well as medical care in the neighbouring villages. These and many other activities dedicated to education, health, water supply and hygiene have had a positive impact on the lives of many people. During the last financial year, for example, a river bank was developed for the people in the region, giving them access to fresh water for cleaning and religious practices. At the Austrian locations, ATS supports a variety of institu- tions with monetary and in-kind donations, for example in the areas of education, integration and healthcare. With the estab- lishment of the ATS social fund, ATS also strengthens social involvement and mutual support at the Austrian locations. The fund is financed by employees and the company and is designed to benefit employees who are suffering financial hardship through no fault of their own. A committee specifically set up for this purpose makes an anonymised decision about the type and amount of support.
  • 75.
    FIRST CHOICE FOR ADVANCEDAPPLICATIONS ANNUAL REPORT 2019/20AT S 71 COMPANY Sustainable Supply Chain The economic, ecological and social responsibility of ATS goes far beyond its own system boundaries and includes responsible sourcing and functioning supply chain management. In general, we see a greater risk within the supply chain, whether it is a risk of compliance violations, human rights abuses, poor working con- ditions or environmental offences. This is attributable to the fact that all policies and measures within the ATS system boundaries can be controlled directly, while the direct influence of ATS with- in the supply chain decreases with the number of subcontractors. Therefore, sustainable supply chain management has been de- fined as a strategic field of action in the strategy process. The material topic human rights has been assigned to this area. When allocating the UN Sustainable Development Goals (SDGs), we identified those SDGs as central which emphasise the impor- tance of responsible entrepreneurship of our business partners. We put great value on partnerships with suppliers who have an equally clear position as ATS against human rights abuses, cor- ruption and discrimination and comply with all applicable laws. COMPLIANCE WITH OUR CODE OF CONDUCT IS A KEY CONTROL ELEMENT IN SUPPLY CHAIN MANAGEMENT One of the most effective instruments to call on our suppliers to comply with our standards is the ATS Supplier Code of Conduct. It was prepared pursuant to the guidelines of the Responsible Busi- ness Alliance (RBA) and is publicly accessible on the ATS website along with the General Terms and Conditions of Purchase and the Guidelines for the Regulation of Environmental Related Substances inaccordancewiththeREACHRegulation.Thiscodeaimstoachieve a balance between realising a profit and ethnic responsibility, and provides a framework of action for our suppliers. It comprises busi- ness ethics and management practices, occupational health and safety, labour and human rights as well as environmental protec- tion. 80% of the purchasing volume of ATS is distributed among 99 suppliers. At the end of the financial year 2019/20, 95% of them had already signed our Supplier Code of Conduct. Our clear objec- tive is to have the code signed by 100% of these suppliers, whom we consider to be the most essential suppliers. Proportion of Code of Conduct signed SDGs The contribution of ATS in the area Sustainable Supply Chain We ensure compliance with ecological, ethical and social standards in all our business relationships, communicate them clearly in our Supplier Code of Conduct and examine compli­ ance in supplier audits. Based on the ATS Supplier Code of Conduct, we promote sustainable sourcing practices, transparent sustainability man­ agement and maximum resource efficiency, and demand these from our suppliers. In our Supplier Code of Conduct we require our business part- ners to have an equally clear positioning regarding economic inclusion, equal opportunities and anti-discrimination. Based on the Supplier Code of Conduct and audits, we require responsible management, a clear rejection of any form of bribery, corruption or any form of violence, abuse or taking advantage of children from our business partners. ATS relies on globally effective partnerships with suppliers to achieve the sustainability goals.
  • 76.
    ANNUAL REPORT 2019/20ATS FIRST CHOICE FOR ADVANCED APPLICATIONS 72 COMPANY OUR SUPPLIER AUDITS ENHANCE PARTNERSHIPS AND OFFER A DEVELOPMENT OPPORTUNITY To further reduce procurement-specific risks, new suppliers are audited with respect to quality, supply chain management, eco- logical and social responsibility as well as business ethics and human rights. In the financial year 2019/20, an audit plan was developed based on an established, risk-based approach, and 55 audits were conducted accordingly. 34 of these audits com- prised business ethics and respect for human rights alongside general social and ecological topics. A total of 13 slight deviations were registered in the areas of business ethics, working condi- tions and human rights in these 34 audits, of which four were related to working conditions an one to human rights. Together with the suppliers concerned we work on eliminating these devi- ations. In the previous year, 69 supplier audits were conducted, of which 58 comprised business ethics, working conditions and respect for human rights. Number of supplier audits HOW WE ENSURE RESPECT FOR HUMAN RIGHTS UP TO THE SOURCING OF MINERALS The extraction of valuable minerals is an intensive process involv- ing a great number of social and ecological risks. The sourcing of and trade in minerals in particular can have considerable negative effects, including severe human rights violations, money laun- dering and conflicts. With our commitment to the Responsible Minerals Initiative (RMI) we help mitigate the negative impact of the production and processing of minerals within our supply chain. The RMI acts in line with the United Nations and the OECD Guidelines for multinational enterprises, to which ATS is also fully committed. ATS thus also meets the requirements of EU Regulation 2017/821 and those of the Dodd Frank Acts Section 1502 of the US Congress. We comply with both the due diligence process of the RMI and the other definition of so-called conflict minerals, of which gold, tin and cobalt are used at ATS. ATS contacts all gold, tin and cobalt suppliers at regular inter- vals, at least once a year and as necessary in case of suspicion. We demand transparent reporting using the CMRT (Conflict Minerals Reporting Template) of the RMI for the entire sup- ply chain. RMI continuously publishes and updates the list of smelting plants and mines conforming to the rules, which have been audited. ATS exclusively accepts an RMI-compliant sup- ply chain. We are proud that we were able to report a 100% RMI-compliant supply chain last year, with a 100% response rate on the part of our suppliers. RMI compliance of our supply chain These requirements are also included in the Supplier Code of Conduct. It can be downloaded from the ATS website along with the CMRT of the ATS Group.
  • 77.
    FIRST CHOICE FOR ADVANCEDAPPLICATIONS ANNUAL REPORT 2019/20AT S 73 COMPANY GRI content index GRI standard (2016) Disclosure Page in the report, URL or reason for omission Organisational profile 102-1 Name of the organisation p. 192 102-2 Activities, brands, products, and services inside front cover 102-3 Location of headquarters inside front cover 102-4 Location of operations p. 100 f. 102-5 Ownership and legal form p. 77 and 192 102-6 Markets served inside front cover 102-7 Scale of the organisation inside front cover 102-8 Information on employees and other workers p. 63; disclosure on fixed-term employment contracts internationally not consistently possible 102-9 Supply chain p. 45 f. 102-10 Significant changes to the organisation and its supply chain none 102-11 Precautionary principle or approach p. 49 f. and 107 ff. 102-12 External initiatives p. 45 102-13 Membership of associations p. 45 Strategy 102-14 Statement from senior decision maker p. 44 102-15 Key impact, risks and opportunities p. 49 f. and 107 ff. Ethics and integrity 102-16 Values, principles, standards and norms of behaviour p. 45, 47 and 62 102-17 Mechanisms for advice and concerns about ethics p. 62 Governance 102-18 Governance structure p. 44 Stakeholder engagement 102-40 List of stakeholder groups p. 48 102-41 Collective bargaining agreements p. 63 102-42 Identifying and selecting stakeholders p. 48 102-43 Approach to stakeholder engagement p. 48 102-44 Key topics and concerns raised p. 48 Reporting practice 102-45 Entities included in the consolidated financial statements p. 122 102-46 Defining report content and topic boundaries p. 48 ff. 102-47 List of material topics p. 50 f. 102-48 Restatement of information none 102-49 Changes in reporting p. 48 102-50 Reporting period 01/04/2019–31/03/2020 102-51 Date of most recent report 06/06/2019 102-52 Reporting cycle annual 102-53 Contact points for questions regarding the report Annual Report: Gerda Königstorfer Non-financial Report: Nadja Noormofidi 102-54 Claims of reporting in accordance with GRI Standards p. 45 102-55 GRI content index p. 73 f. 102-56 External assurance p. 33 205 Anti-corruption 103-1;-2;-3 Management Approach p. 62 f. 205-2 Communication and training about anti-corruption policies and procedures p. 63 205-3 Confirmed incidents of corruption and actions taken p. 62
  • 78.
    ANNUAL REPORT 2019/20ATS FIRST CHOICE FOR ADVANCED APPLICATIONS 74 COMPANY GRI standard (2016) Disclosure Page in the report, URL or reason for omission 301 Materials 103-1;-2;-3 Management Approach p. 58 f. 301-1 Materials used by weight or volume p. 58 f.; distinction renewable/non-renewable not available 302 Energy 103-1;-2;-3 Management Approach p. 52 ff. 302-1 Energy consumption within the organization p. 54; distinction renewable/non-renewable and consumption types not available 302-3 Energy intensity p. 54 f. 302-4 Reduction of energy consumption p. 53; for further information see CDP Climate Change Report (www.cdp.net) 303 Water 103-1;-2;-3 Management Approach p. 56 f. 303-1 Water withdrawal by source see CDP Water Security Report (www.cdp.net) 305 Emissions 103-1;-2;-3 Management Approach p. 52 ff. 305-1 Direct (Scope 1) GHG emissions p. 53 ff. 305-2 Energy indirect (Scope 2) GHG emissions p. 53 ff. 305-3 Other indirect (Scope 3) GHG emissions p. 53 ff. 305-4 GHG emissions intensity p. 55 f. 305-5 Reduction of GHG emissions p. 53; for further information see CDP Climate Change Report (www.cdp.net) 306 Effluents and waste 103-1;-2;-3 Management Approach p. 56 f. 306-1 Water discharge by quality and destination see CDP Water Security Report (www.cdp.net) 306-2 Waste by type and disposal method p. 57; distinction by disposal method not available 403 Occupational Health and Safety 103-1;-2;-3 Management Approach p. 68 ff. 403-2 Types of injury and rates of injury, occupational diseases, lost days, and absenteeism, and number of work-related fatalities p. 68 f.; split by region, gender, permanent/temporary staff, ­occupational diseases and types of injury not available 404 Training and Education 103-1;-2;-3 Management Approach p. 67 f. 404-2 Programmes for upgrading employee skills and transition assistance ­programmes p. 67 f. 404-3 Percentage of employees receiving regular performance and career ­development reviews p. 67 f. 405 Diversity and Equal Opportunity 103-1;-2;-3 Management Approach p. 64 ff. and 36 ff. 405-1 Diversity of governance bodies and employees p. 64 ff. and 36 ff. 406 Non-discrimination 103-1;-2;-3 Management Approach p. 62 406-1 Incidents of discrimination and corrective actions taken p. 62 414 Supplier Social Assessment 103-1;-2;-3 Management Approach p. 71 f. 414-2 Negative social impacts in the supply chain and actions taken p. 71 f.
  • 79.
    FIRST CHOICE FOR ADVANCEDAPPLICATIONS ANNUAL REPORT 2019/20AT S 75 COMPANY ATS ON THE CAPITAL MARKET INTERNATIONAL STOCK MARKETS CONFRONTED WITH DIFFICULT ENVIRONMENT IN 2019/20 While topics such as the trade dispute between the USA and ­China, the global economic slowdown and the developments around ­Brexit dominated the economy and capital markets in 2019, the outbreak of the COVID-19 pandemic caused massive turmoil on the stock exchanges in early 2020. Againstthisbackground,theEuroSTOXX50showedavolatiledevel- opment up until the late summer of 2019, but then also reached its high for the reporting period in mid-February 2020. The Dow Jones Industrial Average showed a similar pattern, also marking its high in mid-February. However, as a result of the spread of the COVID-19 pandemic, both indices suffered massive losses and reached their low in March. Although they subsequently recovered, both the Euro STOXX 50 (-20.3%) and the Dow Jones Industrial Average (-15.5%) showed a loss during the reporting period. The indices on the Vi- enna Stock Exchange recorded a more negative development, with substantial losses for both the Austrian lead index ATX (-34.0%) and the more broadly based ATX Prime (-32.9%). PERFORMANCE OF THE ATS SHARE The ATS share started the new financial year at a price of € 15.9 in April 2019 and recorded significant gains until early May. How- ever, in a stock market environment marked, among other things, by trade conflicts and more cautious economic forecasts and driv- en by subdued signals from ATS’s customer industries, the share price dropped again in the late summer. Following that, a generally friendlier stock market environment provided more momentum as positive market assessments, for example for smartphones and IC substrates, also had a positive effect. On 22 January 2020, the Share price development ATS compared to ATX and TecDAX ▪ATS ▪ATX ▪TecDAX 60 70 80 90 100 110 120 130 04/2019 05/2019 06/2019 07/2019 08/2019 09/2019 10/2019 11/2019 12/2019 01/2020 02/2020 03/2020 50 140 150
  • 80.
    ANNUAL REPORT 2019/20ATS FIRST CHOICE FOR ADVANCED APPLICATIONS 76 COMPANY ATS share marked its high of the financial year at € 23.6. The out- break of the COVID-19 pandemic and the measures imposed by the authorities in China caused temporary disruptions of produc- tion, leading to a downwards revision of the revenue and earnings projections for the financial year 2019/20. Pressure on the share consequently increased significantly and was further intensified by growing uncertainty on the global stock markets. Accordingly, the share recorded its annual low of € 9.2 on 16 March 2020. After a phase of recovery, the ATS share closed at € 13.4 on 31 March 2020, recording a loss of 12.4% in the financial year 2019/20. CONVEYING THE GROWTH STORY In the past year, Investor Relations focused its capital market communication activities on further boosting investors’ trust in the company, the industry and the growth story “More than ATS“. The latter was consistently advanced with the entry into the module integration business and the initiated expansion of IC substrate activities in Chongqing. The company engaged in an intense exchange with existing and potential investors through a variety of different formats. These activities focused on the USA and Europe in the past year. At road shows and investor conferences as well as in one-on-one conver- sations the company also informed the capital market about the business development, progress made in the implementation of the strategy and the status of important operational projects. When the COVID-19 pandemic broke out, ATS reacted promptly. Changes were made to active interaction with investors and an- alysts, using the broad spectrum of communication tools offered by modern technology including conference calls, webcasts, vir- tual roadshows and conferences as well as videos. The company also ensured that all capital market participants received infor- mation in a transparent, equal and proactive manner through its communication activities. ATS provides interested capital market participants with regu- larly updated documents relevant to the capital market such as annual and quarterly reports and presentations on its Investor Relations page at www.ats.net/investors, for viewing and down- load. Channels on Twitter, LinkedIn, Instagram and YouTube serve as additional sources of information. Key share figures Unit 2019/20 2018/19 Closing price on 31 March € 13.4 15.3 High € 23.6 24.1 Low € 9.2 14.6 Market capitalisation (end of reporting period) € in millions 521.0 594.4 Average share turnover per day € in thousands 1.569.7 2.313.2 Average number of shares traded per day – 96,739 124,279 Dividend per share* € 0.25 0.60 Dividend yield (at the closing price) % 1.9 3.9 Earnings per share € 0.34 2.08 Book value per share € 19.6 20.7 Price-earnings ratio per share – 39.4 7.4 * 2019/20: proposal to the Annual General Meeting ATS bond Due on Coupon Issue size Hybrid bond ISIN: XS1721410725 24/11/2022 4.75% € 175 million ATS share Securities Identification No./ISIN 922230 / AT0000969985 Ticker symbols Thomson Reuters: ATSV.VI Bloomberg: ATS:AV Stock listing Vienna Indices ATX, ATX GP, WBI, VÖNIX Number of ordinary shares 38,850,000 Analyses of the ATS share Analyst recommendations* Erste Group Buy Raiffeisen Centrobank Hold Berenberg Bank Hold HSBC Buy * As on date of publication
  • 81.
    FIRST CHOICE FOR ADVANCEDAPPLICATIONS ANNUAL REPORT 2019/20AT S 77 COMPANY Shareholder structure in % * Including direct and indirect holdings Free Float Dörflinger Private foundation* Androsch Private foundation * 64.6 17.8 17.6 0.50 0.30 0.20 0.10 Dividend development Dividend and dividend yield ▪Dividend per share (in €) ▪Dividend yield (rhs, in %) 0.70 0.60 4.5 4.0 3.5 3.0 2.5 2.0 1.5 1.0 0.5 0.0 0.40 0.00 2015/16 2016/17 2017/18 2018/19 2019/20* * Proposal to the Annual General Meeting CAPITAL MARKET TRANSACTIONS In the financial year 2019/20, ATS did not carry out any capital market transactions. Rather, the focus during the reporting peri- od was on financing the capital requirements of the coming years early in order to secure the favourable financing environment in the long term. To this end, a credit line of an aggregate volume of € 300 million as part of an OeKB equity financing programme and a promissory note loan transaction totalling € 80 million were successfully concluded. All of these activities serve the general financing of the compa- ny at very favourable terms and conditions and are long-term components of the value-increasing mid-term strategy “More than ATS”. With a clear focus on new interconnect solutions by combining existing and new technologies, the aim is to generate revenue of € 2 billion in the medium term. Contact/Shareholder hotline: ▪  Gerda Königstorfer Director Investor Relations Phone: +43 3842 200-5925 Mail: g.koenigstorfer@ats.net ▪  Johannes Mattner Manager Investor Relations Phone: +43 3842 200-5450 Mail: j.mattner@ats.net ATS financial calendar 29/06/2020 Record Date Annual General Meeting 09/07/2020 26th Annual General Meeting 28/07/2020 Ex-Dividend Day 29/07/2020 Record Date Dividend 30/07/2020 Dividend Payment Day 04/08/2020 Publication of the first quarter 2020/21 03/11/2020 Publication of the first half-year 2020/21 02/02/2021 Publication of the first three quarters 2020/21 18/05/2021 Publication Preliminary Annual Results 2020/21
  • 82.
  • 83.
    80 _ Marketand industry ­environment 87 _ Economic report 100 _ Other statutory information 104 _ Research and development 107 _ Opportunities and risks 115 _ Outlook
  • 84.
    80 GROUP MANAGEMENT REPORTANNUALREPORT 2019/20AT S FIRST CHOICE FOR ADVANCED APPLICATIONS ATS ANNUAL REPORT 2019 /20 GROUP MANAGEMENT REPORT FIRST CHOICE FOR ADVANCED APPLICATIONS 2 1.1.General economic environment Economic slowdown followed by COVID-19 crisis A downturn in line with the economic cycle and intensified by factors such as the US-China trade conflict and Brexit was already visible in 2019. The COVID-19 pandemic, which set in at the beginning of 2020, and the associated crisis measures put a brake on global economic activity and led to substantial downgrades of the GDP projections for 2020. By the end of April 2020, the global GDP growth forecast for 2020 had already declined from 2.9% to 0.4% in the most important economies due to the impact of the crisis measures (OECD, March and April 20201 ). Each additional month of restrictions should further curb global GDP growth by another 2 percentage points in 2020 (OECD, April 20202 ). Other forecasts already project globally negative GDP growth of -2.8% in 2020 (Oxford Economics, April 20203 ) up to -4.2% (IC Insights, April 20204 ). These deviations reflect the enormous volatility of the current situation. A recovery of the global economy is currently expected for the year 2021 (OECD, March 20205 ). 1 OECD Economic Outlook, Interim Report March 2020, OECD Publishing, Paris, https://doi.org/10.1787/7969896b-en. “OECD updates G20 summit on outlook for global economy”, April 2020, http://www.oecd.org/newsroom/oecd-updates-g20-summit-on-outlook-for-global-economy.htm 2 “OECD updates G20 summit on outlook for global economy”, April 2020, http://www.oecd.org/newsroom/oecd-updates-g20-summit-on-outlook-for-global-economy.htm 1.2.Industry environment Industry trends: short-term effects of COVID-19, strong medium-term growth perspective for artificial intelligence, 5G, automation, electrification of mobility and module integration A health crisis as caused by COVID-19 can have a significant impact on the markets in the short term. The long-term trends up to 2025 and beyond are primarily driven by overcoming long- term social challenges and should remain largely unaffected by COVID-19 based on current estimates (Prismark and Yole, April 2020). Digital technologies and electronics are increasingly gaining importance for people’s lifestyle. Information and communication media, for example, have to be available anytime, anywhere; devices should be able to perform tasks to support people as autonomously and efficiently as possible, which requires a growing number of mobile electronic devices equipped with sensors, artificial intelligence, high-speed data transmission capabilities, etc. Moreover, mobility is supposed to be safe without any limitations and eco-friendly at the same time, and personal safety and health should be improved continuously as the population keeps aging. 3 Oxford Economics World Economic Prospects (April 2020), http://resources.oxfordeconomics.com/world-economic-prospects-executive-summary 4 IC Insights, McClean Report update, April 2020. 5 OECD Economic Outlook, Interim Report March 2020, OECD Publishing, Paris, https://doi.org/10.1787/7969896b-en. 1. MARKET AND INDUSTRY ENVIRONMENT
  • 85.
    81 GROUP MANAGEMENT REPORTFIRST CHOICE FOR ADVANCED APPLICATIONS ANNUAL REPORT 2019/20AT SATS ANNUAL REPORT 2019/20 GROUP MANAGEMENT REPORT FIRST CHOICE FOR ADVANCED APPLICATIONS 3 The smallest possible mobile devices such as smartphones, smartwatches, wireless earphones and virtual reality glasses support people in a wide variety of tasks. Thanks to mobile diagnostics and therapy devices, it is also becoming easier to monitor health better. In all of this, users expect an increasing number of functions on ever-smaller space with longer battery life to support such a mobile lifestyle. As mobile devices are getting smaller, have more additional functions per device and require more battery space for longer battery life, “miniaturisation” of the electronics contained in the device is becoming a necessity. While the cycles of developing and launching products on the market are getting shorter, quality requirements are increasing at the same time. This challenge can be met by combining predeveloped, multiple-use system parts with one or several system functions in electronic modules (“modularisation”). Examples of such modules include sensor modules, computing or artificial intelligence (AI) modules, storage modules, and radio frequency (RF) modules for wireless communication and data transmission. The trend of modularisation increasingly manifests itself not only in consumer, computer and communication products such as smartphones, smartwatches, smart speakers, notebooks, etc. but also in all other areas of electronics including automotive, industrial and medical applications. Interconnect solutions consisting of printed circuit boards and IC substrates using embedding as one of the key technologies for the integration of modules with a growing number of functions make a significant contribution to supporting the trend of modularisation. They shorten electrical lines between the components and save space. Printed circuit boards and interconnect solutions for consumer, communication and computer applications (“CCC”) are additionally subject to the necessity to provide minimum trace widths for high levels of integration in large production volumes. Automotive, industrial and medical applications (“AIM”) use high-end technologies with reduced trace widths from CCC as a platform for further innovation. The focus is on the introduction of new materials (e.g. high-frequency printed US$ 546 BILLION SMARTPHONE US$ 2,831 BILLION SMART AUTOMOTIVE US$ 13 BILLION HEALTHCARE US$ 40 BILLION AUGMENTED REALITY VIRTUAL REALITY US$ 180 BILLION INDUSTRY 4.0 MARKET SIZE BY APPLICATION 2025 Source: Yole, ATS Analysis (April 2020) US$ 17 BILLION ARTIFICIAL INTELLIGENCE MACHINE LEARNING US$ 58 BILLION 5G BASE STATION US$ 125 BILLION DATA CENTRES + INCLUDING 70 % 5G SMARTPHONES
  • 86.
    82 GROUP MANAGEMENT REPORTANNUALREPORT 2019/20AT S FIRST CHOICE FOR ADVANCED APPLICATIONS ATS ANNUAL REPORT 2019/20 GROUP MANAGEMENT REPORT FIRST CHOICE FOR ADVANCED APPLICATIONS 4 circuit boards for radar applications in the automotive sector), process control within even tighter limits and further technological improvements to meet very high quality requirements. The application trend towards smart autonomous devices supporting a mobile lifestyle and the automation of production requires omnipresent connectivity to exchange huge data volumes (Internet of Things, machine-to-machine communication) or artificial intelligence. Such systems must have particularly high data processing and computing capability. They also have to interact with the environment via sensors and actuators. Such sensors and actuators comprise optical sensors, position and environmental sensors, miniaturised light sources and displays, miniaturised speakers, etc., which further increase the data volume and, consequently, the computing and storage requirements. Significant improvements in connectivity are expected following the introduction of the 5G telecommunication standard (data rates of high gigabit/s with latencies (= reaction times) of 1ms). This will allow de facto real time applications for mobile devices, robotics and autonomous driving, to name only a few examples. Another important trend is the introduction of technologies to prevent emissions, which drives the electrification of vehicles for example. Along with autonomous driving, this is another key application driver for more electronics in vehicles. More efficient networks in vehicles (48V electrical system) as well as electrical motors require the transmission and switching of ever-increasing power, which requires measures to cool the electronics and minimise switching losses. Depending on the development stage of individual electronic applications, the related markets will have a significant size by 2025. End customer application markets such as vehicles with automated driving capabilities (“Smart Automotive”) and smartphones offer great opportunities for electronic systems. Other interesting opportunities arise in data centres, 5G base stations and in industrial automation (Industry 4.0). New applications such as AI (artificial intelligence) components, sensors as a part of health electronics and AR/VR devices (augmented reality/virtual reality) represent comparatively smaller markets, however, with a particularly strong potential for growth. All of these applications can only be realised with highly advanced interconnect solutions as an increasingly significant part of the system as a whole. Modularisation is opening up considerable growth potential for high-end printed circuit board and IC substrate producers like ATS by proactively entering into development partnerships with customers. Electronics market: further growth through digitalisation and new functions such as artificial intelligence, 5G connectivity and automation The solution of social tasks by means of electronic hardware and software (“digitalisation”) is gaining increasing importance as has been noticeable over the past decades. Electronics are used in an ever-growing number of applications in order to make them “smart”, thus also continuously driving growth of the total electronics market. The total electronics market comprises all manufactured electronic devices and electronic systems. Like macroeconomic data, estimates regarding the total electronics market as well as all other following market estimates are subject to high volatility due to the COVID-19 pandemic. This applies in particular to the year 2020. As a result of the COVID- 19 effects expected to date, the entire electronics market, which totalled US$ 2,143 billion in 2019, should shrink by slightly more than 10% in 2020 (Prismark, April 2020). The strongest declines in the total electronics market are projected for the industrial, automotive and consumer segments as consumers and companies are likely to spend less on non- essential goods (Prismark, April 2020). The computer and communication segments will also be significantly affected by the COVID-19 pandemic in 2020 according to current estimates. Following an initial boost in demand due to an increased need for home office equipment, PC and notebook applications are set to record a considerable decline. Further significant growth is expected for servers as another key application in the computer segment due to growing data traffic. Within the communication segment, the strongest decline is forecast for smartphones, while wireless infrastructure is predicted to continue to grow substantially in 2020. In terms of whole segments, tangible growth is only projected for the medical
  • 87.
    83 GROUP MANAGEMENT REPORTFIRST CHOICE FOR ADVANCED APPLICATIONS ANNUAL REPORT 2019/20AT SATS ANNUAL REPORT 2019/20 GROUP MANAGEMENT REPORT FIRST CHOICE FOR ADVANCED APPLICATIONS 5 sector in 2020. This is in part attributable to stable demand independent of COVID-19 and some one-off effects such as increased demand for life-saving ventilators. The long-term global market forecast for electronic systems up to 2025 will not be influenced by COVID-19 according to current estimates. Based on long-term trends and new functions such as artificial intelligence, 5G connectivity, automation, electrification of mobility and renewable energy production, we can still expect mean annual growth in the electronic systems market of 3.2% to US$ 2,587 billion in 2025 (Prismark, April 2020). The annual growth rates of the individual segments are expected to range between 1.6% (computers) and 6% (automotive). Due to the increase in electronic content per vehicle for automated driving and electrification, individual segments of automotive electronics such as automated driving (camera, radar, etc.) should continue to grow strongly. However, the recovery from the COVID-19 crisis may take longer in the automotive segment than in other segments. In industrial electronics, a massive growth surge is expected due to automation including robotics, digitalisation of the manufacturing environment and machine-to-machine (“M2M”) communication. The new 5G wireless standard is a massive growth driver for all segments. 5G enables wireless communication in real time with very high data rates, allowing not only videos to be played on mobile devices and general mobile data transmission from the Internet without any time delay but also all types of communication between machines (“M2M” or “machine-to- machine” communication) or vehicles (“Vehicle-to-X” or “V2X” communication). The enhancement of electronic systems with artificial intelligence (AI) is another, at least equally important growth driver for all sectors. In addition to software, this requires highly advanced and high-quality processor and storage hardware. Current examples include server, PC/notebook and smartphone processor modules with AI accelerators. Camera modules for smartphones and microphones with AI functionality to improve detection signals are further examples. AI technology is also applied in automated drive systems, manufacturing robots and intelligent “home robots”. Home robots comprise a variety of applications ranging from AI-enhanced smart speakers, monitoring devices, robots for household activities, robots assisting older people or toy robots. In these cases, AI is used for the automated evaluation and interpretation of detection signals or images, for automated data analysis or for intelligent decision-making based on the data collected. Printed circuit board and IC substrate market: medium-term growth follows that of the electronics market, further intensified through module integration Printed circuit boards (PCBs) are used to provide electric connectivity for electronic components mounted on their surface including passive electronic components, such as Electronics market by segment 2019 in % COMMUNICATION COMPUTER AVIATION SECURITY MEDICAL CONSUMER AUTOMOTIVE INDUSTRIAL 26 14 10 7 11 27 5 Market size 2019: US$ 2,143 billion Source: Prismark, April 2020 +3.2% CAGR 2019–2025: Market growth
  • 88.
    84 GROUP MANAGEMENT REPORTANNUALREPORT 2019/20AT S FIRST CHOICE FOR ADVANCED APPLICATIONS ATS ANNUAL REPORT 2019/20 GROUP MANAGEMENT REPORT FIRST CHOICE FOR ADVANCED APPLICATIONS 6 resistors and capacitors as well as packaged integrated circuits (“ICs”), electronic modules and “systems in package“, which contain at least two components and carry out at least one system function such as detecting or actuating, data transmission, processing, data storage or energy management. Based on current estimates it can be assumed that the economic slowdown caused by COVID-19 will lead to temporary effects on the global printed circuit board market. The market environment, which is currently subject to by high volatility, does not allow a more accurate assessment in figures. However, a substantial recovery in demand can be expected, driven by an intensified trend towards digitalisation. These effects are currently clearly visible in the global IC substrate market due to the resulting significant increase in data volume; it therefore can be assumed that demand will continue to be positive in this market segment. As stated previously, no effect is expected on the overall medium and long-term growth of the printed circuit board market, which is driven by the increasing functions of the electronics systems. Up to 2025, mean annual growth of 4.7% to just over US$ 76 billion is expected. As in the electronics systems market, this growth up to 2025 and beyond will be driven by the long-term trend towards digitalisation, and new functions such as artificial intelligence, 5G, automation, electrification of mobility and module integration to accelerate development and reduce costs for electronic systems. Depending on the segment, annual growth in the printed circuit board markets is expected to range from 2.4% (Aviation Security) to 5.6% (Communication) between 2019 and 2025 (Prismark, April 2020). Segment AUTOMOTIVE AVIATION SECURITY INDUSTRIAL MEDICAL COMMUNICATION COMPUTER CONSUMER SUBSTRATES Market risks Strong decline in vehicles sold Particularly strong decline in the segment of new civil aircraft Significantly lower investment activity No particular risks due to COVID-19 pandemic Strong decline in mobile devices Slump in PC and notebook sales after a short- term boom due to home office equipment Change in consumer behaviour due to COVID-19 leads to purchasing restraint Despite significant increase in substrate size and number of layers lower need for substra- tes for processor modules for PCs and notebooks Trend Market opportunities Electronic content in vehicles increases (automated driving, electrification of powertrain) Growth in selective applications such as camera, radar, etc. Growth in satellite and security applications Public sector investment incentives for applications such as renewable energies Stable market development and special demand for some applications such as ventilators Increased data transmission requirements (remote working, online services) Public sector investment incentives and investments in communication infrastructure Growth in base stations, satellites, etc. Increased data processing requirements in data centres (remote working, online services) and need for additional servers Continued growth in individual applications such as wireless earphones Especially strong growth for IC substrates for processor modules for infrastructure (5G base stations, servers for data centres) Source: Prismark, April 2020; Substrates: Yole, May 2019; ATS Analysis Development of the PCB and IC substrate market in 2020
  • 89.
    85 GROUP MANAGEMENT REPORTFIRST CHOICE FOR ADVANCED APPLICATIONS ANNUAL REPORT 2019/20AT SATS ANNUAL REPORT 2019/20 GROUP MANAGEMENT REPORT FIRST CHOICE FOR ADVANCED APPLICATIONS 7 Annual growth in the IC substrate market is still estimated at approximately 10% up to 2025. This applies in particular to the FCBGA market segment, in which ATS is active, where processor modules are the main application (Yole, May 2019). As previously mentioned, this subsegment is not expected to see a strong negative influence from COVID-19 since demand in this market segment is currently higher than the available supply due to the introduction of AI and 5G. Technological changes such as heterogeneous integration of processors and memory or chiplets drive demand due to a higher number of substrate layers and larger form factors. Due to new chip generations, minimal pattern sizes are becoming ever smaller. Moreover, the components and routing layers on IC substrates are increasingly often directly connected with each other as the next step of system integration (“fan out”, “embedding”). The integration of system functions in “systems in package” or electronic modules is a trend that goes beyond processor modules. Such functions include sensors, actuators, energy management and RF connectivity. This trend towards module integration is attributable to the reduction in system costs, MEDICAL CONSUMER SUBSTRATES AUTOMOTIVE AVIATION SECURITY INDUSTRIAL COMMUNICATION COMPUTER 1.3 6.8 2.7 2.6 17.2 14.5 8.0 4.8 58.0 9.3 10.0 16.9 23.8 3.2 3.1 8.9 1.5 76.6 +2.5% +5.6% +3.8% +4.5% +3.1% +11.4% +2.4% +2.8% +4.7% Substrates and PCB market US$ in billions 2019 2025 Source: Prismark, April 2020; Substrates: Yole, May 2019 CAGR
  • 90.
    86 GROUP MANAGEMENT REPORTANNUALREPORT 2019/20AT S FIRST CHOICE FOR ADVANCED APPLICATIONS ATS ANNUAL REPORT 2019/20 GROUP MANAGEMENT REPORT FIRST CHOICE FOR ADVANCED APPLICATIONS 8 miniaturisation and faster time to market of end user products when tested and qualified electronic modules are used. The market for module integration services (printed circuit boards/substrates, module production and test) will show annual growth rates of more than 10% and reach a similar size as the printed circuit board market within a few years. The technology options for module integration from the ATS toolbox include HDI, mSAP, SAP, embedding and 2.5D. This module market thus offers ATS an important opportunity for further growth, but requires strengthening of manufacturing and testing service capabilities. In the short term, growth is also expected to slow down significantly in this market because of the COVID-19 crisis, while submarkets such as the wireless module and sensor module segments still offer growth opportunities.
  • 91.
    87 GROUP MANAGEMENT REPORTFIRST CHOICE FOR ADVANCED APPLICATIONS ANNUAL REPORT 2019/20AT SATS ANNUAL REPORT 2019 /20 GROUP MANAGEMENT REPORT FIRST CHOICE FOR ADVANCED APPLICATIONS 9 2.1.Overall development of the Group ATS successfully manages challenging environment In the financial year 2019/20 ATS held its ground well in a challenging market environment, which was heavily influenced by the trade dispute of the world’s two largest economies, the USA and China, and the related decline in global growth, as well as uncertainties regarding the United Kingdom’s withdrawal from the European Union. In the last quarter, the COVID-19 pandemic and the related temporary closure of plants in China and India led to additional negative effects. As a result, the Group’s revenue, at € 1,000.6 million, did not reach the level of € 1,028.0 million generated in the previous financial year (deviation € 27.4 million or -2.7%). Sales volume increases for IC substrates and in the Medical Healthcare segment had a positive impact. The Automotive segment maintained the level of the previous year despite challenging market conditions. The weaker development was primarily attributable to the change in product mix for mobile devices and to the continued decline in demand in the Industrial segment. In addition, the Automotive and Industrial were confronted with increased price pressure. 2.2.Earnings development in the Group Revenue nearly at the level of the previous year Revenue decreased by -2.7% year-on-year and amounted to € 1,000.6 million. As the US dollar was stronger during the past financial year, foreign exchange effects had a positive influence of € 31.8 million or 3.1% on the development of revenue. 84.3% of revenue (previous year: 81.5%) was invoiced in foreign currencies (primarily US dollars). During the year, revenue developed in line with the seasonal cycle. In the second and third quarters, revenue was significantly higher than in the first and fourth quarters. The effects of recognising revenue over time, which is required for a number of customers in accordance with IFRS 15, led to a decrease in reported revenue of € 3.1 million or 0.3% (previous year: increase of € 22.5 million or 2.3%). For further information please refer to the notes to the consolidated financial statements. The regional revenue structure based on customers’ headquarters shows a share of 68.3% for America compared with 66.4% in the previous year. The share of products manufactured in Asia rose slightly from 85.0% to 86.5%. 814.9 991.8 1,028.0 1,000.6 16.1 22.8 24.3 19.4 2016/17 2017/18 2018/19 2019/20 Revenue EBITDA margin Development of revenue and EBITDA margin € in millions/in % 16.5 141.1 77.9 26.5 54.8683.8 Austria Germany Other European countries China Other Asian countries Americas Revenue broken down by region, based on customers' headquarters € in millions 2. ECONOMIC REPORT
  • 92.
    88 GROUP MANAGEMENT REPORTANNUALREPORT 2019/20AT S FIRST CHOICE FOR ADVANCED APPLICATIONS ATS ANNUAL REPORT 2019/20 GROUP MANAGEMENT REPORT FIRST CHOICE FOR ADVANCED APPLICATIONS 10 share of the Mobile Devices Substrates (MS) segment in external revenue rose to 68.5% (previous year: 66.5%), the share of the Automotive, Industrial, Medical (AIM) segment declined to 31.5% (previous year: 33.0%). Further information on the development of the segments is provided in Section 2.3 “Earnings development in the segments”. EBITDA declines to € 195 million , EBITDA margin 19.4% EBITDA, at € 194.5 million, was clearly below the prior-year value of € 250.1 million. The current earnings figures are primarily attributable to the changed product mix in the Mobile Devices segment and to the market environment, which was subject to uncertainties and the associated decline in demand. This resulted in temporary underutilisation of the production capacities and a lower operating performance, which was exacerbated in the fourth quarter in particular due to the impact of the COVID-19 pandemic. Furthermore, substantial investments in the future for the strategic expansion of business led to higher expenses. The result was supported by positive currency effects, which result predominantly from positive measurement effects due to the stronger US dollar and the translation of foreign subsidiaries to the reporting currency. The overall positive impact of the exchange rate totalled € 32.1 million. The EBITDA margin declined by -4.9 percentage points from 24.3% in the previous year to 19.4%. 68.5 31.5 MS AIM 68.5 Revenue from external customers by segments in % 130.9 226.0 250.1 194.5 2016/17 2017/18 2018/19 2019/20 Development of EBITDA € in millions Result key data € in millions (unless otherwise stated) 2019/20 2018/19 Change in % Revenue 1,000.6 1,028.0 (2.7%) Operating result before interest, tax, depreciation and amortisation (EBITDA) 194.5 250.1 (22.2%) EBITDA margin (%) 19.4% 24.3% Operating result (EBIT) 47.4 117.2 (59.6%) EBIT margin (%) 4.7% 11.4% Profit for the year 21.5 89.0 (75.9%) Earnings per share (€) 0.34 2.08 (83.7%) Additions to fixed assets 254.3 108.8 100% Average number of staff (incl. leased personnel) 10,239 9,811 4.4%
  • 93.
    89 GROUP MANAGEMENT REPORTFIRST CHOICE FOR ADVANCED APPLICATIONS ANNUAL REPORT 2019/20AT SATS ANNUAL REPORT 2019/20 GROUP MANAGEMENT REPORT FIRST CHOICE FOR ADVANCED APPLICATIONS 11 Increase in expense items The above-mentioned effects also had an impact on the individual cost areas. The increase in production costs of € 36.8 million to € 897.7 million results primarily from higher maintenance costs, research and development costs, and depreciation and amortisation. This development was intensified by negative currency effects. Administrative and distribution costs exceeded the prior-year figures by € 1.1 million or 1.7%. Other operating income declined from € 17.4 million to € 12.9 million. This was mainly due to a decrease in the exchange rate result of € 2.8 million in the financial year 2019/20, which resulted primarily from the measurement of receivables and liabilities denominated in the stronger US dollar. Depreciation of property, plant and equipment and amortisa- tion of intangible assets of € 146.2 million or 15.4% of non- current assets (previous year: € 132.9 million or 15.9% of noncurrent assets) reflect the high technical standard and the intensity of investment of ATS. The increase of € 13.3 million compared with the previous year was accounted for by € 8.1 million from the Mobile Devices Substrates segment (MS), and here predominantly by higher depreciation at the plant in Chongqing. The share of the Automotive, Industrial, Medical segment (AIM) rose by € 4.7 million. The operating result (EBIT) dropped by € 69.8 million or -59.6% to € 47.4 million (previous year: € 117.2 million) due to the above-mentioned effects. The EBIT margin declined by -6.7 percentage points to 4.7% (previous year: 11.4%). Finance costs – net Finance costs – net fell from € -2.0 million to € -6.5 million. Interest expense on bank borrowings and bonds amounted to € 11.4 million (previous year: € 12.2 million). Interest on social capital remained at the prior-year level of € 1.1 million. The measurement of hedging instruments resulted in a loss of € 1.5 million (previous year: loss of € 0.1 million). The hedging instruments swap variable for fixed interest payments which do not meet the criteria of hedge accounting since the term and the amount do not match the primary secured financial liabilities. Capitalised interest on borrowings related to the acquisition of qualified assets increased by € 0.2 million to € 0.4 million (previous year: € 0.2 million). Due to the higher volume of time deposits, an increase in the return on financial investments of € 1.8 million to € 6.7 million (previous year: € 4.9 million) was achieved although the environment for investments is currently unfavourable. Positive exchange rate differences of € 3.8 million were recognised as income in finance costs – net in the financial year 2019/20 (previous year: income of € 9.2 million). The exchange rate differences resulted predominantly from the measurement of liquid foreign currency funds and debts. 6.6 90.3 117.2 47.4 2016/17 2017/18 2018/19 2019/20 Development of EBIT € in millions
  • 94.
    90 GROUP MANAGEMENT REPORTANNUALREPORT 2019/20AT S FIRST CHOICE FOR ADVANCED APPLICATIONS ATS ANNUAL REPORT 2019/20 GROUP MANAGEMENT REPORT FIRST CHOICE FOR ADVANCED APPLICATIONS 12 Finance costs – net are influenced by currency effects because investments and loans from credit institutions are in part denominated in foreign currencies. The main intragroup loans are long-term in nature and their repayment is neither scheduled nor probable in the foreseeable future. These loans are therefore recorded directly in equity through the statement of comprehensive income. Profit for the year declines Profit for the year declined from € 89.0 million in the previous year by € 67.6 million to € 21.5 million. The Group’s tax expense amounts to € 19.5 million (previous year: € 26.2 million). Current income taxes declined to € 12.0 million (previous year: € 13.6 million). Deferred tax expenses dropped to € 7.5 million (previous year: € 12.5 million). The main reasons for the reduction were reversals of deferred tax liabilities due to tax- free distributions within China and lower depreciation and amortisation at ATS China than in the previous year, which led to lower deferred tax assets at the same time. ATS China reported the favourable tax status as a “high-tech company” in the calendar year 2019. This tax status commenced on 1 January 2017, is valid for three years and is dependent on achieving certain criteria each year. Earnings per share decreased by € 1.74 from € 2.08 to € 0.34, with the number of shares outstanding remaining unchanged. In the calculation of earnings per share, interest on hybrid capital of € 8.3 million (previous year: € 8.3 million) was deducted from the profit for the year. 2.3.Earnings development in the segments Mobile Devices Substrates segment The Mobile Devices Substrates segment generally continued its positive development in the financial year 2019/20. Dampening effects of a change in product mix for mobile devices and a decline in global growth due to the trade dispute between the USA and China as well as the impact of the COVID-19 pandemic were only in part offset by sales volume increases in the area of IC substrates. Positive currency effects had an improving effect on earnings. The increasing performance level of mobile devices would not be possible without HDI (high density interconnection) printed circuit boards and mSAP (modified semi-additive process) (0.59) 1.38 2.08 0.34 2016/17 2017/18 2018/19 2019/20 Earnings per share in € Mobile Devices Substrates segment – overview € in millions (unless otherwise stated) 2019/20 2018/19 Change in % Segment revenue 778.5 776.0 0.3% Revenue from external customers 685.9 683.9 0.3% Operating result before depreciation and amortisation (EBITDA) 158.6 193.5 (18.1%) EBITDA margin (%) 20.4% 24.9% Operating result (EBIT) 37.7 80.8 (53.3%) EBIT margin (%) 4.8% 10.4% Additions to fixed assets 216.0 69.6 100% Average number of staff (incl. leased personnel) 7,260 6,860 5.8%
  • 95.
    91 GROUP MANAGEMENT REPORTFIRST CHOICE FOR ADVANCED APPLICATIONS ANNUAL REPORT 2019/20AT SATS ANNUAL REPORT 2019/20 GROUP MANAGEMENT REPORT FIRST CHOICE FOR ADVANCED APPLICATIONS 13 printed circuit boards. ATS is one of the world’s leading HDI technology suppliers and has achieved a leading position in mSAP technology. With a revenue share of 68.5% (previous year: 66.5%), the Mobile Devices Substrates segment is still the largest segment of the ATS Group. Revenue, at € 778.5 million, was up € 2.5 million or 0.3% on the prior-year figure of € 776.0 million. Revenue was influenced by the positive exchange rate development of the US dollar, meaning that overall revenue growth was € 30.4 million higher as a result. In terms of geography, a further substantial increase in revenue with American customers was recorded. The segment’s EBITDA amounted to € 158.6 million, down € 35.0 million or -18.1% on the prior-year value of € 193.5 million. The decrease in EBITDA was primarily attributable to a less favourable product mix, the economic downturn and the related temporary underutilisation. The EBITDA margin of the Mobile Devices Substrates segment, at 20.4%, was 4.6 percentage points lower than in the previous year (24.9%). The segment’s depreciation and amortisation increased by € 8.1 million or 7.2% from € 112.7 million to € 120.9 million. The increase was primarily attributable to higher depreciation and amortisation at the Chongqing site. The operating result (EBIT) declined by € 43.1 million to € 37.7 million (previous year: € 80.8 million). The EBIT margin was down 5.6 percentage points to 4.8% (previous year: 10.4%) due to the decrease in EBIT. Additions to fixed assets rose by € 146.4 million or 210.3% to € 216.0 million (previous year: € 69.6 million). Apart from additions of € 177.3 million for ongoing expansion, replacement and technology upgrades at the Chongqing site, fixed assets at the Shanghai plant increased by € 38.4 million. Automotive, Industrial, Medical segment: at a stable level With a decline in revenue of € 14.8 million to € 350.4 million (previous year: € 365.2 million) the level of the previous year could not be fully maintained in the Automotive, Industrial, Medical segment. Strong demand was recorded above all in the Medical Healthcare segment. The Automotive and Industrial segments were confronted with a difficult environment, leading 573.0 738.9 776.0 778.5 12,0 24,2 24,9 20,4 2016/17 2017/18 2018/19 2019/20 Revenue EBITDA margin Mobile Devices Substrates – Development of revenue, EBITDA margin € in millions/in % Automotive, Industrial, Medical segment – overview € in millions (unless otherwise stated) 2019/20 2018/19 Change in % Segment revenue 350.4 365.2 (4.0%) Revenue from external customers 314.7 338.9 (7.1%) Operating result before depreciation and amortisation (EBITDA) 28.9 52.6 (45.1%) EBITDA margin (%) 8.2% 14.4% Operating result (EBIT) 5.6 34.1 (83.4%) EBIT margin (%) 1.6% 9.3% Additions to fixed assets 33.2 36.1 (7.9%) Average number of staff (incl. leased personnel) 2,764 2,771 (0.2%)
  • 96.
    92 GROUP MANAGEMENT REPORTANNUALREPORT 2019/20AT S FIRST CHOICE FOR ADVANCED APPLICATIONS ATS ANNUAL REPORT 2019/20 GROUP MANAGEMENT REPORT FIRST CHOICE FOR ADVANCED APPLICATIONS 14 to higher price pressure in both segments and also to lower demand in the Industrial segment. Regarding the development of the Leoben, Fehring, Ansan and Nanjangud sites, which are assigned to the Automotive, Industrial, Medical segment, please refer to Section 3.1 “Plants and branch offices” of the Management Report. EBITDA declined by € 23.7 million or -45.1% to € 28.9 million (previous year: € 52.6 million). This reduction results from uncertainties in the automotive market and lower demand in the industrial sector, and was exacerbated by the impact of the COVID-19 pandemic in the fourth quarter, which led to temporary underutilisation of the production capacities and a lower operating performance. The EBITDA margin decreased by 6.2 percentage points to 8.2% (previous year: 14.4%). The operating result (EBIT) fell by € 28.4 million or -83.4% to € 5.6 million (previous year: € 34.1 million). The EBIT margin of the Automotive, Industrial, Medical segment, at 1.6%, was below the prior-year value of 9.3% due to the above-mentioned effects. Additions to fixed assets declined by € 2.9 million to € 33.2 million (previous year: € 36.1 million). The additions were related to ongoing expansion, replacement and technology upgrade investments, in particular at the locations in Austria and India. Others segment The result of the general holding activities included in the Others segment was higher than in the previous year. The embedding technology, which was presented in this segment in the previous year, has now been split up between the Mobile Devices Substrates and Automotive, Industrial, Medical segments. 351.5 364.9 365.2 350.4 14,6 12,8 14,4 8,2 2016/17 2017/18 2018/19 2019/20 Revenue EBITDA margin Automotive, Industrial, Medical–Development revenue, EBITDA margin € in millions/in % Others segment – overview € in millions (unless otherwise stated) 2019/20 2018/19 Change in % Segment revenue – 5.3 n.a. Revenue from external customers – 5.3 n.a. Operating result before depreciation and amortisation (EBITDA) 7.1 4.0 78.6% EBITDA margin (%) – 75.3% Operating result (EBIT) 4.1 2.4 71.3% EBIT margin (%) – 45.0% Additions to fixed assets 5.1 3.1 64.6% Average number of staff (incl. leased personnel) 214 181 18.4%
  • 97.
    93 GROUP MANAGEMENT REPORTFIRST CHOICE FOR ADVANCED APPLICATIONS ANNUAL REPORT 2019/20AT S ATS ANNUAL REPORT 2019/20 GROUP MANAGEMENT REPORT FIRST CHOICE FOR ADVANCED APPLICATIONS 15 2.4.Assets and financial position 2.4.1. ASSETS Increase in non-current assets Total assets increased by 3.9% to € 1,853.5 million in the financial year 2019/20. Non-current assets increased by € 97.7 million to € 996.0 million. While property, plant and equipment rose by € 125.8 million to € 903.5 million, intangible assets declined by € 15.0 million to € 45.1 million. In property, plant and equipment, additions to assets and technology upgrades of € 247.9 million were offset by depreciation totalling € 125.9 million. Property, plant and equipment as reported in the statement of financial position also includes right-of-use assets of € 25.0 million as a result of the first-time adoption of IFRS 16. The net change in non-current assets amounted to € 110.7 million or 13.2% to € 948.6 million (previous year: € 837.9 million). Current assets declined by € 28.3 million to € 857.5 million. Cash and cash equivalents recorded a significant increase to € 418.0 million (previous year: € 326.8 million). Financial assets were reduced by € 103.5 million to € 136.2 million. Overall, ATS thus has cash and current financial assets totalling € 554.2 million (previous year: € 566.6 million). The increase in inventories of € 23.9 million to € 108.4 million results primarily from increasing raw material inventory levels in China as a preparation measure for COVID-19. Trade receivables, other receivables and contract assets decreased by € 36.6 million to € 192.4 million, which is primarily due to additional factoring activities. Trade payables rose by € 37.1 million or 28.1% from € 131.9 million to € 169.1 million, including an increase in liabilities from investments of € 31.7 million to € 62.9 million (previous year: € 31.2 million). Significant increase in net gearing Equity decreased by € 43.2 million or -5.4% from € 803.5 million to € 760.3 million. The positive profit for the year increased equity by € 21.5 million, while negative effects of € 30.3 million are due to currency differences from the translation of net asset positions of subsidiaries and from the translation of long-term loans to subsidiaries. Actuarial losses of € 1.1 million (previous year: loss of € 5.8 million) resulting from the parameters used for the calculation of personnel expenses and the interest expense for the hybrid bond of € 8.3 million also reduced equity. The dividend led to a reduction in equity of € 23.3 million. Net working capital € in millions (unless otherwise stated) 31 Mar 2020 31 Mar 2019 Change in % Inventories 108.4 84.5 28.3% Trade receivables and contract assets 134.5 180.4 (25.4%) Trade payables (169.1) (131.9) (28.1%) Liabilities from investments 62.9 31.2 100% Working capital trade 136.7 164.1 (16.7%) Other current assets, payables, provisions 7.7 (3.6) 100% Net working capital 144.4 160.5 (10.0%) Net working capital in % of total revenue 14.4% 15.6% Days outstanding (in days): Inventories 44 36 22.2% Receivables 49 64 (23.4%) Payables 66 66 –
  • 98.
    94 GROUP MANAGEMENT REPORTANNUALREPORT 2019/20AT S FIRST CHOICE FOR ADVANCED APPLICATIONS ATS ANNUAL REPORT 2019/20 GROUP MANAGEMENT REPORT FIRST CHOICE FOR ADVANCED APPLICATIONS 16 Non-current financial liabilities rose by € 16.8 million or 2.5% to € 695.8 million. The initial application of IFRS 16 led to an increase of € 21.6 million. Furthermore, another promissory note loan was concluded in the past financial year. The cash inflow resulting from the promissory note loan transaction was in part used to optimise and repay financial liabilities carrying higher interest rates. The remaining cash was invested for the short term and is consequently recognised under cash and cash equivalents or under financial assets. Current financial liabilities increased from € 38.0 million to € 105.3 million. Net debt rose by € 96.4 million or 64.2% to € 246.7 million (previous year: € 150.3 million), which resulted primarily from the increase in financial liabilities. Net gearing rose to 32.5% thus exceeding the prior-year level of 18.7%. 2.4.2. FINANCING The focus of the financial year 2019/20 was on financing the capital requirements of the coming years early in order to benefit from the currently favourable financing environment in the long term. To this end, a credit line of an aggregate volume of € 300 million as part of an OeKB equity financing programme and a promissory note loan of an aggregate volume of € 80 million were concluded very successfully. In addition to that, several smaller financing transactions were carried out and the financing structure was optimised further. 70.5 29.4 18.7 32.5 2016/17 2017/18 2018/19 2019/20 Net gearing in % Net debt € in millions (unless otherwise stated) 31 Mar 2020 31 Mar 2019 Change in % Financial liabilities, current 105.3 38.0 100% Financial liabilities, non-current 695.8 679.1 2.5% Gross debt 801.1 717.1 11.7% Cash and cash equivalents (418.0) (326.8) (27.9%) Financial assets (136.4) (239.9) 43.1% Net debt 246.7 150.3 64.2% Operating result before interest, tax, depreciation and amortisation (EBITDA) 194.5 250.1 (22.2%) Net debt/EBITDA ratio 1.3 0.6 Equity 760.3 803.5 (5.4%) Total consolidated statement of financial position 1,853.5 1,784.1 3.9% Equity ratio (%) 41.0% 45.0% Net gearing (net debt/equity) (%) 32.5% 18.7%
  • 99.
    95 GROUP MANAGEMENT REPORTFIRST CHOICE FOR ADVANCED APPLICATIONS ANNUAL REPORT 2019/20AT SATS ANNUAL REPORT 2019/20 GROUP MANAGEMENT REPORT FIRST CHOICE FOR ADVANCED APPLICATIONS 17 Financing is based on a four-pillar strategy The financing of ATS is based on a four-pillar strategy, which aims to minimise dependence on individual financing instruments. Based on the prevailing financial market conditions, individual areas can be expedited more strongly or, as the case may be, not used at times. The first pillar is based on long-term, fixed-interest-bearing retail bonds. Their advantage lies in their high predictability and security for the company as they carry fixed interest rates and are non-redeemable. However, their higher placement and financing costs are a disadvantage. No standard retail bond is issued at present. The importance of promissory note loans as a key financing pillar did not change in the financial year 2019/20 The advantages of promissory note loans are their high level of predictability and their low placement costs. Due to these advantages, ATS intends to also promote this form of financing in the future. At 31 March 2020, promissory note loans totalling € 596.4 million (previous year: € 598.5 million) were placed with several national and international investors. The remaining terms range between 7 months and about 9 years. Bank loans are used as the third pillar. As of 31 March 2020, loans totalling € 179.8 million had been taken out with national and international banks (previous year: € 118.5 million). They predominantly carry fixed interest rates and have maturities between 1 and 7 years. The fourth pillar consists of credit lines, which serve to cover liquidity fluctuations and as a financing reserve. At the reporting date, ATS had unused credit lines of € 490.4 million (previous year: € 187.3 million) in the form of contracted loan commitments made by banks. At 31 March 2020, ATS had only used 61.7% (previous year: 79.7%) of its contracted financing potential and still possesses sufficient financial reserves in addition to cash and cash equivalents. One of the most important tasks of the ATS treasury function is to ensure sufficient liquidity reserves. Treasury also monitors the covenants defined in the credit agreements to ensure that these covenants are met. ATS pursues the goal of standardising credit agreements in order to treat all lenders equally. Low repayment period and high equity ratio The theoretical repayment period for debts, defined as net debt/EBITDA, of 1.3 years was significantly lower than the maximum of 3.0 years defined by ATS. It increased in the past financial year (previous year: 0.6 years). 2.9 0.9 0.6 1.3 2016/17 2017/18 2018/19 2019/20 Net debt/EBITDA Instruments € in millions 31 Mar 2020 in % 31 Mar 2019 in % Promissory note loans 596.4 47.1% 598.5 66.2% Bank borrowings 179.8 14.2% 118.5 13.1% Gross debt 776.2 61.3% 717.0 79.3% Credit lines 490.4 38.7% 187.3 20.7% Committed credit lines 1,266.5 100.0% 904.4 100.0%
  • 100.
    96 GROUP MANAGEMENT REPORTANNUALREPORT 2019/20AT S FIRST CHOICE FOR ADVANCED APPLICATIONS ATS ANNUAL REPORT 2019/20 GROUP MANAGEMENT REPORT FIRST CHOICE FOR ADVANCED APPLICATIONS 18 The equity ratio decreased from 45.0% in the previous year to 41.0%; however, it still exceeded the target value of 40.0%. For further information regarding capital risk management, please refer to Note 19 “Additional disclosures on financial instruments” – subsection Capital Risk Management – in the notes to the consolidated financial statements. ATS pursues a financing structure that is as balanced as possible, with an average duration. At the reporting date, the duration was 3.2 years and thus slightly less than in the previous year (3.7 years). The repayment structure shows a high amount in the year 2023/24 due to the repayment of parts of the promissory note loan and bank loans of € 338.7 million. ATS strives to finance capital requirements early and has liquidity reserves of € 1,044.8 million at 31 March 2020 (previous year: € 754.1 million), which consist of financial resources and unused credit facilities. Effective interest and currency management Minimising interest rate risk by predominantly using fixed interest rates was defined as another treasury objective. 68.0% (previous year: 76.9%) of financing is conducted at or was swapped to fixed interest rates and only 32.0% (previous year: 23.1%) is based on variable interest rates. Strategies for hedging interest rates are defined quarterly based on interest rate expectations and adapted as necessary. Compared with the previous year, the share of fixed interest rates declined slightly. Overall, ATS is well protected against a possible turnaround or an increase in interest rates in the euro area. ATS also intends to invest available liquid funds profitably but risk-sensitively. At 31 March 2020, ATS had financial resources totalling € 554.2 million (previous year: € 566.6 million). The aim is to achieve the highest possible yields in an environment that is currently very challenging from an investor perspective and to avoid negative interest by optimising the terms of investment and early conversion of liquid funds into currencies with higher interest rates and which are also continually required by ATS. Early conversion into foreign currencies also serves as a natural currency hedge and a reduction of the exposure to foreign currencies. The objective of ATS is to keep the US dollar net risk position at a minimum. At 31 March 2020, assets denominated in US dollar (trade receivables, financial assets and cash denominated in US dollar) amounting to € 243.1 million (previous year: € 270.5 million) were offset by liabilities denominated in US dollar (trade payables and financial liabilities denominated in US dollar) amounting to € 58.3 million (previous year: € 43.3 million). The resulting net risk position – at 31 March 2020 this was an active balance of € 184.8 million (previous year: € 227.2 million) – thus amounted to 10.0% (previous year: 12.7%) of the Group’s total assets and liabilities. 141.5 87.2 338.7 45.0 62.8 102.0 24/2524/2523/2422/2321/2220/21 Redemption € in millions Treasury key data Covenant1) Target2) 31 Mar 2020 31 Mar 2019 Net debt/EBITDA ratio 4,0 3,0 1.3 0.6 Equity ratio 35 % 40 % 41.0% 45.0% 1) Covenants are limits included in old credit agreements which the actual figures should not exceed (Net debt/EBITDA) or undercut (equity ratio). 2) Target values are limits defined by ATS which the actual figures, under normal circumstances, should not exceed (Net debt/EBITDA) or undercut (equity ratio).
  • 101.
    97 GROUP MANAGEMENT REPORTFIRST CHOICE FOR ADVANCED APPLICATIONS ANNUAL REPORT 2019/20AT SATS ANNUAL REPORT 2019/20 GROUP MANAGEMENT REPORT FIRST CHOICE FOR ADVANCED APPLICATIONS 19 In addition to this natural hedging and the above-mentioned instruments for interest rate hedging, ATS occasionally hedges foreign currency transaction risks in the short term (up to one year). Currency translation risks resulting from the conversion of subsidiaries with different local currencies are not hedged. Securing the financing network The final treasury objective consists of optimised relationship management with financing partners. ATS considers this to be the selection of banks for national and international cooperation as well as setting up and maintaining the communication necessary for both sides. The aim is to create a high level of transparency regarding the opportunities and risks of ATS in order to strengthen a long-term partnership with the financing institutions which is successful for both sides. The annual and quarterly reports serve as the basis for this. In addition, meetings with our financing bank partners in which the opportunities for cooperation are discussed take place at least once a year. 2.4.3. CASH FLOW Earnings situation boosts liquidity Cash flow from operating activities before changes in working capital dropped from € 206.0 million to € 165.4 million. This decrease is primarily attributable to the decline in the operating result from € 117.2 million to € 47.4 million. Interest payments declined by € 1.6 million to € 12.0 million (previous year: € 13.6 million), primarily due to better terms and conditions in the promissory note loans. The interest received reflects the currently very difficult market environment for investments in euros, but nevertheless increased by € 1.8 million to € 6.7 million (previous year: € 4.9 million) due to the higher investment volume. In contrast, income taxes paid fell by € 15.3 million to € 13.5 million (previous year: € 28.8 million). Cash flow from operating activities improved to € 185.1 million (previous year: € 170.5 million). The increase in trade payables and other liabilities of € 5.7 million and the increase in cash flow from trade and other receivables and contract assets of € 38.2 million were offset by changes in inventories of € -25.5 million. Capital expenditures for property, plant and equipment and for intangible assets of € 218.6 million were substantially higher than in the previous year (€ 100.9 million). The main outflows resulted from expansion, replacement and technology upgrades in Chongqing, Shanghai and Austria. Free cash flow from operating activities, i.e. cash flow from operating activities less net investments in property, plant and equipment and for intangible assets amounted to € -33.4 million in the financial year 2019/20 (previous year: € 69.7 million). ATS thus managed to fund the high level of investment activities independently. While the outflow for the acquisition of property, plant and equipment of € 100.9 million in the previous year rose to € 218.6 million in the financial year 2019/20, a net inflow to financial assets (due to the reduction of remaining terms) of € 101.9 million was recorded (previous year: net outflow of € 175.7 million). As a result, cash flow from investing activities, at € -116.6 million, was below the prior-year level of € -276.6 million. Cash flow from financing activities amounted to € 17.9 million, down € -129.3 million on the prior-year value of € 147.2 million. Carrying amount of financial liabilities by maturity € in millions 31 Mar 2020 in % 31 Mar 2019 in % Remaining maturity Less than 1 year 105.3 13.1 38.0 5.3% Between 1 and 5 years 554.6 69.2 532.6 74.3% More than 5 years 141.2 17.6 146.5 20.4% Total financial liabilities 801.1 100.0 717.0 100.0%
  • 102.
    98 GROUP MANAGEMENT REPORTANNUALREPORT 2019/20AT S FIRST CHOICE FOR ADVANCED APPLICATIONS ATS ANNUAL REPORT 2019/20 GROUP MANAGEMENT REPORT FIRST CHOICE FOR ADVANCED APPLICATIONS 20 This was primarily attributable to the cash inflow from borrowings of € 77.9 million and the repayment of financial liabilities of € -30.1 million, the dividend payment of € -23.3 million and the hybrid coupon payment of € -8.3 million. Free cash flow, i.e. cash flow from operating activities plus cash flow from investing activities, amounted to € 68.5 million, up € 174.5 million on the prior-year value of € -106.0 million. € 277.6 million of the year-on-year change resulted from the investment and returns on the investment of cash and cash equivalents, which were offset by an increase in investment activity of € 117.7 million and lower cash flow from operating activities. Substantial liquidity available for repaying existing financing and further investments Despite very high levels of investment, cash and cash equivalents increased from € 326.8 million to € 418.0 million due to a stable, high level of cash flow from operating activities and the above-mentioned financing and investment measures. Moreover, ATS has current financial assets of € 136.2 million (previous year: € 239.8 million). Overall, ATS thus has cash and current financial assets totalling € 554.2 million (previous year: € 566.6 million). This amount, which is currently very high, serves to secure the financing of the future investment programme and short-term repayments. 2.4.4. PERFORMANCE INDICATORS Indicators demonstrate strong operating performance In addition to revenue and EBITDA, ATS uses the indicators ROCE and IRR for strategic corporate management. They reflect the operating performance vis-à-vis investors and customers. ATS uses return on capital employed (ROCE) to measure its operating performance from the point of view of investors, using the ratio of the result adjusted for finance costs – net and average capital employed. This ratio serves to derive the extent to which ATS fulfils its investors’ interest requirements. Average capital costs are derived from the minimum return investors expect for providing equity or borrowings. The weighted average cost of capital (WACC) for the printed circuit board industry was around 8.7% before the COVID-19 pandemic. With ROCE amounting to 2.8%, ATS was below this level in the reporting period. ROCE deteriorated year-on-year due the decline in EBIT, which was offset by higher average capital employed of € 980.4 million (previous year: € 937.2 million). The second performance indicator is related to the ability to implement innovations in a timely manner and in response to the market. ATS measures this ability using the innovation revenue rate (IRR), which expresses the revenue share of products that feature new and innovative technologies and which have been launched on the market in the last three years. For the financial year 2019/20 the IRR is 30.8% compared with 35.3% in the previous year. ATS strives for a medium-term Cash flow statement (short version) € in millions 2019/20 2018/19 Change in % Cash flow from operating activities before changes in working capital 165.4 206.0 (19.7%) Cash flow from operating activities 185.1 170.5 8.6% Cash flow from investing activities (116.6) (276.6) 57.8% Operating free cash flow (33.4) 69.7 (100%) Free cash flow 68.5 (106.1) 100% Cash flow from financing activities 17.9 147.2 (87.8%) Change in cash and cash equivalents 86.4 41.2 100% Currency effects on cash and cash equivalents 4.7 15.0 (68.6%) Cash and cash equivalents at end of the year 418.0 326.8 27.9%
  • 103.
    99 GROUP MANAGEMENT REPORTFIRST CHOICE FOR ADVANCED APPLICATIONS ANNUAL REPORT 2019/20AT SATS ANNUAL REPORT 2019/20 GROUP MANAGEMENT REPORT FIRST CHOICE FOR ADVANCED APPLICATIONS 21 average IRR of at least 20%. This target was significantly exceeded in the financial year 2019/20. 2.5.Significant events after the reporting period With regard to significant events after the balance sheet date, reference is made to the notes to the consolidated financial statements (Note 26 Significant events after the balance sheet date). (0.6) 7.7 9.7 2.8 2016/17 2017/18 2018/19 2019/20 ROCE in % Return on capital employed (ROCE) € in millions 2019/20 2018/19 Change in % Operating result (EBIT) 47.4 117.2 (59.6%) Income taxes 1) (19.5) (26.2) 25.6% Operating result after tax (NOPAT) 1) 27.9 91.0 (69.3%) Equity – average 781.9 757.4 3.2% Net debt – average 198.5 179.8 10.4% Capital employed – average 980.4 937.2 4.6% ROCE 1) 2.8% 9.7% 1) 2018/19 adjusted taking into account IAS 12 revised Innovation Revenue Rate (IRR) € in millions 2019/20 2018/19 Change in % Main revenue 1,000.4 1,027.8 (2.7%) Main revenue generated by innovative products 308.6 362.5 (14.9%) IRR 30.8% 35.3%
  • 104.
    100 GROUP MANAGEMENT REPORTANNUALREPORT 2019/20AT S FIRST CHOICE FOR ADVANCED APPLICATIONS ATS ANNUAL REPORT 2019 /20 GROUP MANAGEMENT REPORT FIRST CHOICE FOR ADVANCED APPLICATIONS 22 3.1.Plants and branch offices The ATS Group currently operates six production plants, which specialise in different technologies. Leoben and Fehring The Austrian plants primarily supply the European market and increasingly also the American market. In Europe, short lead times, special applications and customer proximity are particularly important. The plant in Leoben continued to pursue the path of niche and prototype production started in recent years. Among other things, the production of the embedding technology is based in Leoben. Several important projects were qualified with renowned customers in the financial year 2019/20 and are about to enter mass production. In addition, investments were made in the expansion of the core line in order to provide capacities for the Chongqing plant on the one hand and to secure the future technologies on the other. The plant in Fehring successfully completed its extension and all customer qualifications of the new production hall. A stronger focus on specific applications and markets helped create synergies with other sites (Leoben and Nanjangud) and improve the product mix. As a result, high-end printed circuit boards (HDI/HF technology) can be manufactured at the Fehring site for the Industrial, Medical and Automotive segments. Shanghai The plant in Shanghai manufactures leading-edge HDI (high density interconnection) printed circuit boards in serial production for the Mobile Devices Substrates segment for customers all over the world. The plant was able to successfully meet the demand for HDI and mSAP printed circuit boards and has established itself as a leading supplier of the latest technology generation. The plant’s broad technological spectrum was very well received by customers and the plant was continuously operating at capacity during the peak season months. Strong demand for HDI printed circuit boards continued at a stable level in 2019/20; these were produced for the Automotive, Industrial, Medical segment. Chongqing At present, two plants for high-end products are operated in Chongqing. The plant for IC substrates (integrated circuit substrates) is currently undergoing full expansion and capacity has increased as planned. The plant operated at capacity throughout the year. As demand for IC substrates is increasing for the application in high-performance computer modules, construction of an additional plant began in the financial year 2019/20, and is scheduled to start production at the end of 2021. High-end mSAP printed circuit boards are manufactured at the plant for mobile applications. The production of printed circuit boards for modules started at the site during the financial year 2019/20. Capacity at the plant is being continuously expanded in order to meet growing customer demand in the high-end segment. Ansan The very positive development of the site in Korea continued in the financial year 2019/20, in particular in the medical technology segment for European and American customers. In December 2019, the expansion of the plant began on the neighbouring premises, which had been acquired in the previous year. Completion is scheduled for the fourth quarter of the financial year 2020/21. Nanjangud The site continued its positive development in terms of the further technical developments regarding market and customer requirements in the financial year 2019/20. Due to the long qualification times for HF and HDI products, this development is not yet reflected in revenue; however, a significant shift in the product mix towards higher-value technologies is already noticeable and will continue to be a strong focus. The temporary closure in mid-March caused by COVID-19 cases in the vicinity of the plant and the region being designated a lockdown area, had no material impact on revenue due to the prestart situation. Hong Kong The Hong Kong-based company ATS Asia Pacific is the holding company for the Mobile Devices Substrates segment – hence, for the Chinese plants and the allocated sales companies – and the headquarters of Group-wide procurement for this segment. Customers’ proximity to the CEMs and to suppliers is a 3. OTHER STATUTORY INFORMATION
  • 105.
    101 GROUP MANAGEMENT REPORTFIRST CHOICE FOR ADVANCED APPLICATIONS ANNUAL REPORT 2019/20AT SATS ANNUAL REPORT 2019 /20 GROUP MANAGEMENT REPORT FIRST CHOICE FOR ADVANCED APPLICATIONS 23 locational advantage which is highly valued by business partners. The sales support companies in America, Germany, Japan and Taiwan continued to ensure good and close contact with customers in the financial year 2019/20. 3.2.Shareholder structure and disclosures on capital (disclosures pursuant to § 243a UGB) Capital share structure and disclosure of shareholder rights As of the reporting date at 31 March 2020, the Company’s ordinary shares amount to € 42,735,000 and are made up of 38,850,000 no-par value shares with a notional value of € 1.10 per share. The voting right at the Annual General Meeting is exercised according to no-par value shares, with each no-par value share equalling one voting right. All shares are bearer shares. Significant direct and indirect shareholdings in the Group parent company AT S Austria Technologie Systemtechnik Aktiengesellschaft, which at the reporting date amount to at least 10%, are presented below: see table below. At the reporting date of 31 March 2020, roughly 64.68% of the shares were in free float. With the exception of the shareholdings stated below, no other shareholder held more than 10% of the voting rights in ATS. No shares with special control rights exist. The exercise of the voting right by employees who hold shares in the Company is not subject to any limitations. No special provisions exist on the appointment and dismissal of members of the Management Board and the Supervisory Board. The contracts of all Management Board members include a “Change of Control” clause. Such a change of control exists in the event that a shareholder of the company has obtained control of the company in accordance with Section 22 of the Austrian Takeover Act (ÜbG) by holding at least 30% of the voting rights (including the voting rights of third parties attributable to the shareholder pursuant to the Austrian Take- over Act), or the company has been merged with a non-Group legal entity, unless the value of the other legal entity amounts to less than 50% of the value of the company according to the agreed exchange ratio. In this case, the Management Board member is entitled to resign for good cause and terminate the Management Board contract at the end of each calendar month within a period of six months after the change of control takes legal effect, subject to a notice period of three months (“special termination right”). If the special termination right is exercised or the Management Board contract is terminated by mutual agreement within six months of the change of control, the Management Board member is entitled to the payment of their remuneration entitlements for the remaining term of this contract, however, for a maximum of three annual gross salaries. Other remuneration components shall not be included in the calculation of the amount of the severance payment and shall be excluded from it. By resolution passed at the Annual General Meeting on 4 July 2019, the Management Board is authorised until 3 July 2024 to increase the Company’s ordinary shares, subject to the approval of the Supervisory Board, by up to € 21,367,500 by way of issuing up to 19,425,000 new, no-par value bearer shares, for contributions in cash or in kind, in one or several tranches, also by way of indirect subscription rights, after having been taken over by one or more credit institutions in accordance with Section 153 (6) of the Austrian Stock Significant direct and indirect shareholdings Shares/in % Shares % capital % voting rights Dörflinger-Privatstiftung: Vienna, Austria 6,902,380 17.77% 17.77% Androsch Privatstiftung: Vienna, Austria 6,819,337 17.55% 17.55%
  • 106.
    102 GROUP MANAGEMENT REPORTANNUALREPORT 2019/20AT S FIRST CHOICE FOR ADVANCED APPLICATIONS ATS ANNUAL REPORT 2019 /20 GROUP MANAGEMENT REPORT FIRST CHOICE FOR ADVANCED APPLICATIONS 24 Corporation Act (AktG). The Management Board is authorised, subject to the approval of the Supervisory Board, to exclude shareholders’ subscription rights and to determine the detailed terms and conditions of issue (in particular the issue amount, subject of the contribution in kind, the content of the share rights, the exclusion of subscription rights, etc.) (approved capital). The Supervisory Board is authorised to adopt amendments to the Articles of Association resulting from the issuance of shares from the approved capital. Furthermore, the Management Board was authorised by the Annual General Meeting until 3 July 2024, subject to the approval of the Supervisory Board, to issue one or several convertible bearer bonds at a total nominal amount of up to € 150,000,000 and to grant to bearers of convertible bonds conversion rights and/or subscription rights for up to 19,425,000 new no-par value bearer shares in the Company in accordance with the convertible bond terms and conditions to be defined by the Management Board. The Management Board was authorised, subject to approval of the Supervisory Board in accordance with the provisions of the Stock Corporation Act, to determine issue and technical characteristics as well as the terms and conditions of the convertible bonds (in particular interest rate, issue amount, term and denomination, dilution protection provisions, conversion period, conversion rights and obligations, conversion ratio and conversion price). Furthermore, the Management Board was authorised to fully or partially exclude shareholders’ subscription rights to the convertible bonds. In addition, the Company’s ordinary shares were conditionally increased by up to € 21,367,500 by way of issuance of up to 19,425,000 new no-par value bearer shares in accordance with Section 159 (2) No. 1 of the Austrian Stock Corporation Act (AktG). This conditional capital increase will only be carried out if the bearers of convertible bonds issued based on the authorisation resolution passed at the Annual General Meeting on 4 July 2019 claim the right to conversion and/or subscription granted to them with regard to the Company’s shares. The Management Board was authorised to determine, subject to approval from the Supervisory Board, the further details of carrying out the conditional capital increase (particularly the issue amount and the content of the share rights). The following definition of amount in accordance with the aforementioned authorisations is to be observed: the sum of (i) the number of shares currently issued or potentially to be issued from conditional capital in accordance with the convertible bond conditions and (ii) the number of shares issued from approved capital shall not exceed the total amount of 19,425,000 (limitation of authorised amount). The Articles of Association were amended in accordance with the resolutions on approved capital and conditional capital and on the convertible bonds in § 4 (Nominal capital). Treasury shares At the 25th Annual General Meeting on 4 July 2019, the Management Board was again authorised to purchase, within a period of 30 months from the adoption of the resolution, treasury shares to an extent of up to 10% of the nominal share capital. Furthermore, the Management Board was authorised, for a period of five years, i.e. up to and including 3 July 2024, subject to approval of the Supervisory Board and without any further resolution by the Annual General Meeting, to sell treasury shares by means other than via the stock exchange or a public offering, in particular to serve employee stock options, convertible bonds or as a consideration for the acquisition of companies or other assets and to use them for any other legal purpose. The company held no treasury shares as of 31 March 2020. There are no off-balance sheet transactions between ATS and its subsidiaries. ATS neither has granted any loans nor has it assumed any liabilities in favour of board members. For further information, reference is made to the notes to the consolidated financial statements (Note 21 “Share capital” as well as Note 15 “Financial liabilities”). The Company’s Corporate Governance Report pursuant to Section 243b of the Austrian Commercial Code is available at http://www.ats.net/company/corporate-governance/reports/.
  • 107.
    103 GROUP MANAGEMENT REPORTFIRST CHOICE FOR ADVANCED APPLICATIONS ANNUAL REPORT 2019/20AT SATS ANNUAL REPORT 2019 /20 GROUP MANAGEMENT REPORT FIRST CHOICE FOR ADVANCED APPLICATIONS 25 3.3.Non-financial statement In accordance with Section 243b (6) UGB (Austrian Commercial Code), the company is exempt from the obligation to prepare a non-financial statement in the Management Report since a separate non-financial report has been drawn up. This non- financial report is included in the Annual Report 2019/20 as a separate chapter.
  • 108.
    104 GROUP MANAGEMENT REPORTANNUALREPORT 2019/20AT S FIRST CHOICE FOR ADVANCED APPLICATIONS ATS ANNUAL REPORT 2019 /20 GROUP MANAGEMENT REPORT FIRST CHOICE FOR ADVANCED APPLICATIONS 26 Structured development of technological opportunities In the past financial year ATS once again focused its research and development activities on exploring opportunities arising from the current transformation towards modularisation in the electronics industry and the resulting change in the value chain in order to gradually live up to the claim “More than ATS”. The ongoing projects in this context can be allocated to four main development programmes: Miniaturisation and functional integration: Not only are electronic devices continuously getting smaller and lighter, they are also increasingly powerful and fulfil more and more functions. The task of ATS is to create the basis for this development. To do so, the company is working on technologies which increase trace density and reduce the thickness of the systems. Another field of research covers technologies enabling the direct integration of electronic components into printed circuit boards and substrates, increasing the packaging density and efficiency of the overall system. Fast signal transmission: As digitalisation progresses, driven by improved data transmission possibilities (5G), the data volume to be processed will increase significantly in the coming years. Electronic systems working at higher frequencies (e.g. communication modules for 5G, radar systems for cars) require new solutions for the interconnect technology. Based on development projects in this area ATS ensures that the products transmit signals fast, precisely and with minimal losses. Performance and performance efficiency: In view of the sustainability endeavours, there is currently a strong trend towards alternative forms of propulsion in mobility, in particular towards electric mobility. At the same time, mechanical solutions are increasingly replaced by energy-saving electronic solutions in the automotive sector. ATS focuses its development activity on systems which enable optimum power supply with the lowest electrical losses in vehicles, can switch and transmit high loads and may even be able to produce energy in the future. Manufacturing of the future: Industrial production processes will change fundamentally in the decades to come. The processes will increasingly be organised using artificial intelligence (AI), and sustainability will also play a key role: the manufacturing of products must involve minimum consumption of natural resources, be highly reliable and enable the reuse the materials employed. ATS is working on new solutions which allow efficient and flexible manufacturing with minimum resource consumption (material, water, energy, etc.). To this end, large data volumes are put to use via digitalisation in order to optimise and improve production processes as well product properties and quality, and new solutions enabling the sparing use of resources in production are developed. Innovation rate still high The innovation revenue rate (IRR) measures the impact of the innovative strength of a company. It describes the share in revenue ATS generates with innovative products launched on the market in the past three years. Generally speaking, the IRR is higher in the years following the successful implementation of new technologies and lower in the development phase of new technologies (i.e. during the phase before their market launch). ATS strives for a mean annual IRR of at least 20%. In the past financial year, the IRR was still relatively high at 30.8% despite numerous technology introductions in the past years (e.g. mSAP and substrates). At the same time, ATS will also be in a very 21.8 40.4 35.3 30.8 2016/17 2017/18 2018/19 2019/20 Innovation Revenue Rate (IRR) in % 4. RESEARCH AND DEVELOPMENT
  • 109.
    105 GROUP MANAGEMENT REPORTFIRST CHOICE FOR ADVANCED APPLICATIONS ANNUAL REPORT 2019/20AT SATS ANNUAL REPORT 2019/20 GROUP MANAGEMENT REPORT FIRST CHOICE FOR ADVANCED APPLICATIONS 27 intensive phase of technology development and implementation in the future. ATS is currently concentrating on new technologies for the production of more powerful and energy-efficient substrates for computer processors. Another focus is on technologies for the production of modules (electronic units for specific tasks connecting several components with each other) and new solutions for the 5G wireless standard. The innovative strength and long-term competitiveness of a company are also reflected in the number and quality of its patents: ATS submitted a total of 61 new patent applications in the financial year 2019/20. At present, ATS has 343 patent families, which result in 326 granted patents. The IP portfolio is further strengthened by externally acquired licenses, in particular in the area of embedding technology. RD expense: 9.5% of revenue The costs of research and development projects totalled € 94.8 million in the financial year 2019/20. This corresponds to a research rate (i.e. ratio to revenue) of 9.5% compared with 7.4% in the previous year. Based on this continuously high research rate, ATS is securing its position as the technology leader for the years to come. Development centres in Leoben and Chongqing ATS ensures efficiency in development among other things by closely collaborating with customers, suppliers and research institutions worldwide. Internally, ATS pursues a two-level innovation process. In a first step, opportunities are identified, ideas are examined for their development potential, novel concepts are developed and reviewed for their general feasibility. This level corresponds to applied research and technology evaluation. Subsequently, it is the task of the local technology development and implementation departments at the ATS sites to continue the experimental development of processes and products and to integrate them into the existing production process. In the past financial year, ATS upgraded the development unit in Chongqing into a development centre. To this end, the set-up of the prototype line, which had already begun, was expanded for new processes. Moreover, a multi-year set-up plan for a high-end prototype line was designed, covering nearly all process steps for the production of high-end substrates and advanced packages. The development centre in Leoben was also further strengthened. Currently, several new technologies are added to the technical development capacities. Some of these devices enable the analysis of production processes that are entirely 227 258 279 326 2016/17 2017/18 2018/19 2019/20 Number of patents granted 7,7% 6,6% 7,4% 9,5% 2016/17 2017/18 2018/19 2019/20 Research rate i. e. ratio to revenue
  • 110.
    106 GROUP MANAGEMENT REPORTANNUALREPORT 2019/20AT S FIRST CHOICE FOR ADVANCED APPLICATIONS ATS ANNUAL REPORT 2019/20 GROUP MANAGEMENT REPORT FIRST CHOICE FOR ADVANCED APPLICATIONS 28 new to the industry, such as physical separation processes or photopatternable dielectric materials. These activities ensure that ATS will continue to convince customers with new concepts in the core development areas as a technology leader in the years to come. Key development projects In the past financial year, RD activities focused on the development of the next substrate and packaging technology. At the locations in Chongqing and Leoben, several technology components are currently in the implementation phase. The main development activities consisted of the conceptual design and specification of the required production machines, which frequently have to be adapted to individual needs in cooperation with the suppliers. Concepts based on which technology components can also be used for the generation after next are already being developed in parallel in this area. Intensive work on projects for the new mobile communication standard 5G continued, with one of the focus areas being the development of system solutions specifically for the second generation of the 5G standard, which uses radio frequencies in the mm-wave-length range (25-30GHz). Here, entirely new printed circuit board and interconnect systems have to be developed to keep losses as low as possible. In doing so, ATS is working with important companies along the value chain and with customers. Developments in power electronics are currently driven by electromobility. ATS is developing innovative new electronic systems in this area that consume very little energy and can work with high currents and high voltages. This is made possible by using the embedding technology, which allows optimal cooling and electric connection of the components, resulting in electrically efficient and highly reliable systems and modules. In the development for this area, a special focus was placed on the analysis of new performance semiconductors and on exploring them in cooperation with international partners. Cooperation with research institutions In the past financial year, the national and international collaboration with research institutions was further intensified. The University of Chongqing (Chongqing, China), East China University of Science and Technology (Shanghai, China), Virginia Tech (Blacksburg, Virginia, USA) and Silicon Austria Labs (Graz, Austria) joined the list of our most important research partners.
  • 111.
    107 GROUP MANAGEMENT REPORTFIRST CHOICE FOR ADVANCED APPLICATIONS ANNUAL REPORT 2019/20AT SATS ANNUAL REPORT 2019 /20 GROUP MANAGEMENT REPORT FIRST CHOICE FOR ADVANCED APPLICATIONS 29 5.1.Opportunities and risk management STRUCTURE AND INSTRUMENTS Opportunities and risk management is a fundamental part of conducting business within the ATS Group. The objective of increasing enterprise value involves not only opportunities but also risks. Since decisions are usually made under uncertainty, it is the task of risk management to identify risks or negative deviations at an early stage and deal with them in a proactive manner. Therefore, ATS operates a Group-wide Risk Management (RM) system in accordance with the Austrian Code of Corporate Governance (ACCG), an Internal Control System (ICS) in accordance with COSO standards, as well as Internal Audit based on the IIA standard. From an organisational perspective, Risk Management, Internal Control System and Internal Audit functions fall within the responsibility of the CFO. The Group Risk Manager reports quarterly to the full Management Board at a Management Board meeting. The Supervisory Board is included within the framework of the Audit Committee meeting, which takes place at least twice a year. The proper functioning of the risk management system is assessed annually by the external 5. OPPORTUNITIES AND RISKS ATS RISK LEVELS AND RISK CONTROLLING RM: Risk Management; ICS: Internal Control System; BU: Business Unit Figure 2: ATS Risk Levels and Risk Controlling _ICS RM management of process risk (risk level 1–2) supported by the internal control system. At Group level, relevant risks (risk level ≥ 3) are managed and reported through the risk management process. _Risk exposure risk level The ATS risk levels are derived from operating cash flow and the equity ratio as an indicator of the risk capacity of the Group. _Risk mitigation clear assignment of responsible ­decision levels based on risk level (see left). SUPERVISORY BOARD MANAGEMENT BOARD BU MANAGEMENT PLANT MANAGEMENT PROCESS MANAGEMENT RISK LEVEL RISK CONTROLLING PROCESS 1 2 3 4 5 6 RM IKS ATS RISK MANAGEMENT PROCESS RISK AND OPPORTUNITY STRATEGY Risk/Opportunity Management Process Risk/Opportunity Management Software RISK/OPPORTUNITY CONTROL CONTROL _Reporting _Monitoring _Control RISK/OPPORTUNITY ANALYSIS Figure 1: ATS Risk Management Process ANALYSIS _Identification _Assessment _Aggregation _Risk strategy defined by the Management Board and process owners. _Risk identification  Group-wide survey with subsequent evaluation. Immediate reporting of significant new risks (≥3). _Risk evaluation consistent Group-wide evaluation of all risks with respect to their monetary impact, probability of occurring, and resulting risk rating of 1 (low) ­to 6 (critical). _Aggregation reporting aggregation and regular reports on all significant risks (risk level ≥3) to the Management Board and Audit Committee by the Risk Manager. _Risk mitigation monitoring in accordance with defined reporting and decision levels (based on risk level, see Figure 2). _Risk management software Group-wide for risks and ICS controls.
  • 112.
    108 GROUP MANAGEMENT REPORTANNUALREPORT 2019/20AT S FIRST CHOICE FOR ADVANCED APPLICATIONS ATS ANNUAL REPORT 2019 /20 GROUP MANAGEMENT REPORT FIRST CHOICE FOR ADVANCED APPLICATIONS 30 auditor in the course of the annual audit of financial statements pursuant to Rule 83 ACCG. The risk management process shown in Figure 1 is conducted at least twice a year. Risk management is conducted based on the risk strategy and risk exposure at the hierarchy level assigned to the relevant level of risk (see Figure 2). RISK MANAGEMENT IN 2019/20 In the financial year 2019/20, risk management focused on the evaluation and selection of a software-based GRC solution alongside the management of risks arising from operating business. The objective of this further development is to strengthen the links between governance, risk and compliance processes and to use synergies. The implementation of this tool will start in the financial year 2020/21. The integration of non-financial risk management into the Group-wide risk management system was another focus in the financial year 2019/20. The goal was to identify and assess risks related to the environment, social matters and responsible management in line with Group-wide risk management. 5.2.Explanation of individual risks The risks, uncertainties and opportunities facing the Group are generally based on worldwide developments in the printed circuit board and substrate market and the Group’s own operating performance. An overview of the ATS risk categories, significant individual risks, risk mitigation measures and the expected trend in the coming year is shown in Figure 3 and explained in further detail below. Significant risks opportunitiesRisk category Risk mitigation opportunity realisationTrend STRATEGY MARKET PROCUREMENT BUSINESS ENVIRONMENT OPERATIONS ORGANISATION FINANCE ▪ Sales price development ▪ Capacity utilisation ▪ Technology development ▪ Investments ▪ Market and segment development ▪ Development of key customers ▪ Sales strategy and implementation ▪ Development of procurement prices ▪ Single-source risk ▪ Confidentiality breach ▪ Catastrophe, fire ▪ Political risk ▪ Pandemic ▪ Quality performance ▪ Intellectual property ▪ Project management ▪ Operating costs ▪ Loss of key personnel ▪ Foreign exchange risk ▪ Financing liquidity ▪ Tax risk ▪ Impairment ▪ Consistent focus on high-end technologies target applications ▪ Customer proximity and early customer contact ▪ Technology development projects technology roadmap ▪ Market analysis, strategy review and adaption ▪ Balanced segment portfolios and diversification of the customer portfolio ▪ New customer acquisition share increases with existing customers ▪ Consistent acquisition of defined target applications ▪ Procurement strategy (negotiation, allocation, technical changes) ▪ Supplier risk assessment multi-sourcing ▪ Increased security level based on the implementation of an information security manage- ment system (ISO 27001) ▪ Internal external audits, emergency practice ▪ Business continuity management ▪ Containment actions (e.g. protective measures, distancing regulations, remote working) ▪ Black Belt programme, continuous quality improvement measures ▪ Continuous expansion and protection of the IP portfolio ▪ Rigorous project management ▪ Cost reduction and efficiency enhancement programmes at all sites ▪ Employee retention, deputy regulation succession planning ▪ Natural FX hedging through long-term CF planning ▪ Long-term planning for financing and liquidity, interest swaps ▪ Continuous monitoring of compliance with tax laws ▪ Project controlling, impairment tests, strategy review and adaptation FX: Foreign Exchange; CF: Cash Flow Figure 3: ATS Risk Categories, Significant Individual Risks, Risk Trends and Risk Mitigation Measures
  • 113.
    109 GROUP MANAGEMENT REPORTFIRST CHOICE FOR ADVANCED APPLICATIONS ANNUAL REPORT 2019/20AT SATS ANNUAL REPORT 2019 /20 GROUP MANAGEMENT REPORT FIRST CHOICE FOR ADVANCED APPLICATIONS 31 STRATEGY Investment risk In order to use growth potential and remain competitive, ATS undertakes substantial investments in new technologies (IC substrates) as well as in the further development and capacity expansion of existing technologies (SLP, MSap, HDI) and will continue to do so in the future. In order to establish the IC substrate business as a strategic cornerstone, ATS invests in a new plant in Chongqing and expands existing capacities at the Leoben plant. The investment is based on the growing demand for IC substrates for the application in high-performance computer modules. Incorrect assessments of technological developments, changes in demand, restrictions through third-party patents, negative price developments, customer-specific technologies, shorter technology cycles or problems in the technical implementation may have severe adverse effects on the intrinsic value of such investments. These effects could relate, in particular, to the substrate business, the production capacity for the mSAP technology in Shanghai and Chongqing, the capacity expansion for high-frequency printed circuit boards in Nanjangud and Fehring and generally all current ATS business activities. If there are any indications of such adverse effects, impairment tests of these investments are performed as required, which may lead to high impairment requirements due to the high investments made. Competition risk The clear focus on the high-tech segment coupled with the highest quality standards and consistent cost controls has so far enabled ATS to successfully withstand the effects of intense competition, overcapacity in the market, and persistent “commodification” with a corresponding margin reduction in the HDI (high-density interconnect) technology segment. This was complemented by the successful transfer of HDI technology from smartphone applications and other mobile devices to further applications, such as those in the automotive industry. The technology upgrade of part of the HDI lines to the mSAP technology ensures the transfer of competitive advantages of HDI to the next technology generation. Delays in switching over to the new technology on the customer side and volatile market developments may pose challenges for ATS and lead to excess supply, overcapacities and underutilisation. The opportunities of the Austrian plants of ATS are based on high flexibility, high quality standards and the ability to react very quickly to changing specifications and technologies. These capabilities are absolutely imperative for prevailing in the competitive environment, especially in the industrial segment, which is subject to diverse technological requirements among a large number of customers. To ensure our competitive edge, ATS constantly pursues new forms of technology and projects in close cooperation with our customers. New technological developments and excess capacity in the market pose great challenges for ATS in the IC substrate segment. The focus on a higher-value product portfolio and the successful realisation of the planned cost reduction are essential for this business segment. The market for IC substrates is strongly influenced by technological changes. The investment in the Chongqing site enables strategic development in this business segment. The development of new technologies serves to mitigate the market risks of IC substrates. However, this technological progress also entails the general risk of new technological developments. Competitor risks arise due to potential quality improvements and technological developments in countries with low production costs. This could lead to a loss of competitiveness at ATS sites, especially in Austria and possibly also at other production sites like those in South Korea and China. In addition, a difficult market environment in the financial year 2020/21 could have an adverse effect on the Group’s results. Stagnating smartphone sales, weak demand in the Automotive and Industrial segments as well as unfavourable market developments in the other core segments could lead to a decline in revenue. In particular, the impact of the COVID-19 pandemic on the global economy cannot be fully projected due to the low visibility. The broad-based positioning of ATS in the Mobile Devices Substrates segment and in the Automotive, Industrial, Medical segment with their different production cycles can partially cushion market risks. Along with controlling risks, crisis-proof applications are pushed based on customer
  • 114.
    110 GROUP MANAGEMENT REPORTANNUALREPORT 2019/20AT S FIRST CHOICE FOR ADVANCED APPLICATIONS ATS ANNUAL REPORT 2019 /20 GROUP MANAGEMENT REPORT FIRST CHOICE FOR ADVANCED APPLICATIONS 32 and application analyses. A positive post-crisis market development could offer increased business opportunities and especially high growth opportunities. MARKET Potential loss of key customers With the help of advanced production technologies and high quality standards, ATS has managed to establish itself as a reliable provider to some of the world’s most renowned players in the electronics industry. Due to the focus on high-end technology, the number of customers is limited to technology leaders. The revenue generated with the five largest customers accounts for 68% of total revenue. Our long-term relationships with these customers also offer excellent opportunities for the future. However, concentration of this kind also poses risks in the event that there is a significant reduction in business volume or profitability from these customers. This is particularly critical in the areas of IC substrates and mSAP. The ongoing improvement of ATS’s competitiveness, the expansion of the customer base and the development of new products were recently successfully continued and support the rapid compensation of potential negative development among individual key customers. PROCUREMENT Procurement prices Price fluctuations in energy and raw materials (gold, copper and laminates) can have both a positive and a negative impact on achievable margins in the short term. Rising raw material prices in the financial year 2019/20 were partially cushioned by the targeted implementation of the procurement strategy and process optimisations. Due to the current uncertainties in the market, coupled with the COVID-19 pandemic, the price development for raw materials cannot be reliably projected for the coming financial year. Suppliers The sourcing strategy of ATS focuses on a wide and clearly diversified base of carefully selected suppliers in order to reduce dependencies on individual suppliers. Long-standing and stable customer-supplier relations are in place with key suppliers with particular expertise and competitive standing. To avoid supply shortages, ATS conducts rigorous supplier risk management, taking account of regional cluster risks, various supply routes, and alternative procurement options. Customer specifications may limit the raw materials used to certain suppliers, which may result in a dependency for ATS. However, with few exceptions – for example in the IC substrates and ECP areas, where the supplier base is smaller – alternative supplier options are usually available in order to respond to supply risks. BUSINESS ENVIRONMENT Location-specific risks The large majority of ATS’s operating activities are based at sites outside of Austria, particularly in China. This means that the Group might be subject to potential legal uncertainties, state intervention, trade restrictions or political unrest. Irrespective of the above, any production site of the Group may furthermore be exposed to disruptive events such as fire, natural disasters, acts of war, shortages of supply or other elementary events. The termination of land use rights, permits or the lease contracts for specific plants might also have a considerable negative impact on the production output of the Group. To minimise the effects of such risks, the Group has instituted business continuity management. ATS also conducts active insurance management by means of weighing the risks and associated costs. It has concluded insurance contracts to the extent customary for a company of this size wherever such contracts were available at costs which are reasonable in relation to the impending risks. The spread of the COVID-19 pandemic is currently influencing the production of ATS. Numerous protective measures have been taken aiming to optimally protect employees from the SARS-CoV-2 virus while at the same time keeping up ongoing operations. In doing so, ATS uses the rich experience gained in China, where the company acquired valuable knowledge in dealing with the exceptional situation. The measures taken in China are also applied to the other locations. Mandatory face masks were introduced on the company premises, remote working regulations massively extended, canteen operations
  • 115.
    111 GROUP MANAGEMENT REPORTFIRST CHOICE FOR ADVANCED APPLICATIONS ANNUAL REPORT 2019/20AT SATS ANNUAL REPORT 2019 /20 GROUP MANAGEMENT REPORT FIRST CHOICE FOR ADVANCED APPLICATIONS 33 limited and business travel stopped. In addition, a designated info point has been set up on the ATS intranet to keep all employees informed and a telephone hotline for all employee questions has been installed. A task force has been set up at the respective locations for the implementation, monitoring and, where necessary, adaptation of these measures. An aggravation of the current conditions, the provision of production materials and personnel, the supply processes and demand may influence the business development in the coming months. The global effects of the pandemic can lead to weaker demand in some customer segments. At present, it is not possible to quantify these impacts due to low visibility and high volatility. Political risks The electronics industry is characterised by highly integrated, transnational supply chains which are based on the free trade of goods and services. Potential protectionism or growing political tensions can lead to discontinuities in the supply chain and to competitive advantages for competitors in specific countries. In Europe, there are currently uncertainties regarding the withdrawal of the United Kingdom from the European Union, especially with respect to legal situation after the transition period expires in January 2021. ATS has only a few business relationships with customers and suppliers based in the United Kingdom. Nevertheless, ATS has taken measures due to the existing uncertainties to ensure a smooth process in the supply chain. The precautions taken include close contact with customers, an increase in inventories and the preparation of internal systems for the withdrawal. Nonetheless, the effects of the United Kingdom’s withdrawal on the European economy may also have an impact on the business development of ATS. The partial de-escalation of the trade conflict between the USA and China has led to a reduction of punitive tariffs on imports of certain goods in both countries. From the current perspective, ATS will not be significantly affected by the conflict since further processing of the products largely takes place in China. Nevertheless, ongoing monitoring of the affected goods is necessary. In addition, macroeconomic developments resulting from the trade conflict may have an adverse effect on the business of ATS. Compliance Any amendments to regulatory requirements, such as the prohibition of specific processes or materials, might lead to a rise in production costs. ATS might be subject to payment of substantial penalties should any breach of customer confidentiality agreements or statutory provisions occur. ATS has implemented organisational measures aimed at preventing or minimising the occurrence of compliance risks. The extension of such measures is ongoing. As a rule, ATS follows a zero- tolerance policy and expects 100% compliance on the part of its employees with all applicable laws and regulations. The Governance, Risk Compliance Committee (GRC Committee) pursues the objective of identifying and mitigating potentially relevant compliance and governance risks. In addition, ATS introduced the whistleblowing platform “We Care”, which enables employees and external third parties to report potential compliance violations. In the financial year 2019/20 an intranet campaign was launched throughout the Group to raise awareness among employees. Fraud, data security and cybercrime To continue to successfully prevent attempted fraud, internal controls were further intensified in the past few financial years and initiatives to raise awareness among employees with regard to such fraud schemes were increased. Moreover, ATS continually works to expand data and information security. In the financial year 2018/19, a project regarding the EU General Data Protection Regulation was implemented. Based on an analysis of internal processes regarding the use of personal data, the required measures were assessed and implemented in order to ensure the protection of sensitive data. After the successful certification of all European locations in accordance with ISO 27001, the focus in the financial year 2019/20 was on the establishment of a corresponding information security management system (ISMS) at the other ATS locations. Alignment with international IT standards ensures safe handling and appropriate access to information, and the availability of reliable systems. Certification of all locations is planned for the financial year 2020/21.
  • 116.
    112 GROUP MANAGEMENT REPORTANNUALREPORT 2019/20AT S FIRST CHOICE FOR ADVANCED APPLICATIONS ATS ANNUAL REPORT 2019 /20 GROUP MANAGEMENT REPORT FIRST CHOICE FOR ADVANCED APPLICATIONS 34 Based on the measures taken in the context of the COVID-19 pandemic, employees increasingly worked from home. The resulting security-relevant risks were minimised through the provision of guidelines, training material, intranet campaigns and technical measures. The objective of these measures is to raise awareness among employees about information security even in times of crisis. OPERATIONS Quality and delivery performance As in the past, it will be the high quality of products, adherence to delivery deadlines and service quality which will offer the Group an opportunity to differentiate itself from the competition and exploit growth opportunities in the future. At the same time, ATS has to make substantial contractual commitments, especially to key customers, with respect to capacity reserves and volume guarantees, adherence to delivery deadlines and quality performance. Any technical defects, quality deficiencies, difficulties in delivering products or failure to provide volume guarantees granted may expose ATS to warranty claims, claims for damages and contractual penalties. In the Mobile Device business, quality deficiencies may even lead to delivery stops for certain part numbers. Even if such quality deficiencies were not caused in the production process of ATS but within the supply chain, such delivery stops may lead to significant drops in revenue. Substantial quality deficiencies could also result in product recalls and the loss of customers. ATS has established a quality management and planning system designed to rule out or minimise deficiencies in product quality and planning mistakes and their negative consequences as far as possible. In order ensure high product quality, ATS not only meets general international quality standards (ISO 9001) but also further standards for the automotive, aviation and medical sectors. Furthermore, the Group is insured against major risks by virtue of an (extended) product liability insurance policy taking into account exclusions of coverage and customary coverage limits. Intellectual property ATS endeavours to exploit any opportunities for obtaining intellectual property as well as gaining access to promising patents through the development of its own projects, cooperation schemes with partners, and investments. Risks arise if ATS fails to protect its intellectual property, thus enabling the competition to utilise these technologies. Legal disputes about intellectual property can prevent ATS from using or selling disputed technologies. Furthermore, legal disputes with regard to the unauthorised use of external intellectual property can have considerable negative financial consequences. Technology and project development The establishment and expansion of capacity for IC substrates in Chongqing lead to specific risks for the Chongqing site given the significant investment volume. Complications in the further development and project implementation could result in major burdens on business development and the existing financial and administrative resources. In the coming financial year, the focus will be on continuous performance improvement, on building a new plant at the Chongqing site and on expanding capacity at the Leoben plant. Cost control Continuous cost reduction and efficiency increases in all business segments are crucial to the Group’s profitability. If cost reduction measures and performance increases cannot be implemented as planned (or if the costs cannot be passed on to customers), this may have a negative impact on the competitiveness of the Group. ORGANISATION Employees The collective industry experience and management expertise of the employees of the ATS Group form the foundation for taking advantage of future opportunities. The business of the Group might suffer if employees in leading positions were to terminate their employment relations with ATS or if ATS were unable to continue to recruit highly qualified personnel in all areas of value creation and retain them long-term. ATS continuously develops strategies for retaining key employees, recruiting valuable personnel and further expanding the skills of its staff.
  • 117.
    113 GROUP MANAGEMENT REPORTFIRST CHOICE FOR ADVANCED APPLICATIONS ANNUAL REPORT 2019/20AT SATS ANNUAL REPORT 2019 /20 GROUP MANAGEMENT REPORT FIRST CHOICE FOR ADVANCED APPLICATIONS 35 FINANCE Foreign exchange risk Exchange rate fluctuations in EUR, RMB and USD – and to a lesser extent in JPY, KRW and INR – can have considerable positive or negative effects on the results of the Group. To minimise these effects, the Group employs a hedging strategy by generating opposing cash flows in the respective currencies. The high investments in China of the past few years result in significant currency risks related to the RMB, which could increase or decrease the Group’s equity. Hedging against this risk would involve high costs and is not carried out. Financing and liquidity To secure the financial needs for the expansion strategy, the Group uses long-term financial and liquidity planning. However, negative business developments (for example related to the COVID-19 pandemic), significant deviations from assumptions in business cases, exchange rate fluctuations or valuation adjustments may cause failure to achieve the targeted equity ratio and the net debt/EBITDA ratio, and subsequently lead to additional financing requirements under more difficult terms and higher costs, or the loss of existing financing facilities. Interest rates are hedged centrally for the Group as a whole by Group Treasury, in part through the use of appropriate financial instruments. For more information on financial, liquidity, credit and foreign exchange risks, please refer to Note 19 “Additional disclosures on financial instruments” in the notes to the consolidated financial statements. Tax risk The Company is active on a global basis and thus subject to different tax systems. Unless the requirements for the formation of a provision or liability are met, both national and international tax risks are incorporated within financial risks and monitored accordingly. At present, the material tax risks are related to the company in India. In order to minimise future tax risks, the Group continuously monitors compliance with national tax laws and international guidelines such as the BEPS (Base Erosion and Profit Shifting) guideline of the OECD. Although ATS strives to comply with all tax laws and regulations, there is a risk of different interpretations of international transactions in different countries, which may lead to double taxation and additional tax burdens. 5.3.Internal control and risk management system with regard to accounting The accounting-related Internal Control and Risk Management system is an integral part of the Group-wide risk management system. According to the framework concept of COSO (The Committee of Sponsoring Organizations of the Treadway Commission), the actual risk management as well as the Internal Control System (ICS) are subsumed under the concept of company-wide risk management. The main criteria of the Risk Management, Internal Control System and Internal Audit of ATS are specified in a Group-wide risk management and audit manual. The documentation of the internal controls (business processes, risks, control measures and those responsible) is made principally in the form of control matrices, which are archived in a central management database. The accounting-related Internal Control System includes principles, procedures and measures to ensure the compliance of accounting in terms of the control targets described for financial reporting. The accounting procedures are documented in separate process instructions. These processes are standardised across the Group and are presented in a standardised documentation format. Additional requirements for accounting procedures result from specific local regulations. The basic principles of accounting and reporting are documented in the process descriptions and also in detailed process instructions, which are also filed in the central management manual. In addition, guidelines on measurement procedures and organisational requirements in connection with the processes of accounting and preparing the financial statements are compiled and updated on a regular basis. Schedules are set in accordance with Group requirements.
  • 118.
    114 GROUP MANAGEMENT REPORTANNUALREPORT 2019/20AT S FIRST CHOICE FOR ADVANCED APPLICATIONS ATS ANNUAL REPORT 2019 /20 GROUP MANAGEMENT REPORT FIRST CHOICE FOR ADVANCED APPLICATIONS 36 The internal financial reporting is done on a monthly basis as part of Group reporting, with the financial information being reviewed and analysed by the Corporate Accounting and Corporate Controlling department. The monthly budget/actual variance with corresponding comments on the results of the segments, of the plants as well as of the Company, is reported internally to the executives and to the members of the Supervisory Board. The annual preparation of the budget is carried out by the Corporate Controlling department. Quarterly forecasts are drawn up during the year for the remaining financial year based on the quarterly results and current planning information. The forecasts, with comments on the budget comparison and presentations on the impact of opportunities and risks up to the end of the financial year, are reported to the Supervisory Board. In addition to regular reporting, multiple-year planning, project- related financial information or calculations on investment projects are prepared and submitted to the Supervisory Board.
  • 119.
    115 GROUP MANAGEMENT REPORTFIRST CHOICE FOR ADVANCED APPLICATIONS ANNUAL REPORT 2019/20AT SATS ANNUAL REPORT 2019 /20 GROUP MANAGEMENT REPORT FIRST CHOICE FOR ADVANCED APPLICATIONS 37 The COVID-19 pandemic, which started at the beginning of 2020, and the resulting crisis measures slowed down economic activity worldwide and led to substantial downgrades of GDP projections for 2020. The global GDP growth forecast for 2020 is set to decline from 2.9% to 0.4% (OECD, March and April 2020) in the most important economies by the end of April 2020 as a result of the crisis measures taken. Other forecasts project globally negative GDP growth in the range of -2.8% (Oxford Economics, April 2020) to -4.2% (IC Insights, April 2020). These variances reflect the high volatility of the current situation. At present, the global economy is expected to recover in 2021 (OECD, March 2020). ATS remains on track Thanks to its strategic alignment, ATS considers itself well prepared to successfully overcome the current crisis and to positively participate in the intact market trends in the medium term. Even though the company has so far not been essentially affected by disruptions in the value chain, there may be influences on customer demand in the coming months. Due to very limited visibility, coupled with high volatility in the markets, ATS will take measures in the coming quarters enabling it to act flexibly and rapidly to reflect the changing framework conditions. These measures include, among others, strict control of costs and expenses and close interaction with customers and business partners. At the same time, the company works on systematically preparing scenarios for the time after the crisis. The expectations for the individual segments of ATS are as follows: product launches may be delayed in the Mobile Devices segment due to the low visibility. In the Automotive segment, visibility is also limited so that specific developments remain to be seen. The Industrial segment will continue to develop at a low level as in the previous year, while stable development is expected for medical applications. The demand for IC substrates is expected to remain strong according to current forecasts. Operationally, ATS will concentrate on optimally utilising existing and building new capacities, especially for IC substrates in Chongqing, and above all continue to drive the expansion of its business performance. Based on current information and anticipating the usual seasonality, ATS expects a solid performance in the first quarter, with revenue and EBITDA at the level of the previous year. The economic impact of the COVID-19 pandemic is difficult to predict and consequently leads to significant uncertainty in the forecasts. ATS will therefore report on recent events in the markets and in the company on an ongoing basis throughout the financial year and update the outlook as soon as the economic framework conditions can be better quantified. Investments The Management Board considers the market trends to be fully intact. Therefore, ATS will continue its investment programme for new capacities and technologies in the current financial year as previously announced. In line with spending discipline, a reduced budget of up to € 80 million is planned for basic investments (maintenance and technology upgrades) depending on market development. As part of the strategic projects, the management is planning investments totalling up to € 410 million for the financial year 2020/21 – depending on the progress of projects. Leoben-Hinterberg, 13 May 2020 The Management Board Andreas Gerstenmayer m.p. Monika Stoisser-Göhring m.p. Heinz Moitzi m.p. 6. OUTLOOK
  • 120.
  • 121.
    24 28 31 34 45 63 118 _ Consolidatedstatement of profit or loss 118 _ Consolidated statement of comprehensive income 119 _ Consolidated statement of financial position 120 _ Consolidated statement of cash flows 121 _ Consolidated statement of changes in equity 122 _ Notes to the consolidated financial statements 179 _ Statement of all legal representatives 180 _ Auditor’s report
  • 122.
    118 CONSOLIDATED FINANCIAL ­STATEMENTSANNUALREPORT 2019/20AT S FIRST CHOICE FOR ADVANCED APPLICATIONSATS ANNUAL REPORT 2019/20 CONSOLIDATED FINANCIAL STATEMENT FIRST CHOICE FOR ADVANCED APPLICATIONS 39 € in thousands Note 2019/20 2018/19 Revenue 1 1,000,577 1,027,983 Cost of sales 2 (897,668) (860,828) Gross profit 102,909 167,155 Distribution costs 2 (30,891) (30,723) General and administrative costs 2 (37,558) (36,593) Other operating income 4 18,048 18,858 Other operating costs 4 (5,106) (1,487) Other operating result 12,942 17,371 Operating result 47,402 117,210 Finance income 5 10,998 15,172 Finance costs 5 (17,463) (17,190) Finance costs - net (6,465) (2,018) Profit before tax 40,937 115,192 Income taxes1) 6 (19,481) (26,165) Profit for the year 1) 21,456 89,027 Attributable to owners of hybrid capital 1) 8,313 8,313 Attributable to owners of the parent company 13,143 80,714 Earnings per share attributable to equity holders of the parent company (in € per share): 25 - basic 0.34 2.08 - diluted 0.34 2.08 1) 2018/19 adjusted taking into account IAS 12 revised CONSOLIDATED STATEMENT OF COMPREHENSIVE INCOME € in thousands 2019/20 2018/19 Profit for the year 1) 21,456 89,027 Items to be reclassified: Currency translation differences, net of tax (30,292) 24,466 (Losses) from the fair value measurement of hedging instruments for cash flow hedges, net of tax (1,642) (3,730) Items not to be reclassified: (1,091) -5797 Remeasurement of post-employment obligations, net of tax (1,091) (5,797) Other comprehensive income for the year (33,025) 14,939 Total comprehensive income for the year 1) (11,569) 103,966 Attributable to owners of hybrid capital 1) 8,313 8,313 Attributable to owners of the parent company (19,883) 95,653 1) 2018/19 adjusted taking into account IAS 12 revised CONSOLIDATED STATEMENT OF PROFIT OR LOSS
  • 123.
    CONSOLIDATED FINANCIAL ­STATEMENTS 119 FIRSTCHOICE FOR ADVANCED APPLICATIONS ANNUAL REPORT 2019/20AT S ATS ANNUAL REPORT 2019/20 CONSOLIDATED FINANCIAL STATEMENTS FIRST CHOICE FOR ADVANCED APPLICATIONS 40 € in thousands Note 31 Mar 2020 31 Mar 2019 ASSETS Property, plant and equipment 7 903,509 777,742 Intangible assets 8 45,075 60,121 Financial assets 12 193 193 Deferred tax assets 6 25,984 35,555 Other non-current assets 9 21,258 24,664 Non-current assets 996,019 898,275 Inventories 10 108,373 84,465 Trade and other receivables and contract assets 11 192,433 229,045 Financial assets 12 136,242 239,752 Current income tax receivables 2,493 5,728 Cash and cash equivalents 13 417,950 326,841 Current assets 857,491 885,831 Total assets 1,853,510 1,784,106 EQUITY Share capital 21 141,846 141,846 Other reserves 22 9,419 42,444 Hybrid capital 23 172,887 172,887 Retained earnings 436,107 446,274 Equity attributable to owners of the parent company 760,259 803,451 Total equity 760,259 803,451 LIABILITIES Financial liabilities 15 695,834 679,076 Provisions for employee benefits 16 51,244 48,409 Deferred tax liabilities 6 3,166 5,547 Other liabilities 14 13,596 16,196 Non-current liabilities 763,840 749,228 Trade and other payables 14 214,017 179,954 Financial liabilities 15 105,299 37,967 Current income tax payables 4,858 9,331 Other provisions 17 5,237 4,175 Current liabilities 329,411 231,427 Total liabilities 1,093,251 980,655 Total equity and liabilities 1,853,510 1,784,106 CONSOLIDATED STATEMENT OF FINANCIAL POSITION
  • 124.
    120 CONSOLIDATED FINANCIAL ­STATEMENTSANNUALREPORT 2019/20AT S FIRST CHOICE FOR ADVANCED APPLICATIONSATS ANNUAL REPORT 2019/20 CONSOLIDATED FINANCIAL STATEMENTS FIRST CHOICE FOR ADVANCED APPLICATIONS 41 € in thousands 2019/20 2018/19 Operating result 47,402 117,210 Depreciation, appreciation, amortisation and impairment of property, plant and equipment and intangible assets 147,127 132,888 Gains/losses from the sale of fixed assets 732 37 Changes in non-current provisions 3,246 10,833 Non-cash expense/(income), net (14,315) (17,523) Interest paid (12,049) (13,624) Interest received 6,710 4,939 Income taxes paid (13,486) (28,788) Cash flow from operating activities before changes in working capital 165,367 205,972 Inventories (25,462) 20,755 Trade and other receivables and contract assets 38,192 (23,405) Trade and other payables 5,747 (30,898) Other provisions 1,279 (1,890) Cash flow from operating activities 185,123 170,534 Capital expenditure for property, plant and equipment and intangible assets (218,597) (100,913) Proceeds from the sale of property, plant and equipment and intangible assets 70 77 Capital expenditure for financial assets (44,263) (275,669) Proceeds from the sale of financial assets 146,161 99,926 Cash flow from investing activities (116,629) (276,579) Proceeds from borrowings 77,888 355,278 Repayments of borrowings (30,089) (190,892) Proceeds from government grants 1,748 5,112 Dividends paid (23,310) (13,986) Hybrid cupon paid (8,313) (8,313) Cash flow from financing activities 17,924 147,199 Change in cash and cash equivalents 86,418 41,154 Cash and cash equivalents at beginning of the year 326,841 270,729 Exchange gains on cash and cash equivalents 4,691 14,958 Cash and cash equivalents at the end of the year 417,950 326,841 CONSOLIDATED STATEMENT OF CASH FLOWS
  • 125.
    CONSOLIDATED FINANCIAL ­STATEMENTS 121 FIRSTCHOICE FOR ADVANCED APPLICATIONS ANNUAL REPORT 2019/20AT S ATS ANNUAL REPORT 2019/20 CONSOLIDATED FINANCIAL STATEMENT FIRST CHOICE FOR ADVANCED APPLICATIONS 42 € in thousands Share capital Other reserves Hybrid capital Retained earnings Equity attributable to owners of the parent company Non- controlling interests Total equity 31 Mar 2018 141,846 27,505 172,887 369,153 711,391 – 711,391 Adjustments IFRS 15, IFRS 9 – – – 10,393 10,393 – 10,393 1 Apr 2018 141,846 27,505 172,887 379,546 721,784 – 721,784 Profit for the year 1) – – – 89,027 89,027 – 89,027 Other comprehensive income for the year – 14,939 – – 14,939 – 14,939 thereof currency translation differences, net of taxes – 24,466 – – 24,466 – 24,466 thereof remeasurement of post-employment obligations, net of tax – (5,797) – – (5,797) – (5,797) thereof change in hedging instruments for cash flow hedges, net of tax – (3,730) – – (3,730) – (3,730) Total comprehensive income for the year 2018/19 1) – 14,939 – 89,027 103,966 – 103,966 Dividends paid relating to 2017/18 – – – (13,986) (13,986) – (13,986) Hybrid cupon paid – – – (8,313) (8,313) – (8,313) Tax effect hybrid cupon 1) – – – – – – – 31 Mar 2019 141,846 42,444 172,887 446,274 803,451 – 803,451 Profit for the year – – – 21,456 21,456 – 21,456 Other comprehensive income for the year – (33,025) – – (33,025) – (33,025) thereof currency translation differences, net of tax – (30,292) – – (30,292) – (30,292) thereof remeasurement of post-employment obligations, net of tax – (1,091) – – (1,091) – (1,091) thereof change in hedging instruments for cash flow hedges, net of tax – (1,642) – – (1,642) – (1,642) Total comprehensive income for the year 2019/20 – (33,025) – 21,456 (11,569) – (11,569) Dividends paid relating to 2018/19 – – – (23,310) (23,310) – (23,310) Hybrid cupon paid – – – (8,313) (8,313) – (8,313) 31 Mar 2020 141,846 9,419 172,887 436,107 760,259 – 760,259 1) Adjusted taking into account IAS 12 revised CONSOLIDATED STATEMENT OF CHANGES IN EQUITY
  • 126.
    122 CONSOLIDATED FINANCIAL ­STATEMENTSANNUALREPORT 2019/20AT S FIRST CHOICE FOR ADVANCED APPLICATIONS ATS ANNUAL REPORT 2019/20 CONSOLIDATED FINANCIAL STATEMENTS FIRST CHOICE FOR ADVANCED APPLICATIONS 43 A. General AT S Austria Technologie Systemtechnik Aktiengesellschaft (hereinafter referred to as “the Company”, and with its subsidiaries referred to as “the Group”) was incorporated in Austria. The Company is headquartered in Austria, Fabriksgasse 13, 8700 Leoben-Hinterberg. The Group manufactures and distributes printed circuit boards and provides related services in the segments Mobile Devices Substrates, Automotive, Industrial, Medical and Others. The products are manufactured in the European and Asian markets and are directly distributed to original equipment manufacturers (OEM) as well as to contract electronic manufacturers (CEM). Since 20 May 2008, the Company has been listed in the Prime Market segment of the Vienna Stock Exchange, Austria, and, after a period of double listing on the previous exchange in Frankfurt am Main, Germany, has been traded exclusively on the Vienna Stock Exchange since 15 September 2008. Prior to changing stock exchange, the Company had been listed on the Frankfurt Stock Exchange since 16 July 1999. Since 19 March 2018, the Company’s shares have been included in the Austrian ATX index. According to Section 245a of the Austrian Commercial Code (UGB), theconsolidatedfinancialstatements werepreparedinaccordance withtheInternationalFinancialReportingStandards (IFRS) and interpretations (IFRIC and SIC) of the International Accounting Standards Board (IASB) as adopted by the European Union (EU). B. Accounting and measurement policies The consolidated financial statements have been prepared under the historical cost convention, except for securities and derivative financial instruments, which are measured at their fair values. a. Consolidation principles The balance sheet date for all consolidated companies is 31 March 2020, with the following exceptions: due to the legal situation in China, the financial year of ATS (China) Company Limited and ATS (Chongqing) Company Limited corresponds to the calendar year (balance sheet date: 31 December 2019), meaning that they were consolidated on the basis of the interim financial statements as of 31 March 2020. The consolidated financial statements were approved for issue by the Management Board on 13 May 2020. The separate financial statements of the Company, which are included in the consolidation after reconciliation to the applicable accounting standards, will be presented for approval to the Supervisory Board on 4 June 2020. The separate financial statements of the Company can be modified by the Supervisory Board and, in case of presentation to the Annual General Meeting, by the Company’s shareholders in a way that might also affect the presentation of the consolidated financial statements. Group of consolidated entities The Company controls an entity when the Group is exposed to risks or has rights to variable returns from its involvement with the entity and has the ability to affect those returns through its power over the entity. In addition to the Company itself, the consolidated financial statements comprise the following fully consolidated subsidiaries:  ATS Asia Pacific Limited, Hong Kong, China (hereinafter referred to as ATS Asia Pacific), share 100%  ATS (China) Company Limited, China (hereinafter referred to as ATS China), 100% subsidiary of ATS Asia Pacific  ATS (Chongqing) Company Limited, China (hereinafter referred to as ATS Chongqing), 100% subsidiary of ATS Asia Pacific  ATS Japan K.K., Japan, 100% subsidiary of ATS Asia Pacific  ATS (Taiwan) Co., Ltd., Taiwan (hereinafter referred to as ATS Taiwan), 100% subsidiary of ATS Asia Pacific  ATS India Private Limited, India (hereinafter referred to as ATS India), share 100%  ATS Korea Co., Ltd., South Korea (hereinafter referred to as ATS Korea), share 100%  ATS Americas LLC, USA (hereinafter referred to as ATS Americas), share 100%  ATS Deutschland GmbH, Germany, share 100% NOTES TO THE CONSOLIDATED FINANCIAL STATEMENTS I. GENERAL INFORMATION
  • 127.
    CONSOLIDATED FINANCIAL ­STATEMENTS 123 FIRSTCHOICE FOR ADVANCED APPLICATIONS ANNUAL REPORT 2019/20AT S ATS ANNUAL REPORT 2019/20 CONSOLIDATED FINANCIAL STATEMENTS FIRST CHOICE FOR ADVANCED APPLICATIONS 44 There were no changes in the consolidation group in financial year 2019/20. The Group applies the acquisition method to account for business combinations. The consideration transferred for the acquisition of a subsidiary is the fair value of the assets transferred, the equity interests issued and the liabilities incurred and/or assumed at the acquisition date. The consideration transferred also includes the fair value of any asset or liability resulting from a contingent consideration arrangement. Acquisition-related costs are expensed as incurred. Identifiable assets acquired and liabilities and contingent liabilities assumed in a business combination are measured initially at their fair values at the acquisition date. For each business combination, the Group measures any non-controlling interest in the acquiree either at fair value or at the non- controlling interest’s proportionate share of the acquiree’s identifiable net assets and, accordingly, recognises the full or proportional goodwill. If the consideration transferred is less than the fair value of the net assets of the subsidiary acquired, the difference is recognised directly in profit or loss. When the Group ceases to have control or significant influence over a company, any retained interest in the entity is remeasured to its fair value, with the change in carrying amount recognised in profit or loss. The fair value is the fair value determined at initial recognition of an associate, joint venture or financial asset. In addition, any amounts recognised in other comprehensive income in respect of that entity are accounted for as if the parent company had directly disposed of the related assets or liabilities. Methods of consolidation All significant intercompany balances and transactions have been eliminated so that the consolidated financial statements present the accounting information of the Group as if it were one single company. Capital consolidation is made in accordance with IFRS 3 “Business Combinations” and IFRS 10 “Consolidated Financial Statements”. Intercompany accounts receivable and payable as well as expenses and income are eliminated. Unless immaterial, intercompany results in non-current assets and inventories are eliminated. Furthermore, uniform accounting and measurement methods are applied to all consolidated subsidiaries. b. Segment reporting The definition of operating segments and the presentation of segment results are based on the management approach and follow internal reports to the Management Board as the chief operating decision-maker, i.e. the body that decides on the allocation of resources to the individual segments. An operating segment is a component of an entity that engages in business activities and whose operating results are reviewed regularly by the entity’s chief operating decision-maker. Business activities involve earning revenues and incurring expenses, and these may also relate to business transactions with other operating segments of the entity. Separate financial information is available for the individual operating segments. The ATS Group structures the operating activities in three segments:  Mobile Devices Substrates  Automotive, Industrial, Medical  Others The business unit Mobile Devices Substrates is responsible for the production of printed circuit boards for mobile end-user devices such as smartphones, tablets, notebooks and consumer products such as digital cameras as well as substrates for desktop PCs and servers. The printed circuit boards for these applications are largely produced at our Shanghai (ATS China) and Chongqing (ATS Chongqing) plants.
  • 128.
    124 CONSOLIDATED FINANCIAL ­STATEMENTSANNUALREPORT 2019/20AT S FIRST CHOICE FOR ADVANCED APPLICATIONSATS ANNUAL REPORT 2019/20 CONSOLIDATED FINANCIAL STATEMENTS FIRST CHOICE FOR ADVANCED APPLICATIONS 45 The business unit Automotive, Industrial, Medical supplies customers in the fields of automotive supplies, industrial applications, medical technology, aerospace, security and other sectors. Production for this business segment mainly takes place at our plants in India, South Korea and Austria. The business unit Others covers corporate and holding activities. Embedding technology, which was reported under the business unit Others in the previous year, has now been split between the business unit Mobile Devices Substrates and the Automotive, Industrial, Medical business unit. c. Foreign currencies The Group’s presentation currency is the euro (€). The functional currency of the foreign subsidiaries is the respective local currency. Foreign subsidiaries With the exception of equity positions (historical exchange rate), the balance sheets of ATS India, ATS China, ATS Asia Pacific, ATS Japan K.K., ATS Korea, ATS Americas, ATS Chongqing and ATS Taiwan are translated at the exchange rates on the balance sheet date. The profit or loss statements are translated at the average exchange rates of the financial year. The effect of changes in the exchange rate with regard to the foreign subsidiaries’ net assets is recognised directly in equity. Foreign currency transactions In the financial statements of each of the Group’s entities, foreign currency items are translated at the exchange rates prevailing on the day of the transaction. Monetary items are translated at the respective exchange rate ruling at the balance sheet date; non-monetary items which were recognised according to the historical cost principle are carried at the rate of their initial recognition. Translation adjustments from monetary items, with the exception of financial assets classified as “at fair value through other comprehensive income”, are recognised in profit or loss. Closing rate Average rate 31 Mar 2020 31 Mar 2019 Change in % 01 Apr 2019 - 31 Mar 2020 01 Apr 2018 - 31 Mar 2019 Change in % Chinese yuan renminbi 7.7575 7.5618 2.6% 7.7181 7.7751 (0.7%) Hong Kong dollar 8.4879 8.8159 (3.7%) 8.6850 9.1080 (4.6%) Indian rupee 82.5500 77.6621 6.3% 78.7460 80.6668 (2.4%) Japanese yen 118.9200 124.3700 (4.4%) 120.8538 128.4076 (5.9%) South Korean won 1,341.0773 1,275.6888 5.1% 1,312.8898 1,287.1060 2.0% Taiwan dollar 33.1667 34.6394 (4.3%) 34.1504 35.3469 (3.4%) US dollar 1.0949 1.1230 (2.5%) 1.1110 1.1613 (4.3%) d. Revenue recognition Revenue comprises the fair value of considerations received in the course of the Groups ordinary activities. Revenue is recognised net of VAT, discounts and price reductions, and after elimination of intercompany sales. Revenue is realised as follows: Revenue from product sales In accordance with IFRS 15, revenue must be recognised when control over agreed goods and services passes to the customer and the customer obtains a benefit from them. Revenue can be recognised at a point in time or over time. When products are manufactured specifically tailored to the customer’s needs and there is consequently no alternative use for such products and the entity has an enforceable right to payment for performance completed to date including a margin, control of these products passes to the customer according IFRS 15.35 c. Some of the ATS Group’s customers meet these criteria; therefore revenue is recognised over time in such cases. Progress is measured based on the cost incurred to date in relation to total cost.
  • 129.
    CONSOLIDATED FINANCIAL ­STATEMENTS 125 FIRSTCHOICE FOR ADVANCED APPLICATIONS ANNUAL REPORT 2019/20AT S ATS ANNUAL REPORT 2019/20 CONSOLIDATED FINANCIAL STATEMENTS FIRST CHOICE FOR ADVANCED APPLICATIONS 46 In cases where customers do not meet these criteria revenue is recognised at a point in time when control over delivery has passed to the buyer (depending on the agreed incoterms). e. Income taxes The income tax burden is based on the profit for the year and includes deferred income taxes. The Group provides for deferred income taxes using the balance-sheet oriented method. Under this method, the expected tax effect of differences arising between the carrying amounts in the consolidated financial statements and the taxable carrying amounts are taken into account by recognising deferred tax assets and tax liabilities. These differences will be reversed in the future. Deferred income tax is determined using tax rates (and laws) that have been enacted or substantively enacted on the balance sheet date and are expected to apply when the related deferred income tax asset is realised or the deferred income tax liability is settled. A future change in tax rates would also have an impact on the deferred tax assets capitalised at the current balance sheet date. Deferred income taxes arise from the measurement of specific assets and liabilities, as well as tax loss carryforwards and amortisation of goodwill. Deferred taxes on not yet realised profits/losses of equity instruments and on not yet realised profits/losses from hedging instruments for cash flow hedges that are recognised in equity are also directly recognised in equity. In accordance with IFRS, deferred income tax assets on loss carryforwards have to be recognised to the extent that it is probable that they will be utilised against future taxable profits. Deferred taxes are not recognised for temporary differences in connection with holdings in subsidiaries provided that the Group is able to control the timing of the reversal of the temporary differences and it is likely that the temporary differences will not be reversed in the foreseeable future. f. Property, plant and equipment Items of property, plant and equipment are measured at cost. Expenditure directly attributable to an acquisition and the subsequent expenditure is capitalised; repairs and maintenance costs, however, are expensed as incurred. Borrowing costs directly attributable to the acquisition, construction or production of a qualifying asset are capitalised as part of the acquisition or production costs of this asset in accordance with IAS 23. From the time of their availability for use, the assets are depreciated on a straight-line basis over their expected useful lives. Depreciation is charged on a pro rata temporis basis. Land is not subject to depreciation. Scheduled depreciation is based on the following useful lives applicable throughout the Group: Plants and buildings 10–50 years Machinery and technical equipment 4–15 years Tools, fixtures, furniture and office equipment 3–15 years Depreciation periods and methods are reviewed annually at the end of the financial year.
  • 130.
    126 CONSOLIDATED FINANCIAL ­STATEMENTSANNUALREPORT 2019/20AT S FIRST CHOICE FOR ADVANCED APPLICATIONSATS ANNUAL REPORT 2019/20 CONSOLIDATED FINANCIAL STATEMENTS FIRST CHOICE FOR ADVANCED APPLICATIONS 47 Profits or losses resulting from the closure or retirement of non-current assets, which arise from the difference between the net realisable value and the carrying amounts, are recognised in profit or loss. g. Leases A lease is a contract which transfers the right to use an asset (leasing asset) for and agreed period of time against a consideration. Since 1 April 2019, the Group recognises, for all leases, right-of-use assets in the statement of financial position and liabilities for the payment obligations entered into at present value. Lease payments are discounted at the rate implicit in the lease if that can be readily determined. Otherwise the incremental borrowing rate is used. Lease liabilities include fixed payments, variable index-linked payments and the exercise price of a purchase option, if the exercise is considered to be sufficiently certain. The subsequent measurement is made at amortised cost. Right-of-use assets are depreciated on a straight-line basis over the period of the contract. For leases in which the underlying asset is of low value (€ 5 thousand) and for short-term leases (up to 12 months or less) the practical expedients are used and payments are recognised on a straight-line basis as an expense in the statement of profit or loss. In addition, the provisions are not applied to leases of intangible assets. In particular, leases of real estate include extension and termination options. When determining the term of the contract, all facts and circumstances offering an economic incentive to exercise extension options or not to exercise termination options are taken into account. Changes in the term resulting from the exercise or non-exercise of such options are only considered if they are sufficiently certain. The Group only acts as a lessee. Transactions in which the Group is the lessor do not take place. h. Intangible assets Patents, trademarks and licenses Expenditure on acquired patents, trademarks and licenses is capitalised at cost, including incidental acquisition expenses, and amortised on a straight-line basis over the asset’s useful life, generally between two and ten years. Amortisation terms and methods are reviewed annually at the end of the financial year. Research and development costs Research costs are expensed as incurred and charged to cost of sales. Development costs are also expensed as incurred. An intangible asset arising from development is recognised if, and only if, an entity can demonstrate all of the following:  The technical feasibility of completing the intangible asset so that it will be available for use or sale.  Its intention to complete the intangible asset and use or sell it.  Its ability to use or sell the intangible asset.  How the intangible asset will generate probable future economic benefits is verifiable.  The availability of adequate technical, financial and other resources to complete the development and to use or sell the intangible asset.  Its ability to reliably measure the expenditure attributable to the intangible asset during its development. Capitalised development projects include all the directly attributable costs incurred as a result of development processes. Borrowing costs are capitalised if the development project is a qualifying asset in accordance with IAS 23. Development costs are amortised on a straight- line basis over a useful life from six to seven years, which is derived from the expected sales periods.
  • 131.
    CONSOLIDATED FINANCIAL ­STATEMENTS 127 FIRSTCHOICE FOR ADVANCED APPLICATIONS ANNUAL REPORT 2019/20AT S ATS ANNUAL REPORT 2019/20 CONSOLIDATED FINANCIAL STATEMENTS FIRST CHOICE FOR ADVANCED APPLICATIONS 48 i. Impairment losses and appreciation of property, plant and equipment and intangible assets The Group regularly reviews property, plant and equipment and intangible assets for possible impairment. If evidence for impairment exists, an impairment test is carried out without delay. Intangible assets in the development phase are tested annually for impairment. If the recoverable amount of the respective asset is below its carrying amount, an impairment loss amounting to the difference is recognised. The recoverable amount is the higher of an asset’s fair value less costs to sell and its value in use. The value in use corresponds to the estimated future cash flows expected from the continued use of the asset and its disposal at the end of its useful life. The discount rates applied correspond to the weighted cost of capital based on externally available capital market data that are typical in the industry and have been adapted to the specific risks. If the reason for the impairment recognised in the past no longer exists, with the exception of goodwill, an appreciation up to amortised cost is made. j. Inventories Inventories are stated at the lower of cost or net realisable value. Net realisable value is the estimated selling price in the ordinary course of business, less variable costs necessary to make the sale. Cost is determined by the first-in, first-out (FIFO) method. The cost of finished goods and work in progress comprises raw materials, direct labour, other direct costs and related production overheads. Interest on borrowed capital is not recognised. k. Trade and other receivables and contract assets Receivables not including a material financing component are initially measured at the transaction price in accordance with IFRS 15 and subsequently recognised at amortised cost, if necessary less impairment for expected and actual credit losses. The receivables are measured in accordance with the simplified model (lifetime expected credit losses). For this purpose, the required impairment is determined within the scope of a provision matrix by analysing historical data and estimating future developments. All receivables are due within less than one year and therefore do not include a financing component in the form of interest. l. Financial assets Financial assets are recognised and derecognised using settlement date accounting. The fair values recognised in the statement of financial position generally correspond to market prices of financial assets. Except for financial assets at fair value through profit or loss, they are initially recognised including transaction costs. Financial assets are divided into two categories in accordance with IFRS 9, those which are valued at amortised cost and those valued at fair value. When financial assets are valued at fair value, expenses and income are recognised through profit or loss or other comprehensive income. At amortised cost This category includes all financial assets held as part of a business model whose objective is the collection of contractual cash flows and the contractual terms of the financial asset give rise on specified dates to cash flows that are solely payments of principal and interest on the principal amount outstanding. At the time of acquisition, the financial asset is measured at fair value in accordance with IFRS 15 (contract assets and trade receivables). The financial asset is subsequently measured at amortised cost less any impairment. Impairments are recognised through profit or loss.
  • 132.
    128 CONSOLIDATED FINANCIAL ­STATEMENTSANNUALREPORT 2019/20AT S FIRST CHOICE FOR ADVANCED APPLICATIONSATS ANNUAL REPORT 2019/20 CONSOLIDATED FINANCIAL STATEMENTS FIRST CHOICE FOR ADVANCED APPLICATIONS 49 ATS applies the simplified impairment model for trade receivables and contract assets from contracts with customers, which takes into account expected credit losses during the full life time. Credit loss is determined on the basis of a provision matrix created based on a rating of the customers. Financial assets at fair value through other comprehensive income This category includes those financial assets held as part of a business model whose objective is the collection of contractual cash flows and the sale of financial assets, and the contractual terms of the financial asset give rise on specified dates to cash flows that are solely payments of principal and interest on the principal amount outstanding. In the ATS Group, trade receivables are in part sold to banks as part of factoring agreements. The part of receivables as of 31 March which is sold to banks at nominal value after this date is measured at fair value through other comprehensive income. The measurement at fair value has no significant impact on the consolidated financial statements. Therefore it is assumed that the fair value corresponds the previous measurement standard of amortised cost. All equity instruments for which IFRS 9 has to be applied are recognised at fair value; value changes are recognised through profit or loss. If an equity instrument is not held for trading an entity can choose for the first time recognition the irrevocable decision to recognise value changes through OCI; than only income from dividends are recognised through profit or loss, insofar as they do not represent a capital repayment. In accordance with IFRS 9 the irrevocable option of measurement through other comprehensive income was used. Value changes will consequently continue to be recognised in other comprehensive income. Financial assets at fair value through profit or loss This category includes financial assets which were classified neither at amortised cost nor at fair value through other comprehensive income. At the time of their acquisition, they are stated at fair value, excluding transaction costs, and, in subsequent periods, at their respective fair values. Realised and unrealised gains and losses are recognised in profit or loss in “Finance costs - net”. This relates primarily to securities held for trading. Derivative financial instruments also fall into this category, unless hedge accounting is applied (refer to “Derivative financial instruments”). Derivative financial instruments Where possible, the Group uses derivative financial instruments to hedge against interest fluctuations. These instruments mainly include interest rate swaps. They are entered into in order to protect the Group against interest rate fluctuations. Currency swaps (mainly in US dollar) are also entered in order to protect the Group against currency fluctuations. The Group does not hold any financial instruments for speculative purposes. The first-time recognition at the conclusion of the contract and the subsequent measurement of derivative financial instruments are made at their fair values. ATS continues to apply the provisions of IAS 39 with respect to hedge accounting. “Hedge accounting” in accordance with IAS 39 “Financial Instruments: Recognition and Measurement”, according to which changes in fair values of hedging instruments are recognised in equity, is applied when there is an effective hedging relationship pursuant to IAS 39 for hedging instruments for cash flow hedges. The assessment of whether the derivative financial instruments used in the hedging relationship are highly effective in offsetting the changes in cash flows of the hedged item is documented at the inception of the hedging relationship and on an ongoing basis. When “hedge accounting” in equity is not applicable, unrealised gains and losses from derivative financial instruments are recognised in profit or loss in “Finance costs - net”.
  • 133.
    CONSOLIDATED FINANCIAL ­STATEMENTS 129 FIRSTCHOICE FOR ADVANCED APPLICATIONS ANNUAL REPORT 2019/20AT S ATS ANNUAL REPORT 2019/20 CONSOLIDATED FINANCIAL STATEMENTS FIRST CHOICE FOR ADVANCED APPLICATIONS 50 Interest and dividend income Interest income is recognised on a pro rata temporis basis, taking into account the effective interest rate of the asset. Dividend income from financial assets is recognised in profit or loss when the Group’s right to receive payments is established. Impairment of financial assets The new impairment expected credit loss (ECL) model according to IFRS 9 has to be applied for financial assets which are measured at amortised cost, for contract assets and debt instruments measured at fair value through OCI. In accordance with IFRS 9, impairment must be determined using either the twelve-month model, which takes into account expected credit losses within the next twelve months, or the lifetime expected credit loss model which takes into account expected credit losses that result from possible default events within the whole lifetime. ATS applies the simplified impairment model for trade receivables and contract assets from contracts with customers, which takes into account expected credit losses during the full lifetime of the asset. The credit loss is determined on the basis of a provision matrix created based on rating of the customers. m. Cash and cash equivalents Cash and cash equivalents comprise cash, time deposits, deposits held at call with banks and short-term, highly liquid investments with an original maturity of up to three months (commercial papers and money market funds). n. Non-controlling interests The Company does not have any non-controlling interests. The profit for the year and other comprehensive income are attributed to the owners of the parent company and the holders of the hybrid capital. o. Provisions Provisions are recognised if the Group has a legal or de facto obligation to third parties, which is based on past events, where it is probable that this will result in an outflow of resources and the amount can be estimated reliably. The provisions are remeasured at each balance sheet date and their amounts adjusted accordingly. Non-current provisions are reported at the discounted amount to be paid at each balance sheet date if the interest effect resulting from the discounting is material. p. Provisions for employee benefits Pension obligations The Group operates various defined contribution and defined benefit pension schemes. A defined contribution plan is a pension plan under which the Group pays fixed contributions into a special purpose entity (fund). These contributions are charged to staff costs. No provision has to be set up, as there are no additional obligations beyond the fixed amounts. For individual members of the Management Board and certain executive employees, the Group has defined benefit plans that are valued by qualified and independent actuaries at each balance sheet date. The Group’s obligation is to meet the benefits committed to current and former members of the Management Board and executive employees as well as their dependents. The pension obligation calculated according to the projected unit credit method is reduced by the plan assets of the fund in the case of a funded pension scheme. The present value of the future pension benefit is determined on the basis of years of service, expected remuneration and pension adjustments.
  • 134.
    130 CONSOLIDATED FINANCIAL ­STATEMENTSANNUALREPORT 2019/20AT S FIRST CHOICE FOR ADVANCED APPLICATIONSATS ANNUAL REPORT 2019/20 CONSOLIDATED FINANCIAL STATEMENTS FIRST CHOICE FOR ADVANCED APPLICATIONS 51 To the extent that the plan assets of the fund do not cover the obligation, the net liability is accrued under pension provisions. If the net assets exceed the pension obligation, the exceeding amount is capitalised under “Overfunded pension benefits”. Staff costs recognised in the respective financial year are based on expected values and include the service costs. Net interest on net liabilities is recognised in “Finance costs - net”. Remeasurements of the net liability are recognised in other comprehensive income and comprise gains and losses arising from the remeasurement of post-employment obligations. Provisions for severance payments Pursuant to Austrian labour regulations, severance payments have to be paid primarily on termination of employment by the employer or on the retirement of an employee. The liabilities are measured by qualified and independent actuaries at each balance sheet date. For employees who joined Austrian companies up to and including 2002, the Company has direct obligations that account for the major part of the Group’s severance payment obligations. In accordance with IAS 19, these liabilities are calculated using the projected unit credit method as described above and represent severance payment obligations not covered by plan assets. For employees who joined the Company as of or after 1 January 2003, the severance payment obligation is met by regular contributions to a staff provision fund (“Mitarbeitervorsorgekasse”). These contributions are included in staff costs. The Company has no further payment obligations once the contributions have been paid. For employees of the company in India, obligations for severance payments are covered by life insurance policies. Furthermore, severance payment obligations exist for employees in South Korea and China. These obligations are measured in accordance with IAS 19 using the projected unit credit method as described above and represent severance payment obligations not covered by plan assets. Other employee benefits Other employee benefits include provisions for anniversary bonuses and relate to employees in Austria and China. Anniversary bonuses are special one-off payments stipulated in the Collective Agreement which are dependent on remuneration and duration of service. Eligibility is determined by a certain minimum length of employment. The respective liability is calculated in accordance with the projected unit credit method based on the same parameters used for severance payments. Staff costs recognised in the respective financial year include entitlements acquired and the actuarial results. The interest component is recognised in “Finance costs - net”. The liabilities are measured by qualified and independent actuaries at each balance sheet date. q. Stock appreciation rights The Group introduced a long-term incentive programme based on stock appreciation rights (SAR). Stock appreciation rights relate to value increases in share prices based on the performance of the share price. These rights are accounted for in accordance with IFRS 2 “Share- based Payment”. The fair value of the employee services rendered as consideration for the granting of SAR is recognised as an expense. Upon initial recognition and at every balance sheet date until the liabilities are settled, SAR liabilities are measured at fair value through profit or loss, applying the option price model. Reference is made to Note 14 “Trade and other payables”. r. Liabilities Financial liabilities are initially measured at fair value less transaction cost and, in subsequent periods, at amortised cost using the effective interest rate method. Foreign currency liabilities are translated at the average exchange rate prevailing at the balance sheet date.
  • 135.
    CONSOLIDATED FINANCIAL ­STATEMENTS 131 FIRSTCHOICE FOR ADVANCED APPLICATIONS ANNUAL REPORT 2019/20AT S ATS ANNUAL REPORT 2019/20 CONSOLIDATED FINANCIAL STATEMENTS FIRST CHOICE FOR ADVANCED APPLICATIONS 52 s. Government grants Government grants are recognised at their fair value where there is a reasonable assurance that the grants will be received and the Group will comply with all attached conditions. Government grants relating to costs are deferred and recognised in profit or loss over the period necessary to match them with the costs that they are intended to compensate. Government grants relating to investments in property, plant and equipment are included in liabilities as deferred government grants; they are recognised in profit or loss on a straight-line basis over the expected useful life of the related assets. Government grants relating to costs and property, plant and equipment are recognised in profit or loss under other operating result. t. Contingent liabilities, contingent assets and other financial obligations Contingent liabilities are not recognised in the statement of financial position, but disclosed in Note 20 in the notes to the consolidated financial statements. They are not disclosed if an outflow of resources with economic benefit is unlikely. A contingent asset is not recognised in the consolidated financial statements, but disclosed if the inflow of an economic benefit is likely. u. First-time adoption of accounting standards The following new and/or amended standards and interpretations were applied for the first time in the financial year 2019/20 and pertain to the International Financial Reporting Standards (IFRS) as adopted by the EU.  IFRS 16: Leases  IFRS 9: Prepayment features with negative compensation  IAS 28: Long-term interests in associates and joint ventures  IAS 19: Plan amendments, curtailments and settlements  IFRIC 23: Uncertainty over income tax treatments  Annual improvements: IFRS 2015 – 2017: IAS 12, IAS 23, IFRS 3, IFRS 11 The changes resulting from the entry into force of these standards are explained below. v. Future amendments to accounting standards and impact of first-time adoption The IASB and IFRIC issued additional standards and interpretations not yet effective in the financial year 2019/20. These have already been adopted in part by the European Union. The following standards and interpretations had already been published by the time these consolidated financial statements were prepared and are not yet effective; they have not been adopted early in the preparation of these consolidated financial statements:
  • 136.
    132 CONSOLIDATED FINANCIAL ­STATEMENTSANNUALREPORT 2019/20AT S FIRST CHOICE FOR ADVANCED APPLICATIONSATS ANNUAL REPORT 2019/20 CONSOLIDATED FINANCIAL STATEMENTS FIRST CHOICE FOR ADVANCED APPLICATIONS 53 Standard/Interpretation (Content of the regulation) Effective date 1) EU 2) Expected impacts on the consolidated financial statements IFRS 14 Regulatory Defferral Accounts Waiting for final standard No No major changes are expected IFRS 17 Insurance contracts 1/1/2022 No No major changes are expected IFRS 3 Definition of a Business Combination 1/1/2020 Yes No major changes are expected IAS 1, IAS 8 Definition of material 1/1/2020 Yes No major changes are expected IAS 39, IFRS 9, IFRS 7 Interest rate benchmark reform 1/1/2020 Yes No major changes are expected IAS 28, IFRS 10 Investments in Associates: Sales or contributions of assets between an investor and ist associate/joint venture Postponed indefinitely No No major changes are expected Frame Work: Changes in the references of the IFRS Standards 1/1/2020 Yes No major changes are expected 1) The Group intends to apply the new regulations for the first time in the fiscal year beginning subsequent to the effective date. 2) Status of adoption by the EU. IFRS 16 Leases IFRS 16 specifies the recognition of leases. This standard replaces IAS 17 and previous interpretations. Due to the new provisions it is no longer necessary to distinguish between finance and operating leases. The standard provides a single lessee accounting model requiring the lessee to recognise assets and liabilities for all leases in the statement of financial position, unless the term of the lease is twelve months or less or the underlying asset has a low value of less than € 5 thousand. The simplifications are optional and applied by ATS. Application of this new standard is mandatory for reporting periods starting on or after 1 January 2019. Hence, the ATS Group is required to apply IFRS 16 as of 1 April 2019 and uses the modified retrospective method. A restatement of comparative information is not necessary. The following table shows the effects of the first-time application of IFRS 16 Leases on the opening balance at 1 April 2019: € in thousands 31 Mar 2019 Adjustment IFRS 16 01 Apr 2019 Assets Land, plants and buildings 91,597 23,770 115,367 Machinery and technical equipment 624,571 – 624,571 Tools, fixtures, furniture and office equipment 9,117 2,819 11,936 Prepayments and construction in progress 52,457 – 52,457 Liabilities Long term financial liabilities 679,076 23,409 702,485 Short term financial liabilities 37,967 3,180 41,147
  • 137.
    CONSOLIDATED FINANCIAL ­STATEMENTS 133 FIRSTCHOICE FOR ADVANCED APPLICATIONS ANNUAL REPORT 2019/20AT S ATS ANNUAL REPORT 2019/20 CONSOLIDATED FINANCIAL STATEMENTS FIRST CHOICE FOR ADVANCED APPLICATIONS 54 The operating lease obligations at 31 March 2019 resulted in the following reconciliation to the opening balance value of the lease liabilities at 1 April 2019: € in thousands Obligation from non-cancellable operating leases as at 31 March 2019 5,326 Recognition exemption for short-term leases (346) Recognition exemption for low-value assets (656) Adjustment due to cancellation or extension options 23,042 Lease liabilities before discounting 27,366 Discounting (777) Lease liabilities as at 1 April 2019 according IFRS 16 26,589 The item “Adjustments arising from termination or extension options” mainly includes obligations arising from the rental of factory premises and buildings amounting to € 17.7 million. The remaining amount primarily consists of rentals of office space as well as furniture and office equipment. The Group assessed the underlying extension and termination options and took them into account accordingly. The assumptions made in this context may deviate from the original estimates in the future and may have an effect on right-of-use assets and lease liabilities. For contracts concluded prior to the date of transition, an analysis was conducted to determine whether a lease according to IFRS 16 exists. Direct costs were not taken into account in the measurement of right-of-use assets at the time of initial application. Moreover, previous assessments were adopted as to whether a lease is onerous as an alternative to conducting impairment tests. As of 1 April 2019 no onerous contracts existed. Lease liabilities were discounted using the incremental borrowing rate at 1 April 2019. The weighted average interest rate amounted to 1.37%. Annual improvements to IFRS 2015 – 2017 In the course of the annual improvements of IFRS (Improvements Project 2015-2017) clarifications were made with regard to IAS 12 Income Taxes. All income tax consequences of dividend payments must be considered in the same way as the earnings on which the dividends are based. They must therefore be recognised through profit or loss, unless the dividends are based on income which is recognised directly through other comprehensive income or in equity. These changes are mandatory for financial years starting on or after 1 January 2019. The application of these changes is therefore mandatory for the ATS Group as of 1 April 2019, i.e. for the first time for the financial year 2019/20. The application must be retrospective. Consequently, the comparative values of the previous year must be adjusted. The positive income tax effect on hybrid capital interest of € 2,078 thousand in the financial year 2018/19 was retrospectively recognised under the item “Income taxes” in the statement of profit or loss rather than directly in equity.
  • 138.
    134 CONSOLIDATED FINANCIAL ­STATEMENTSANNUALREPORT 2019/20AT S FIRST CHOICE FOR ADVANCED APPLICATIONSATS ANNUAL REPORT 2019/20 CONSOLIDATED FINANCIAL STATEMENTS FIRST CHOICE FOR ADVANCED APPLICATIONS 55 The following table shows the effects of the application of IAS 12 on the relevant items of the consolidated statement of profit or loss for the financial year 2018/19: 1 Apr 2018—31 March 2019 € in thousands Before IAS 12 adjustment Remeasurement After IAS 12 adjustment Revenue 1,027,983 – 1,027,983 Costs of sales (860,828) – (860,828) Gross profit 167,155 – 167,155 Operating result 117,210 – 117,210 Profit/(loss) before tax 115,192 – 115,192 Income taxes (28,243) 2,078 (26,165) Profit/(loss) for the period 86,949 2,078 89,027 The changes in IAS 12 had no effect on the consolidated statement of financial position and the consolidated statement of cash flows for the financial year 2018/19. The first-time adoption of the other amended standards did not result in any material effects. C. Critical accounting estimates and assumptions used in accounting and measurement The Group uses estimates and assumptions to determine the reported amounts of assets, liabilities, revenue and expenses, as well as other financial liabilities, and contingent assets and liabilities. All estimates and assumptions are reviewed on a regular basis and are based on past experiences and additional factors, including expectations regarding future events that seem reasonable under the given circumstances. In the future, actual results may differ from these estimates. Management believes that the estimates are reasonable. Development costs Capitalised development costs largely relate to the development of a new technology for the production of substrates for silicon semiconductor chips at the new site in Chongqing, China. This technology was available for use from March 2016 onwards and amortisation began. In financial year 2019/20 development costs for the new substrate generation in the amount of € 2,892 thousand were capitalised. The use of this new production method is expected to begin in the first half of 2021/22. For the purpose of assessing impairment of capitalised development costs, the management made assumptions in the financial year 2019/20 regarding the amount of expected future cash flows from the project, the applicable discount rate and the period of inflow of the expected future benefit. An increase in material assumptions would have the following impact to the impairment test as of 31 March 2020: Pre-tax discount Interest rate EBIT margin +5.00% +1,5 pp Capitalised development costs no impairment required no impairment required
  • 139.
    CONSOLIDATED FINANCIAL ­STATEMENTS 135 FIRSTCHOICE FOR ADVANCED APPLICATIONS ANNUAL REPORT 2019/20AT S ATS ANNUAL REPORT 2019/20 CONSOLIDATED FINANCIAL STATEMENTS FIRST CHOICE FOR ADVANCED APPLICATIONS 56 A reduction of material assumptions would have the following impact to the impairment test as of 31 March 2020: Pre-tax discount Interest rate EBIT margin -5.00% -1,5 pp Capitalised development costs no impairment required no impairment required Calculation of the present values of projected employee benefit obligations The present value of non-current employee benefit obligations depends on various factors that are based on actuarial assumptions (refer to I.B.o. “Provisions for employee benefits”). These actuarial assumptions used to calculate the pension expenses and the expected defined benefit obligations were subjected to stress tests using the following parameters: An increase in the interest rate, in the expected remuneration and/or in future pensions for the Austrian entities by the percentage points stated in the table below would affect the present values of the projected pension and severance payment obligations as follows as at 31 March 2020: Interest rate Increase in remuneration Increase in pensions € in thousands +0.50% +0.25% +0.25% Pension obligation (1,318) 94 620 Severance payments (1,449) 731 – A decrease in the same parameters for the Austrian companies would have the following effects on the present value of pension and severance payment obligations as at 31 March 2020: Interest rate Increase in remuneration Increase in pensions € in thousands -0.50% -0.25% -0.25% Pension obligation 1,483 (92) (553) Severance payments 1,577 (705) – Reference is made to Note 16 “Provisions for employee benefits”. Measurement of deferred income tax and current tax liabilities Deferred income tax assets and liabilities are determined using the tax rates (and laws) that have been enacted or substantively enacted by the balance sheet date and are expected to apply when the related deferred income tax asset is realised or the deferred income tax liability is settled. A future change in tax rates would also have an impact on the deferred tax capitalised at the balance sheet date. Deferred income tax assets in the amount of € 61,349 thousand were not recognised for income tax loss carryforwards in the Group of € 408,992 thousand. If the tax losses were subsequently expected to be realised, these deferred income tax assets would have to be recognised and a related tax income reported. Reference is made to Note 6 “Income taxes”. Moreover, a different interpretation of tax laws by fiscal authorities could also lead to a change in income tax liabilities.
  • 140.
    136 CONSOLIDATED FINANCIAL ­STATEMENTSANNUALREPORT 2019/20AT S FIRST CHOICE FOR ADVANCED APPLICATIONSATS ANNUAL REPORT 2019/20 CONSOLIDATED FINANCIAL STATEMENTS FIRST CHOICE FOR ADVANCED APPLICATIONS 57 Other estimates and assumptions Further estimates, if necessary, relate to impairments of non-current assets and provisions, as well as the measurement of derivative financial instruments, allowances for doubtful accounts receivable and measurements of inventory. Reference is particularly made to Note 4 “Other operating result”, Note 7 “Property, plant and equipment”, Note 8 “Intangible assets” and Note 17 “Other provisions”.
  • 141.
    CONSOLIDATED FINANCIAL ­STATEMENTS 137 FIRSTCHOICE FOR ADVANCED APPLICATIONS ANNUAL REPORT 2019/20AT S ATS ANNUAL REPORT 2019/20 CONSOLIDATED FINANCIAL STATEMENTS FIRST CHOICE FOR ADVANCED APPLICATIONS 58 The segment information presented below is prepared in accordance with the management approach concept as depicted in the Group’s internal reporting (refer to Section I.B.b. “Segment Reporting”). The reportable segments consist of the business units Mobile Devices Substrates, Automotive, Industrial, Medical and Others. The Others segment further includes the general holding activities of the Group. The central operating result performance indicator is the operating result before depreciation and amortisation. The respective reconciliation to Group figures also includes the corresponding consolidation. Transfers and transactions between the segments are executed at arm’s length, as with independent third parties. Segment reporting is prepared in accordance with the principles set out in I.B. “Accounting and measurement policies”. € in thousands Mobile Devices Substrates Automotive, Industrial, Medical Others Elimination/ Consolidation Group 2019/20 2018/19 2019/20 2018/19 2019/20 2018/19 2019/20 2018/19 2019/20 2018/19 Segment revenue 778,457 775,959 350,446 365,219 – 5,268 (128,326) (118,463) 1,000,577 1,027,983 Internal revenue (92,589) (92,094) (35,737) (26,369) – – 128,326 118,463 – – External revenue 685,868 683,865 314,709 338,850 – 5,268 – – 1,000,577 1,027,983 Operating result before depreciation/amortisation 158,561 193,507 28,881 52,622 7,087 3,969 – – 194,529 250,098 Depreciation/amortisation incl. appreciation (120,862) (112,720) (23,240) (18,570) (3,025) (1,598) – – (147,127) (132,888) Operating result 37,699 80,787 5,641 34,052 4,062 2,371 – – 47,402 117,210 Finance costs - net (6,465) (2,018) Profit before tax 40,937 115,192 Income taxes 1) (19,481) (26,165) Profit for the year 1) 21,456 89,027 Property, plant and equipment and intangible assets 788,225 711,119 151,553 122,043 8,806 4,701 – – 948,584 837,863 Additions to property, plant and equipment and intangible assets 215,984 69,614 33,245 36,105 5,073 3,077 – – 254,302 108,796 1) 2018/19 revised according to IAS 12 II. SEGMENT REPORTING
  • 142.
    138 CONSOLIDATED FINANCIAL ­STATEMENTSANNUALREPORT 2019/20AT S FIRST CHOICE FOR ADVANCED APPLICATIONSATS ANNUAL REPORT 2019/20 CONSOLIDATED FINANCIAL STATEMENTS FIRST CHOICE FOR ADVANCED APPLICATIONS 59 Information by geographic region Revenue broken down by region, based on customer’s headquarters: € in thousands 2019/20 2018/19 Austria 16,489 19,704 Germany 141,092 173,687 Other European countries 77,932 81,153 China 26,507 14,149 Other Asian countries 54,770 56,771 Americas 683,787 682,519 Revenue 1,000,577 1,027,983 67.6% of total revenue (previous year: 64.0%) is attributable to the five largest customers in terms of revenue, where the range is between 2% and 33% as in the previous year. Property, plant and equipment and intangible assets broken down by domicile: € in thousands 31 Mar 2020 31 Mar 2019 Austria 106,173 73,275 China 787,932 711,064 Others 54,479 53,524 Total 948,584 837,863
  • 143.
    CONSOLIDATED FINANCIAL ­STATEMENTS 139 FIRSTCHOICE FOR ADVANCED APPLICATIONS ANNUAL REPORT 2019/20AT S ATS ANNUAL REPORT 2019/20 CONSOLIDATED FINANCIAL STATEMENTS FIRST CHOICE FOR ADVANCED APPLICATIONS 60 1. Revenue € in thousands 2019/20 2018/19 Main revenue 1,000,421 1,027,829 Incidental revenue 156 154 Revenue 1,000,577 1,027,983 The main revenue is achieved by selling printed circuits boards, which are produced by ATS. The following table shows the distribution of revenue recognised at a point in time and over time by segment: Mobile Devices Substrates Automotive, Industrial, Medical Others Group € in thousands 2019/20 2018/19 2019/20 2018/19 2019/20 2018/19 2019/20 2018/19 Segment revenue 685,868 683,865 314,709 338,850 – 5,268 1,000,577 1,027,983 Type of revenue recognition Point in time 355,456 421,005 – – – 355,456 421,005 Over time 330,412 262,860 314,709 338,850 – 5,268 645,121 606,978 2. Types of expenses The expense types of cost of sales, distribution costs and general and administrative costs are as follows: € in thousands 2019/20 2018/19 Cost of materials 404,323 377,284 Staff costs 252,513 237,781 Depreciation/amortisation 146,075 132,852 Purchased services incl. leased personnel 14,022 18,291 Energy 48,842 46,829 Maintenance (incl. spare parts) 75,071 64,950 Transportation costs 15,183 14,147 Rental and leasing expenses 6,651 8,199 Change in inventories (29,026) 1,373 Other 32,463 26,438 Total 966,117 928,144 In the financial years 2019/20 and 2018/19, the item “Other” mainly relates to travel expenses, insurance expenses, IT service costs, legal and consulting fees. III. NOTES TO THE CONSOLIDATED STATEMENT OF PROFIT OR LOSS
  • 144.
    140 CONSOLIDATED FINANCIAL ­STATEMENTSANNUALREPORT 2019/20AT S FIRST CHOICE FOR ADVANCED APPLICATIONSATS ANNUAL REPORT 2018/19 CONSOLIDATED FINANCIAL STATEMENTS FIRST CHOICE FOR ADVANCED APPLICATIONS 61 3. Research and development costs In the financial year 2019/20, the Group incurred research and development costs in the amount of € 94,765 thousand (previous year: € 75,650 thousand). The stated amounts represent only costs which can be directly allocated and which are recognised in the profit or loss under cost of sales. In these consolidated financial statements, development costs of € 2,892 thousand (previous year: € 0 thousand) were capitalised. Reference is made to Note 8 “Intangible assets”. 4. Other operating result € in thousands 2019/20 2018/19 Income from the reversal of government grants 1,949 1,940 Government grants for expenses 9,423 6,143 Income from exchange differences 5,730 8,464 Income from reversal of accruals/provision 65 – Miscellaneous other income 881 2,311 Other operating income 18,048 18,858 Impairments of property, plant and equipment (912) – Start-up losses (3,452) (1,247) Losses from the disposal of non-current assets (732) (37) Other costs (10) (203) Other operating costs (5,106) (1,487) Other operating result 12,942 17,371 In the financial years 2019/20 and 2018/19, government grants for expenses mainly relate to export refunds, research and development grants as well as funding for industry and employment development. Start-up losses in the financial year 2019/20 resulted from the extensions of a production line in the plant in Leoben, Austria, and in the plants in Chongqing, China, and in financial year 2018/19 from the extensions of the plant in Fehring, Austria, and the plant in Nanjangud, India. In the financial year 2019/20 and 2018/19, the item “Miscellaneous other income” mainly relates to write-offs of other liabilities, payments of impaired receivables, and similar to last year, to grants for employees, and services in kind for miscellaneous projects.
  • 145.
    CONSOLIDATED FINANCIAL ­STATEMENTS 141 FIRSTCHOICE FOR ADVANCED APPLICATIONS ANNUAL REPORT 2019/20AT S ATS ANNUAL REPORT 2018/19 CONSOLIDATED FINANCIAL STATEMENTS FIRST CHOICE FOR ADVANCED APPLICATIONS 62 5. Finance costs - net € in thousands 2019/20 2018/19 Interest income from financial assets at fair value through profit or loss and financial assets at amortised cost 20 24 Other interest income 6,689 4,915 Gains from the measurement of derivative financial instruments at fair value, net 462 1,031 Foreign exchange gains, net 3,827 9,202 Finance income 10,998 15,172 Interest expense on bank borrowings and bonds (11,420) (12,172) Net interest expense on personnel-related liabilities (1,124) (1,066) Realised losses from derivative financial instruments, net (2,007) (1,133) Other financial expenses (2,912) (2,819) Finance costs (17,463) (17,190) Finance costs - net (6,465) (2,018) In accordance with IAS 23, the item “Interest expense on bank borrowings and bonds” includes capitalised borrowing costs in the amount of € 398 thousand (previous year: € 236 thousand), net. 6. Income taxes Income tax expenses are broken down as follows: € in thousands 2019/20 2018/19 Current income taxes 1) 11,981 13,623 Deferred taxes 7,500 12,542 Total tax expense 19,481 26,165 1) 2018/19 adjusted taking into account IAS 12 revised The difference between the Group’s actual tax expense and the theoretical amount that would arise using the Austrian corporate income tax rate is as follows: € in thousands 2019/20 2018/19 Expected tax expense at Austrian tax rate 10,235 28,797 Effect of different tax rates in foreign countries (1,536) (5,617) Non-creditable foreign withholding taxes 2,501 1,857 Effect of change in valuation allowance of deferred income tax assets 10,879 4,418 Effect of the change in tax rate 3,118 3,349 Effect of permanent differences 1) (5,975) (6,594) Effect of taxes from prior periods 259 (45) Total tax expense 19,481 26,165 1) 2018/19 adjusted taking into account IAS 12 revised The effect of the change in tax rates mainly results from the reduced tax rate of 15% , which is applicable once again, with regard to the subsidiary ATS China compared to the regular tax rate of 25%. In the course of the annual improvements of the IFRS (Improvements Project 2015-2017), clarifications were made regarding IAS 12 Income Taxes. Therefore, the positive income tax effect on hybrid capital
  • 146.
    142 CONSOLIDATED FINANCIAL ­STATEMENTSANNUALREPORT 2019/20AT S FIRST CHOICE FOR ADVANCED APPLICATIONSATS ANNUAL REPORT 2018/19 CONSOLIDATED FINANCIAL STATEMENTS FIRST CHOICE FOR ADVANCED APPLICATIONS 63 interest of € 2,078 thousand in the financial year 2018/19 was retroactively recognised through profit or loss under “Income taxes” rather than directly in equity. Reference is made to I. “General information”. Deferred income tax assets and liabilities are offset when there is a legally enforceable right to offset current tax assets against current tax liabilities and when the deferred taxes and liabilities relate to taxes levied by the same taxation authority. The amounts after setting off deferred income tax assets against deferred liabilities are as follows: € in thousands 31 Mar 2020 31 Mar 2019 Assets Liabilities Assets Liabilities Non-current assets 8,152 (10,901) 16,266 (5,083) Provisions for employee benefits 7,258 – 6,687 – Financial liabilities 6,443 – – – Income tax loss carryforwards including taxable goodwill 81,001 – 68,479 – Deferred income tax from long-term assets/liabilities 102,854 (10,901) 91,432 (5,083) Inventories 12,790 – 12,423 – Trade and other receivables and contract assets 51 (12,975) 56 (13,358) Trade and other payables 1,496 – 1,587 – Others 897 (274) 1,291 (190) Temporary differences arising from shares in subsidiaries – (3,166) – (5,547) Deferred income tax from short-term assets/liabilities 15,234 (16,415) 15,357 (19,095) Deferred income tax assets/liabilities 118,088 (27,316) 106,789 (24,178) Unrecognised deferred taxes (67,954) – (52,603) – Deferred income tax assets/liabilities, offsetting against the same taxation authority (24,150) 24,150 (18,631) 18,631 Deferred income tax assets/liabilities, net 25,984 (3,166) 35,555 (5,547) As of 31 March 2020, the Group has income tax loss carryforwards and tax-deductible amortisation of goodwill amounting to a total of € 487,544 thousand (previous year: € 395,769 thousand). For loss carryforwards amounting to € 408,992 thousand (previous year: € 305,538 thousand) included in this figure, deferred income tax assets in the amount of € 61,349 thousand (previous year: € 45,831 thousand) were not recognised since it is unlikely that they will be realised in the foreseeable future. In addition, for temporary differences amounting to € 44,034 thousand (previous year: € 45,147 thousand) included in this figure, deferred income tax assets in the amount of € 6,605 thousand (previous year: € 6,772 thousand) were not recognised since it is likewise unlikely that they will be realised in the foreseeable future. The tax loss carryforwards, which were not recognised, can be carried forward as follows: € in thousands 2019/20 2018/19 Carried forward up to 5 years – 280,433 Carried forward between 6 and 10 years 377,564 25,105 Carried forward more than 10 years 31,428 – Total unrecognised tax loss carryforwards 408,992 305,538
  • 147.
    CONSOLIDATED FINANCIAL ­STATEMENTS 143 FIRSTCHOICE FOR ADVANCED APPLICATIONS ANNUAL REPORT 2019/20AT S ATS ANNUAL REPORT 2018/19 CONSOLIDATED FINANCIAL STATEMENTS FIRST CHOICE FOR ADVANCED APPLICATIONS 64 Deferred income taxes (net) changed as follows: € in thousands 2019/20 2018/19 Carrying amount at the beginning of the financial year 30,008 40,461 Adjustment IFRS 15, 9 – (2,686) Currency translation differences (427) 361 Expense recognised in profit or loss (7,500) (12,542) Income taxes recognised in equity 737 4,414 Carrying amount at the end of the financial year 22,818 30,008 Income taxes in connection with the components of other comprehensive income are as follows: 2019/20 2018/19 € in thousands Income/ (expense) before taxes Tax income/ (expense) Income/ (expense) after taxes Income/ (expense) before taxes Tax income/ (expense) Income/ (expense) after taxes Currency translation differences (30,617) 325 (30,292) 26,567 (2,101) 24,466 Gains/(losses) on the measurement of hedging instruments for cash flow hedges (2,189) 547 (1,642) (4,973) 1,243 (3,730) Remeasurements of post-employment obligations (1,418) 327 (1,091) (7,714) 1,917 (5,797) Other comprehensive income (34,224) 1,199 (33,025) 13,880 1,059 14,939
  • 148.
    144 CONSOLIDATED FINANCIAL ­STATEMENTSANNUALREPORT 2019/20AT S FIRST CHOICE FOR ADVANCED APPLICATIONSATS ANNUAL REPORT 2019/20 CONSOLIDATED FINANCIAL STATEMENTS FIRST CHOICE FOR ADVANCED APPLICATIONS 65 7. Property, plant and equipment € in thousands Land, plants and buildings Machinery and technical equipment Tools, fixtures, furniture and office equipment Prepayments and construction in progress Total Carrying amount 31 Mar 2018 90,008 627,973 8,556 39,841 766,378 Exchange differences 2,315 15,550 139 1,290 19,294 Additions 6,351 48,482 3,401 48,176 106,410 Disposals ‒ (811) (43) ‒ (854) Transfers 244 36,226 380 (36,850) ‒ Depreciation, current (7,321) (102,849) (3,316) ‒ (113,486) Carrying amount 31 Mar 2019 91,597 624,571 9,117 52,457 777,742 Thereof Acquisition cost 153,882 1,542,539 31,427 52,457 1,780,305 Accumulated depreciation (62,285) (917,968) (22,310) ‒ (1,002,563) Adjustment IFRS 16 23,770 ‒ 2,819 ‒ 26,589 Carrying amount 1 Apr 2019 115,367 624,571 11,936 52,457 804,331 Exchange differences (2,573) (15,792) (206) (1,943) (20,514) Additions 3,028 89,598 3,449 151,865 247,940 Disposals (42) (1,316) (11) (2) (1,371) Transfers 1,888 27,516 110 (29,539) (25) Impairment ‒ (912) ‒ ‒ (912) Depreciation, current (10,389) (111,136) (4,415) ‒ (125,940) Carrying amount 31 Mar 2020 107,279 612,529 10,863 172,838 903,509 Thereof Acquisition cost 178,227 1,605,493 36,179 172,838 1,992,737 Accumulated depreciation (70,948) (992,964) (25,316) ‒ (1,089,228) The value of the land included in “Land, plants and buildings” amounts to € 6,077 thousand (previous year: € 6,293 thousand). The following table shows the usage rights reported separately in accordance with IFRS 16, which are included in property, plant and equipment as of 31 March, 2020: € in thousands Land, plants and buildings Machinery and technical equipment Tools, fixtures, furniture and office equipment Prepayments and construction in progress Total Acquisition Cost 25,367 ‒ 3,261 ‒ 28,628 Thereof additions 1,597 ‒ 442 ‒ 2,039 Depreciation (2,715) ‒ (917) ‒ (3,632) Carrying amount 31 Mar 2020 22,652 ‒ 2,344 ‒ 24,996 IV.NOTES TO THE CONSOLIDATED STATEMENT OF FINANCIAL POSITION
  • 149.
    CONSOLIDATED FINANCIAL ­STATEMENTS 145 FIRSTCHOICE FOR ADVANCED APPLICATIONS ANNUAL REPORT 2019/20AT S ATS ANNUAL REPORT 2019/20 CONSOLIDATED FINANCIAL STATEMENTS FIRST CHOICE FOR ADVANCED APPLICATIONS 66 In the 2019/20 financial year, the following lease expenses were showed in the income statement: € in thousands 2019/20 2018/19 Lease expenses from the short-term lease agreement 1,891 – Lease expenses from the low-value lease agreements 455 – Depreciation of rights of use 3,632 – Interest expenses of the lease liabilities 336 – Depreciation in the current financial year is recognised mainly in cost of sales, as well as in distribution costs, general and administrative costs, and in start-up losses recognised under other operating result. In the financial year 2019/20, borrowing costs on qualifying assets of € 398 thousand were capitalised (previous year: € 236 thousand). Interest rates between 1.58% and 3.5% were applied (previous year: 3.5% and 5.0%). There is no restraint on disposal for the recognised fixed assets. Impairment/Reversal of impairment Impairment of machinery and technical equipment amounted to € 912 thousand (previous year: € 0 thousand) in the financial year 2019/20. This impairment resulted from machines that are no longer usable in the segment Mobile Devices Substrates.
  • 150.
    146 CONSOLIDATED FINANCIAL ­STATEMENTSANNUALREPORT 2019/20AT S FIRST CHOICE FOR ADVANCED APPLICATIONSATS ANNUAL REPORT 2019/20 CONSOLIDATED FINANCIAL STATEMENTS FIRST CHOICE FOR ADVANCED APPLICATIONS 67 8. Intangible assets € in thousands Industrial property and similar rights and assets, and licenses in such rights and assets Capitalised development costs Goodwill Prepayments Other intangible assets Total Carrying amount 31 Mar 2018 11,128 64,728 ‒ ‒ ‒ 75,856 Exchange differences 26 1,254 ‒ ‒ ‒ 1,280 Additions 2,162 ‒ ‒ ‒ 224 2,386 Amortisation, current (3,364) (15,813) ‒ ‒ (224) (19,401) Carrying amount 31 Mar 2019 9,952 50,169 ‒ ‒ ‒ 60,121 Thereof Acquisition cost 34,113 97,396 7,255 ‒ ‒ 138,764 Accumulated amortisation (24,161) (47,227) (7,255) ‒ ‒ (78,643) Exchange differences (23) (1,135) ‒ 1 ‒ (1,157) Additions 3,015 2,892 ‒ 21 434 6,362 Transfers 25 ‒ ‒ ‒ ‒ 25 Amortisation, current (3,919) (15,923) ‒ ‒ (434) (20,276) Carrying amount 31 Mar 2020 9,050 36,003 ‒ 22 ‒ 45,075 Thereof Acquisition cost 36,933 97,957 6,902 22 ‒ 141,814 Accumulated amortisation (27,883) (61,954) (6,902) ‒ ‒ (96,739) Amortisation for the current financial year is charged to cost of sales, distribution costs, general and administrative costs and other operating result. Development costs of € 2,892 thousand (previous year: € 0 thousand) were capitalised in the financial year 2019/20. Impairment In the financial year 2019/20 no impairment was recognised on intangible assets. The impairment test for the cash-generating unit Substrates for the not yet completed development of the next substrate generation is based on calculations of the value in use. The value in use is determined using a DCF method. The main measurement assumptions are:  Long-term growth rate: 0%  (Pre-tax) discount rate: 13.04% Due to the long-term nature of the project and to adequately account for cash outflows from the substrate business expected in future periods, the calculation of the value in use was based on the expected cash flows for the next 6 years. A consideration over a shorter period of time would lead to a disproportionately increased weighting of cash inflows.
  • 151.
    CONSOLIDATED FINANCIAL ­STATEMENTS 147 FIRSTCHOICE FOR ADVANCED APPLICATIONS ANNUAL REPORT 2019/20AT S ATS ANNUAL REPORT 2019/20 CONSOLIDATED FINANCIAL STATEMENTS FIRST CHOICE FOR ADVANCED APPLICATIONS 68 9. Other non-current assets € in thousands 31 Mar 2020 31 Mar 2019 Prepayments 5,203 5,482 Deposits made 7,893 7,333 Other non-current receivables 8,162 11,849 Carrying amount 21,258 24,664 Prepayments relate to factory premises in China. Other non-current receivables comprise input tax reimbursements in China for the plant in Chongqing, which will be recovered gradually through VAT liabilities during the operating phase. 10. Inventories € in thousands 31 Mar 2020 31 Mar 2019 Raw materials and supplies 69,012 50,446 Work in progress 19,716 10,601 Finished goods 19,645 23,418 Carrying amount 108,373 84,465 The balance of inventory write-downs recognised as an expense amounts to € 22,437 thousand as of 31 March 2020 (previous year: € 27,489 thousand). The immaterial write-downs amounting to € 578 thousand (previous year: € 774 thousand) resulted from the measurement of inventories at net realisable value in the financial year 2019/20. The write-downs are recognised in the cost of sales in the statement of profit or loss.
  • 152.
    148 CONSOLIDATED FINANCIAL ­STATEMENTSANNUALREPORT 2019/20AT S FIRST CHOICE FOR ADVANCED APPLICATIONSATS ANNUAL REPORT 2019/20 CONSOLIDATED FINANCIAL STATEMENTS FIRST CHOICE FOR ADVANCED APPLICATIONS 69 11. Trade and other receivables and contract assets The carrying amounts of trade and other receivables and contract assets are as follows: € in thousands 31 Mar 2020 31 Mar 2019 Trade receivables 67,413 108,488 Impairments of trade receivables (653) (390) Contract assets 67,882 72,447 Impairments of contract assets (119) (140) VAT receivables 42,025 35,759 Other receivables from authorities 5,227 4,375 Prepayments 6,162 5,001 Energy tax refunds 2,083 1,394 Deposits 1,423 1,353 Other receivables 990 758 Total 192,433 229,045 As at 31 March 2020 and 31 March 2019, other receivables mainly include receivables resulting from prepaid expenses and accrued charges. Trade receivables amounting to € 10,000 thousand (previous year: € 10,000 thousand) act as collateral in connection with various financing agreements. Reference is made to Note 15 “Financial liabilities”. Taking impairment into account, the carrying amounts of trade and other receivables and contract assets approximate their fair values. Remaining maturities of receivables All receivables as at 31 March 2020 and 31 March 2019 have remaining maturities of less than one year. Factoring As of 31 March 2020, trade receivables totalling € 98,567 thousand (previous year: € 40,595 thousand) were assigned to banks to the amount of 100% of the nominal value and are fully derecognised in accordance with the regulations of IFRS 9 on the basis of the cessions of the essential opportunities and risks and on the basis of the transfer of the right to use to the acquiring party. The default risk was assigned to the purchaser. ATS assumes a liability for default to the amount of the retention level from the credit insurance. The maximum risk associated with liability for default was € 9,857 thousand as of 31 March 2020 (previous year: € 4,060 thousand) less coverage of the credit insurance applied. Claims of existing credit insurances were transferred to the purchaser. The part of the purchasing price not yet paid by the acquiring party is shown under the item “Financial assets”. Payments from customers of assigned trade receivables are presented in the short term financial liabilities.
  • 153.
    CONSOLIDATED FINANCIAL ­STATEMENTS 149 FIRSTCHOICE FOR ADVANCED APPLICATIONS ANNUAL REPORT 2019/20AT S ATS ANNUAL REPORT 2019/20 CONSOLIDATED FINANCIAL STATEMENTS FIRST CHOICE FOR ADVANCED APPLICATIONS 70 Contract assets have developed as follows: € in thousands 2019/20 2018/19 Contract assets at the beginning of the financial year 72,307 48,702 Utilisation (72,307) (48,702) Addition 67,882 72,447 Impairment according to IFRS 9 (119) (140) Contract assets at the end of the financial year 67,763 72,307 Development of past due receivables and impairments of trade receivables The age structure of trade receivables and impairment is shown in the table below: 31 Mar 2020 € in thousands Gross receivables Impairments Carrying amount not due 61,630 (183) 61,447 1 - 15 days overdue 2,563 (16) 2,547 16 - 30 days overdue 1,427 (13) 1,414 31 - 60 days overdue 866 (13) 853 61 - 90 days overdue 169 (1) 168 more than 90 days overdue 758 (427) 331 Trade receivables 67,413 (653) 66,760 31 Mar 2019 € in thousands Gross receivables Impairments Carrying amount not due 100,579 (177) 100,402 1 - 15 days overdue 5,574 (29) 5,545 16 - 30 days overdue 916 (8) 908 31 - 60 days overdue 971 (15) 956 61 - 90 days overdue 183 (3) 180 more than 90 days overdue 265 (158) 107 Trade receivables 108,488 (390) 108,098 There were no indications at the balance sheet date that overdue trade receivables not impaired would not be paid. Impairments of trade receivables are recognised if there are indications (past due, insolvency) that it is unlikely that the total amount can be collected. Receivables are derecognised if, on a legal basis, it can be assumed that no payment is to be expected anymore. There was no write-off of trade receivables in the financial year 2019/20.
  • 154.
    150 CONSOLIDATED FINANCIAL ­STATEMENTSANNUALREPORT 2019/20AT S FIRST CHOICE FOR ADVANCED APPLICATIONSATS ANNUAL REPORT 2019/20 CONSOLIDATED FINANCIAL STATEMENTS FIRST CHOICE FOR ADVANCED APPLICATIONS 71 Impairments of trade receivables have developed as follows: € in thousands 2019/20 2018/19 Impairments at the beginning of the financial year 390 168 Adjustment IFRS 9 – 211 Impairments after adjustment IFRS 9 390 379 Utilisation – (17) Reversal (93) (76) Addition 372 92 Currency translation differences (16) 12 Impairments at the end of the financial year 653 390 Expected credit losses in accordance with the expected credit loss model according to IFRS 9 account for € 231 thousand of the impairments of the financial year (previous year: € 236 thousand). 12. Financial assets The carrying amounts of the financial assets are as follows: € in thousands 31 Mar 2020 thereof non-current thereof current Financial assets at fair value through profit or loss 893 – 893 Financial assets at fair value through OCI 193 193 – Financial assets at amortised cost 135,275 – 135,275 Derivatives 74 – 74 Total 136,435 193 136,242 € in thousands 31 Mar 2019 thereof non-current thereof current Financial assets at fair value through profit or loss 896 – 896 Financial assets at fair value through OCI 193 193 – Financial assets at amortised cost 238,856 – 238,856 Total 239,945 193 239,752 Financial assets at fair value through profit or loss € in thousands 31 Mar 2020 31 Mar 2019 Bonds 893 896 Total 893 896 All bonds are denominated in euro (nominal currency).
  • 155.
    CONSOLIDATED FINANCIAL ­STATEMENTS 151 FIRSTCHOICE FOR ADVANCED APPLICATIONS ANNUAL REPORT 2019/20AT S ATS ANNUAL REPORT 2019/20 CONSOLIDATED FINANCIAL STATEMENTS FIRST CHOICE FOR ADVANCED APPLICATIONS 72 Financial assets at fair value through OCI € in thousands 2019/20 2018/19 Carrying amount at the beginning of the year 193 193 Additions/(Disposals) – – Carrying amount at the end of the year 193 193 All financial assets at fair value through OCI are denominated in euro (nominal currency). Financial assets at amortised cost Financial assets at amortised cost are denominated in euros, US dollars and Chinese yuan renminbi (nominal currencies). They mainly consist of notice deposits with a maturity of more than three months and factored receivables against banks. Derivative financial instruments € in thousands 31 Mar 2020 31 Mar 2019 Derivative financial instruments 74 – Total 74 – 13. Cash and cash equivalents € in thousands 31 Mar 2020 31 Mar 2019 Bank balances and cash on hand 417,950 326,841 Carrying amount 417,950 326,841 The reported carrying amounts correspond to the respective fair values.
  • 156.
    152 CONSOLIDATED FINANCIAL ­STATEMENTSANNUALREPORT 2019/20AT S FIRST CHOICE FOR ADVANCED APPLICATIONSATS ANNUAL REPORT 2019/20 CONSOLIDATED FINANCIAL STATEMENTS FIRST CHOICE FOR ADVANCED APPLICATIONS 73 14. Trade and other payables Remaining maturity € in thousands 31 Mar 2020 Less than 1 year Between 1 and 5 years More than 5 years Trade payables 169,060 169,060 ‒ ‒ Government grants 14,381 1,000 8,315 5,066 Liabilities to fiscal authorities and other state authorities 5,499 5,499 ‒ ‒ Liabilities to social security authorities 8,120 8,120 ‒ ‒ Liabilities from unconsumed leave 6,300 6,300 ‒ ‒ Liabilities from stock appreciation rights 199 4 195 ‒ Liabilities to employees 17,763 17,763 ‒ ‒ Other liabilities 6,291 6,271 20 ‒ Carrying amount 227,613 214,017 8,530 5,066 Remaining maturity € in thousands 31 Mar 2019 Less than 1 year Between 1 and 5 years More than 5 years Trade payables 131,936 131,936 ‒ ‒ Government grants 16,486 1,122 7,524 7,840 Liabilities to fiscal authorities and other state authorities 3,307 3,307 ‒ ‒ Liabilities to social security authorities 5,057 5,057 ‒ ‒ Liabilities from unconsumed leave 5,888 5,888 ‒ ‒ Liabilities from stock appreciation rights 1,000 190 810 ‒ Liabilities to employees 25,170 25,170 ‒ ‒ Other liabilities 7,306 7,284 22 ‒ Carrying amount 196,150 179,954 8,356 7,840 The carrying amounts of the reported liabilities approximate the respective fair values. Government grants Government grants mainly relate to grants for land-use rights and property, plant and equipment and are released to profit or loss according to the useful life of the related property, plant and equipment. Furthermore, the Group received grants for project costs for several research projects which are recognised in income on a pro rata basis according to the costs incurred and the grant ratio. Associated deferred amounts are included in government grants. Liabilities from stock appreciation rights Due to the expiry of the stock option plan (2009 to 2012), the 81st Supervisory Board meeting on 3 July 2014 passed a resolution to introduce a long-term incentive programme based on stock appreciation rights (SARs). SARs relate to the value increase in share prices based on the development of the share price. SAR were granted in the period between 1 April 2014 and 1 April 2016. Due to the expiry of the stock appreciation rights plan (2014 to 2016), the 91st Supervisory Board meeting on 6 June 2016 extended the resolution to introduce a long-term incentive programme based on stock appreciation rights (SAR plan 2017) to run for three years. The stock appreciation rights were granted between 1 April 2017 and 1 April 2019. Each SAR entitles the holder the right to a cash settlement at the remaining amount between the exercise price and the closing price of the ATS share on the main stock exchange on which it is listed (currently the Vienna Stock Exchange) at the date the subscription right is exercised. The difference amount is limited to 200% of the exercise price.
  • 157.
    CONSOLIDATED FINANCIAL ­STATEMENTS 153 FIRSTCHOICE FOR ADVANCED APPLICATIONS ANNUAL REPORT 2019/20AT S ATS ANNUAL REPORT 2019/20 CONSOLIDATED FINANCIAL STATEMENTS FIRST CHOICE FOR ADVANCED APPLICATIONS 74 The exercise price of SAR is determined at the respective date of grant, corresponding to the average closing price of the ATS share on the Vienna Stock Exchange or at the main stock exchange on which the ATS share is listed over a period of six calendar months immediately preceding the date of grant. SARs may be exercised in full or in part after the respective completion of a three-year period following the date of grant, but not during a restricted period. Granted stock appreciation rights not exercised within five years after the grant date become invalid and forfeit without compensation. SARs may only be exercised by the beneficiaries if the following requirements are met at the date of exercise:  The beneficiary’s employment contract with a company in the ATS Group remains valid. Subject to certain conditions, rights may also be exercised within a year after termination of the employment contract.  The required personal investment in the amount of 20% of the first amount granted (in SARs) in ATS shares is held. If the personal investment is not fully established by the end of the three-year waiting period, all previously granted SARs become forfeited in full. The established personal investment must be held over the complete period of participation in the programme and also applies to the grant in subsequent years. The personal investment may only be wound down when exercise is no longer possible.  The earnings per share (EPS) performance target was met. The level of attainment of the earnings per share performance indicator determines how many of the granted SAR may actually be exercised. The target value is the EPS value determined in the mid-term plan for the balance sheet date of the third year after the grant date. If the EPS target is attained at 100% or surpassed, the granted SARs may be exercised in full. If attainment is between 50% and 100%, the granted SAR may be exercised on a pro rata basis. If the EPS value attained is below 50%, the granted SARs become forfeited in full. Number and allocation of granted SAR: Date of grant 1 April 2019 1 April 2018 1 April 2017 1 April 2016 1 April 2015 Exercise price (in €) 17.25 21.94 9.96 13.66 10.70 31 Mar 2018 – – 290,000 110,000 95,000 Number of stock appreciation rights granted – 270,000 – – – Number of stock appreciation rights exercised – – – – 71,967 Number of stock appreciation rights expired – – 15,000 – 14,565 31 Mar 2019 – 270,000 275,000 110,000 8,468 Number of stock appreciation rights granted 267,500 – – – – Number of stock appreciation rights exercised – – – 56,336 8,468 Number of stock appreciation rights expired 32,500 47,500 47,500 40,662 – 31 Mar 2020 235,000 222,500 227,500 13,002 – Remaining contract period of stock appreciation rights granted 4 years 3 years 2 years – – Fair value of granted stock appreciation rights as at the balance sheet date (in € thousands) 31 Mar 2019 – 393 883 137 39 31 Mar 2020 450 49 – 4 –
  • 158.
    154 CONSOLIDATED FINANCIAL ­STATEMENTSANNUALREPORT 2019/20AT S FIRST CHOICE FOR ADVANCED APPLICATIONSATS ANNUAL REPORT 2019/20 CONSOLIDATED FINANCIAL STATEMENTS FIRST CHOICE FOR ADVANCED APPLICATIONS 75 SARs are measured at fair value at the respective balance sheet date using the Monte Carlo method and based on the model assumptions and valuation parameters stated below. The values determined for calculation of the liabilities may differ from the values later realised on the market. Risk-free interest rate -0.84 to -0.91% Volatility 42.75 to 45.80% Volatility is calculated based on the daily share prices from 1 March 2017 until the balance sheet date. The expenses for the stock appreciation rights are included in the administration costs. The fair value of the SAR granted is recognised as an expense over their term. Other liabilities Other liabilities mainly include debtors with credit balances, accrued legal, audit and consulting fees, as well as other accruals. 15. Financial liabilities Remaining maturity € in thousands 31 Mar 2020 Less than 1 year Between 1 and 5 years More than 5 years Nominal interest rate in % Export loans 10,000 10,000 – – 0.24 Loans from state authorities 4,392 2,054 2,338 – 0.75 –1.00 Other bank borrowings 754,362 89,586 527,571 137,205 1.00 –4.75 Liabilities from finance leases IFRS16 24,956 3,307 21,481 168 Derivative financial instruments 1) 7,423 352 3,203 3,868 Carrying amount 801,133 105,299 554,593 141,241 Remaining maturity € in thousands 31 Mar 2019 Less than 1 year Between 1 and 5 years More than 5 years Nominal interest rate in % Export loans 10,000 10,000 – – 0.24 Loans from state authorities 5,494 1,751 3,402 341 0.75 –1.00 Other bank borrowings 695,927 26,216 525,969 143,742 0.85 –4.75 Liabilities from finance leases IFRS16 – – – – Derivative financial instruments 1) 5,622 – 3,194 2,428 Carrying amount 717,043 37,967 532,565 146,511 1) Reference is made to Note 18 “Derivative financial instruments” With the initial application of IFRS 16 as of 1 April 2019, additional lease liabilities were recognised. In the financial year 2019/20, financial debt from leases amounting to € 3,671 thousand was repaid and interest of € 336 thousand was paid. Other bank borrowings mainly include long-term investment financing in addition to the current liquidity needs. Other bank borrowings mainly include the following contracts:
  • 159.
    CONSOLIDATED FINANCIAL ­STATEMENTS 155 FIRSTCHOICE FOR ADVANCED APPLICATIONS ANNUAL REPORT 2019/20AT S ATS ANNUAL REPORT 2019/20 CONSOLIDATED FINANCIAL STATEMENTS FIRST CHOICE FOR ADVANCED APPLICATIONS 76  Promissory note loan in FY 2013/14  Promissory note loan in FY 2015/16  Promissory note loan in FY 2016/17  OeKB equity financing programme in FY 2016/17  OeKB equity financing programme in FY 2018/19  Promissory note loan in FY 2018/19 Financial contracts in FY 2019/20:  Promissory note loan of € 80 million with a term to maturity of five years  OeKB equity financing programme for a total amount of € 300 million with a term to maturity of six years, as at 31 March 2020 shown as unused credit lines The contractually agreed (undiscounted) interest and redemption payments of the financial liabilities as at 31 March 2020, including interest rate hedging, are as follows in the coming financial years: € in thousands Export loans Loans from state authorities Other bank borrowings Liabilities from finance lease IFRS16 Derivative financial instruments 2020/21 Redemption 10,000 2,054 89,620 3,298 352 Fixed interest – 34 3,921 – – Variable interest 24 – 5,868 275 – 2021/22 Redemption – 970 61,857 20,031 – Fixed interest – 15 2,398 – – Variable interest – – 5,868 175 – 2022/23 Redemption – 180 44,857 986 – Fixed interest – 11 2,269 – – Variable interest – – 5,293 36 – 2023/24 Redemption – 663 334,857 267 3,204 Fixed interest – 9 1,420 – – Variable interest – – 3,643 17 – 2024/25 Redemption – 546 86,607 153 – Fixed interest – 5 707 – – Variable interest – – 1,993 9 – after 2024/25 Redemption – – 137,607 167 3,868 Fixed interest – – 1,465 – – Variable interest – – 828 4 – No significant deviations from the agreed interest and redemption payments are expected regarding term or amount.
  • 160.
    156 CONSOLIDATED FINANCIAL ­STATEMENTSANNUALREPORT 2019/20AT S FIRST CHOICE FOR ADVANCED APPLICATIONSATS ANNUAL REPORT 2019/20 CONSOLIDATED FINANCIAL STATEMENTS FIRST CHOICE FOR ADVANCED APPLICATIONS 77 At the previous year’s balance sheet date of 31 March 2019, the contractually agreed (undiscounted) interest and redemption payments of the financial liabilities, including interest rate hedging, were as follows for the coming financial years: € in thousands Export loans Loans from state authorities Other bank borrowings Liabilities from finance leases IFRS16 Derivative financial instruments 2019/20 Redemption 10,000 1,751 23,456 – – Fixed interest – 47 4,277 – – Variable interest 24 – 5,068 – – 2020/21 Redemption – 2,054 85,214 – 740 Fixed interest – 29 3,910 – – Variable interest – – 5,068 – – 2021/22 Redemption – 970 61,857 – – Fixed interest – 10 2,398 – – Variable interest – – 5,068 – – 2022/23 Redemption – 113 44,857 – – Fixed interest – 6 2,269 – – Variable interest – – 4,493 – – 2023/24 Redemption – 301 334,857 – 2,454 Fixed interest – 4 1,420 – – Variable interest – – 2,877 – – after 2023/24 Redemption – – 144,214 – 2,428 Fixed interest – – 2,172 – – Variable interest – – 2,273 – – Some of the financial liabilities have interest rates that deviate from the market interest rates. For this reason, differences may arise between their fair values and carrying amounts. Carrying amounts Fair values € in thousands 31 Mar 2020 31 Mar 2019 31 Mar 2020 31 Mar 2019 Export loans 10,000 10,000 10,000 10,000 Loans from state authorities 4,392 5,494 4,424 5,542 Other bank borrowings 754,362 695,927 762,312 700,630 Liabilities from finance leases IFRS16 24,956 – 24,956 – Derivative financial instruments 7,423 5,622 7,423 5,622 Total 801,133 717,043 809,115 721,794 The calculation of the fair values is based on the discounted value of future payments using current market interest rates, or the fair values are determined on the basis of quoted prices.
  • 161.
    CONSOLIDATED FINANCIAL ­STATEMENTS 157 FIRSTCHOICE FOR ADVANCED APPLICATIONS ANNUAL REPORT 2019/20AT S ATS ANNUAL REPORT 2019/20 CONSOLIDATED FINANCIAL STATEMENTS FIRST CHOICE FOR ADVANCED APPLICATIONS 78 The carrying amounts of financial liabilities by currency are as follows: € in thousands 31 Mar 2020 31 Mar 2019 Euros 787,439 703,535 US dollars 13,694 13,508 Total 801,133 717,043 The Group’s unused credit lines are as follows: € in thousands 31 Mar 2020 31 Mar 2019 Export credit 22,000 22,000 Other credit 468,357 165,325 Total 490,357 187,325 16. Provisions for employee benefits Provisions for employee benefits relate to pension commitments, severance payments and other employee benefits. Defined contribution plans The majority of the Group’s employees in Austria and some of its employees in India are covered by defined contribution pension plans that have been outsourced to a pension fund. For employees in Austria, the pension plans are supplemented by death and endowment insurance policies. Employer contributions are determined on the basis of a certain percentage of current remuneration. Employer contributions under these plans amounted to € 557 thousand in the financial year 2019/20 and to € 534 thousand in the financial year 2018/19. Defined benefit plans The Group operates defined benefit plans for several current and former members of the Management Board and former executive employees with no employee contribution required. The board members’ and other executive employees’ plans are partially funded through assets in pension funds and partially unfunded. Pension benefits of board members and executive employees are based on their salaries and years of service. Essentially, these obligations expose the Group to life expectancy and inflation risks due to future increases in pay and pensions, and, in the case of funded pension plans, to deviations in income. Funded severance payments The employees in India are entitled to severance payments upon retirement or, under certain circumstances, upon leaving the company prematurely, the amount of which depends on years of service and the remuneration received by the respective member of staff. Severance payments range between half themonthly remuneration per year of service and a fixed maximum. Severance payment obligations are covered by a life insurance policy. The main risk to which the Group is exposed from these obligations is the risk of inflation due to future pay increases. Unfunded severance payments Employees in Austria, South Korea and China are entitled to receive severance payments, which are based upon years of service and remuneration received by the respective member of staff and are generally payable upon retirement and, under certain circumstances, upon leaving the Company. For staff members who joined the Company before 1 January 2003, the severance payments in Austria range from two to twelve months of monthly salary, with staff members in South Korea and China also entitled to a
  • 162.
    158 CONSOLIDATED FINANCIAL ­STATEMENTSANNUALREPORT 2019/20AT S FIRST CHOICE FOR ADVANCED APPLICATIONSATS ANNUAL REPORT 2019/20 CONSOLIDATED FINANCIAL STATEMENTS FIRST CHOICE FOR ADVANCED APPLICATIONS 79 fixed amount depending on years of service and salary. The main risk to which the Group is exposed from these obligations is the risk of inflation due to future pay increases. For employees in Austria who joined on or after 1 January 2003, regular contributions are paid to a staff provision fund (“Mitarbeitervorsorgekasse”) without any further obligations on the part of the Group. The contributions for the financial year 2019/20 amounted to € 515 thousand and for the financial year 2018/19 to € 462 thousand. Other employee benefits The employees of the companies in Austria and China are entitled to anniversary bonuses for long-term service, the eligibility to and amount of which in Austria are stipulated in the Collective Agreement. Expenses for (defined benefit) pension obligations, severance payments and other employee benefits consist of the following: Retirement benefits Severance payments Other employee benefits € in thousands 2019/20 2018/19 2019/20 2018/19 2019/20 2018/19 Current service cost 141 118 2,109 2,025 2,141 2,084 Interest expense 156 42 557 582 201 210 Remeasurement of obligations from other employee benefits – – – – 846 1,874 Expenses recognised in profit for the period 297 160 2,666 2,607 3,188 4,168 Remeasurement of obligations from post-employment benefits (856) 6,503 2,274 1,210 – – Expenses/(Income) recognised in other comprehensive income (856) 6,503 2,274 1,210 – – Total (559) 6,663 4,940 3,817 3,188 4,168 Expenses for retirement, severance payments and other employee benefits are recognised in profit or loss under cost of sales, distribution costs, general and administrative costs and in other comprehensive income. Net interest expense on personnel-related liabilities is presented in “Finance costs - net”. Amounts accrued in the statement of financial position are: € in thousands 31 Mar 2020 31 Mar 2019 Funded pension benefits 6,714 7,305 Unfunded pension benefits 1,353 1,388 Total pension benefits 8,067 8,693 Unfunded severance payments 31,378 28,317 Funded severance payments 529 383 Total severance payments 31,907 28,700 Other employee benefits 11,270 11,016 Provisions for employee benefits 51,244 48,409
  • 163.
    CONSOLIDATED FINANCIAL ­STATEMENTS 159 FIRSTCHOICE FOR ADVANCED APPLICATIONS ANNUAL REPORT 2019/20AT S ATS ANNUAL REPORT 2019/20 CONSOLIDATED FINANCIAL STATEMENTS FIRST CHOICE FOR ADVANCED APPLICATIONS 80 Pension obligations and severance payments are as follows: Retirement benefits Severance payments € in thousands 31 Mar 2020 31 Mar 2019 31 Mar 2020 31 Mar 2019 Present value of funded obligations 16,840 16,684 1,766 1,590 Fair value of plan assets (10,126) (9,379) (1,237) (1,207) Funded status of funded obligations 6,714 7,305 529 383 Present value of unfunded obligations 1,353 1,388 31,378 28,317 Provisions recognised in the statement of financial position 8,067 8,693 31,907 28,700 The present value of projected pension benefits, the movement in plan assets (held to cover the pension benefits) and funded status are as follows: Funded retirement benefits Unfunded retirement benefits € in thousands 2019/20 2018/19 2019/20 2018/19 Present value of pension obligation: Present value at the beginning of the financial year 16,683 12,952 1,388 1,180 Current service cost 141 118 – – Interest expense 300 259 25 24 Remeasurement from the change in demographic assumptions – 1,991 – 122 Remeasurement from the change in financial assumptions – 1,956 134 124 Remeasurement from adjustments based on past experience 187 (130) (127) 4 Benefits paid (471) (463) (67) (66) Present value at the end of the financial year 16,840 16,683 1,353 1,388 Fair value of plan assets: Fair value at the beginning of the financial year 9,378 12,036 Investment result 1,050 (2,436) Interest income 169 241 Benefits paid (471) (463) Fair value at the end of the financial year 10,126 9,378 Funded status of funded pension benefits 6,714 7,305 As at 31 March 2020, the average maturity of funded pension benefits is 16 years and unfunded pension benefits 12 years. Plan assets held to cover the pension obligations have been transferred to pension funds. The diversification of the portfolio is as follows: in % 31 Mar 2020 31 Mar 2019 Debt securities 34% 30% Equity securities 54% 58% Real estate 5% 5% Cash and cash equivalents 7% 7% Total 100% 100%
  • 164.
    160 CONSOLIDATED FINANCIAL ­STATEMENTSANNUALREPORT 2019/20AT S FIRST CHOICE FOR ADVANCED APPLICATIONSATS ANNUAL REPORT 2019/20 CONSOLIDATED FINANCIAL STATEMENTS FIRST CHOICE FOR ADVANCED APPLICATIONS 81 A significant portion of plan assets is traded in an active market. The aggregate movement in funded and unfunded severance payments is as follows: Funded severance payments Unfunded severance payments € in thousands 2019/20 2018/19 2019/20 2018/19 Present value of severance payment obligation: Present value at the beginning of the financial year 1,589 1,427 28,317 25,932 Exchange differences (109) 51 (238) 92 Service cost 106 90 2,003 1,936 Interest cost 117 104 530 548 Remeasurement from the change in demographic assumptions – (19) (121) (285) Remeasurement from the change in financial assumptions 107 (145) 2,447 1,211 Remeasurement from adjustments based on past experience 55 126 (211) 335 Benefits paid (99) (45) (1,349) (1,452) Present value at the end of the financial year 1,766 1,589 31,378 28,317 Fair value of plan assets: Fair value at the beginning of the financial year 1,206 934 Exchange differences (77) 40 Contributions 115 195 Investment result 2 13 Interest income 90 69 Benefits paid (99) (45) Fair value at the end of the financial year 1,237 1,206 Funded status of funded severance payments 529 383 As at 31 March 2020, the average maturity of unfunded severance payments is 12 years. The aggregate movement in other employee benefits (anniversary bonuses) is as follows: € in thousands 2019/20 2018/19 Present value at the beginning of the financial year 11,016 8,801 Exchange differences (141) 150 Service cost 2,141 2,084 Interest expense 201 211 Remeasurement from the change in demographic assumptions (183) 1,116 Remeasurement from the change in financial assumptions 210 231 Remeasurement from adjustments based on past experience 819 527 Benefits paid (2,793) (2,104) Present value at the end of the financial year 11,270 11,016 At 31 March 2020, the average maturity of other employee benefits is 11 years.
  • 165.
    CONSOLIDATED FINANCIAL ­STATEMENTS 161 FIRSTCHOICE FOR ADVANCED APPLICATIONS ANNUAL REPORT 2019/20AT S ATS ANNUAL REPORT 2019/20 CONSOLIDATED FINANCIAL STATEMENTS FIRST CHOICE FOR ADVANCED APPLICATIONS 82 The following weighted actuarial parameters were used for the measurement at the balance sheet date: Retirement benefits Severance payments Other employee benefits (anniversary bonuses) 31 Mar 2020 31 Mar 2019 31 Mar 2020 31 Mar 2019 31 Mar 2020 31 Mar 2019 Discount rate 1.80% 1,80% 1.90% 2.22% 1.93% 2.18% Expected rate of remuneration increase 2.25% 2.25% 3.62% 3.26% 5,01% 4.06% Expected rate of pension increase 1.80% 1.80% – – – – Retirement age 65 65 1) 1) – – ‘1) Individual according to respective local legislation Attrition rates and biometric data are included in the calculation of the provisions. 17. Other provisions € in thousands Total Warranty Others Carrying amount 31 Mar 2019 4,175 1,053 3,122 Utilisation (1,701) (200) (1,501) Reversal (234) (218) (16) Addition 3,214 2,547 667 Exchange differences (217) (129) (88) Carrying amount 31 Mar 2020 5,237 3,053 2,184 € in thousands Total Warranty Others Carrying amount 31 Mar 2018 5,942 2,526 3,416 Utilisation (1,397) (97) (1,300) Reversal (1,830) (1,811) (19) Addition 1,338 415 923 Exchange differences 122 20 102 Carrying amount 31 Mar 2019 4,175 1,053 3,122 € in thousands 31 Mar 2020 31 Mar 2019 thereof non-current – – thereof current 5,237 4,175 Carrying amount 5,237 4,175 Warranty provision This item relates to the costs of existing and expected complaints about products still under warranty. The accrued amount is the best estimate of these costs based on past experience and actual facts, and is not yet recognised as a liability due to the uncertainty as to amount and timing. The amount of expected costs includes amounts assumed from product liability insurance. Others This item relates substantially to provisions for risks from pending losses on onerous contracts and to provisions for the risks associated with pension scheme contributions in Asia resulting from the uncertain legal situation there.
  • 166.
    162 CONSOLIDATED FINANCIAL ­STATEMENTSANNUALREPORT 2019/20AT S FIRST CHOICE FOR ADVANCED APPLICATIONSATS ANNUAL REPORT 2019/20 CONSOLIDATED FINANCIAL STATEMENTS FIRST CHOICE FOR ADVANCED APPLICATIONS 83 18. Derivative financial instruments Derivative financial instruments relate to interest rate swaps and currency swaps. Payments related to loans and receivables and trade receivables are hedged. Currency swaps are also used to temporarily balance out liquidity between different currencies. The currency swap included as of 31 March 2020 serves exclusively for short-term liquidity balancing between the euro and the US dollar. The volume amounts to € 7.0 million. The carrying amounts of the Group’s derivative financial instruments correspond to their fair values. The fair value corresponds to the amount that would be incurred or earned if the transaction had been settled at the balance sheet date. The fair values of the derivative financial instruments are as follows at the balance sheet date: 31 Mar 2020 31 Mar 2019 € in thousands Assets Liabilities Assets Liabilities Currency swaps at fair value 74 – – – Interest rate swaps at fair value – 7,423 – 5,622 Total market values 74 7,423 – 5,622 Current portion 74 352 – – Non-current portion – 7,071 – 5,622 As of 31 March 2020, the fixed interest rates for interest rate swaps range between 0.1719% and 0.545%, the variable interest rate is based on the six-month EURIBOR. Based on the various scenarios, the Group hedges its cash flow interest rate risk using interest rate swaps. Such interest rate swaps have the economic effect of converting loans from floating rates to fixed rates. If the Group takes out loans at floating rates, it uses swaps to convert such loans into fixed rate loans. Under these interest rate swaps, the Group agrees with other parties to exchange, at specified intervals, the difference between the fixed and variable interest rates calculated by reference to the agreed nominal amounts. Through the prepayment of the variable parts of the promissory note loan in the financial year 2015/16 from 2014, the basis for hedge accounting was eliminated. The existing interest rate swaps are now used for other floating rate loans. Due to different maturities and amounts, no effective hedging relationship can be established pursuant to IAS 39, which is a prerequisite for recognising gains and losses in other comprehensive income. Subsequent measurement of interest rate swaps is recognised in profit or loss under “Finance costs”. The nominal amounts and the fair values of derivative financial instruments relating to not effective hedges against interest rate fluctuations are as follows at the balance sheet date, presented by currency: 31 Mar 2020 31 Mar 2019 Currency Nominal amount in 1,000 local currency Market value € in thousands Nominal amount in 1,000 local currency Market value € in thousands Euro 22,500 (352) 22,500 (740)
  • 167.
    CONSOLIDATED FINANCIAL ­STATEMENTS 163 FIRSTCHOICE FOR ADVANCED APPLICATIONS ANNUAL REPORT 2019/20AT S ATS ANNUAL REPORT 2019/20 CONSOLIDATED FINANCIAL STATEMENTS FIRST CHOICE FOR ADVANCED APPLICATIONS 84 The remaining terms of derivative financial instruments of not effective hedges are as follows at the balance sheet date: in months 31 Mar 2020 31 Mar 2019 Interest rate swaps 11 23 In the financial years 2017/18 and 2018/19 new interest rate swaps were signed, which are used for floating rate loans and recognised as financial liabilities. As they have the same maturity and amount, there is an effective hedging relationship, which is a precondition according IAS 39 that assumes no influence of gains and losses on profit or loss. As a consequence the gains and losses from the ongoing subsequent measurement are recognised in the other comprehensive income. The terms of the interest rate swaps employed as hedging instruments are as follows: € in thousands, in months, in % Nominal volume Maturity Average hedged interest rate during the period Interest rate swaps 258,000 37 - 64 months 0,1719% - 0,5450% The value of the interest rate swaps employed as hedging instruments developed as follows: Carrying amount of the hedging instrument 1) € in thousands Assets Liabilities Change in fair value of the hedging instrument on which the calculation of ineffectiveness is based Change in fair value of the hedging instrument recognised in the cash flow hedge reserve as per 31 Mar 2020 – 7,071 – (2,190) as per 31 Mar 2019 – 4,882 – (4,983) 1) Interest rate swaps are reported under financial liabilities. The development of value of the hedged items (floating rate loans) and the cash flow hedge reserve in equity are shown in the following table: € in thousands Change in fair value of the hedged item on which the calculation of ineffectiveness is based Hedge ineffectiveness recognised in PL during the period Cash flow hedge reserve as of 31 Mar 2020 Amounts reclassified from the cash flow hedge reserve to PL during the period 1) 31 Mar 2020 – – 7,071 – 31 Mar 2019 – – 4,882 – 1) Amounts reclassified from the cash flow hedge reserve to the statement of profit or loss are recognised in finance costs. 19. Additional disclosures on financial instruments Carrying amounts and fair values by measurement category The carrying amounts and fair values of financial instruments included in several items in the statement of financial position by measurement category are as follows at the balance sheet date. Unless otherwise stated, carrying amounts correspond approximately to the fair values:
  • 168.
    164 CONSOLIDATED FINANCIAL ­STATEMENTSANNUALREPORT 2019/20AT S FIRST CHOICE FOR ADVANCED APPLICATIONSATS ANNUAL REPORT 2019/20 CONSOLIDATED FINANCIAL STATEMENTS FIRST CHOICE FOR ADVANCED APPLICATIONS 85 31 Mar 2020 € in thousands Measurement categories in accordance with IFRS 9 or measurement in accord. with other IFRSs 1) Level Carrying amount Fair value Assets Non-current assets Derivative financial instruments DHI 2 – – Other financial assets FAAFVOCI 2 193 193 Financial assets 193 193 Current assets Trade receivables less impairments FAAC 63,142 66,760 Trade receivables FAAFVOCI 3 3,618 3,618 Contract assets less impairments – 3 67,763 Other receivables FAAC 991 991 Other receivables – 56,919 124,682 Trade and other receivables 192,433 192,433 Derivative financial instruments DHI 2 74 Financial assets FAAFVPL 1 893 893 Financial assets FAAC 135,275 135,276 Financial assets 136,242 893 Cash and cash equivalents FAAC 417,950 417,950 Cash and cash equivalents 417,950 417,950 Liabilities Other financial liabilities FLAAC 2 793,710 801,692 Derivative financial instruments DHI 2 7,423 7,423 Non-current and current financial liabilities 801,133 809,115 Trade payables FLAAC 169,060 169,060 Other payables FLAAC 17,763 17,763 Other payables – 40,790 40,790 Trade and other non-current and current payables 227,613 227,613 Aggregated by measurement categories Assets At amortised cost FAAC 617,358 – Financial assets at fair value through OCI FAAFVOCI 3,811 – Financial assets at fair value through profit or loss FAAFVPL 893 – Derivatives as hedging instruments DHI 74 – Liabilities Financial liabilities at amortised cost FLAAC 980,533 – Derivatives as hedging instruments DHI 7,423 – 1) FAAC: Financial assets at amortised costs FAAFVOCI: Financial assets at fair value through OCI FAAFVPL: Financial assets at fair value through profit or loss DHI: Derivatives as hedging intruments FLAAC: Financial liabilities at amortised cost
  • 169.
    CONSOLIDATED FINANCIAL ­STATEMENTS 165 FIRSTCHOICE FOR ADVANCED APPLICATIONS ANNUAL REPORT 2019/20AT S ATS ANNUAL REPORT 2019/20 CONSOLIDATED FINANCIAL STATEMENTS FIRST CHOICE FOR ADVANCED APPLICATIONS 86 31 Mar 2019 € in thousands Measurement categories in accordance with IAS 39 or measurement in accord. with other IFRSs 1) Level Carrying amount Fair value Assets Non-current assets Derivative financial instruments DHI 2 – – Other financial assets FAAFVOCI 2 193 193 Financial assets 193 193 Current assets Trade receivables less impairments FAAC 108,098 108,098 Contract assets less impairments – 72,307 Other receivables FAAC 757 757 Other receivables – 47,883 120,190 Trade and other receivables 229,045 229,045 Financial assets FAAFVPL 1 896 896 Financial assets FAAC 238,856 238,856 Financial assets 239,752 896 Cash and cash equivalents FAAC 326,841 326,841 Cash and cash equivalents 326,841 326,841 Liabilities Other financial liabilities FLAAC 2 711,421 716,172 Derivative financial instruments DHI 2 4,882 4,882 Derivative financial instruments FVPL 2 740 740 Non-current and current financial liabilities 717,043 721,794 Trade payables FLAAC 131,936 131,936 Other payables FLAAC 25,170 25,170 Other payables – 39,044 Trade and other non-current and current payables 196,150 196,150 Aggregated by measurement categories Assets At amortised costs FAAC 674,552 – Financial assets at fair value through OCI FAAFVOCI 193 – Financial assets at fair value through profit or loss FAAFVPL 896 – Derivatives as hedging instruments DHI – – Liabilities Financial liabilities at amortised costs FLAAC 868,527 – Derivatives as hedging instruments DHI 4,882 – Derivatives FVPL 740 – 1) FAAC: Financial assets at amortised cost FAAFVOCI: Financial assets at fair value through OCI FAAFVPL: Financial assets at fair value through profit or loss DHI: Derivatives as hedging instruments FLAAC: Financial liabilities at amortised cost FVPL: Derivates at fair value through profit or loss
  • 170.
    166 CONSOLIDATED FINANCIAL ­STATEMENTSANNUALREPORT 2019/20AT S FIRST CHOICE FOR ADVANCED APPLICATIONSATS ANNUAL REPORT 2019/20 CONSOLIDATED FINANCIAL STATEMENTS FIRST CHOICE FOR ADVANCED APPLICATIONS 87 When measuring fair value, a distinction needs to be made between three valuation hierarchies:  Level 1: The fair values are determined based on quoted market prices in an active market for identical financial instruments.  Level 2: If quoted market prices in active markets are not available, the fair values are determined based on the results of a measurement method that is based to the greatest possible extent on market prices.  Level 3: In this case, the fair values are determined using measurement models which are not based on observable market data. Net results relating to financial instruments by measurement category Net gains or net losses relating to financial assets and liabilities by measurement category are as follows: € in thousands 2019/20 2018/19 Amortised cost 17,269 27,770 Fair value through other comprehensive income 9 9 Fair value through profit or loss (1,537) 2,314 Financial liabilities at amortised cost (13,654) (18,196) Total 2,087 11,897 The net results relating to financial instruments include dividend income, interest income and expenses, foreign exchange gains and losses, realised gains and losses on the disposal and sale, as well as income and expenses recognised in profit or loss from the measurement of financial instruments. € 5,261 thousand in net income (previous year: € 8,365 thousand in net income) of the total net result from financial instruments is included in the operating result and contains mainly foreign exchange effects, and € 3,174 thousand in net expenses (previous year: € 3,532 thousand in net income) in “Finance costs – net”. Financial risks In the following, the financial risks, which comprise the financing risk, the liquidity risk, the credit risk, and the foreign exchange risk, are addressed. In the Group Management Report, further risk categories and the related processes and measures are outlined. Risk management of financial risks is carried out by the central treasury department (Group Treasury) under policies approved by the Management Board. Responsibilities, authorisations and limits are governed by these internal guidelines. Group Treasury identifies, evaluates and hedges financial risks in close cooperation with the Group’s operating units. Financing risk The financing risk relates to securing the long-term funding of the Group and to fluctuations in the value of financial instruments. On the assets side, the Group is exposed to low interest rate risks with regard to its securities portfolio. Other liquid funds are mainly invested short-term. Reference is made to Note 12 “Financial assets” and Note 13 “Cash and cash equivalents”. On the liabilities side, 68.0% (previous year: 76.9%) of the total bonds and bank borrowings are subject to fixed interest rates, taking into account interest rate hedging instruments. Reference is made to Note 15 “Financial liabilities”.
  • 171.
    CONSOLIDATED FINANCIAL ­STATEMENTS 167 FIRSTCHOICE FOR ADVANCED APPLICATIONS ANNUAL REPORT 2019/20AT S ATS ANNUAL REPORT 2019/20 CONSOLIDATED FINANCIAL STATEMENTS FIRST CHOICE FOR ADVANCED APPLICATIONS 88 The financial liabilities of the Group are linked to loan commitments that are customary in the market. These commitments are reviewed on a quarterly or an annual basis. In the event of non-compliance with these commitments, the lenders have a right of notice. Liquidity risk In the Group, liquidity risk refers to the circumstance of insolvency. Therefore, sufficient liquidity shall be available at all times to be able to meet the current payment obligations on time. As of 31 March 2020, the Group has liquidity reserves of € 1.044.8 million (previous year: € 754.1 million). This comprises € 554.4 million (previous year: € 566.8 million) in cash and cash equivalents, held-to-maturity investments, securities held for trading and available-for- sale, and € 490.4 million (previous year: € 187.3 million) in available unused credit facilities. Thus, the liquidity reserves increased by € 290.7 million year-on-year and include € 39.3 million (previous year: € 43.4 million) in current reserves, which relate to ATS in China and are subject to specific liquidity requirements. Credit risk In the Group, credit risk refers to the potential for payment default by customers. The Group has always managed to establish strong partnerships with its largest customers. The credit risk is kept to a minimum by means of a comprehensive process. Customers are subject to regular credit assessments and their receivables are covered by insurance to a large extent. Non-insured receivables are continuously monitored and, if any risks are identified, the deliveries are made only against advance payments or bank guarantees. In the financial year 2019/20, € 0.7 million (previous year: € 0.4 million) or 1.0% (previous year: 0.4%) of receivables were impaired. Reference is made to the detailed disclosures in Note 11 “Trade and other receivables”. Foreign exchange risk As a globally operating entity, the ATS Group is exposed to foreign exchange risk. “Natural hedges” exist in part through local added value created at the various sites. Within the Group, transaction risks are initially managed by closing positions (netting). Open positions are continuously analysed and hedged using different hedging instruments such as forward contracts, currency options and currency swaps. No such instruments exist on the balance sheet date. Sensitivity analyses are performed to assess the foreign exchange risk, with – all else being equal – the effects of percentage changes in foreign exchange rates being simulated against each other. Financial market risks Detailed information on financial market risks and derivative financial instruments is contained in Section I.B.I. “Accounting and measurement policies: Derivative financial instruments” and in Note 18 “Derivative financial instruments”. The Group uses derivative financial instruments, such as forward contracts, options and swaps, exclusively for hedging purposes. Evaluation of financial market risks using sensitivity analyses The Group applies sensitivity analyses to quantify the interest rate and currency risks. In gap analyses, the potential change in profit/loss resulting from a 1% change in price (exchange rate or interest rate) of the foreign currency or net interest position is determined. Correlations between different risk elements are not included in these analyses. The impact on profit/loss is determined taking into account income tax effects on the profit for the year after tax. There are two different risks regarding changes in interest. In case of financing with fixed interest rates, the risk arises if the interest rate decreases and, in case of financing with variable interest rates, the risk consists of increasing interest rates (converse relating to disposition). The impact on profit/loss only results from changes in variable interest rates. ATS counteract interest rate risks with two measures: by
  • 172.
    168 CONSOLIDATED FINANCIAL ­STATEMENTSANNUALREPORT 2019/20AT S FIRST CHOICE FOR ADVANCED APPLICATIONSATS ANNUAL REPORT 2019/20 CONSOLIDATED FINANCIAL STATEMENTS FIRST CHOICE FOR ADVANCED APPLICATIONS 89 using derivative financial instruments and by increasing the risk spread of interest development due to financing in different currencies. The table below shows the effect on financial liabilities: € in thousands 31 Mar 2020 Before Hedging EUR USD Others Total In % Fixed interest rate 228,191 13,694 – 241,885 31.5% Variable interest rate 526,869 – – 526,869 68.5% Total 755,060 13,694 – 768,754 100.0% In % 98.2% 1.8% – 100.0% After Hedging Fixed interest rate 508,691 13,694 – 522,385 68.0% Variable interest rate 246,369 – – 246,369 32.0% Total 755,060 13,694 – 768,754 100.0% In % 98.2% 1.8% – 100.0% € in thousands 31 Mar 2019 Before Hedging EUR USD Others Total In % Fixed interest rate 252,758 13,509 – 266,267 37.4% Variable interest rate 445,155 – – 445,155 62.6% Total 697,913 13,509 – 711,422 100.0% In % 98.1% 1.9% – 100.0% After Hedging Fixed interest rate 533,258 13,509 – 546,767 76.9% Variable interest rate 164,655 – – 164,655 23.1% Total 697,913 13,509 – 711,422 100.0% In % 98.1% 1.9% – 100.0% If the EUR interest rates at the balance sheet date had been 100 basis points higher, based on the financing structure at the balance sheet date, the profit for the year would have been € 1.3 million lower (previous year: € 1.0 million), provided all other variables remained constant. A decline in the EUR interest rates would not have had any impact on the profit for the year. If the USD interest rates at the balance sheet date had been 100 basis points higher (or lower), based on the financing structure at the balance sheet date, the profit for the year would have been € 0.0 million lower (previous year: € 0.0 million) or € 0.0 million higher (previous year: € 0.0 million), provided all other variables remained constant. The effect of this interest rate sensitivity analysis is based on the assumption that the interest rates would deviate by 100 basis points during an entire financial year and the new interest rates would have to be applied to the amount of equity and liabilities at the balance sheet date. According to IFRS 7, the impact of hypothetical changes in exchange rates on the profit for the year results from monetary financial instruments which are not denominated by the functional currency of the reporting company. Hence, the effect on profit/loss is calculated based on receivables, payables and financial balances respectively foreign currency derivatives. At ATS, the risk primarily contains USD balances. Therefore, a sensitivity analysis is only carried out for this currency. The average changes in USD/EUR closing rates in the last 5 years amount to 6.0% (previous year: 9.0%). An increase in the US dollar exchange rate of 6.0% against the euro would have had a positive
  • 173.
    CONSOLIDATED FINANCIAL ­STATEMENTS 169 FIRSTCHOICE FOR ADVANCED APPLICATIONS ANNUAL REPORT 2019/20AT S ATS ANNUAL REPORT 2019/20 CONSOLIDATED FINANCIAL STATEMENTS FIRST CHOICE FOR ADVANCED APPLICATIONS 90 impact on the profit for the year in the amount of € 11.1 million (previous year: € 20.5 million). Devaluation of the US dollar exchange rate against the euro would have reduced the profit for the year by € 11.1 million (previous year: € 20.5 million). Capital risk management The objectives of the Group in respect of capital management include, firstly, securing the Company as a going concern in order to be able to continue providing the shareholders with dividends and the other stakeholders with their due services and, secondly, maintaining an appropriate capital structure in order to optimise capital costs. Therefore, the amount of the dividend payments is adjusted to the respective requirements, capital is repaid to shareholders (withdrawal of treasury shares), new shares are issued or the portfolio of other assets is changed. Based on the covenants defined in the credit agreements, the Group monitors its capital based on the equity ratio as well as the ratio of net debt to EBITDA (theoretical payback period for debts). The Group’s strategy is not to fall below an equity ratio of 40% and not to exceed a theoretical payback period for debts of 3.0 years, creating sufficient leeway to cushion the effects of adverse business developments and to secure the Company as a going concern even in times of crisis. Temporary deviations from the values are acceptable. At the balance sheet date, the equity ratio was 41.0% and thus below the previous year’s figure of 45.0%. At 1.3 years, the theoretical payback period for debts was above the previous year’s figure of 0.6 years. 20. Contingent liabilities and other financial commitments As of 31 March 2020, the Group has other financial commitments amounting to € 225,552 thousand (previous year: € 100,136 thousand) in connection with contractually binding investment projects. As of 31 March 2020, the maximum risk associated with liability for default was € 9,857 thousand (previous year: € 4,060 thousand) less coverage of the credit insurance applied. The liability for default corresponds to the theoretical maximum loss if a default of all transferred receivables incurs. The probability of needing to fall back on this liability is extremely low. The fair value of this risk is not material. Furthermore, at the balance sheet date the Group has no contingent liabilities from bank guarantees (previous year: € 0 thousand). There were no contingent liabilities from guarantees at the balance sheet date (previous year: € 0 thousand). 21. Share capital Outstanding shares in thousand shares Ordinary shares € in thousands Share premium € in thousands Share capital € in thousands 31 Mar 2018 38,850 42,735 99,111 141,846 31 Mar 2019 38,850 42,735 99,111 141,846 31 Mar 2020 38,850 42,735 99,111 141,846 Ordinary shares The ordinary shares of the Company as of 31 March 2020 amounting to € 42,735 thousand are fully paid in (previous year: € 42,735 thousand) and are made up of 38,850,000 (previous year: 38,850,000) no-par value bearer shares with a notional value of € 1.10 each.
  • 174.
    170 CONSOLIDATED FINANCIAL ­STATEMENTSANNUALREPORT 2019/20AT S FIRST CHOICE FOR ADVANCED APPLICATIONSATS ANNUAL REPORT 2019/20 CONSOLIDATED FINANCIAL STATEMENTS FIRST CHOICE FOR ADVANCED APPLICATIONS 91 Approved capital and conditional capital increase By way of a resolution passed at the 25th Annual General Meeting on 4 July 2019, the Management Board was authorised until 3 July 2024 to increase the Companys ordinary shares, subject to the approval of the Supervisory Board, by up to € 21,367,500 by way of issuing up to 19,425,000 no-par value bearer shares, for contributions in cash or kind, in one or several tranches, also by way of indirect subscription rights, after having been taken over by one or more credit institutions in accordance with Section 153 (6) of the Austrian Stock Corporation Act (AktG). The Management Board was authorised, subject to the approval of the Supervisory Board, to determine the detailed terms and conditions of issue (in particular the issue amount, what the contribution in kind entails, the content of the share rights, the exclusion of subscription rights, etc.) (approved capital). The Supervisory Board was authorised to adopt amendments to the Articles of Association resulting from the issuance of shares from the approved capital. Furthermore, by resolution of the 25th Annual General Meeting of 4 July 2019, the Management Board was authorised until 3 July 2024, subject to the approval of the Supervisory Board, to issue one or several convertible bearer bonds at a total nominal amount of up to € 150,000,000 and to grant to bearers of convertible bonds conversion rights and/or subscription rights for up to 19,425,000 new no-par value bearer shares in the Company in accordance with the convertible bond conditions to be defined by the Management Board. The Management Board was also authorised to completely or partially exclude shareholders’ subscription rights to the convertible bonds. Furthermore, in doing so, the Company’s ordinary shares were conditionally increased by up to € 21,367,500 by way of issuance of up to 19,425,000 new no-par value bearer shares in accordance with Section 159 (2) No. 1 of the Austrian Stock Corporation Act (AktG). This conditional capital increase will only be carried out if the bearers of convertible bonds issued based on the authorisation resolution passed at the Annual General Meeting on 4 July 2019 claim the right to conversion and/or subscription granted to them with regard to the Company’s shares. Furthermore, the Management Board was authorised to determine, subject to approval from the Supervisory Board, the further details of carrying out the conditional capital increase (particularly the issue amount and the content of the share rights). The Supervisory Board was authorised to adopt amendments to the Articles of Association resulting from the issuance of shares from the conditional capital. The same applies in case the authorisation to issue convertible bonds is not exercised or the conditional capital is not used. With regard to the approved capital and the conditional capital, the following definition of the amount in accordance with the resolutions passed at the 25th Annual General Meeting on 4 July 2019, is to be observed: the sum of (i) the number of shares currently issued or potentially to be issued from conditional capital in accordance with the convertible bond conditions and (ii) the number of shares issued from approved capital shall not exceed the total amount of 19,425,000 (limitation of authorised amount). The Annual General Meeting also resolved to amend the Articles of Association in § 4 (Nominal capital) to reflect these changes. Outstanding shares The number of shares issued amounts to 38,850,000 at 31 March 2020 (previous year: 38,850,000). Treasury shares By a resolution passed at the 25th Annual General Meeting on 4 July 2019, the Management Board was again authorised to purchase, within a period of 30 months from the adoption of the resolution by the General Meeting, treasury shares to an of up to 10% of the nominal share capital of the Company for a minimum consideration per share at the most 30% lower than the average, unweighted stock exchange closing price over the preceding ten trading days and a maximum consideration per share at the most 30% higher than the average, unweighted stock exchange closing price over the preceding ten trading days. The treasury shares may be purchased via the stock exchange, by means of a public offering or any other legally permitted way and for any legally permitted purpose. The Management Board was also authorised to withdraw repurchased treasury shares and treasury shares already held by the Company without any further resolution by Annual General Meeting. The Supervisory Board was authorised to adopt amendments to the Articles of Association resulting from the withdrawal of the shares. Furthermore, the Management Board was authorised, for a period of five years, i.e. up to and including 3 July 2024, subject to approval of the Supervisory Board, to sell or use the repurchased treasury shares or treasury shares currently held by the Company other than via the stock exchange or by public offer in particular for the purposes of stock transfer programmes,
  • 175.
    CONSOLIDATED FINANCIAL ­STATEMENTS 171 FIRSTCHOICE FOR ADVANCED APPLICATIONS ANNUAL REPORT 2019/20AT S ATS ANNUAL REPORT 2019/20 CONSOLIDATED FINANCIAL STATEMENTS FIRST CHOICE FOR ADVANCED APPLICATIONS 92 convertible bonds or as a consideration for the acquisition of entities, investments or other assets or for any other legal purpose, and to exclude a general purchase opportunity for shareholders. The authorisations granted by the resolution of the 23rd Annual General Meeting on 6 July 2017 on agenda items 8 and 9 were revoked. As at 31 March 2020, the Group held no treasury shares. Dividend per share In the financial year 2019/20, a dividend of € 0.60 was paid per share (previous year: € 0.36). 22. Other reserves The reclassification adjustments of the other comprehensive income realised in the profit for the year and the movement in other reserves are as follows: € in thousands Currency translation differences Financial assets at fair value through OCI Hedging instruments for cash flow hedges Remeasurement of obligations from post-employment benefits Other reserves Carrying amount 31 Mar 2018 30,419 17 68 (2,999) 27,505 Balance of unrealised changes before reclassification, net of tax 24,466 – (3,730) – 20,736 Remeasurement of obligations from post- employment benefits – – – (5,797) (5,797) Carrying amount 31 Mar 2019 54,885 17 (3,662) (8,796) 42,444 Balance of unrealised changes before reclassification, net of tax (30,292) – (1,642) – (31,934) Remeasurement of obligations from post- employment benefits, net of tax – – – (1,091) (1,091) Carrying amount 31 Mar 2020 24,593 17 (5,304) (9,887) 9,419 With regard to the presentation of income taxes attributable to the individual components of the other comprehensive income, including reclassification adjustments, reference is made to Note 6 “Income taxes”. 23. Hybrid capital On 17 November 2017, a hybrid bond was issued at a nominal amount of € 175,000 thousand and with an annual coupon of 4.75% which was paid out on 24 November 2017. The subordinated bond has a perpetual maturity and can be first called in and redeemed by AT S Austria Technologie Systemtechnik Aktiengesellschaft, but not by the creditors, after five years. If the bond is not called in and redeemed after five years, the mark-up increases by 5.0% on the actual coupon. As the hybrid bond satisfies the IAS 32 criteria for equity, the proceeds from the bond issue are recognised as part of equity. Accordingly, coupon payments are also presented as part of the appropriation of profit. The issue costs of the hybrid bond amounted to € 2,113 thousand. Therefore hybrid capital amounts to € 172,887 thousand (previous year: € 172,887 thousand).
  • 176.
    172 CONSOLIDATED FINANCIAL ­STATEMENTSANNUALREPORT 2019/20AT S FIRST CHOICE FOR ADVANCED APPLICATIONSATS ANNUAL REPORT 2019/20 CONSOLIDATED FINANCIAL STATEMENTS FIRST CHOICE FOR ADVANCED APPLICATIONS 93 24. Cash flow In accordance with IAS 7, cash and cash equivalents comprise cash on hand and demand, deposits and current, liquid investments that can be converted into known cash amounts at any time and which are only subject to an insignificant risk of changes in value. The indirect method was used to prepare the Consolidated Statement of Cash Flows. Cash flow from operating activities before changes in working capital in the financial year 2019/20 was € 165,367 thousand (previous year: € 205,972 thousand), cash flow from operating activities was € 185,123 thousand (previous year: € 170,534 thousand). The first-time application of IFRS 16 results in a positive effect on the cash flow from operating activities, as the previous operating lease payments, unless they are payments from short-term or low-value leases, are now shown under cash outflow from financing activities. Cash flow from investing activities in the financial year 2019/20 amounts to € -116,629 thousand (previous year: € -276,579 thousand) and comprises investment activities in Leoben, Chongqing, Shanghai and India (€ -218,597 thousand) as well as investments of or return of liquid funds (€ 101,898 thousand). As of 31 March 2020, there are existing liabilities due to investments in the amount of € 62,866 thousand (previous year: € 31,172 thousand). Cash flow from financing activities in the financial year 2019/20 amounts to € 17,924 thousand. The previous year’s figure of € 147,199 thousand is mainly attributable to the cash inflow from the issue of a promissory note loan. € in thousands 2019/20 2018/19 Cash flow from operating activities before changes in working capital 165,367 205,972 Cash flow from operating activities 185,123 170,534 Cash flow from investing activities (116,629) (276,579) Free cash flow 68,494 (106,045) Cash flow from financing activities 17,924 147,199 Change in cash and cash equivalents 86,418 41,154 Currency effects on cash and cash equivalents 4,691 14,958 Cash and cash equivalents at the end of the year 417,950 326,841 The balance of cash and cash equivalents at the end of the financial year 2019/20 was € 417,950 thousand (previous year: € 326,841 thousand). This currently high amount is used to ensure further investments in affiliated entities. The non-cash expense/income is as follows: € in thousands 2019/20 2018/19 Release of government grants (3,470) (2,880) Other non-cash expense/(income), net (10,845) (14,643) Non-cash expense/(income), net (14,315) (17,523)
  • 177.
    CONSOLIDATED FINANCIAL ­STATEMENTS 173 FIRSTCHOICE FOR ADVANCED APPLICATIONS ANNUAL REPORT 2019/20AT S ATS ANNUAL REPORT 2019/20 CONSOLIDATED FINANCIAL STATEMENTS FIRST CHOICE FOR ADVANCED APPLICATIONS 94 Net debt reconciliation: € in thousands 2019/20 2018/19 Cash and cash equivalents 417,950 326,841 Financial assets 136,435 239,945 Financial liabilities, current (105,299) (37,967) Financial liabilities, non-current (695,834) (679,076) Net debt (246,748) (150,257) Other assets € in thousands Cash Financial assets Financial Liabilities Total Net debt 31 Mar 2018 270,729 59,918 (539,884) (209,237) Cash flows 41,154 176,891 (164,386) 53,659 Foreign exchange adjustments 14,958 3,106 (3,853) 14,211 Other non-cash movements – 30 (8,920) (8,890) Net debt 31 Mar 2019 326,841 239,945 (717,043) (150,257) Adoption of IFRS16 Leases (26,589) (26,589) Cash flows 86,418 (101,768) (59,679) (75,029) Foreign exchange adjustments 4,691 (1,812) (279) 2,600 Other non-cash movements – 70 2,457 2,527 Net debt 31 Mar 2020 417,950 136,435 (801,133) (246,748)
  • 178.
    174 CONSOLIDATED FINANCIAL ­STATEMENTSANNUALREPORT 2019/20AT S FIRST CHOICE FOR ADVANCED APPLICATIONSATS ANNUAL REPORT 2019/20 CONSOLIDATED FINANCIAL STATEMENTS FIRST CHOICE FOR ADVANCED APPLICATIONS 95 25. Earnings per share Earnings per share is calculated in accordance with IAS 33 “Earnings per Share”. Weighted average of outstanding shares The number of shares issued is 38,850,000. As of 31 March 2020, no treasury shares are held, which would have had to be deducted in the calculation of earnings per share. The weighted average number of outstanding shares for the basic earnings per share calculation amounts to 38,850 thousand in the financial year 2019/20 and to 38,850 thousand in the financial year 2018/19. The weighted average number of outstanding shares for the diluted earnings per share calculation amounts to 38,850 thousand in the financial year 2019/20 and to 38,850 thousand in the financial year 2018/19. The following table shows the composition of the diluted weighted average number of outstanding shares in the respective periods: in thousands 2019/20 2018/19 Weighted average number of shares outstanding – basic 38,850 38,850 Diluting effect – – Weighted average number of shares outstanding – diluted 38,850 38,850 Basic earnings per share Basic earnings per share are calculated by dividing the profit for the period attributed to the shareholders of the Company by the weighted average number of outstanding ordinary shares in the same period. 2019/20 2018/19 Profit for the year attributable to owners of the parent company (€ in thousands) 13,143 80,714 Weighted average number of shares outstanding – basic (in thousands) 38,850 38,850 Basic earnings per share (in €) 0.34 2.08 Diluted earnings per share Diluted earnings per share are calculated by dividing the profit for the period attributed to the shareholders of the Company by the weighted average number of outstanding shares including the number of potentially outstanding ordinary shares in the same period. The potentially outstanding ordinary shares comprise the additional shares to be issued for exercisable options or subscription rights and are included in diluted earnings per share. 2019/20 2018/19 Profit for the year attributable to owners of the parent company (€ in thousands) 13,143 80,714 Weighted average number of shares outstanding – diluted (in thousands) 38,850 38,850 Diluted earnings per share (in €) 0.34 2.08 26. Material events after the balance sheet date Until 13 May 2020 no events or developments had incurred, which would have led to a material change regarding the presentation or valuation of the single assets and liabilities compared with 31 March 2020. V. OTHER DISCLOSURES
  • 179.
    CONSOLIDATED FINANCIAL ­STATEMENTS 175 FIRSTCHOICE FOR ADVANCED APPLICATIONS ANNUAL REPORT 2019/20AT S ATS ANNUAL REPORT 2019/20 CONSOLIDATED FINANCIAL STATEMENTS FIRST CHOICE FOR ADVANCED APPLICATIONS 96 The global spread of the corona virus (SARS-CoV-2) since January 2020 has led to some significant measures by governments worldwide to contain the pandemic. The resulting effects on the global economy as well as on the financial statement for 2020/21 are difficult to predict from today’s perspective. At the moment we assume a recovery in future financial years. The forecasts in this report have been drawn up with this proviso. Monika Stoisser-Göhring has decided to retire from the ATS Management Board as of the end of the financial year 2019/20 for reasons of health in agreement with the supervisory board and the company. Andreas Gerstenmayer will become the interim CFO. 27. Related party transactions In connection with various projects, the Group received consulting services from companies in which Supervisory Board chairman Mr. Androsch (AIC Androsch International Management Consulting GmbH) is operativ: € in thousands 2019/20 2018/19 AIC Androsch International Management Consulting GmbH 363 376 Frotz Riedl Rechtsanwälte – 1 Total 363 377 Members of the Management Board and the Supervisory Board In the financial year 2019/20 and until the issue date of these consolidated financial statements, the following persons served on the Management Board:  Andreas Gerstenmayer (Chairman)  Monika Stoisser-Göhring (Deputy Chairwoman)  Heinz Moitzi In the financial year 2019/20, the following persons were appointed members of the Supervisory Board:  Hannes Androsch (Chairman)  Willibald Dörflinger (First Deputy Chairman)  Regina Prehofer (Second Deputy Chairwoman)  Karl Fink  Albert Hochleitner  Gerhard Pichler (until 4 July 2019)  Georg Riedl  Karin Schaupp  Gertrude Tumpel-Gugerell (since 4 July 2019) Delegated by the Works Council:  Wolfgang Fleck  Siegfried Trauch  Günter Pint  Günther Wölfler
  • 180.
    176 CONSOLIDATED FINANCIAL ­STATEMENTSANNUALREPORT 2019/20AT S FIRST CHOICE FOR ADVANCED APPLICATIONSATS ANNUAL REPORT 2019/20 CONSOLIDATED FINANCIAL STATEMENTS FIRST CHOICE FOR ADVANCED APPLICATIONS 97 The number of outstanding stock appreciation rights and staff costs from stock appreciation rights granted are as follows: Number of outstanding stock appreciation rights Staff costs (€ in thousands) 31 Mar 2020 31 Mar 2019 2019/20 2018/19 Andreas Gerstenmayer 150,000 150,000 137 (113) Monika Stoisser-Göhring 90,000 65,000 (40) (49) Heinz Moitzi 90,000 60,000 (63) (17) Total Management Board 330,000 275,000 34 (179) Karl Asamer 1) 30,000 60,000 (150) (507) Total other executive employees 338,002 328,468 (226) (253) Total 698,002 663,468 (342) (939) 1) Former member of the Management Board Reference is made to the comments on the stock option plans under Note 14 “Trade and other payables”. Total compensation to the members of the Management Board and to executive employees in the financial year in accordance with IAS 24: 2019/20 2018/19 € in thousands Fixed Variable Total Fixed Variable Total Andreas Gerstenmayer 532 284 816 532 714 1,246 Monika Stoisser-Göhring 1) 423 – 423 391 175 566 Heinz Moitzi 429 – 429 417 186 603 Karl Asamer 2) – – – – 142 142 Executive employees 5,796 136 5,932 5,212 1,443 6,655 Total 7,180 420 7,600 6,552 2,660 9,212 1) Exercises of stock appreciation rights, which were granted before the appointment of the Management Board member, are not included. 2) Former member of the Management Board The variable compensation of Andreas Gerstenmayer includes remuneration from stock appreciation rights of € 284 thousand (previous year: € 427 thousand). Besides the above mentioned compensation € 52 thousand (previous year: € 52 thousand) for Andreas Gerstenmayer and € 41 thousand (previous year: € 38 thousand) for Monika Stoisser-Göhring were paid into a pension fund. In accordance with IAS 24, these are key management personnel who have direct or indirect authority and responsibility for planning, directing and controlling the activities of the entity; this includes managing directors of that entity.
  • 181.
    CONSOLIDATED FINANCIAL ­STATEMENTS 177 FIRSTCHOICE FOR ADVANCED APPLICATIONS ANNUAL REPORT 2019/20AT S ATS ANNUAL REPORT 2019/20 CONSOLIDATED FINANCIAL STATEMENTS FIRST CHOICE FOR ADVANCED APPLICATIONS 98 Expenses for severance payments and retirement benefits for currentl and former members of the Management Board, executive employees and their surviving dependants are as follows: Severance payments Financial year Pensions Financial year € in thousands 2019/20 2018/19 2019/20 2018/19 Expenses recognised in profit for the period 195 261 443 299 Remeasurement recognised in other comprehensive income 78 174 (856) 6,503 Total remuneration for services rendered personally by members of the Supervisory Board attributable to the financial year and proposed to the Annual General Meeting: 2019/20 2018/19 € in thousands Fixed Variable Total Fixed Variable Total Hannes Androsch 67 – 67 65 14 79 Willibald Dörflinger 53 – 53 51 9 60 Regina Prehofer 55 – 55 53 9 62 Karl Fink 30 – 30 30 7 37 Albert Hochleitner 30 – 30 30 7 37 Gerhard Pichler 8 – 8 34 7 41 Georg Riedl 40 – 40 38 7 45 Karin Schaupp 30 – 30 30 7 37 Gertrude Tumpel-Gugerell 24 – 24 – – – Total 337 – 337 331 67 398 Shareholdings of the Management Board and the Supervisory Board at 31 March 2020: Shares % capital Management Board members: Andreas Gerstenmayer 10,000 0.03 Monika Stoisser-Göhring 6,000 0.01 Heinz Moitzi 8,001 0.02 Total Management Board members 24,001 0.06 Supervisory Board members: Hannes Androsch 120,258 0.31 Other members of the Supervisory Board 15,482 0.04 Total Supervisory Board members 135,740 0.35 Private foundations: Androsch Privatstiftung 6,819,337 17.55 Dörflinger Privatstiftung 6,902,380 17.77 Total private foundations 13,721,717 35.32 Total 13,881,458 35.73
  • 182.
    178 CONSOLIDATED FINANCIAL ­STATEMENTSANNUALREPORT 2019/20AT S FIRST CHOICE FOR ADVANCED APPLICATIONSATS ANNUAL REPORT 2019/20 CONSOLIDATED FINANCIAL STATEMENTS FIRST CHOICE FOR ADVANCED APPLICATIONS 99 28. Expenses for the Group auditor The expenses for the financial year for the Group auditor are as follows: € in thousands 2019/20 2018/19 Audit of consolidated and separate financial statements 137 137 Other assurance services 27 4 Other services 46 69 Total 210 210 This item does not include expenses for other network members of the Group auditor, e.g. for the audit of financial statements of subsidiaries or tax consulting services. 29. Number of staff The average numbers of staff in the financial year are as follows: 2019/20 2018/19 Waged workers 7,437 7,321 Salaried employees 2,802 2,490 Total 10,239 9,811 The calculation of the number of staff includes an average of 256 leased personnel for the financial year 2019/20 and an average of 371 for the financial year 2018/19. Leoben-Hinterberg, 13 May 2020 The Management Board Andreas Gerstenmayer m.p. Monika Stoisser-Göhring m.p. Heinz Moitzi m.p.
  • 183.
    CONSOLIDATED FINANCIAL ­STATEMENTS 179 FIRSTCHOICE FOR ADVANCED APPLICATIONS ANNUAL REPORT 2019/20AT S ATS ANNUAL REPORT 2019 /20 STATEMENT OF ALL LEGAL REPRESENTATIVES FIRST CHOICE FOR ADVANCED APPLICATIONS 100 We confirm to the best of our knowledge that the consolidated financial statements give a true and fair view of the assets, liabilities, financial position and profit or loss of the Group as required by the applicable accounting standards and that the Group Management report gives a true and fair view of the development and performance of the business and the position of the Group, together with a description of the principal risks and uncertainties the Group faces. Leoben-Hinterberg, 13 May 2020 The Management Board Andreas Gerstenmayer m.p. Chief Executive Officer Monika Stoisser-Göhring m.p. Chief Financial Officer Heinz Moitzi m.p. Chief Operations Officer STATEMENT OF ALL LEGAL REPRESENTATIVES
  • 184.
    180 CONSOLIDATED FINANCIAL ­STATEMENTSANNUALREPORT 2019/20AT S FIRST CHOICE FOR ADVANCED APPLICATIONSATS ANNUAL REPORT 2019/20 AUDITOR’S REPORT FIRST CHOICE FOR ADVANCED APPLICATIONS 101 We draw attention to the fact that the English translation of this auditor’s report according to Section 274 of the Austrian Commercial Code (UGB) is presented for the convenience of the reader only and that the German wording is the only legally binding version. Report on the Consolidated Financial Statements Audit Opinion We have audited the consolidated financial statements of AT S Austria Technologie Systemtechnik Aktiengesellschaft, Leoben- Hinterberg, and its subsidiaries (the Group), which comprise the Consolidated Statement of Financial Position as at March 31, 2020, the separate Consolidated Statement of Profit or Loss, the Consolidated Statement of Comprehensive Income, the Consolidated Statement of Cash Flows and the Consolidated Statement of Changes in Equity for the fiscal year then ended, and the Notes to the Consolidated Financial Statements. In our opinion, the accompanying consolidated financial statements comply with legal requirements and give a true and fair view of the financial position of the Group as at March 31, 2020, and of its financial performance and cash flows for the year then ended in accordance with the International Financial Reporting Standards (IFRSs) as adopted by the EU and the additional requirements under Section 245a Austrian Commercial Code. Basis for Opinion We conducted our audit in accordance with Regulation (EU) No. 537/2014 (hereinafter EU Regulation) and Austrian generally accepted auditing standards. Those standards require the application of the International Standards on Auditing (ISAs). Our responsibilities under those provisions and standards are further described in the “Auditor’s Responsibilities for the Audit of the Consolidated Financial Statements” section of our report. We are independent of the Group in accordance with Austrian Generally Accepted Accounting Principles and professional requirements, and we have fulfilled our other ethical responsibilities in accordance with these requirements. We believe that the audit evidence we have obtained is sufficient and appropriate to provide a basis for our opinion. Key Audit Matters Key audit matters are those matters that, in our professional judgment, were of most significance in our audit of the consolidated financial statements of the fiscal year. These matters were addressed in the context of our audit of the consolidated financial statements as a whole, and in forming our opinion thereon, and we do not provide a separate opinion on these matters. We have structured key audit matters as follows:  Description  Audit approach and key observations  Reference to related disclosures AUDITOR’S REPORTAUDITOR’S REPORT
  • 185.
    CONSOLIDATED FINANCIAL ­STATEMENTS 181 FIRSTCHOICE FOR ADVANCED APPLICATIONS ANNUAL REPORT 2019/20AT S ATS ANNUAL REPORT 2019/20 AUDITOR’S REPORT FIRST CHOICE FOR ADVANCED APPLICATIONS 102 1. Deferred tax assets from tax loss carry-forwards and other deductible temporary differences  Description The Group capitalized deferred tax assets in a total amount of EUR 25,984k (prior year: EUR 35,555k). This amount includes deferred tax assets from tax loss carry-forwards and amortization of goodwill under tax law in the amount of EUR 19,652k (prior year: EUR 22,648k) as well as deductible temporary differences in the amount of EUR 6,332k (prior year: EUR 12,907k). Deferred tax assets are capitalized based on the assumption that sufficient taxable income will be generated within a planning period of at least 5 years against which tax loss carry-forwards and other deductible temporary differences can be offset. These assumptions are based on estimates of current and planned taxable results and any future measures implemented by the companies concerned that will have an effect on tax. The assessment of the matter described requires professional judgment and involves estimation uncertainties and thus includes the risk of a material misstatement in the consolidated financial statements, therefore constituting a key audit matter.  Audit approach and key observations We:  Identified, for significant companies, the process used to determine the future taxable results that serve as a basis for the calculation of deferred tax assets,  Performed plausibility checks for significant companies to evaluate if the budgeted figures used are plausible when compared to our knowledge of the planned course of business,  Received tax advisor confirmation letters to confirm the existence and accuracy of the tax loss carry-forwards,  Analyzed and confirmed samples of the accounting assumptions on the possibility to utilize tax loss carry-forwards and deductible temporary differences, and  Audited the presentation and disclosures in the notes to the consolidated financial statements. We consider the capitalization of deferred tax assets from tax loss carry-forwards and other deductible temporary differences to be justified and reasonable in amount.  Reference to related disclosures For further related information, we refer to the notes to the consolidated financial statements, section I. B. (e.) on accounting and measurement policies in respect of income taxes, section I. C. critical accounting estimates and assumptions concerning recognition and measurement, measurement of deferred tax assets and current income tax liabilities, as well as section III. 6. comments on income taxes.
  • 186.
    182 CONSOLIDATED FINANCIAL ­STATEMENTSANNUALREPORT 2019/20AT S FIRST CHOICE FOR ADVANCED APPLICATIONSATS ANNUAL REPORT 2019/20 AUDITOR’S REPORT FIRST CHOICE FOR ADVANCED APPLICATIONS 103 2. Revenue recognition over time under IFRS 15  Description Pursuant to IFRS 15 Revenue from Contracts with Customers, the Group recognizes revenue over time for part of the customers. Pursuant to IFRS 15.35 c, revenue must be recognized over time when products specifically tailored to the needs of the customers are produced and thus have no alternative use and the entity has an enforceable right to payment for performance of the service completed to date, including a margin. As at March 31, 2020, the Group states contract assets in the amount of EUR 67,763k (prior year: EUR 72,307k) after considering any impairment pursuant to IFRS 9. Revenue from revenue recognition over time amounts to EUR 645,121k in the fiscal year 2019/20 (prior year: EUR 606,978k). From our perspective, recognizing contracts with customers (over time) pursuant to IFRS 15 represents an area with major risk of material misstatements (including the possible risk of executive employees evading controls) and thus poses a key audit matter since in the required group-wide consideration of the contractual framework with regard to the new accounting-relevant criteria for determining the respective customers, management’s judgments have a major impact, and partly complex calculation methods are used in determining the stage of completion. Additionally, in applying the accounting standard IFRS 15 on a group-wide basis, the respective revenue recognition and deferral of revenue was to be considered as complex.  Audit approach and key observations We:  Assessed management’s conclusions with regard to the implementation of IFRS 15 by evaluating samples of various contract analyses and the correctness of the modified accounting principles of the Group, taking into account industry-typical circumstances and our understanding of the business,  Tested the appropriateness of accounting based on samples and evaluated the adjustments to the opening balance resulting therefrom,  Tested the effectiveness of selected key controls for revenue recognized in the course of the year and performed audit procedures to obtain sufficient audit evidence for revenue recognition of customer contracts over time,  Assessed samples of costs included in contract assets by comparing the amounts to the source data, evaluating mathematical accuracy of the calculations and testing their recoverability by comparing their net realizable values with the total costs estimated in accordance with the agreements, and  Moreover, assessed the correctness of the disclosures under IFRS 15. Our audit procedures did not result in any objections with regard to the accounting of customer contracts over time and revenue recognition pursuant to IFRS 15 resulting therefrom.  Reference to related disclosures For further related information, we refer to the notes to the consolidated financial statements, section I. B. (d.) on accounting and measurement policies in respect of recognition of revenues from contracts with customers. In addition, we refer to the disclosures on revenue in the notes to the consolidated financial statements, section III. 1. as well as those on contract assets in section IV. 11.
  • 187.
    CONSOLIDATED FINANCIAL ­STATEMENTS 183 FIRSTCHOICE FOR ADVANCED APPLICATIONS ANNUAL REPORT 2019/20AT S ATS ANNUAL REPORT 2019/20 AUDITOR’S REPORT FIRST CHOICE FOR ADVANCED APPLICATIONS 104 Responsibilities of Management and the Audit Committee for the Consolidated Financial Statements Management is responsible for the preparation and fair presentation of these consolidated financial statements in accordance with International Financial Reporting Standards (IFRSs) as adopted by the EU, and the additional requirements under Section 245a UGB, and for such internal control as management determines is necessary to enable the preparation of consolidated financial statements that are free from material misstatement, whether due to fraud or error. In preparing the consolidated financial statements, management is responsible for assessing the Group’s ability to continue as a going concern, disclosing, as applicable, matters related to going concern and using the going concern basis of accounting unless management either intends to liquidate the Group or to cease operations, or has no realistic alternative but to do so. The audit committee is responsible for overseeing the Group’s financial reporting process. Auditor’s Responsibilities for the Audit of the Consolidated Financial Statements Our objectives are to obtain reasonable assurance about whether the consolidated financial statements as a whole are free from material misstatement, whether due to fraud or error, and to issue an auditor’s report that includes our opinion. Reasonable assurance is a high level of assurance, but is not a guarantee that an audit conducted in accordance with the EU Regulation and with Austrian generally accepted auditing standards, which require the application of ISAs, will always detect a material misstatement when it exists. Misstatements can arise from fraud or error and are considered material if, individually or in the aggregate, they could reasonably be expected to influence the economic decisions of users taken on the basis of these consolidated financial statements. As part of an audit in accordance with the EU Regulation and with Austrian generally accepted auditing standards, which require the application of ISAs, we exercise professional judgment and maintain professional skepticism throughout the audit. We also:  identify and assess the risks of material misstatement of the consolidated financial statements, whether due to fraud or error, design and perform audit procedures responsive to those risks, and obtain audit evidence that is sufficient and appropriate to provide a basis for our opinion. The risks of not detecting a material misstatement resulting from fraud is higher than for one resulting from error, as fraud may involve collusion, forgery, intentional omissions, misrepresentations, or the override of internal control.  obtain an understanding of internal control relevant to the audit in order to design audit procedures that are appropriate in the circumstances, but not for the purpose of expressing an opinion on the effectiveness of the Group’s internal control.  evaluate the appropriateness of accounting policies used and the reasonableness of accounting estimates and related disclosures made by management.  conclude on the appropriateness of management’s use of the going concern basis of accounting and, based on the audit evidence obtained, whether a material uncertainty exists related to events or conditions that may cast significant doubt on the Group’s ability to continue as a going concern. If we conclude that a material uncertainty exists, we are required to draw attention in our auditor’s report to the related disclosures in the consolidated financial statements or, if such disclosures are inadequate, to modify our opinion. Our conclusions are based on the audit evidence obtained up to the date of our auditor’s report. However, future events or conditions may cause the Group to cease to continue as a going concern.  evaluate the overall presentation, structure and content of the consolidated financial statements, including the disclosures, and whether the consolidated financial statements represent the underlying transactions and events in a manner that achieves fair presentation.
  • 188.
    184 CONSOLIDATED FINANCIAL ­STATEMENTSANNUALREPORT 2019/20AT S FIRST CHOICE FOR ADVANCED APPLICATIONSATS ANNUAL REPORT 2019/20 AUDITOR’S REPORT FIRST CHOICE FOR ADVANCED APPLICATIONS 105  obtain sufficient appropriate audit evidence regarding the financial information of the entities or business activities within the Group to express an opinion on the consolidated financial statements. We are responsible for the direction, supervision and performance of the group audit. We remain solely responsible for our audit opinion. We communicate with the audit committee regarding, among other matters, the planned scope and timing of the audit and significant audit findings, including any significant deficiencies in internal control that we identify during our audit. We also provide the audit committee with a statement that we have complied with all relevant ethical requirements regarding independence, and to communicate with them all relationships and other matters that may reasonably be thought to bear on our independence, and where applicable, related safeguards. From the matters communicated with the audit committee, we determine those matters that were of most significance in the audit of the consolidated financial statements of the current period and are therefore the key audit matters. We describe these matters in our auditor’s report unless law or regulation precludes public disclosure about the matter or when, in extremely rare circumstances, we determine that a matter should not be communicated in our report because the adverse consequences of doing so would reasonably be expected to outweigh the public interest benefits of such communication. Report on Other Legal and Regulatory Requirements Comments on the Group Management Report Pursuant to the Austrian Commercial Code, the group management report is to be audited as to whether it is consistent with the consolidated financial statements and as to whether the group management report was prepared in accordance with the applicable legal requirements. Management is responsible for the preparation of the group management report in accordance with the Austrian Commercial Code. We conducted our audit in accordance with Austrian Standards on Auditing for the audit of the group management report. Opinion In our opinion, the group management report was prepared in accordance with the applicable legal requirements, includes accurate disclosures pursuant to Section 243a UGB and is consistent with the consolidated financial statements. Statement Based on the findings during the audit of the consolidated financial statements and due to the obtained understanding concerning the Group and its circumstances no material misstatements in the group management report came to our attention. Other information Management is responsible for the other information. The other information comprises the information included in the annual report, but does not include the consolidated financial statements, the group management report and the auditor’s report. The annual report is expected to be made available to us after the date of this auditor’s report. Our opinion on the consolidated financial statements does not cover the other information and we will not express any form of assurance conclusion thereon.
  • 189.
    CONSOLIDATED FINANCIAL ­STATEMENTS 185 FIRSTCHOICE FOR ADVANCED APPLICATIONS ANNUAL REPORT 2019/20AT S ATS ANNUAL REPORT 2019/20 AUDITOR’S REPORT FIRST CHOICE FOR ADVANCED APPLICATIONS 106 In connection with our audit of the consolidated financial statements, our responsibility is to read the other information identified above when it becomes available and, in doing so, consider whether the other information is materially inconsistent with the consolidated financial statements or our knowledge obtained in the audit, or otherwise appears to be materially misstated. Additional Information in Accordance with Article 10 of the EU Regulation We were appointed as statutory auditor at the general meeting dated July 4, 2019. We were subsequently engaged by the supervisory board. We have audited the Company for an uninterrupted period of more than 20 years. We confirm that the audit opinion in the “Report on the Consolidated Financial Statements” section is consistent with the additional report to the audit committee referred to in Article 11 of the EU Regulation. We declare that we did not provide any prohibited non-audit services (Article 5 (1) of the EU Regulation) and that we remained independent of the audited company in conducting the audit. Responsible Engagement Partner Responsible for the proper performance of the engagement is Mr. Jürgen Schauer, Austrian Certified Public Accountant. Vienna, May 13, 2020 PwC Wirtschaftsprüfung GmbH signed: Jürgen Schauer Austrian Certified Public Accountant This report is a translation of the original report in German, which is solely valid. Publication and sharing with third parties of the consolidated financial statements together with our auditor’s report is only allowed if the consolidated financial statements and the group management report are identical with the German audited version. This auditor’s report is only applicable to the German and complete consolidated financial statements with the group management report. For deviating versions, the provisions of Section 281 (2) UGB apply
  • 190.
  • 191.
    24 28 31 34 45 63 188 _ 10-yeartimeline 190 _ Glossary 192 _ Imprint
  • 192.
    ANNUAL REPORT 2019/20ATS FIRST CHOICE FOR ADVANCED APPLICATIONS 188 IFRS Unit 2010/11 2011/12 2012/131) 2013/14 EARNINGS DATA AND GENERAL INFORMATION Revenue € in millions 487.9 514.2 541.7 589.9 thereof produced in Asia 69% 73% 74% 76% thereof produced in Europe 31% 27% 26% 24% Cost of sales € in millions 398.2 430.7 464.6 471.1 Gross profit € in millions 89.8 83.5 77.1 118.8 Gross profit margin 18.4% 16.2% 14.2% 20.1% EBITDA € in millions 95.9 103.4 102.4 127.2 EBITDA margin 19.7% 20.1% 18.9% 21.6% EBIT € in millions 46.5 42.1 31.4 53.9 EBIT margin 9.5% 8.2% 5.8% 9.1% Profit for the period2) € in millions 35.0 26.5 14.6 38.2 Profit for the period attributable to owners of the parent company € in millions 35.2 26.6 14.6 38.2 Cash earnings € in millions 84.6 87.8 85.6 111.4 ROE (Return on equity)3) 16.0% 10.3% 5.0% 11.0% ROCE (Return on capital employed)2), 3) 9.8% 7.7% 5.6% 9.6% ROS (Return on sales) 7.2% 5.2% 2.7% 6.5% IRR (Innovation revenue rate) – 15.0% 19.2% 26.5% Cash flow from operating activities (OCF) € in millions 70.7 87.2 71.7 104.8 Net CAPEX € in millions 115.1 113.1 40.5 90.3 Operating free cash flow € in millions (44.4) (25.9) 31.2 14.5 Free cash flow € in millions (46.0) (26.4) 31.1 14.5 Employees (incl. leased personnel), end of reporting period 7,486 7,478 7,011 7,129 Employees (incl. leased personnel), average 6,987 7,417 7,321 7,027 BALANCE SHEET DATA Total assets € in millions 575.3 694.6 726.7 916.1 Total equity € in millions 229.8 283.1 304.8 390.7 Equity attributable to owners of the parent company € in millions 229.5 283.2 304.9 390.7 Equity ratio 39.9% 40.8% 42.0% 42.7% Net debt € in millions 193.7 242.5 217.4 110.9 Net gearing 84.3% 85.7% 71.3% 28.4% Net working capital € in millions 79.4 92.3 102.7 91.7 Net working capital per revenue 16.3% 18.0% 19.0% 15.6% STOCK EXCHANGE DATA Shares outstanding end of reporting period 23,322,588 23,322,588 23,322,588 38,850,000 Weighted average number of shares outstanding 23,322,588 23,322,588 23,322,588 30,820,545 Earnings per shares outstanding end of reporting period € 1.51 1.14 0.62 0.98 Earnings per average number of shares outstanding € 1.51 1.14 0.62 1.24 Cash earnings per average number of shares € 3.63 3.76 3.67 3.61 Dividend per share4) € 0.36 0.32 0.20 0.20 Closing price € 15.84 9.15 6.79 8.75 Dividend yield (at the closing price)4) 2.3% 3.5% 2.9% 2.3% Market capitalisation, end of reporting period € in millions 369.4 213.4 158.4 339.9 Market capitalisation per equity5) 161.0% 75.4% 51.9% 87.0% 1) Adjusted in application of IAS 19 revised. 2) 2018/19: Adjusted taking into account IAS 12 revised. 3) Calculated on the basis of average values. 4) 2019/20: Proposal to the Annual General Meeting. 5) Equity attributable to owners of the parent company. INFORMATION KEY DATA 10-YEAR TIMELINE
  • 193.
    FIRST CHOICE FOR ADVANCEDAPPLICATIONS ANNUAL REPORT 2019/20AT S 189 2014/15 2015/16 2016/17 2017/18 2018/19 2019/20 Change prior year Compound Annual Growth Rate 10 years 667.0 762.9 814.9 991.8 1,028.0 1,000.6 (2.7%) 7.4% 79% 81% 82% 84% 85% 87% – – 21% 19% 18% 16% 15% 13% – – 511.6 611.2 760.2 829.5 860.8 897.7 4.3% 8.5% 155.4 151.6 54.7 162.3 167.2 102.9 (38.4%) 1.4% 23.3% 19.9% 6.7% 16.4% 16.3% 10.3% – – 167.6 167.5 130.9 226.0 250.1 194.5 (22.2%) 7.3% 25.1% 22.0% 16.1% 22.8% 24.3% 19.4% – – 90.1 77.0 6.6 90.3 117.2 47.4 (59.6%) 0.2% 13.5% 10.1% 0.8% 9.1% 11.4% 4.7% – – 69.3 56.0 (22.9) 56.5 89.0 21.5 (75.9%) (4.8%) 69.3 56.0 (22.9) 53.6 80.7 13.1 (83.7%) (9.4%) 146.8 146.5 101.8 192.2 213.6 160.3 (25.0%) 6.6% 13.9% 9.5% (4.1%) 9.0% 11.5% 2.7% – – 12.0% 8.2% (0.6%) 7.7% 9.7% 2.8% – – 10.4% 7.3% (2.8%) 5.7% 8.5% 2.1% – – 29.2% 19.6% 21.8% 40.4% 35.3% 30.9% – – 143.9 136.9 136.4 143.2 170.5 185.1 8.6% 10.1% 164.8 254.3 240.7 141.7 100.8 218.5 100% 6.6% (20.9) (117.3) (104.3) 1.5 69.7 (33.4) – n.a. (20.9) (205.3) (24.7) (50.2) (106.0) 68.5 – – 8,120 9,116 9,778 9,734 9,624 10,319 7.2% 3.3% 7,638 8,759 9,526 9,981 9,811 10,239 4.4% 3.9% 1,220.8 1,344.7 1,436.7 1,530.4 1,784.1 1,853.5 3.9% 12.4% 604.4 568.9 540.1 711.4 803.5 760.3 (5.4%) 12.7% 604.3 568.9 540.1 711.4 803.5 760.3 (5.4%) 12.7% 49.5% 42.3% 37.6% 46.5% 45.0% 41.0% – – 130.5 263.2 380.5 209.2 150.3 246.7 64.2% 2.4% 21.6% 46.3% 70.5% 29.4% 18.7% 32.5% – – 95.3 88.4 24.4 72.4 160.5 144.4 (10.0%) 6.2% 14.3% 11.6% 3.0% 7.3% 15.6% 14.4% – – 38,850,000 38,850,000 38,850,000 38,850,000 38,850,000 38,850,000 – 5.2% 38,850,000 38,850,000 38,850,000 38,850,000 38,850,000 38,850,000 – 5.2% 1.78 1.44 (0.59) 1.38 2.08 0.34 (83.7%) (13.9%) 1.78 1.44 (0.59) 1.38 2.08 0.34 (83.7%) (13.9%) 3.78 3.77 2.62 4.95 5.50 4.13 (24.9%) 1.3% 0.36 0.36 0.10 0.36 0.60 0.25 (58.3%) (3.6%) 14.62 12.90 10.29 22.00 15.30 13.41 (12.4%) (1.7%) 2.5% 2.8% 1.0% 1.6% 3.9% 1.9% – – 568.0 501.2 399.8 854.7 594.4 521.0 (12.4%) 3.5% 94.0% 88.1% 74.0% 120.1% 74.0% 68.5% – – INFORMATION
  • 194.
    ANNUAL REPORT 2019/20ATS FIRST CHOICE FOR ADVANCED APPLICATIONS 190 INFORMATION ATS Toolbox Combination of existing and new technologies which enables new interconnect solutions and the functional integration at all connection levels. CMRT Conflict Minerals Reporting Template – Questionnaire to collect information on conflict minerals. COSO standard Internationally recognised standard for Internal Control Sys- tems (ICS) and risk management published by the Committee of Sponsoring Organizations of the Treadway Commission (COSO). Embedding Integrating active and/or passive electronic components inside printed circuit boards. FanOut “FanOut” is a technology in which additional wiring layers are applied to a chip, which extend beyond the chip area. This en- larged area thus enables better distribution of contacts to the printed circuit board. FCBGA Flip Chip Ball Grid Array – Technology in which the chip surface is brought into direct contact with the substrate surface via sol- der balls. Functional integration Refers to the integration of several functions of an electronic system in a module. IIA standard Standards for measures and the assessment of the quality of in- ternal auditing specified by the Institute of Internal Auditors (IIA). ILO International Labour Organization. Intellectual property In contrast to tangible property, intellectual property is the right to intangible property such as a technical invention. IRR The Innovation Revenue Rate represents the share of total reve- nue generated from products that feature new, innovative tech- nologies and have been introduced in the past three years. GLOSSARY
  • 195.
    FIRST CHOICE FOR ADVANCEDAPPLICATIONS ANNUAL REPORT 2019/20AT S 191 INFORMATION Lean Six Sigma Management system for efficiency and process improvement. The core element of the system is the description, measure- ment, analysis, improvement and monitoring of business pro- cesses using statistical methods. mSAP/SAP Modified semi-additive process or semi-additive process. Net CAPEX Capital expenditure net of receipts from the disposal of prop­ erty, plant and equipment and intangible assets. NOPAT Net operating profit after tax represents annual profit adjusted to exclude net finance costs. For calculation, please refer to the Group Management Report. RBA Responsible Business Alliance – Code of Conduct (former- ly ­Electronic Industry Citizenship Coalition (EICC)) for working ­conditions in the supply chain of the electronics industry. REACH European Regulation on Registration, Evaluation, Authorisation and Restriction of Chemicals. RMI Responsible Minerals Initiative – Principles for the responsible sourcing of conflict minerals. RoHS Restriction of Hazardous Substances in electrical and electronic Equipment. SDGs Sustainable Development Goals of the United Nations. System in Package (SiP) Consists of one or more semiconductors and passive compo- nents that form a system or a functional block. TCFD Task Force on Climate-related Financial Disclosure – Initiative for corporate reporting on climate-related financial opportunities and risks. WACC Weighted Average Cost of Capital represents the average cost that a company has to pay to obtain equity or debt capital.
  • 196.
    ANNUAL REPORT 2019/20ATS FIRST CHOICE FOR ADVANCED APPLICATIONS 192 Published by and responsible for content AT S Austria Technologie Systemtechnik Aktiengesellschaft Fabriksgasse 13 8700 Leoben, Austria www.ats.net Contact Gerda Königstorfer Phone.: +43 (0)3842 200-0 ir@ats.net Concept and design (general section) Berichtsmanufaktur GmbH, Hamburg Photos Lukas Johannes Aigner: page 22 Getty images: inside cover 4, pages 2, 2/3, 6/7, 10/11, 11, 12/13, 14/15 iStock: page 16 Fotostudio Werner Krug: pages 8/9, 12, 17 Kanizaj Marija: pages 20, 25, 26 Daniel Alexander Novotny: page 32 unsplash: cover, pages 4/5, 7, 8/9, 12, 17 IMPRINT IMPRINT Disclaimer This report contains forward-looking statements which were made on the basis of the information available at the time of publication. These can be identified by the use of such expres- sions as “expects”, “plans”, “anticipates”, “intends”, “could”, “will”, “aim” and “estimation” or other similar words. These statements are based on current expectations and assumptions. Such statements are by their very nature subject to known and unknown risks and uncertainties. As a result, actual develop- ments may vary significantly from the forward-looking state- ments made in this report. Recipients of this report are express- ly cautioned not to place undue reliance on such statements. Neither ATS nor any other entity accept any responsibility for the correctness and completeness of the forward-looking state- ments contained in this report. ATS undertakes no obligation to update or revise any forward-looking statements, whether as a result of changed assumptions or expectations, new informa- tion or future events. Percentages and individual items presented in this report are rounded, which may result in rounding differences. This report in no way represents an invitation or recommenda- tion to buy or sell shares in ATS. The report is published in German and English. In case of doubt, the German version is binding. No responsibility accepted for errors or omissions. Published on 10 June 2020
  • 197.
    Sustainability Driving THE STRATEGIC ORIENTATIONleads to a high level of social, ecological and economic responsi- bility. In addition to long-term economic success and expanding the ability to innovate, ATS is also focusing on strong and sustainable relation- ships and the creation of stakeholder value. FIRST CHOICE FOR ADVANCED APPLICATIONS STRONGFOR tomorrow SUSTAINABILITYATATS
  • 198.
    The SDGs thatguide us_ WE FOLLOW! We have rated 9 of the 17 SDGs as relevant to us. RBA RMI SDGs OECD guidelines ILO ISO We are committed to_ _Sustainability strategy with ambitious energy and diversity goals _Strong crisis management in the COVID-19 crisis _Non-financial risk management integrated into group-wide risk management _High standards in environment, energy, quality, health safety _Expansion of reporting for more transparency _Share of women in leadership positions of 21% What we are proud of_
  • 199.
    OPEN-MINDEDNESS, RESPONSIBILITY, COMMITMENT arethe values guiding us in achieving our strategic goals. 4strategic fields of action and allocated material topics_ ATSSustainability strategy 2025 Environment Resources _ Efficient production Sustainable Innovation _ Innovation Employees Society _ Occupational health and safety _ Knowledge _ Diversity _ Anti-corruption Sustainable Supply Chain _ Human rights Stakeholder SDGs Global trends Opportunities and risks Corporate strategy _80% renewable energies _Life cycle assessment of product groups _30% share of women in leadership positions _Strengthening partnerships with suppliers What we are aiming for_
  • 200.