ψ = −0.23MPa
0.1 M
solution
Pure
water
H2O
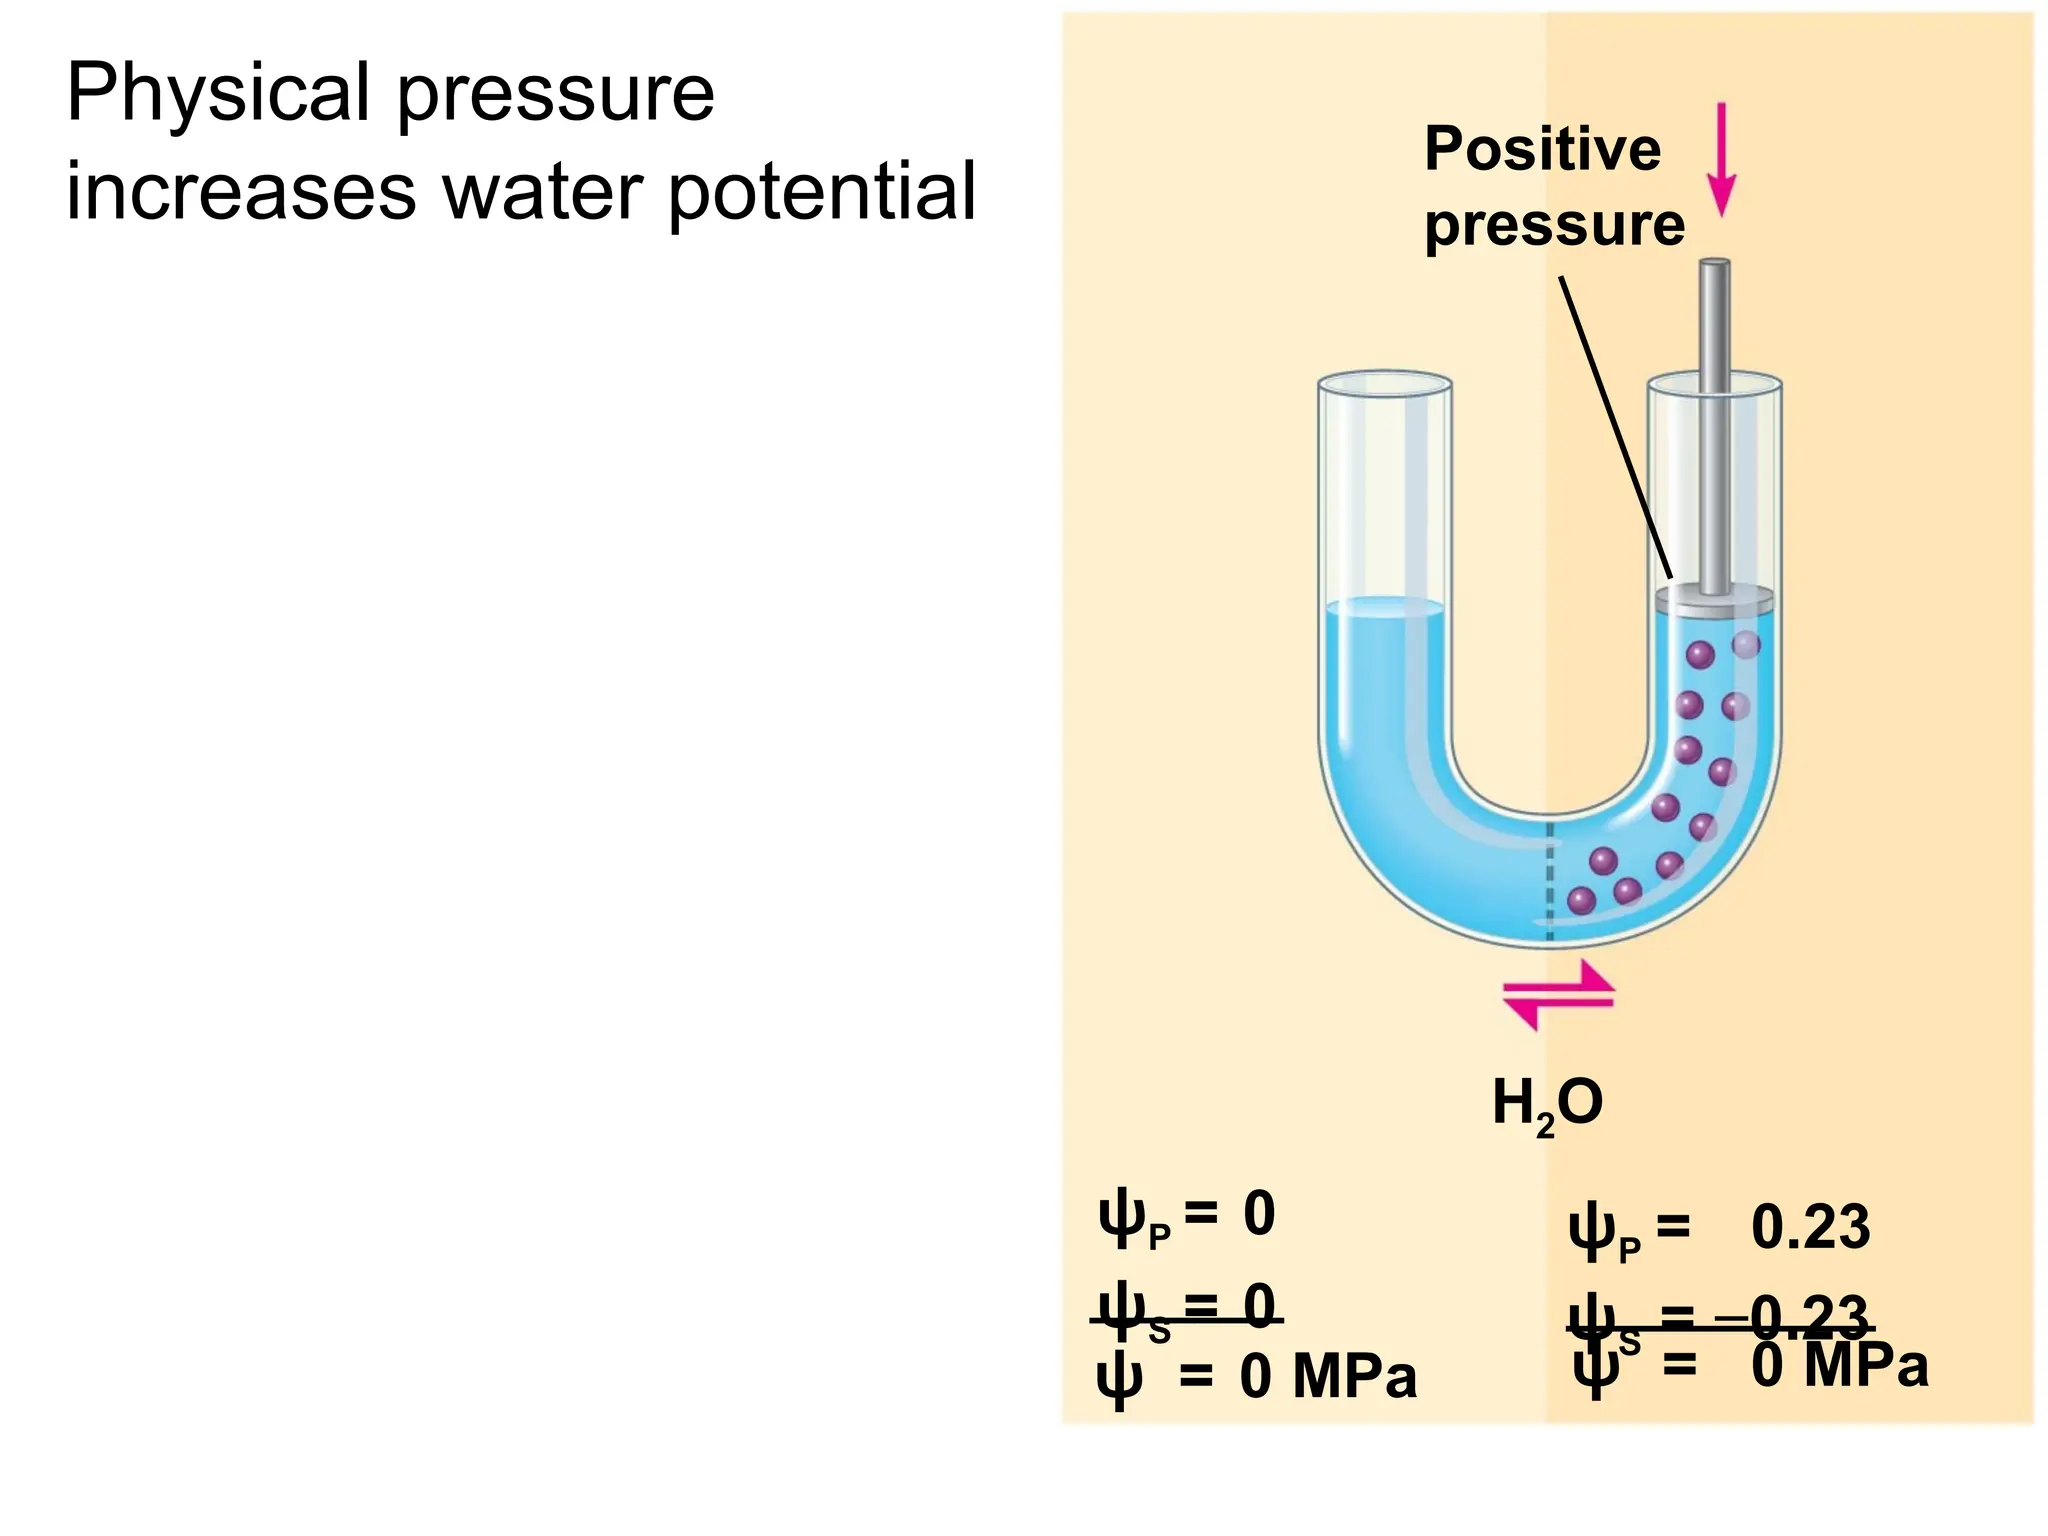
ψP = 0
ψS = 0
ψP = 0
ψS = −0.23
ψ = 0 MPa
If no pressure is applied:
The addition of solutes
reduces water potential
ψP = 0.30
ψS= −0.23
Increased
positive
pressure
H2O
ψ = 0.07 MPa
ψP = 0
ψS = 0
ψ = 0 MPa
Increased positive
pressure on the right
causes the water to
move to the left
Fig. 36-9a
(a) Initialconditions: cellular ψ > environmental ψ
ψP = 0
ψS = −0.9
ψP = 0
ψS = −0.9
ψP = 0
ψS = −0.7
ψ = −0.9 MPa
ψ = −0.9 MPa
ψ = −0.7 MPa
0.4 M sucrose solution:
Plasmolyzed cell
Initial flaccid cell:
60% H2O
A cell placed in a high solute concentration it will lose
water, plasmolyzing
Turgor loss in plants causes wilting, which can be
reversed when the plant is watered
13.
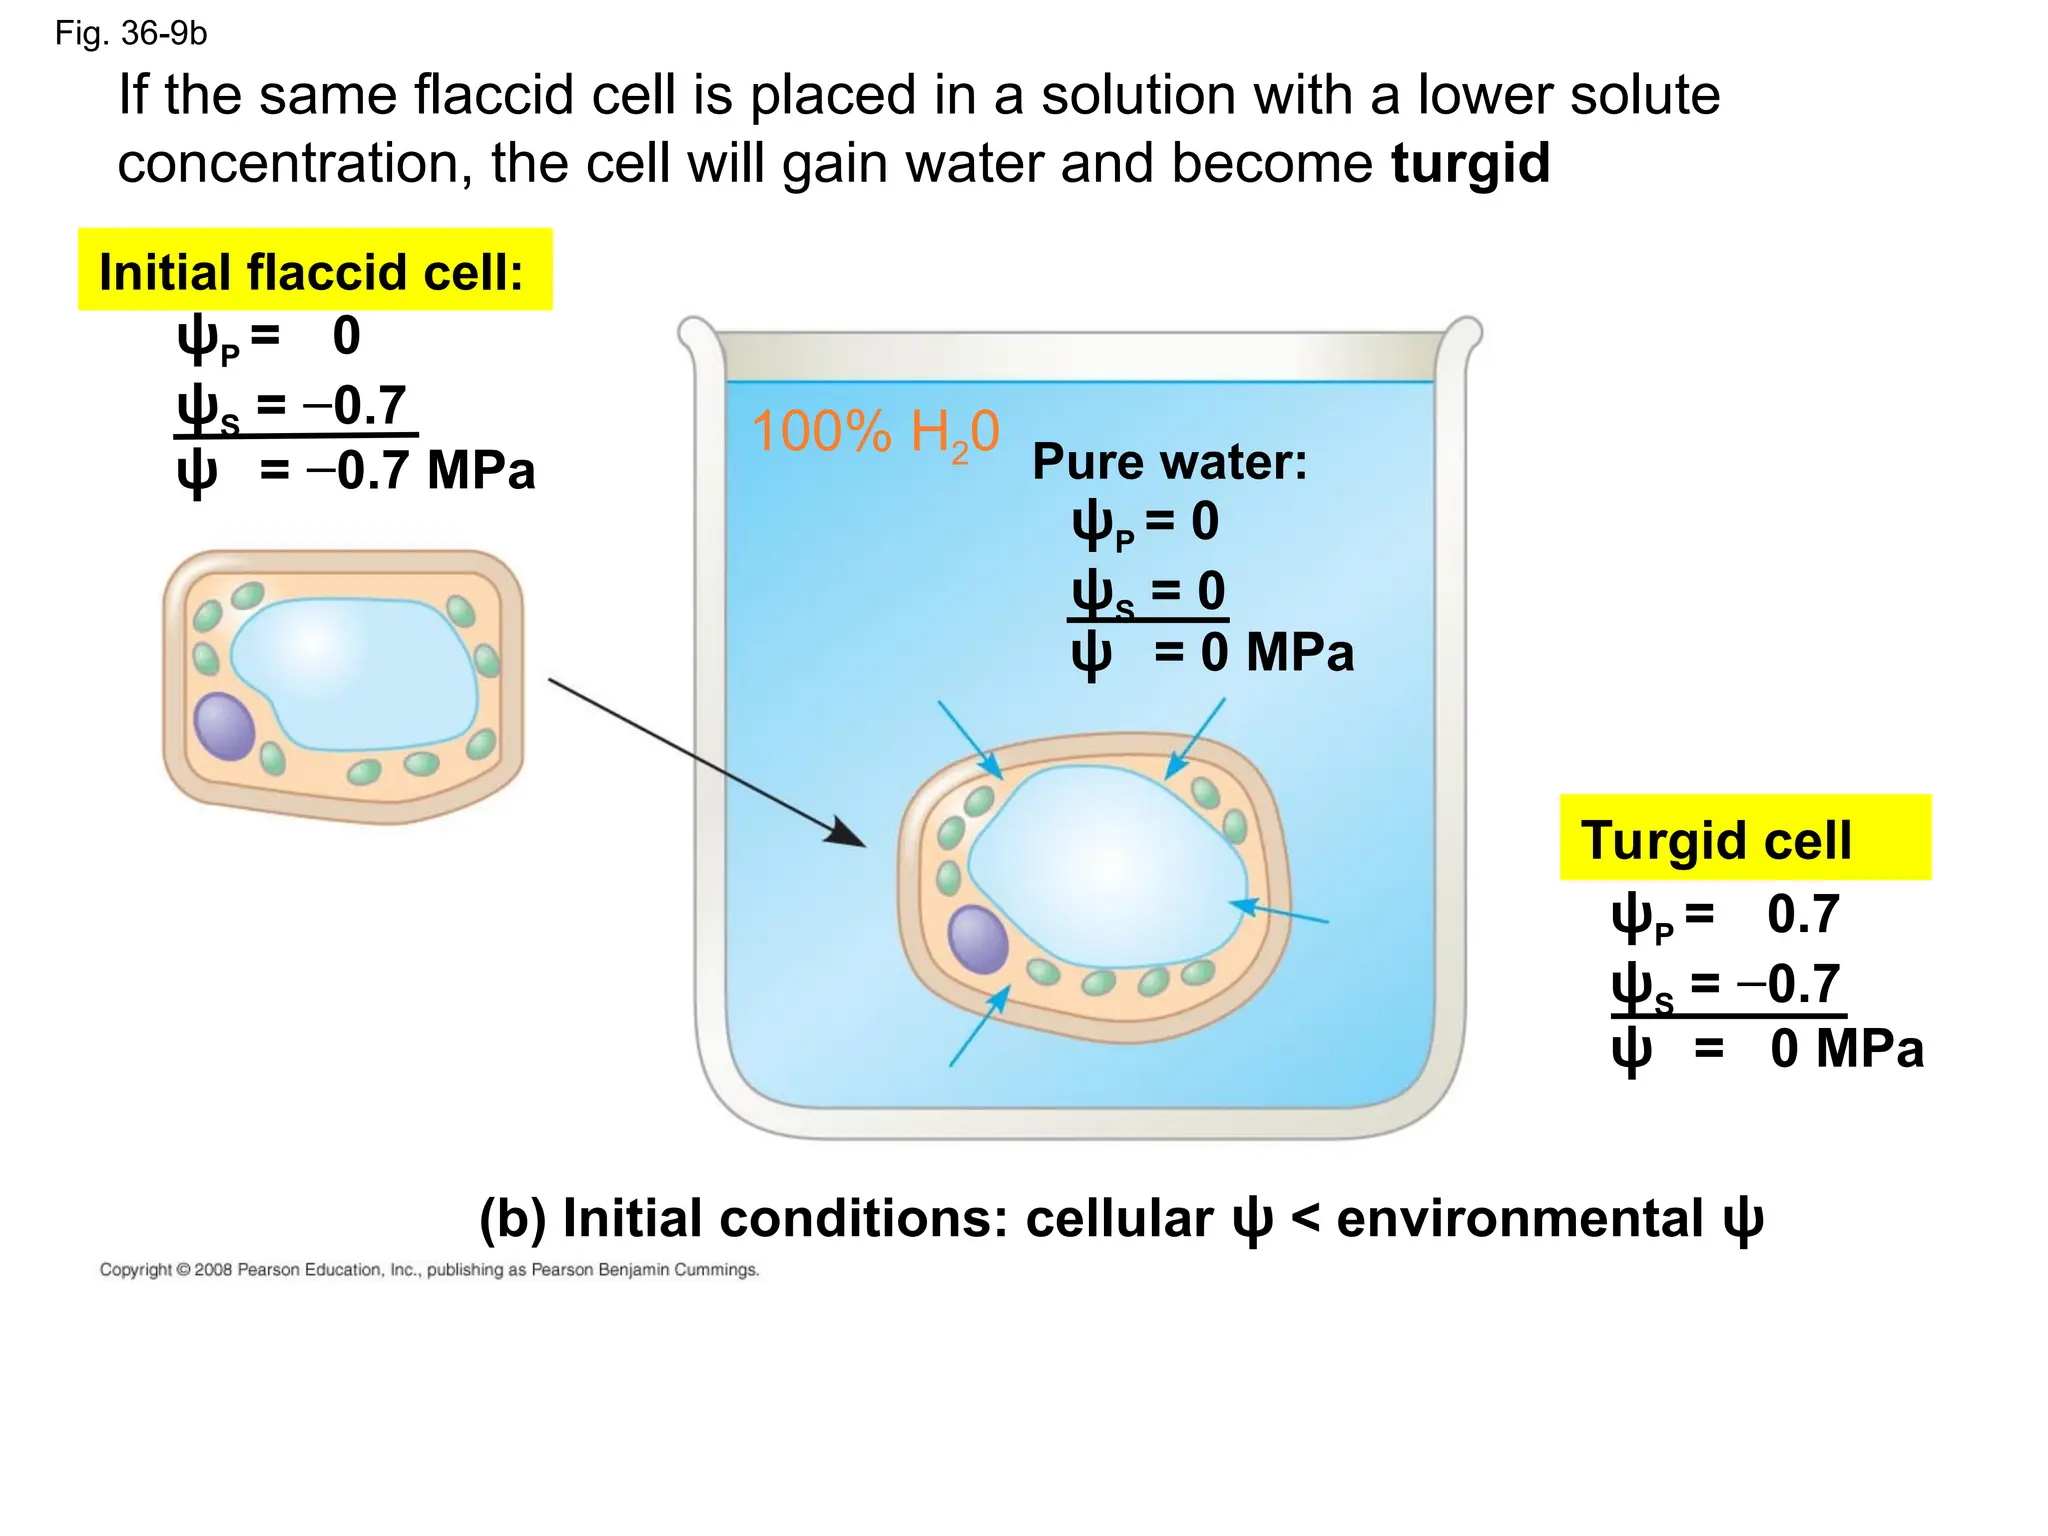
Fig. 36-9b
ψP =0
ψS = −0.7
Initial flaccid cell:
Pure water:
ψP = 0
ψS = 0
ψ = 0 MPa
ψ = −0.7 MPa
ψP = 0.7
ψS = −0.7
ψ = 0 MPa
Turgid cell
(b) Initial conditions: cellular ψ < environmental ψ
100% H20
If the same flaccid cell is placed in a solution with a lower solute
concentration, the cell will gain water and become turgid
17.
Diffusion and ActiveTransport of
Solutes
Diffusion across a membrane is passive, while
the pumping of solutes across a membrane is
active and requires energy
Most solutes pass through transport proteins
embedded in the cell membrane
The most important transport protein for active
transport is the proton pump
18.
Fig. 36-6
CYTOPLASM EXTRACELLULARFLUID
ATP
H+
H+
H+
H+
H+
H+
H+
H+
H+
+
+
+
+
+
_
_
_
_
_
Proton pumps in plant cells create a hydrogen ion gradient
that is a form of potential energy that can be harnessed to do
work
They contribute to a voltage known as a membrane potential
19.
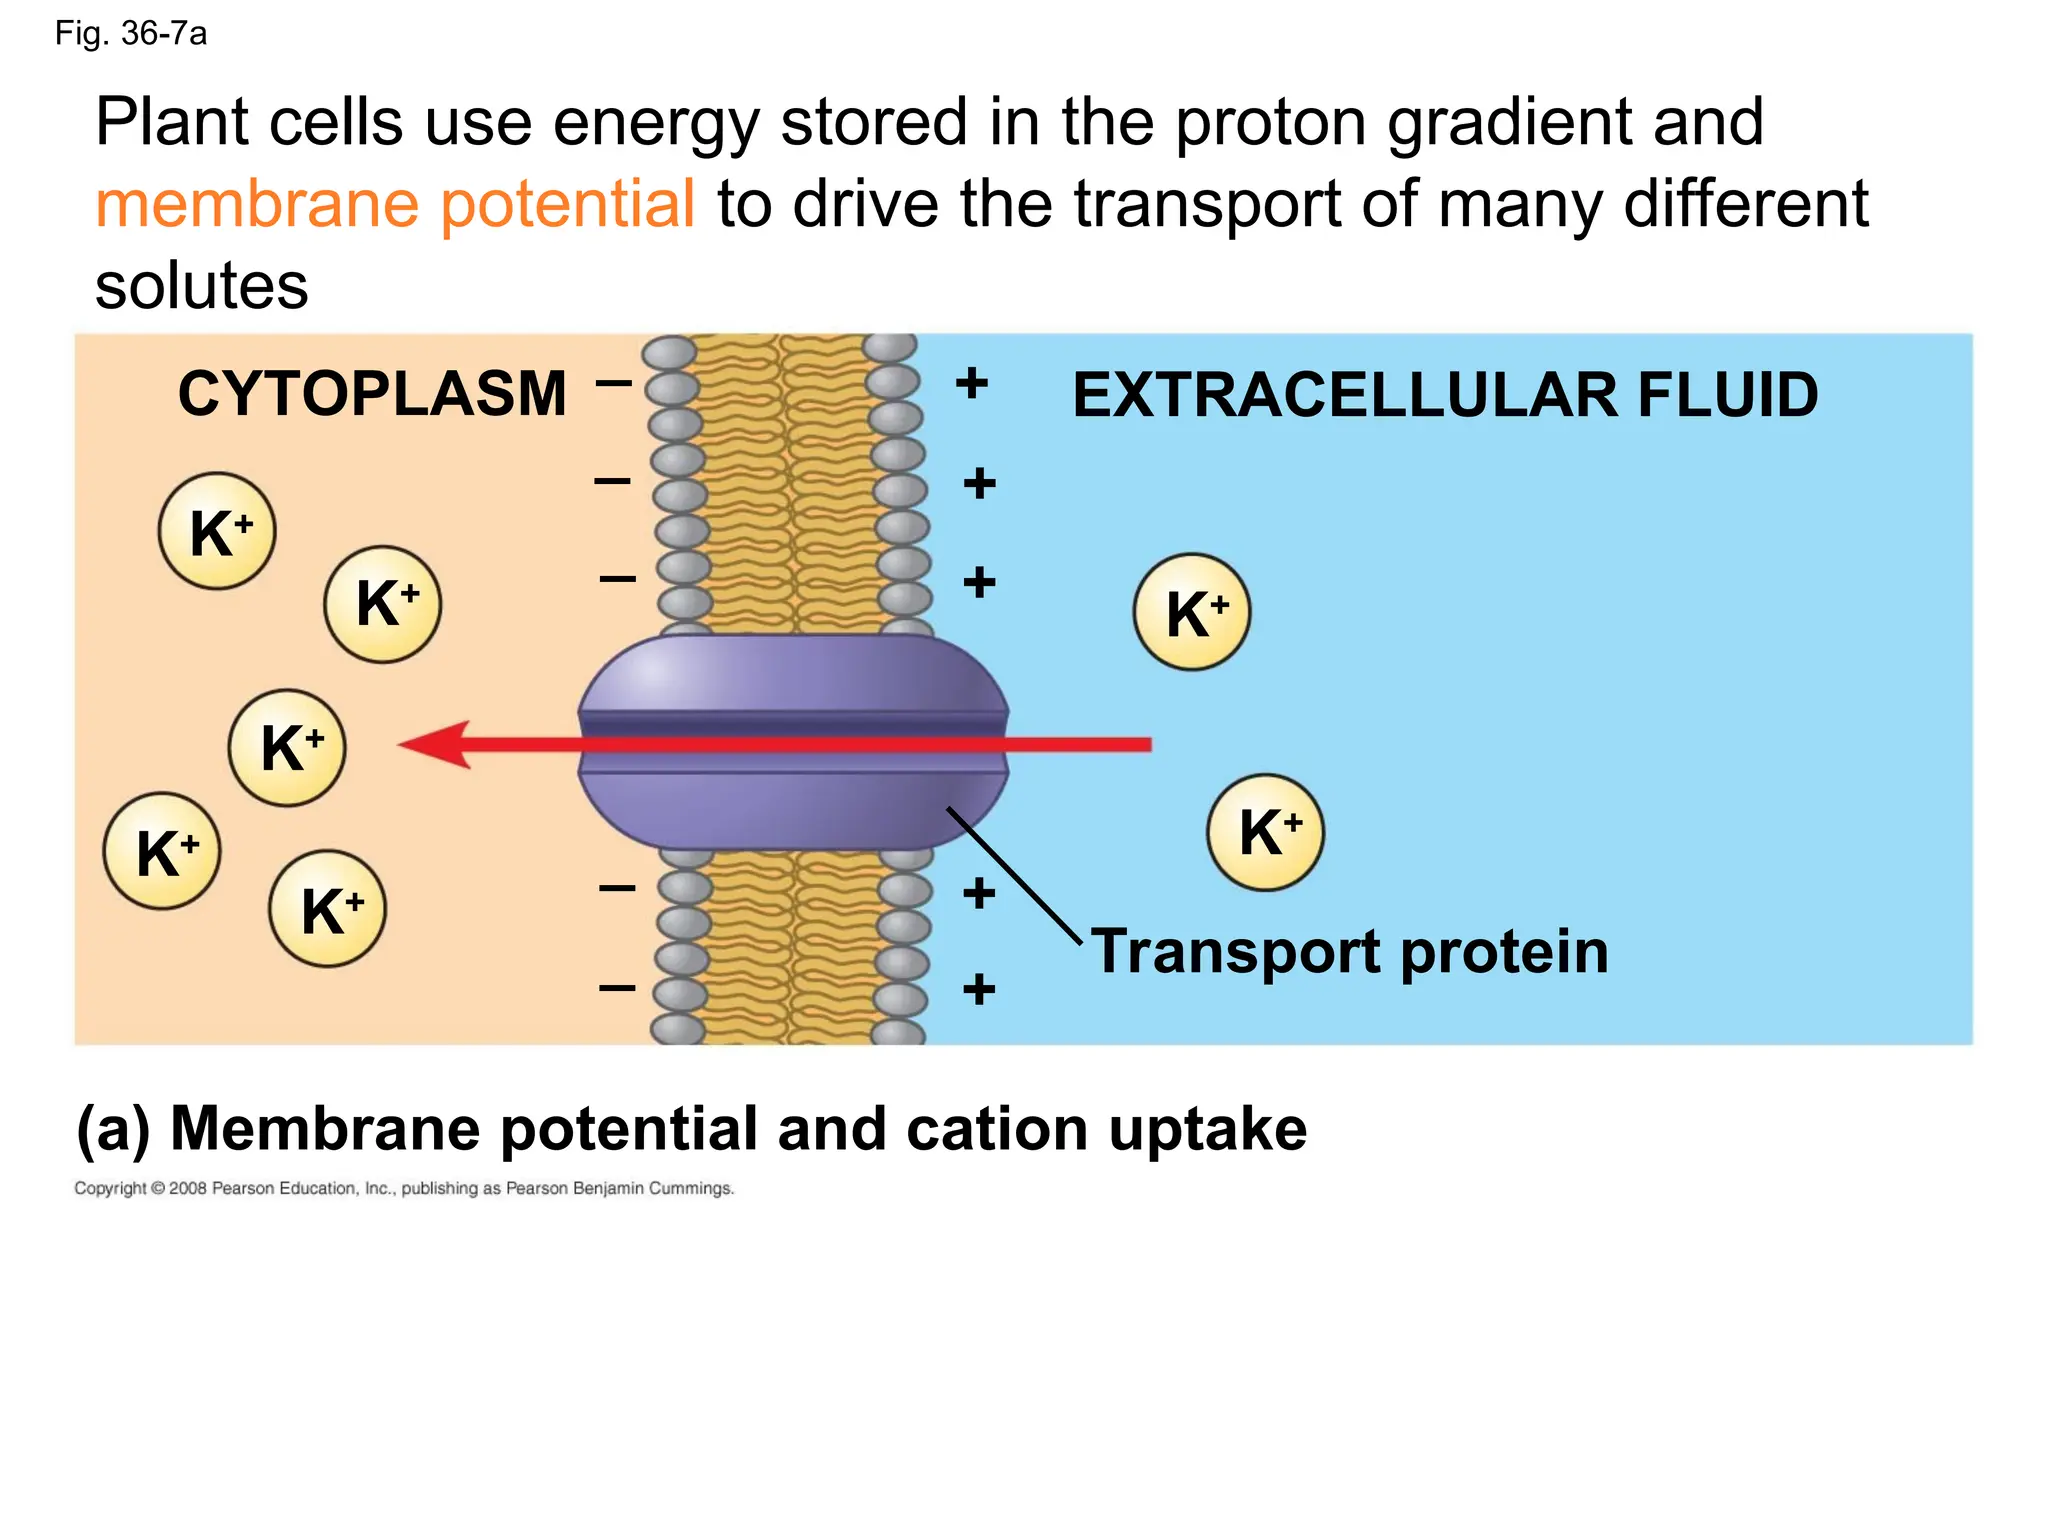
Fig. 36-7a
CYTOPLASM EXTRACELLULARFLUID
K+
Transport protein
_ +
(a) Membrane potential and cation uptake
+
+
+
+
_
_
_
_
K+
K+
K+
K+
K+
K+
Plant cells use energy stored in the proton gradient and
membrane potential to drive the transport of many different
solutes
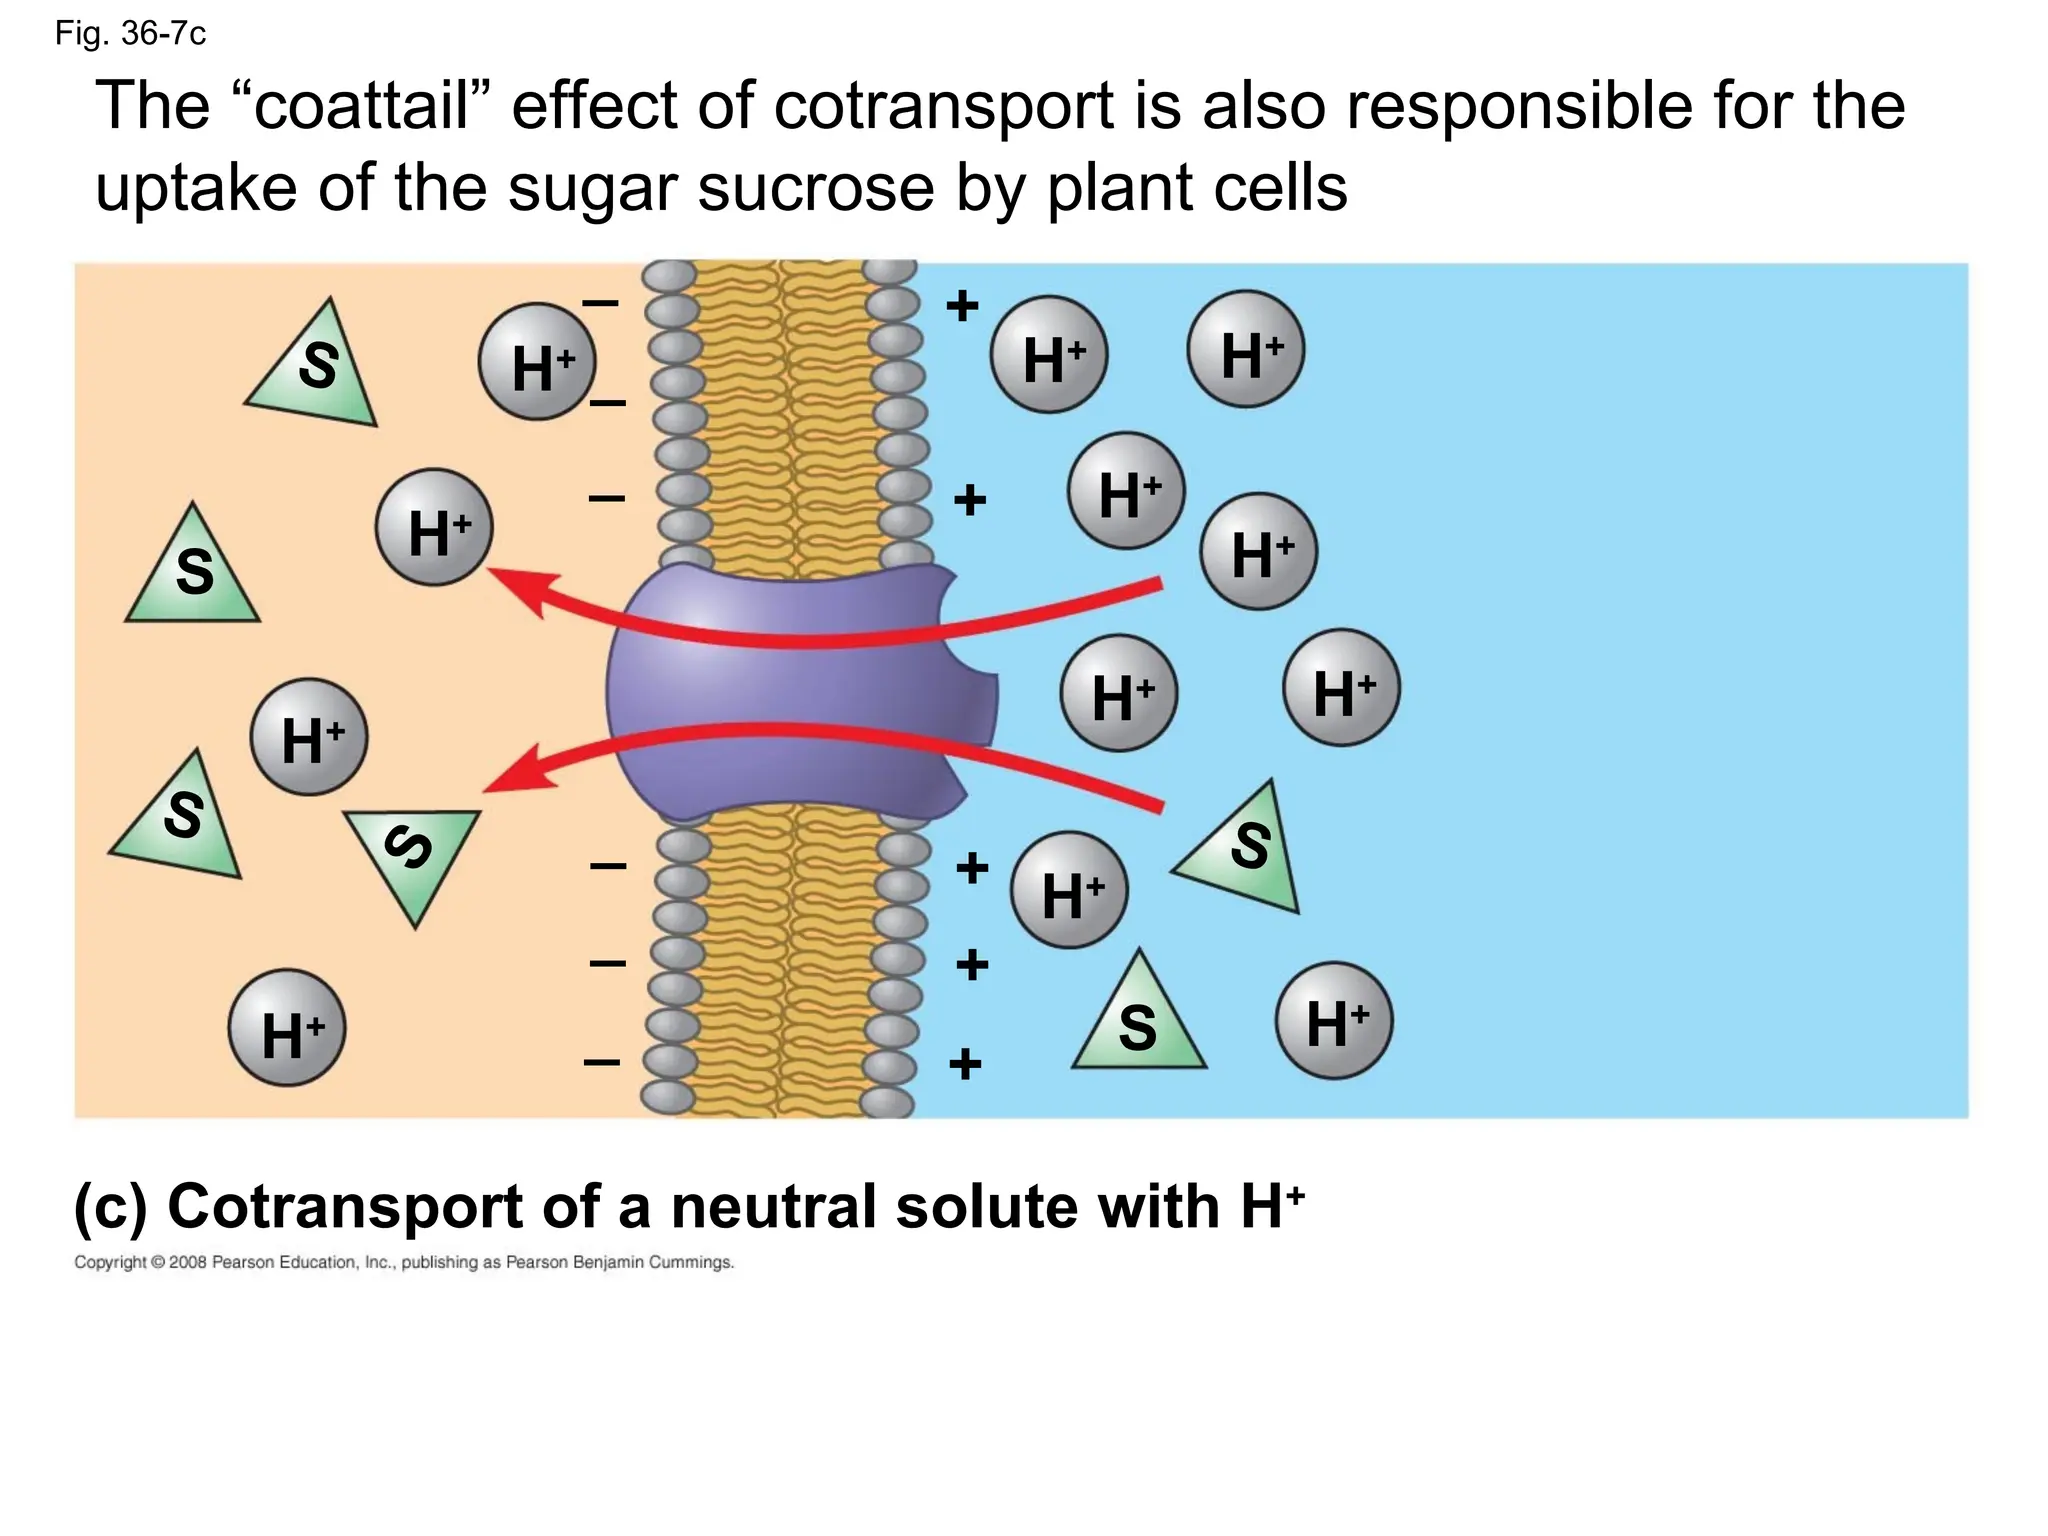
Fig. 36-7c
H+
H+
H+
H+
H+ H+
H+
H+
H+H+
H+
H+
_
_
_
_
_
_
+
+
+
+
+
S
S
S
S
S
(c) Cotransport of a neutral solute with H+
S
The “coattail” effect of cotransport is also responsible for the
uptake of the sugar sucrose by plant cells
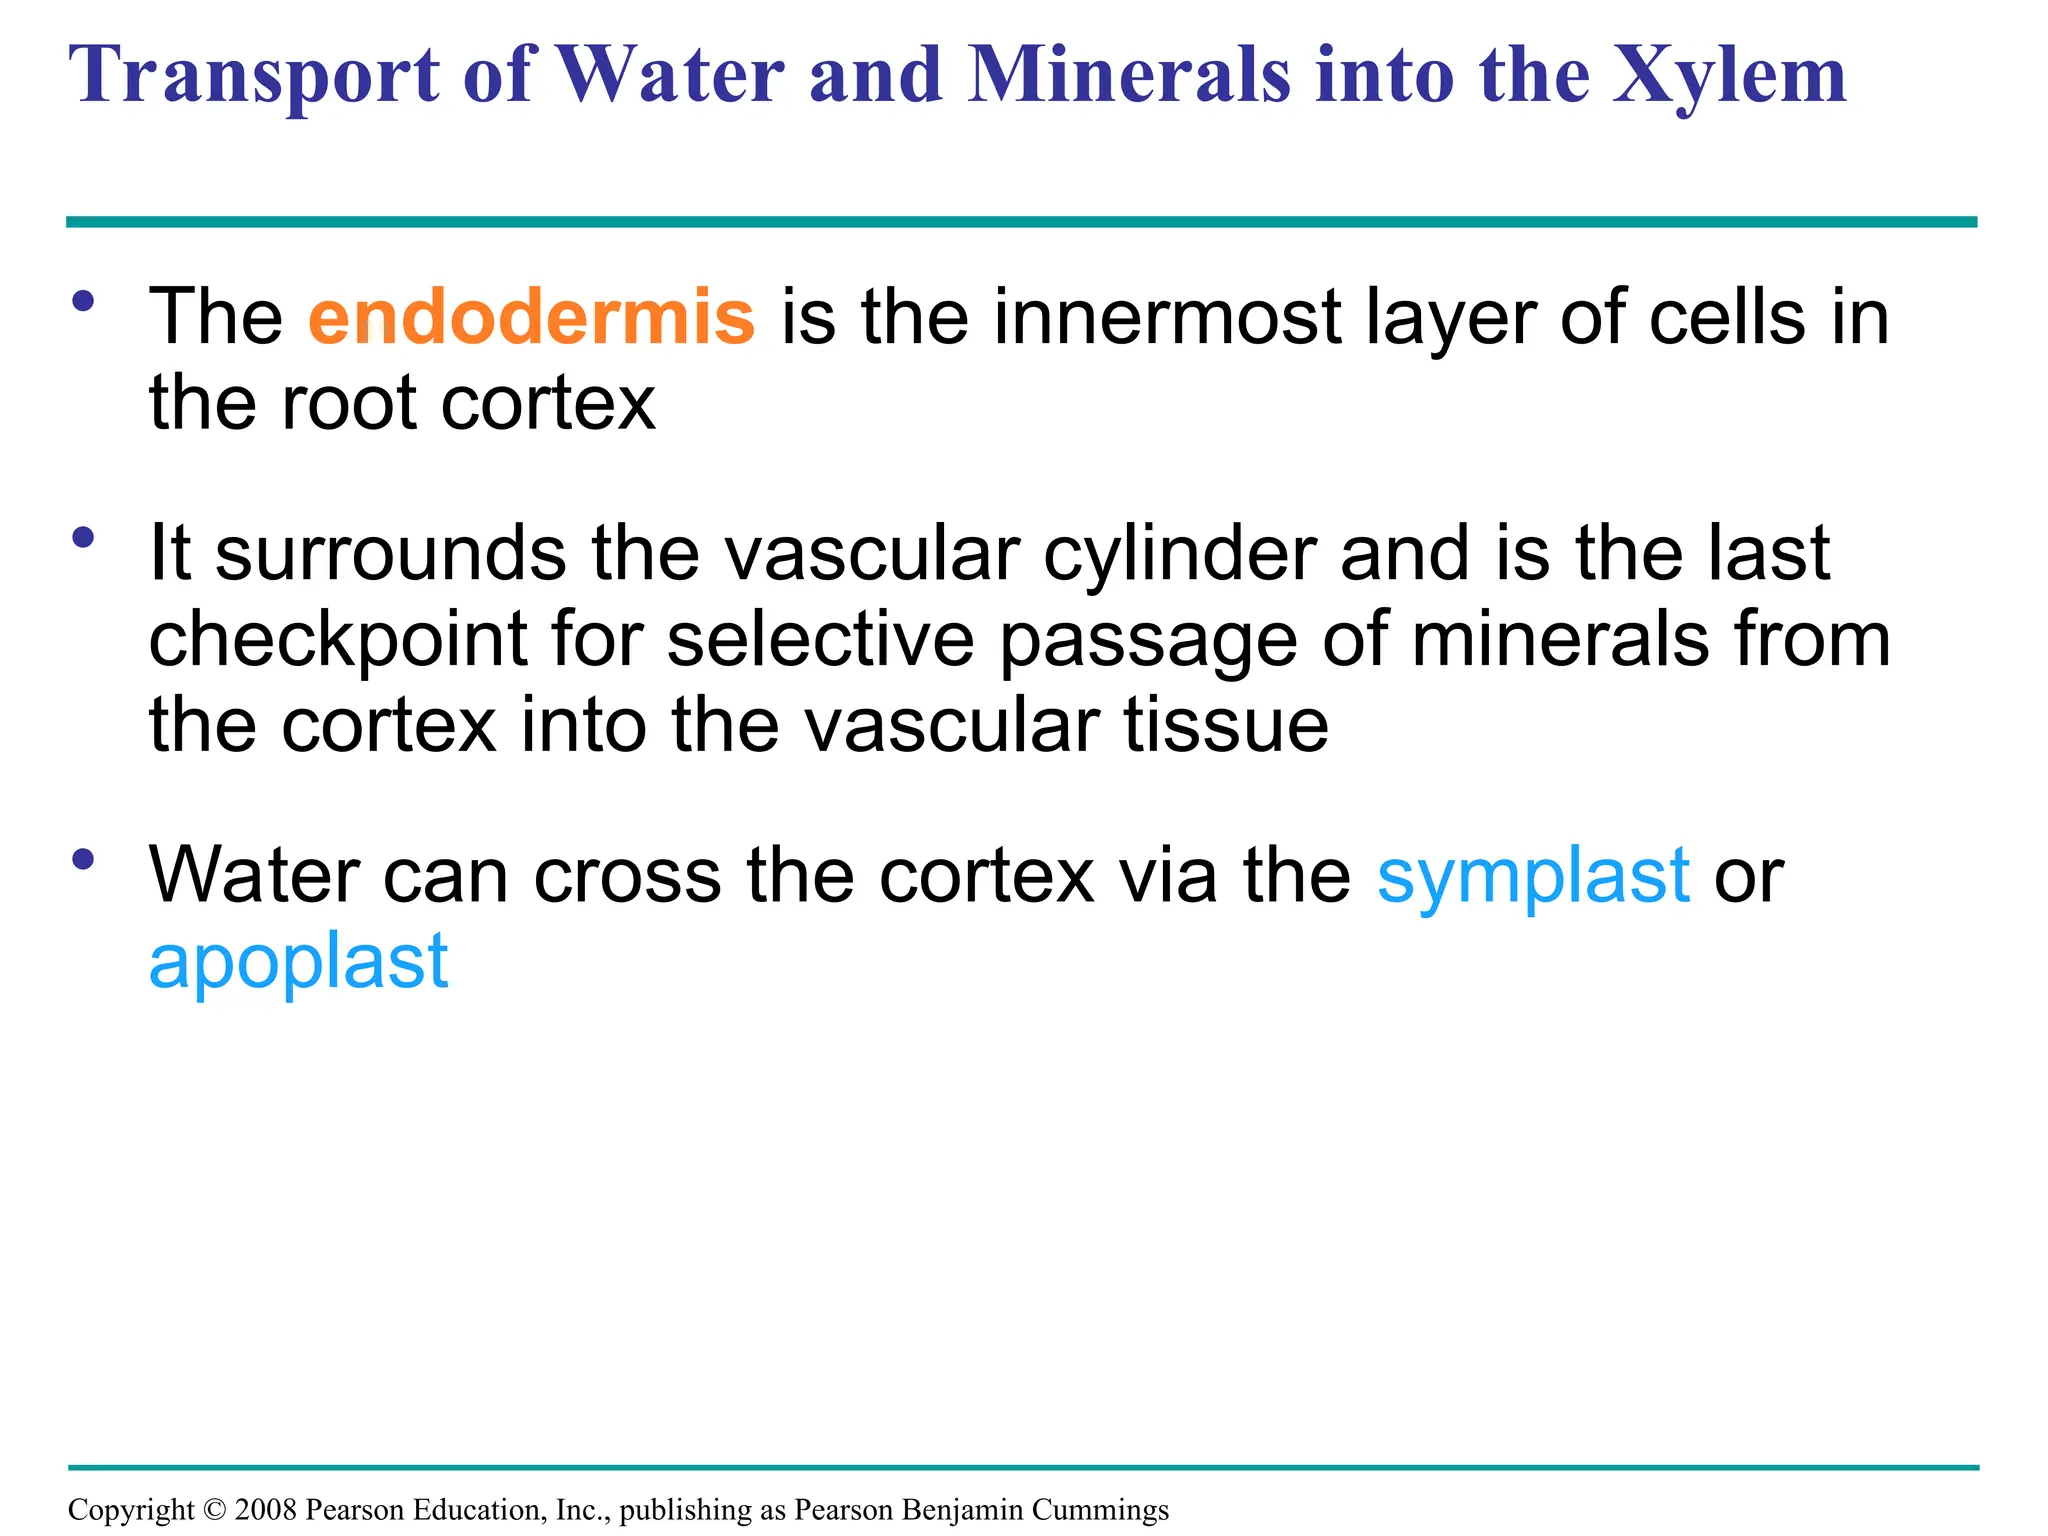
Fig. 36-12b
Casparian strip
Endodermalcell
Pathway along
apoplast
Pathway
through
symplast
The waxy Casparian strip of the endodermal wall blocks apoplastic transfer
of minerals from the cortex to the vascular cylinder
Radially oriented
cellulose microfibrils
turgid/Stomaopen flaccid/Stoma closed
Vacuole
Guard cell
Guard cells Guard cells
turgid/Stoma open flaccid/Stoma closed
Role of potassium in stomatal opening and closing
H2O H2O
H2O
H2O
H2O
H2O H2O
H2O
H2O
H2O
K+
Mechanisms of Stomatal
Opening and Closing
Changes in turgor pressure open
and close stomata
These result primarily from the
reversible uptake and loss of
potassium ions by the guard cells
Fig. 36-19
Cell walls(apoplast)
Plasma membrane
Plasmodesmata
Companion
(transfer) cell
Sieve-tube
element
High H+
concentration Cotransporter
Proton
pump
Low H+
concentration
Key
Apoplast
Symplast Mesophyll cell
Bundle-
sheath cell
Phloem
parenchyma cell
Sucrose
ATP
H+
H+ H+
S
S
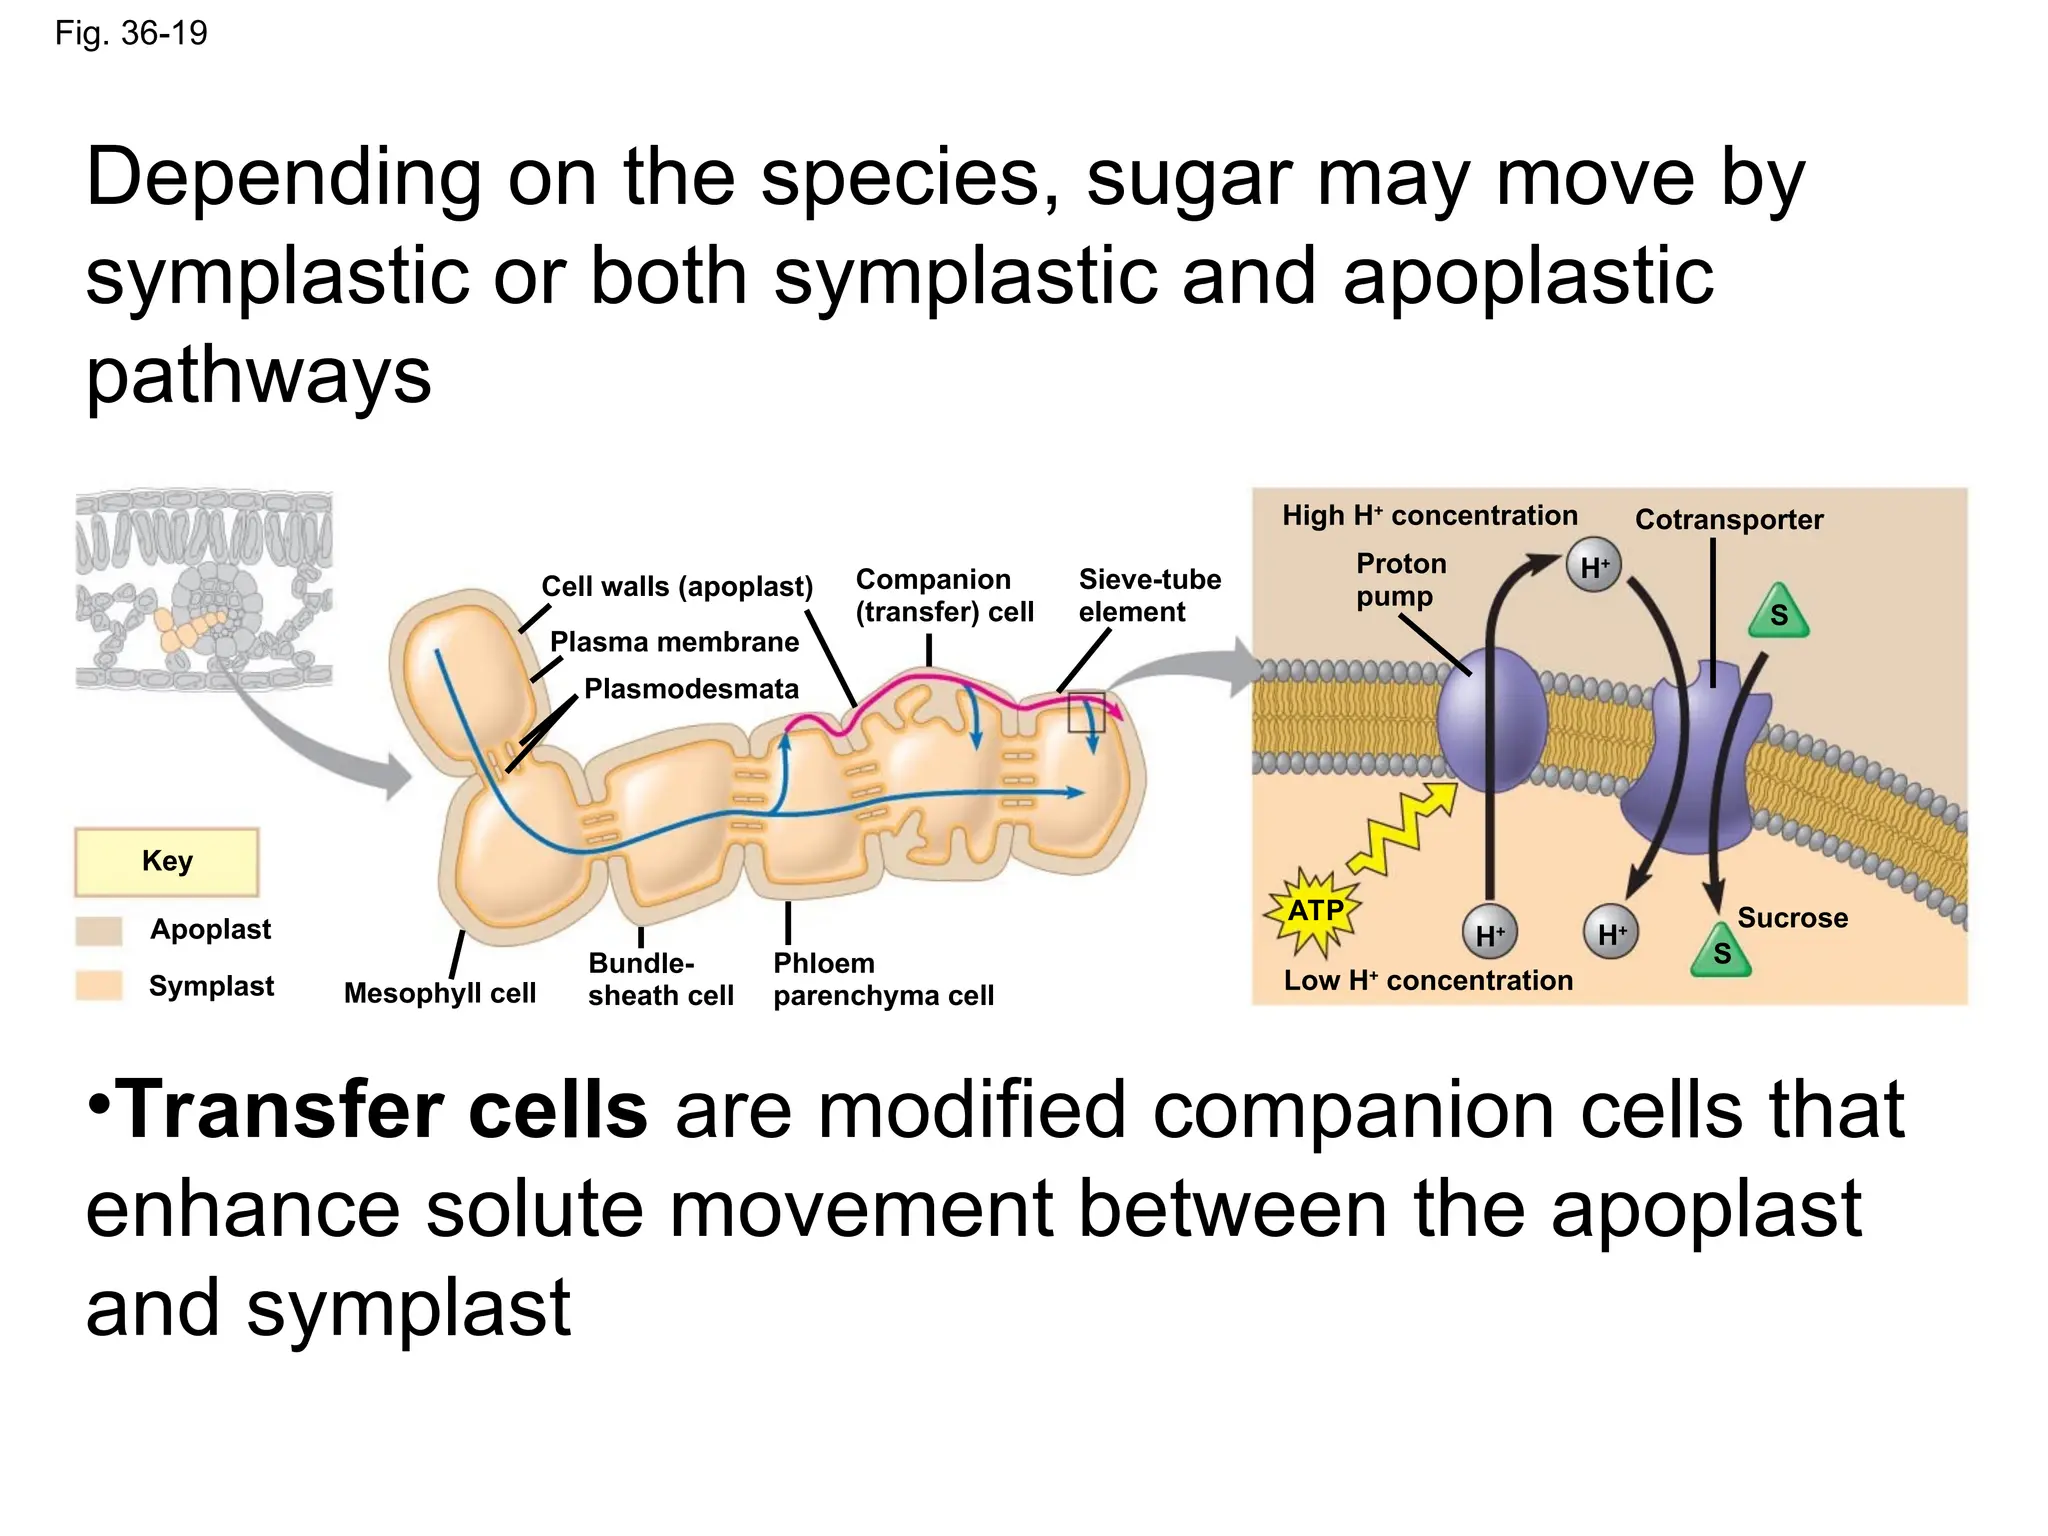
Depending on the species, sugar may move by
symplastic or both symplastic and apoplastic
pathways
•Transfer cells are modified companion cells that
enhance solute movement between the apoplast
and symplast
56.
High H+
concentration Cotransporter
Proton
pump
LowH+
concentration
Sucrose
H+
H+
H+
ATP
S
S
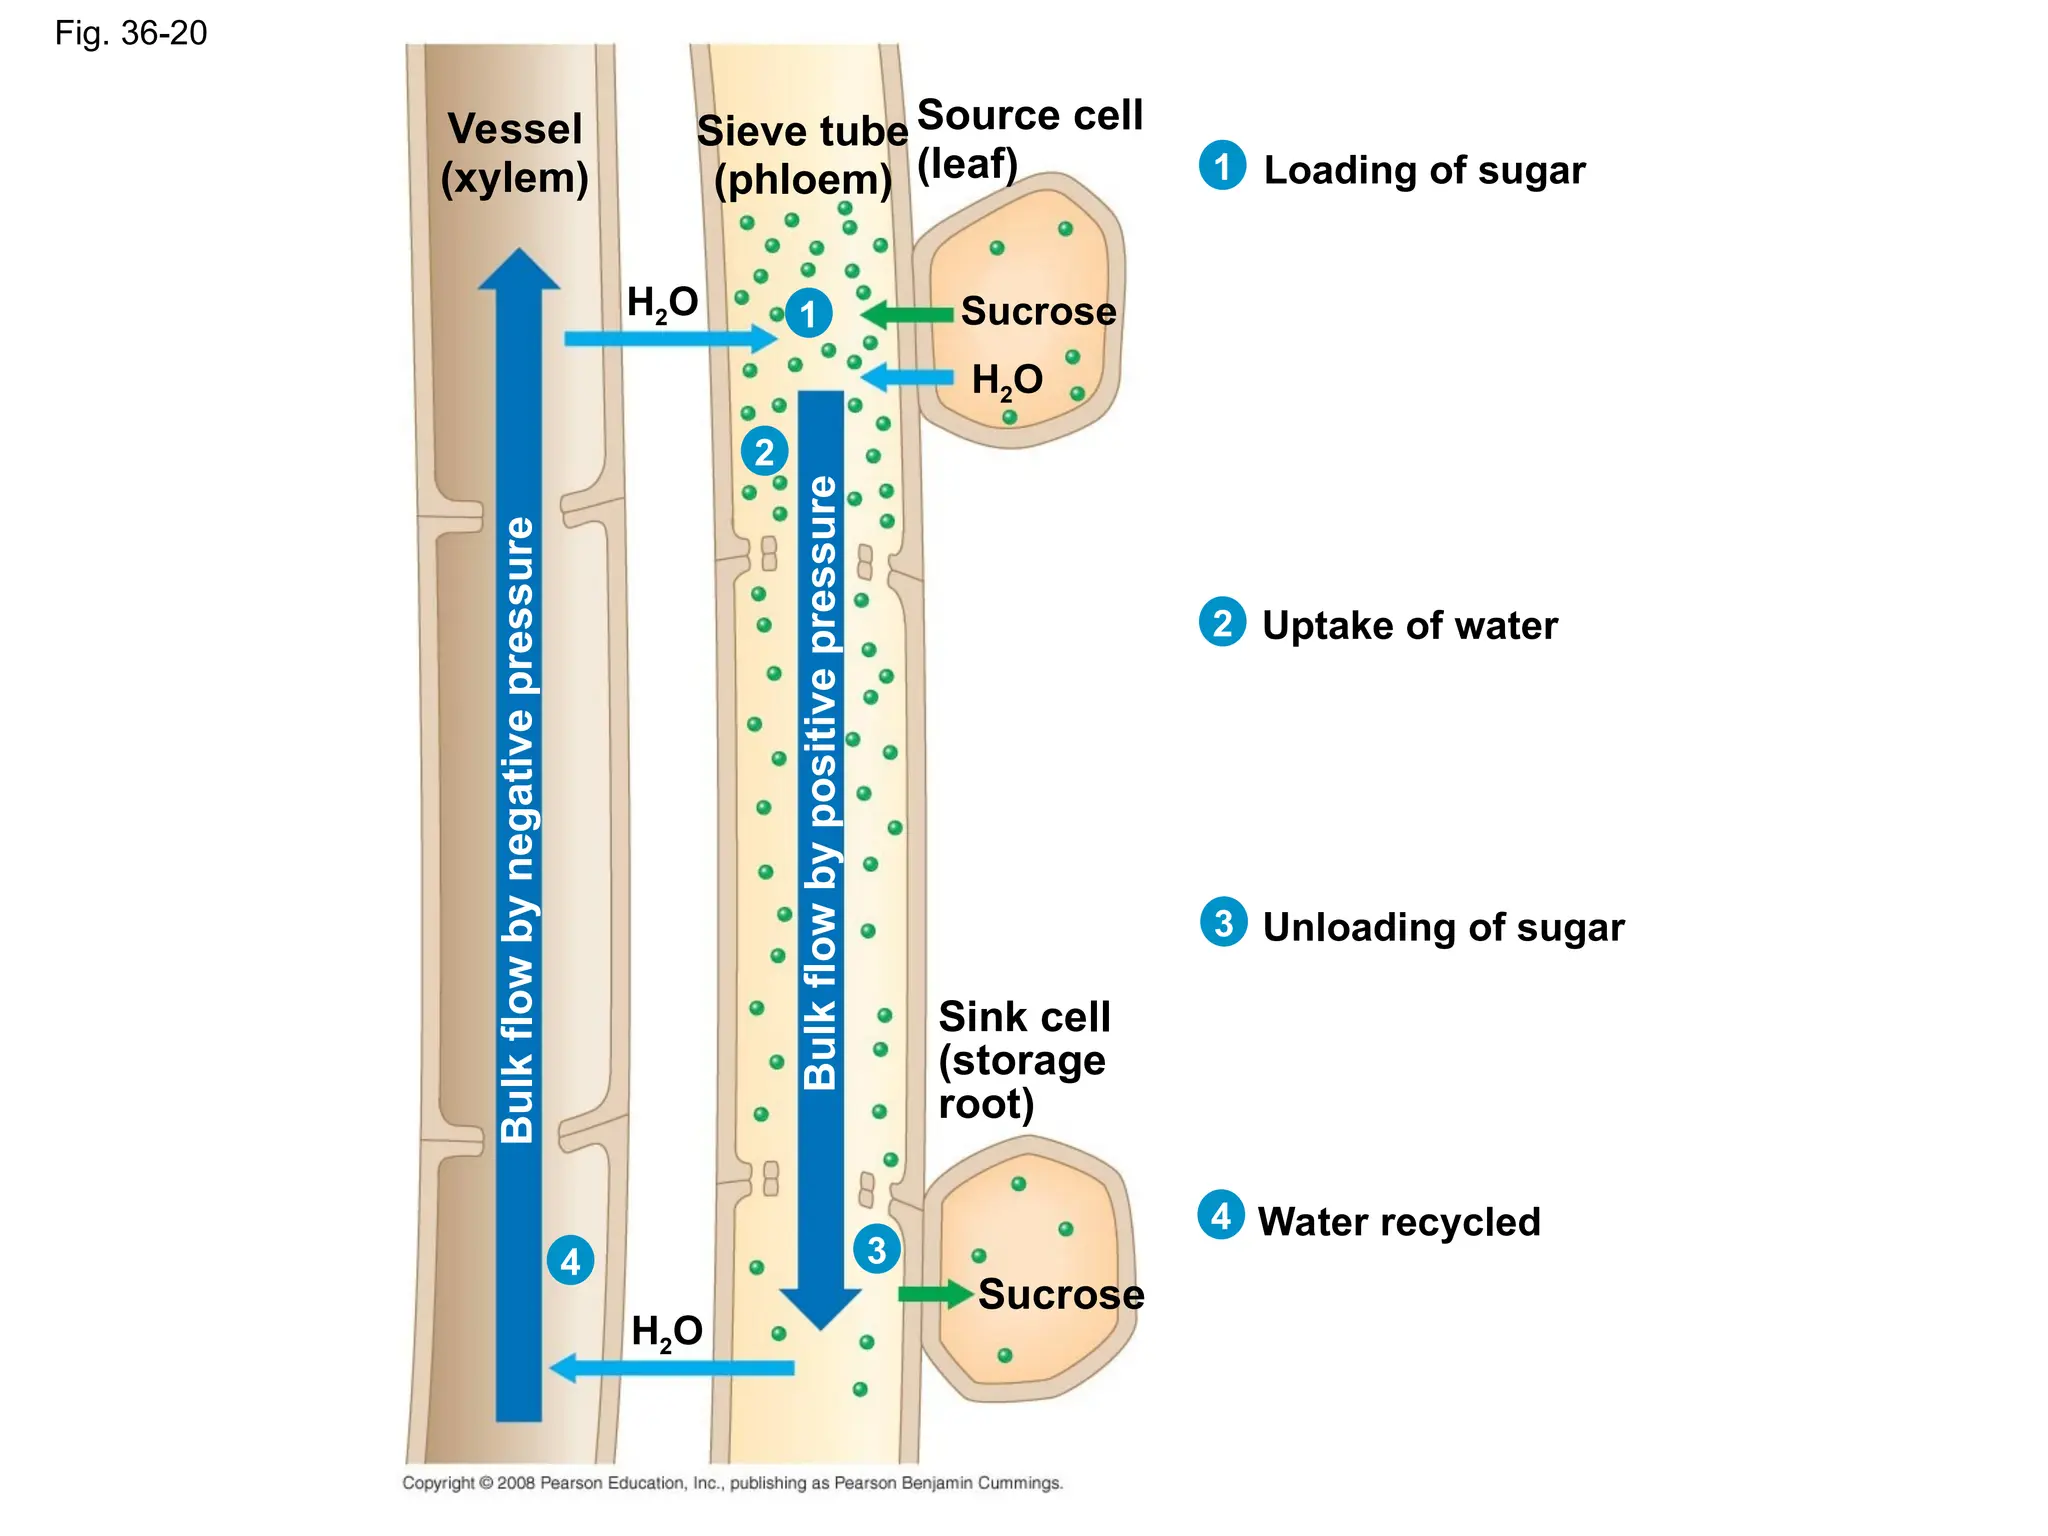
*In many plants, phloem loading requires active transport
*Proton pumping and cotransport of sucrose and H+ enable
the cells to accumulate sucrose
*At the sink, sugar molecules diffuse from the phloem to sink
tissues and are followed by water
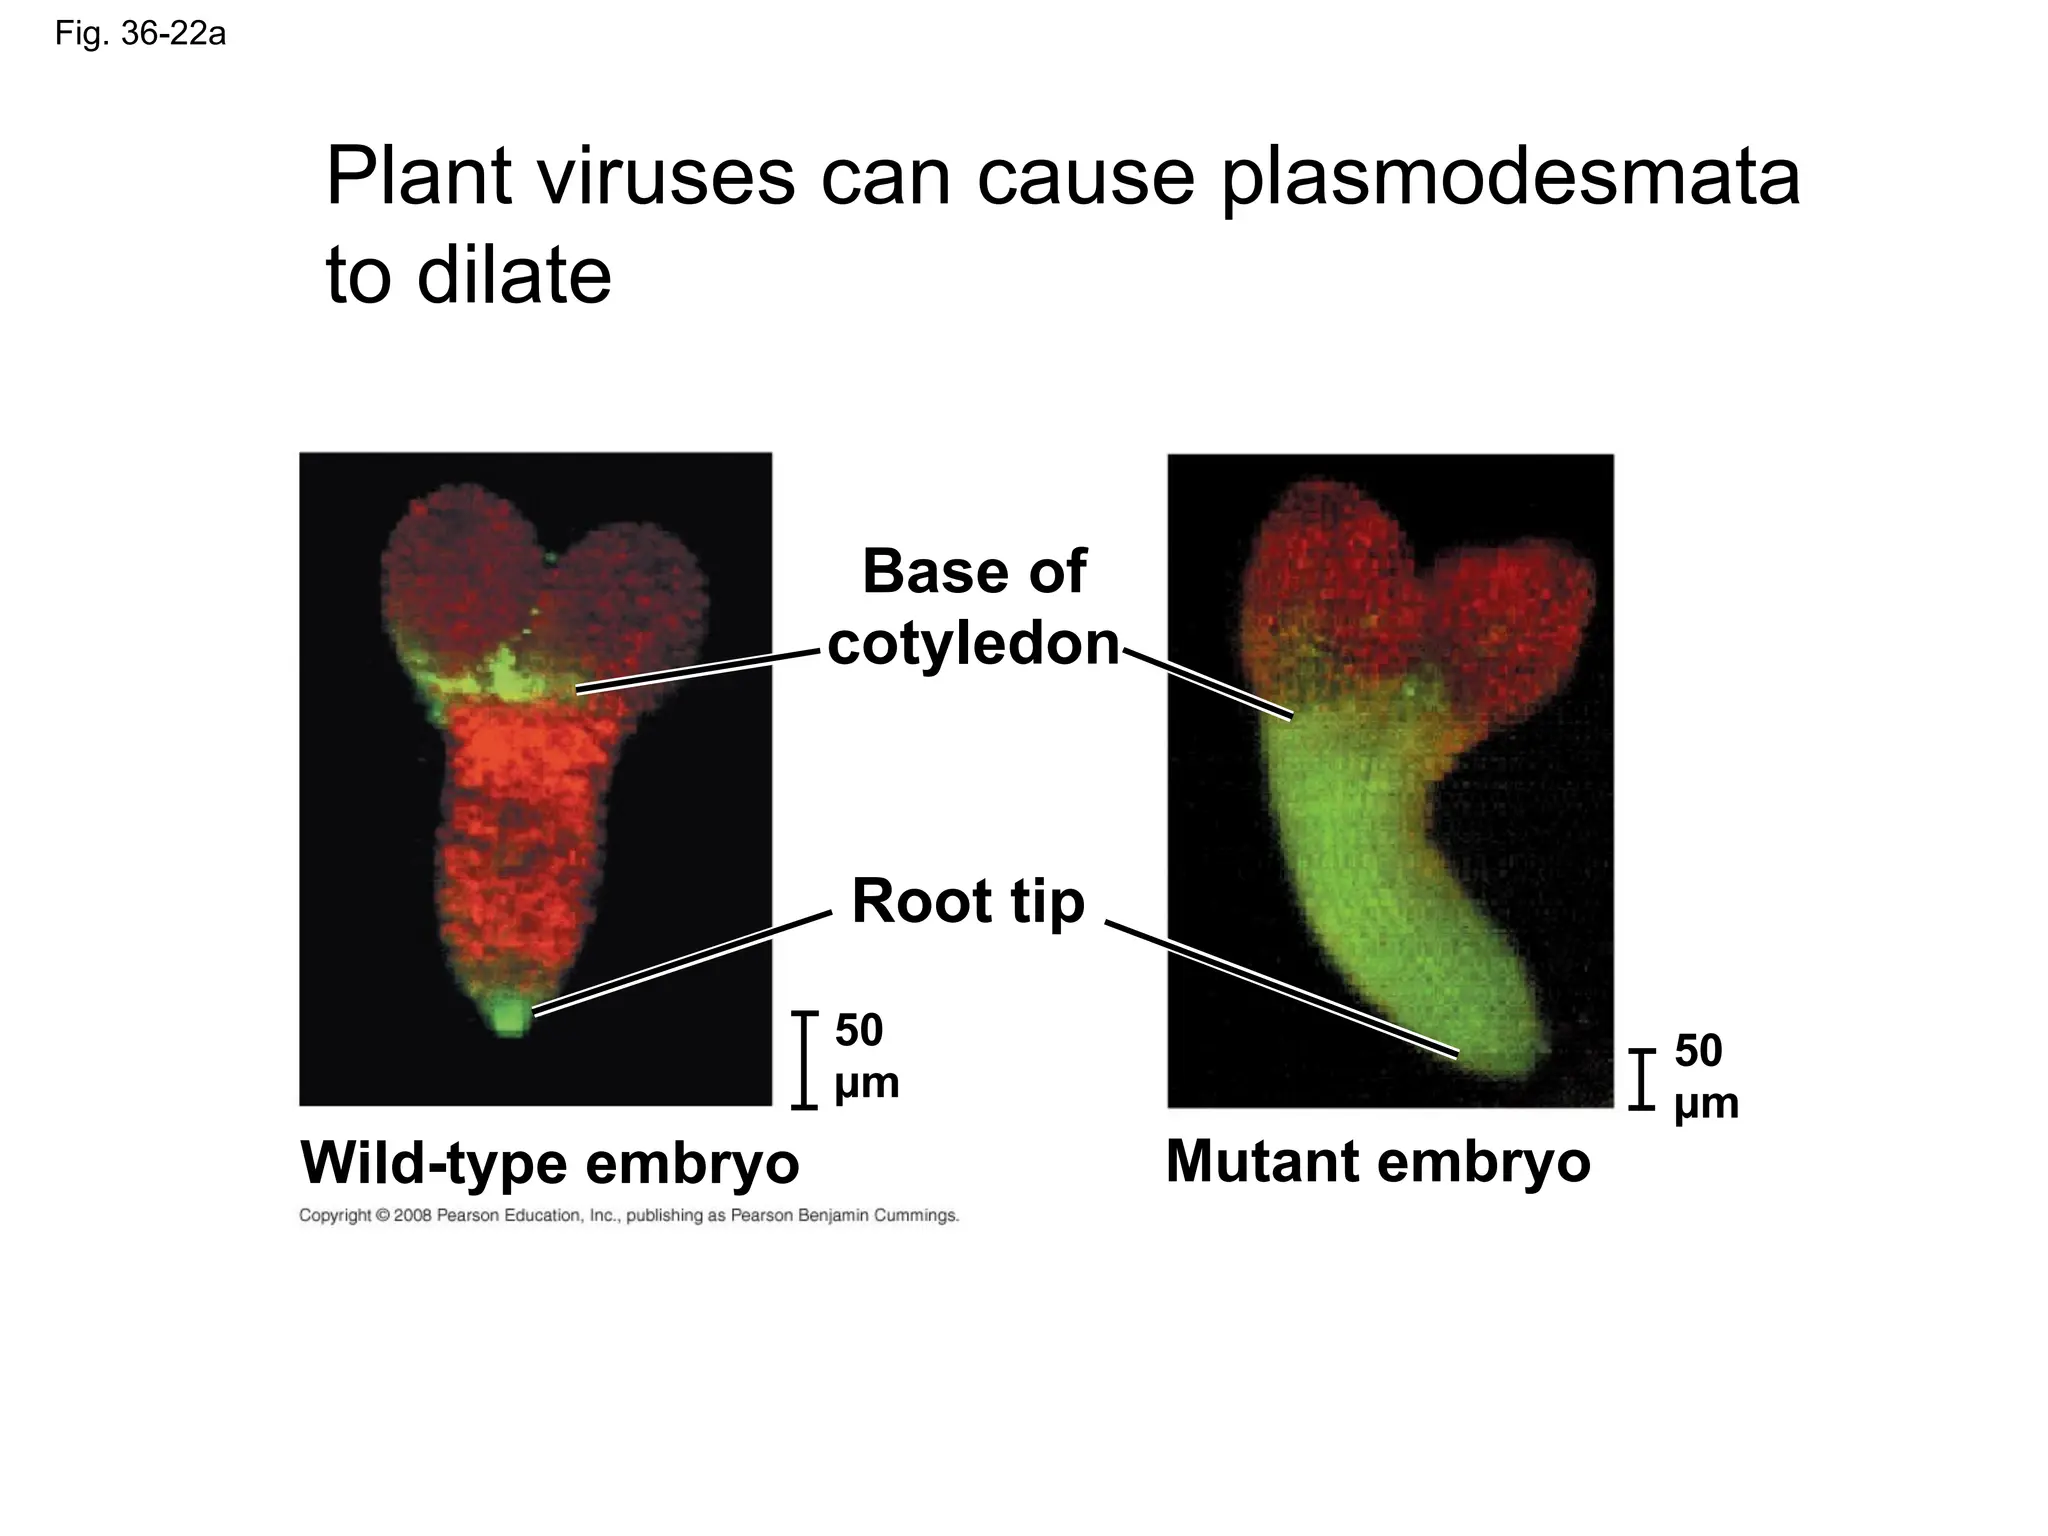
Fig. 36-22a
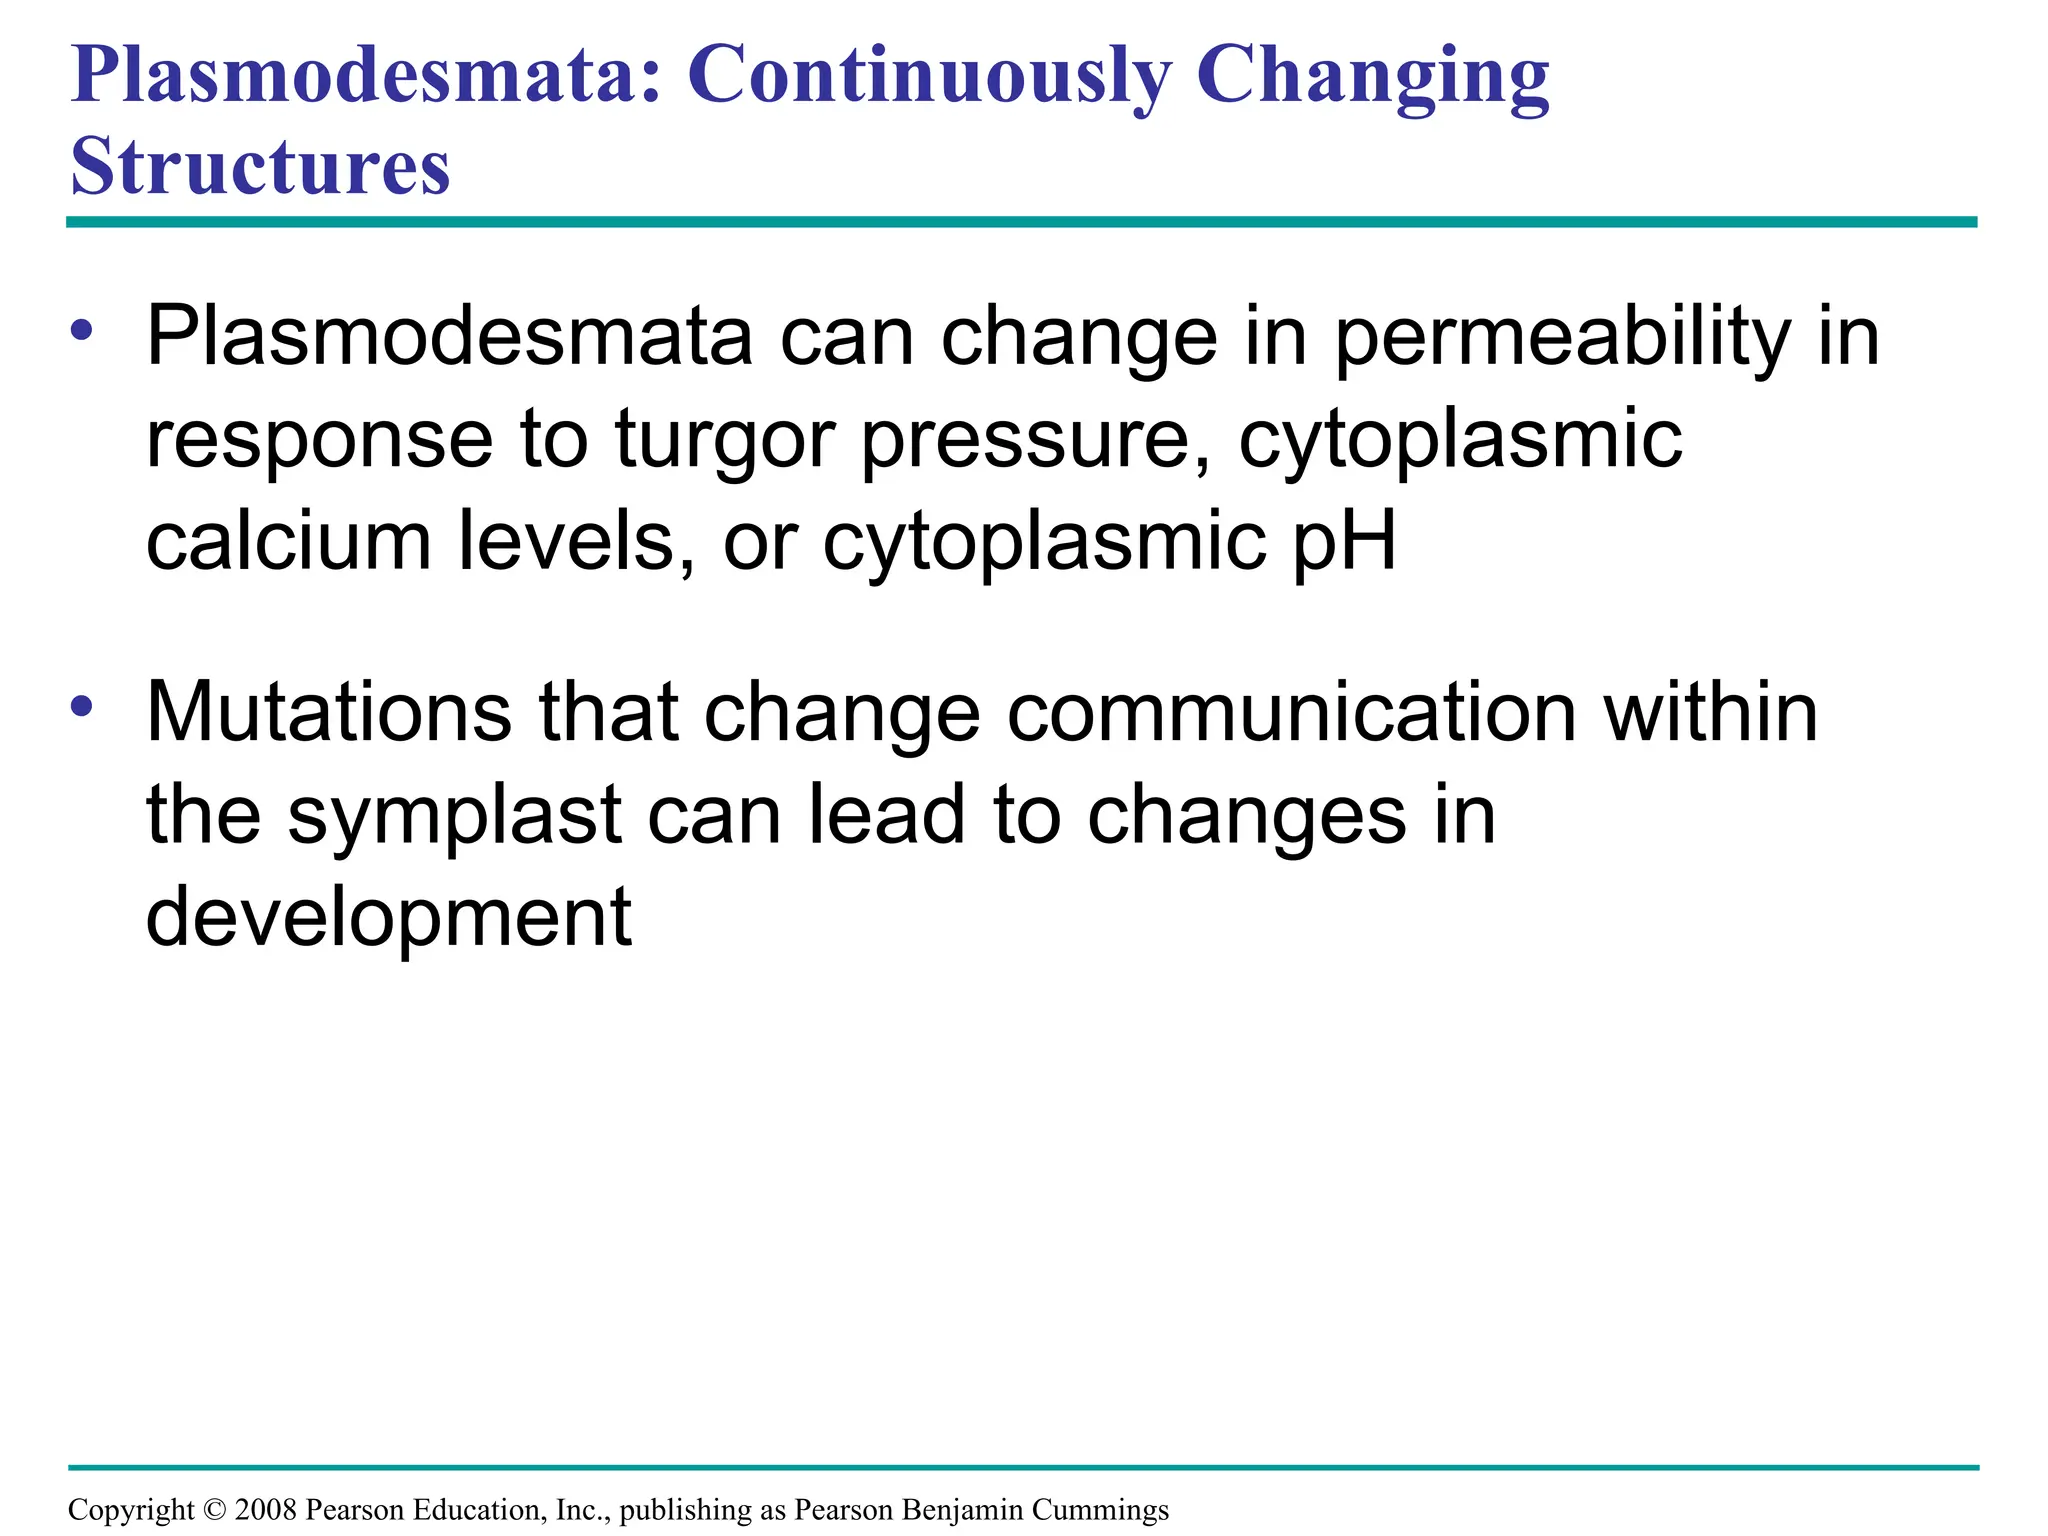
Plant virusescan cause plasmodesmata
to dilate
Base of
cotyledon
Root tip
50
µm
50
µm
Wild-type embryo Mutant embryo
62.
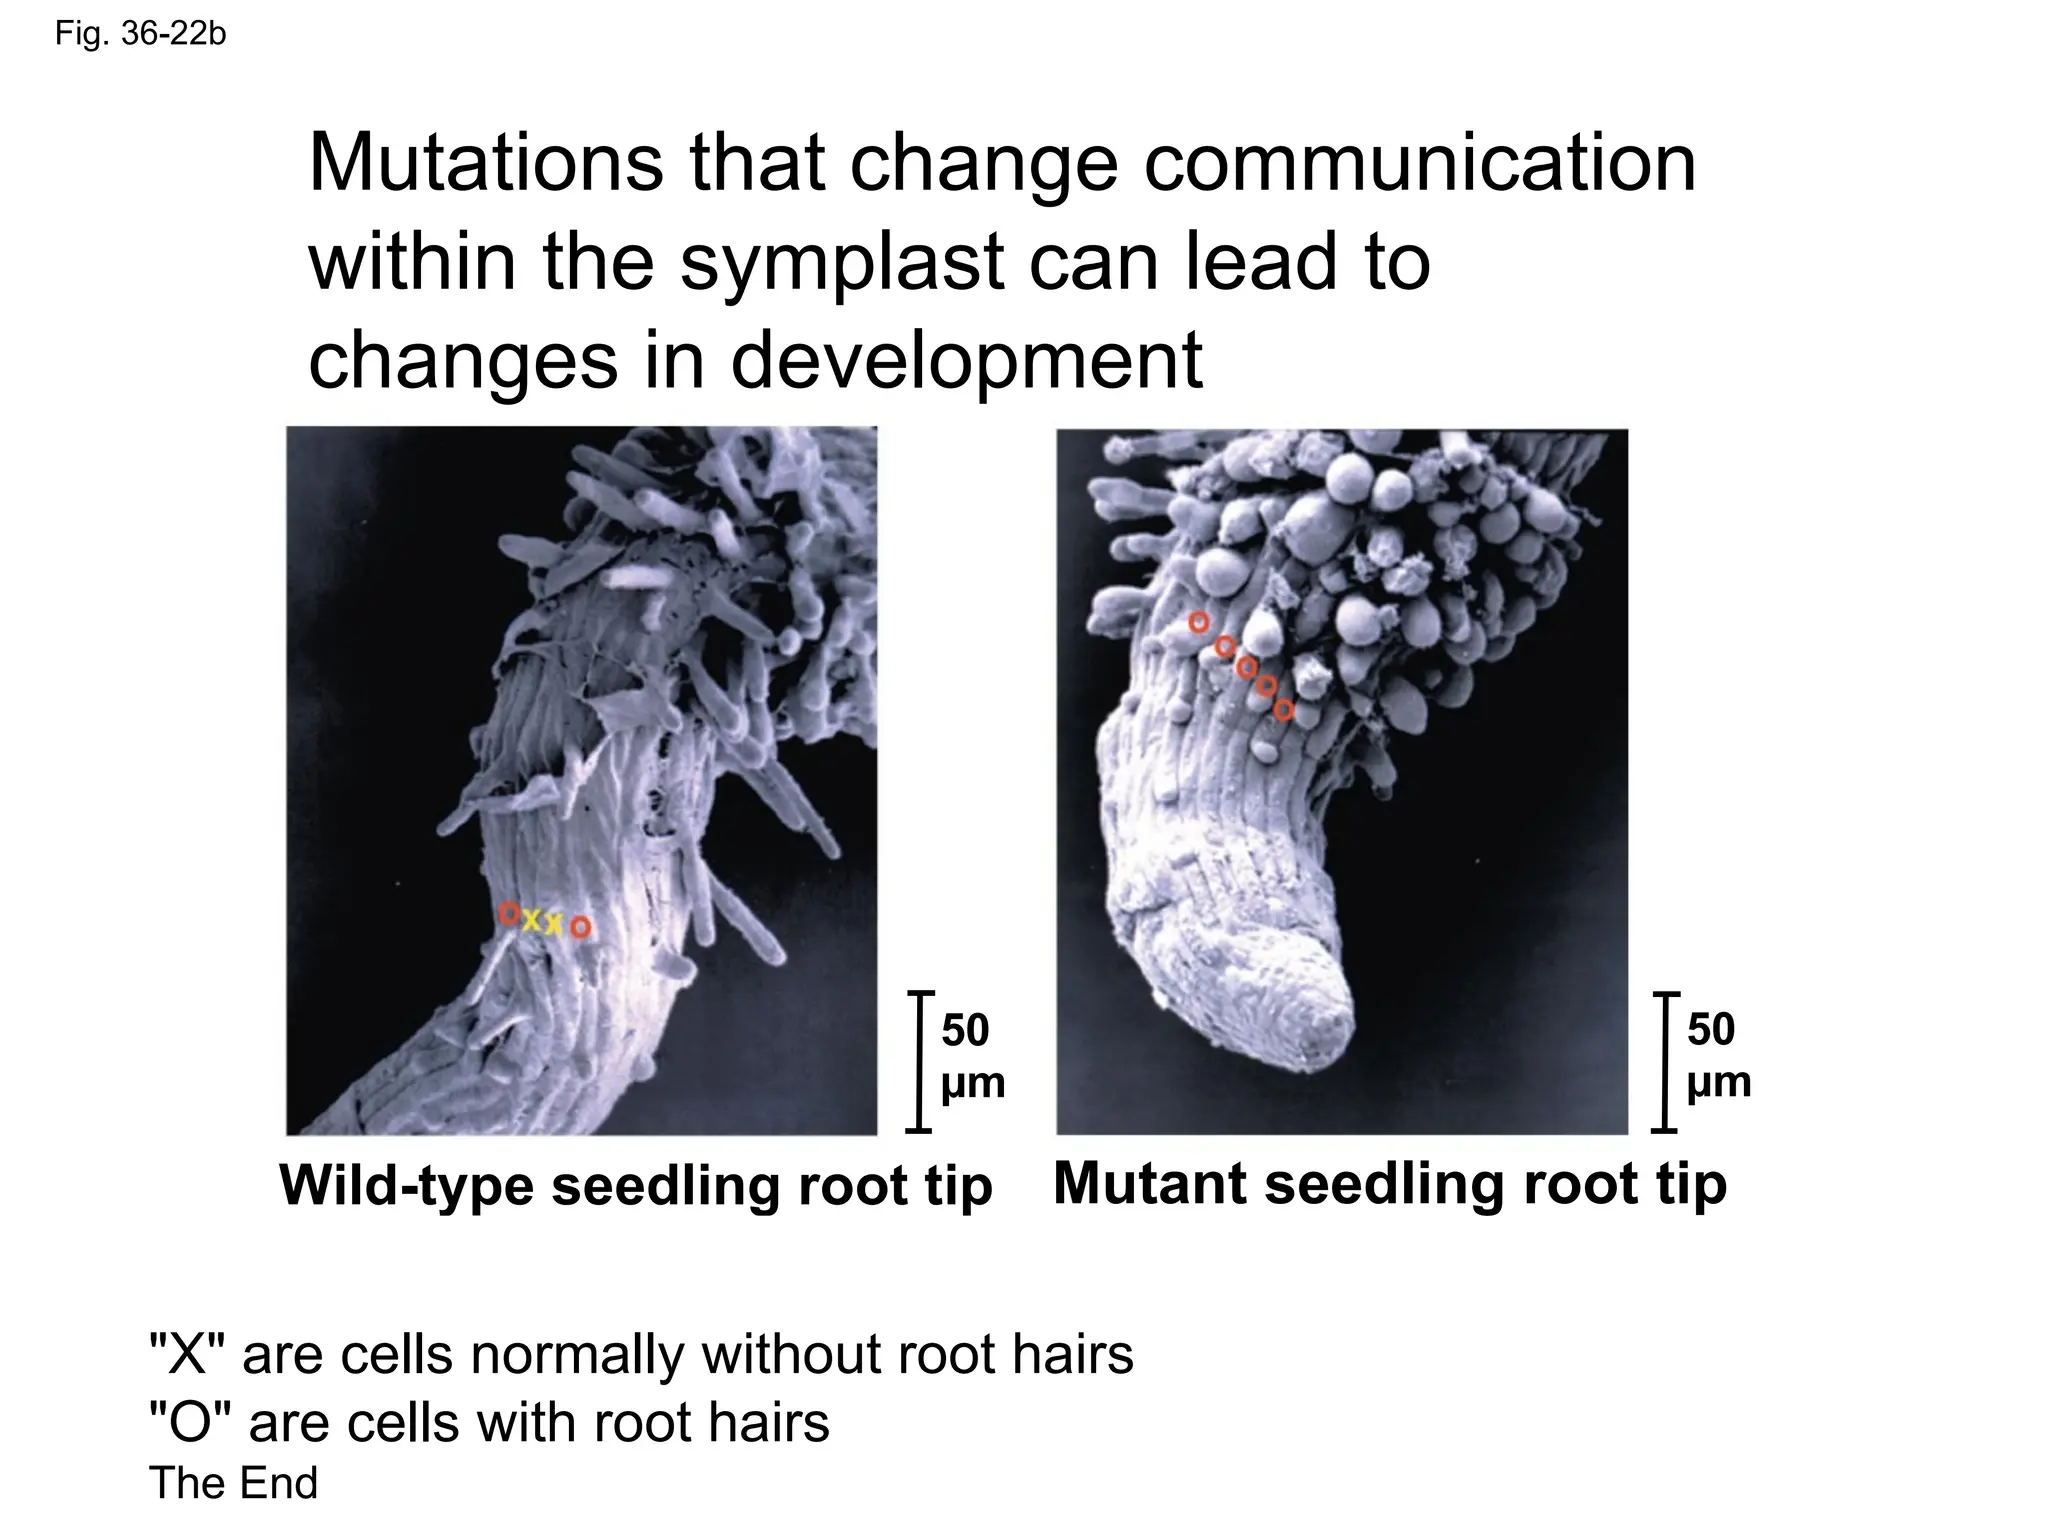
Fig. 36-22b
Mutations thatchange communication
within the symplast can lead to
changes in development
50
µm
50
µm
Wild-type seedling root tip Mutant seedling root tip
"X" are cells normally without root hairs
"O" are cells with root hairs
The End
Editor's Notes
#1 Figure 36.2 An overview of resource acquisition and transport in a vascular plant
#8 Figure 36.8a Water potential and water movement: an artificial model
#9 Figure 36.8b Water potential and water movement: an artificial model
#10 Figure 36.8c Water potential and water movement: an artificial model
#11 Figure 36.8d Water potential and water movement: an artificial model