Download as PDF, PPTX
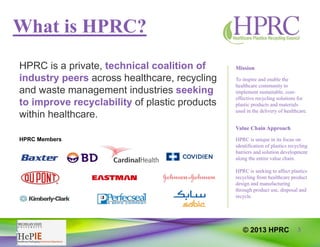
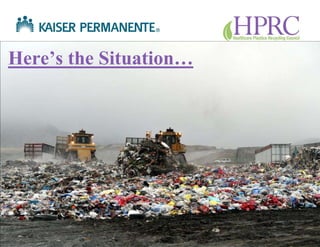
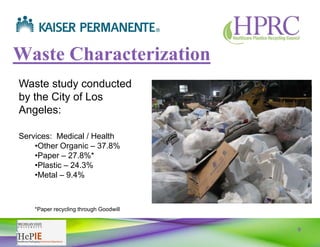
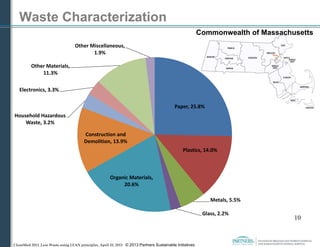
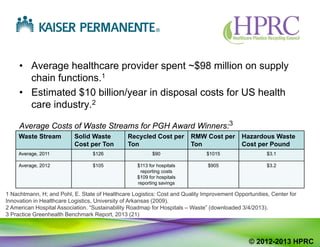
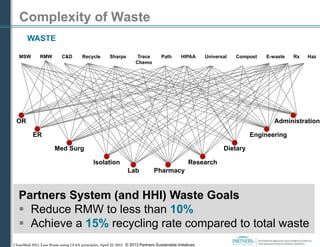
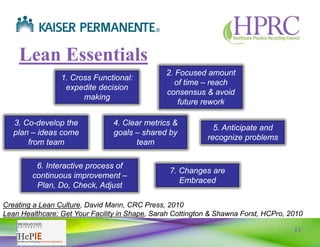
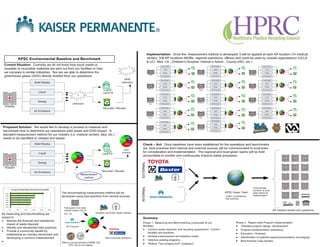
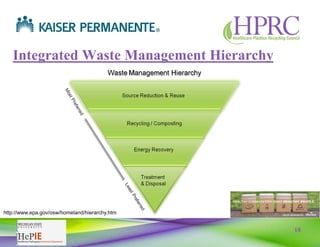
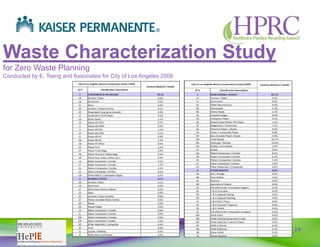
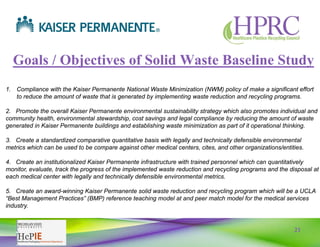
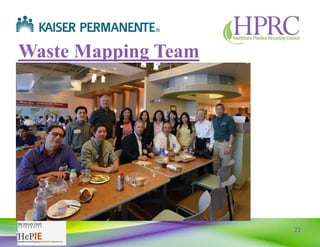
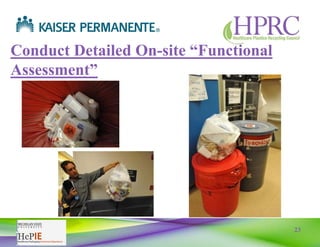
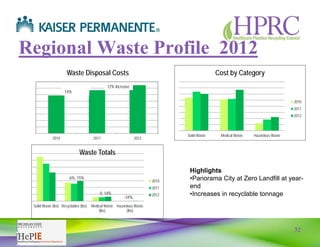
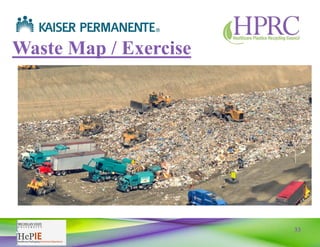
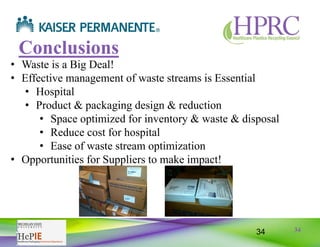

This document summarizes a presentation on applying lean techniques to reduce waste in healthcare. It discusses how healthcare facilities generate large amounts of waste, much of which is plastic, and the associated costs. It then introduces lean principles like value stream mapping to understand current waste processes and identify opportunities for improvement. The presentation describes a waste characterization study conducted at Kaiser Permanente to establish metrics and map waste streams. The goal is to standardize metrics to track progress in waste reduction and recycling over time.


