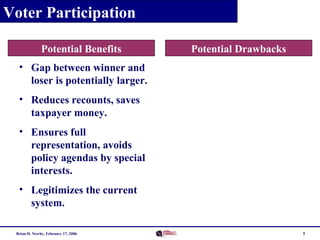
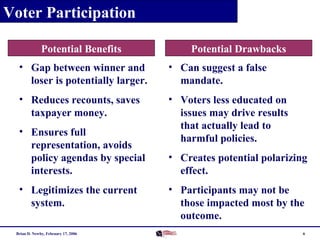
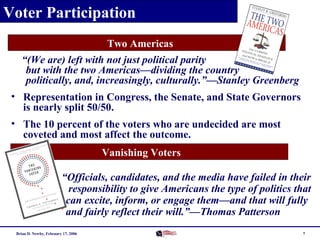
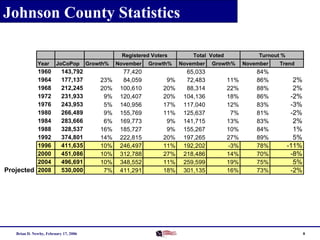
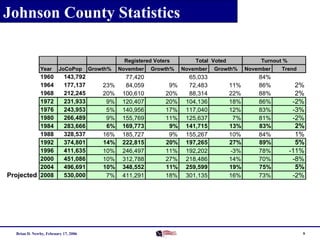
Voter Participation Discussion

Brian D. Newby
Election Commissioner
Johnson County, Kansas
February 17, 2006
Session Objectives
Today’s session is intended to:
• Identify viewpoints on benefits and drawbacks of voter
participation.
• Provide a landscape view of voter participation in
Johnson County.
• Identify trends in Johnson County voter participation.
• Raise potential next steps for further analysis.

Brian D. Newby, February 17, 2006

2
Johnson County Elections, 2005
JAN
1
2
3
4
5

FEB

MAR

APR

MAY

JUN

JUL

AUG

SEP

OCT

NOV

DEC

BV 229
SH 230
GE 231
Spring Primary
Spring General

6 Gardner Parks & Recreation
7

Roeland Pk Ward 4

8

Merriam City

9

County Tax Question

5-City Primary
5-City General

Regularly Scheduled Elections
Primary

Brian D. Newby, February 17, 2006

General

Special Elections
Mail Ballot

Polls

3
Johnson County Elections, 2006
JAN

FEB

MAR

APR

MAY

JUN

JUL

AUG

SEP

OCT

NOV

DEC

5-City Primary
5-City General

Primary – Partisan

General - Gubernatorial

2007 Spring Primary
2007 Spring General

Regularly Scheduled Elections
Primary

Brian D. Newby, February 17, 2006

General

Special Elections
Mail Ballot

Polls

4
Voter Participation
Potential Benefits

Potential Drawbacks

• Gap between winner and
loser is potentially larger.
• Reduces recounts, saves
taxpayer money.
• Ensures full
representation, avoids
policy agendas by special
interests.
• Legitimizes the current
system.
Brian D. Newby, February 17, 2006

5
Voter Participation
Potential Benefits

Potential Drawbacks

• Gap between winner and
loser is potentially larger.

• Can suggest a false
mandate.

• Reduces recounts, saves
taxpayer money.

• Voters less educated on
issues may drive results
that actually lead to
harmful policies.

• Ensures full
representation, avoids
policy agendas by special
interests.
• Legitimizes the current
system.
Brian D. Newby, February 17, 2006

• Creates potential polarizing
effect.
• Participants may not be
those impacted most by the
outcome.
6
Voter Participation
Two Americas
“(We are) left with not just political parity
but with the two Americas—dividing the country
politically, and, increasingly, culturally.”—Stanley Greenberg
• Representation in Congress, the Senate, and State Governors
is nearly split 50/50.
• The 10 percent of the voters who are undecided are most
coveted and most affect the outcome.
Vanishing Voters
“Officials, candidates, and the media have failed in their
responsibility to give Americans the type of politics that
can excite, inform, or engage them—and that will fully
and fairly reflect their will.”—Thomas Patterson
Brian D. Newby, February 17, 2006

7
Johnson County Statistics
Registered Voters
Year

1960
1964
1968
1972
1976
1980
1984
1988
1992
1996
2000
2004
Projected 2008

JoCoPop

143,792
177,137
212,245
231,933
243,953
266,489
283,666
328,537
374,801
411,635
451,086
496,691
530,000

Brian D. Newby, February 17, 2006

Growth%

23%
20%
9%
5%
9%
6%
16%
14%
10%
10%
10%
7%

November

77,420
84,059
100,610
120,407
140,956
155,769
169,773
185,727
222,815
246,497
312,788
348,552
411,291

Growth%

9%
20%
20%
17%
11%
9%
9%
20%
11%
27%
11%
18%

Total Voted
November

65,033
72,483
88,314
104,136
117,040
125,637
141,715
155,267
197,265
192,202
218,486
259,599
301,135

Turnout %

Growth%

11%
22%
18%
12%
7%
13%
10%
27%
-3%
14%
19%
16%

November

84%
86%
88%
86%
83%
81%
83%
84%
89%
78%
70%
75%
73%

Trend

2%
2%
-2%
-3%
-2%
2%
1%
5%
-11%
-8%
5%
-2%

8
Johnson County Statistics
Registered Voters
Year

1960
1964
1968
1972
1976
1980
1984
1988
1992
1996
2000
2004
Projected 2008

JoCoPop

143,792
177,137
212,245
231,933
243,953
266,489
283,666
328,537
374,801
411,635
451,086
496,691
530,000

Brian D. Newby, February 17, 2006

Growth%

23%
20%
9%
5%
9%
6%
16%
14%
10%
10%
10%
7%

November

77,420
84,059
100,610
120,407
140,956
155,769
169,773
185,727
222,815
246,497
312,788
348,552
411,291

Growth%

9%
20%
20%
17%
11%
9%
9%
20%
11%
27%
11%
18%

Total Voted
November

65,033
72,483
88,314
104,136
117,040
125,637
141,715
155,267
197,265
192,202
218,486
259,599
301,135

Turnout %

Growth%

11%
22%
18%
12%
7%
13%
10%
27%
-3%
14%
19%
16%

November

84%
86%
88%
86%
83%
81%
83%
84%
89%
78%
70%
75%
73%

Trend

2%
2%
-2%
-3%
-2%
2%
1%
5%
-11%
-8%
5%
-2%

9
Further Areas of Study
Further research that would bring greater learnings:
• Understand national and regional trends, including urban
vs. rural, socio-economic, and demographic trends.
• Identify more specifically the reasons why persons do not
vote and determine specific root causes, if any.
• Cite examples where efforts to raise voter participation
appeared successful and determine if they actually were.

Brian D. Newby, February 17, 2006

10

Voter Participation, Stanley Greenberg 2006

  • 1.
    Voter Participation Discussion BrianD. Newby Election Commissioner Johnson County, Kansas February 17, 2006
  • 2.
    Session Objectives Today’s sessionis intended to: • Identify viewpoints on benefits and drawbacks of voter participation. • Provide a landscape view of voter participation in Johnson County. • Identify trends in Johnson County voter participation. • Raise potential next steps for further analysis. Brian D. Newby, February 17, 2006 2
  • 3.
    Johnson County Elections,2005 JAN 1 2 3 4 5 FEB MAR APR MAY JUN JUL AUG SEP OCT NOV DEC BV 229 SH 230 GE 231 Spring Primary Spring General 6 Gardner Parks & Recreation 7 Roeland Pk Ward 4 8 Merriam City 9 County Tax Question 5-City Primary 5-City General Regularly Scheduled Elections Primary Brian D. Newby, February 17, 2006 General Special Elections Mail Ballot Polls 3
  • 4.
    Johnson County Elections,2006 JAN FEB MAR APR MAY JUN JUL AUG SEP OCT NOV DEC 5-City Primary 5-City General Primary – Partisan General - Gubernatorial 2007 Spring Primary 2007 Spring General Regularly Scheduled Elections Primary Brian D. Newby, February 17, 2006 General Special Elections Mail Ballot Polls 4
  • 5.
    Voter Participation Potential Benefits PotentialDrawbacks • Gap between winner and loser is potentially larger. • Reduces recounts, saves taxpayer money. • Ensures full representation, avoids policy agendas by special interests. • Legitimizes the current system. Brian D. Newby, February 17, 2006 5
  • 6.
    Voter Participation Potential Benefits PotentialDrawbacks • Gap between winner and loser is potentially larger. • Can suggest a false mandate. • Reduces recounts, saves taxpayer money. • Voters less educated on issues may drive results that actually lead to harmful policies. • Ensures full representation, avoids policy agendas by special interests. • Legitimizes the current system. Brian D. Newby, February 17, 2006 • Creates potential polarizing effect. • Participants may not be those impacted most by the outcome. 6
  • 7.
    Voter Participation Two Americas “(Weare) left with not just political parity but with the two Americas—dividing the country politically, and, increasingly, culturally.”—Stanley Greenberg • Representation in Congress, the Senate, and State Governors is nearly split 50/50. • The 10 percent of the voters who are undecided are most coveted and most affect the outcome. Vanishing Voters “Officials, candidates, and the media have failed in their responsibility to give Americans the type of politics that can excite, inform, or engage them—and that will fully and fairly reflect their will.”—Thomas Patterson Brian D. Newby, February 17, 2006 7
  • 8.
    Johnson County Statistics RegisteredVoters Year 1960 1964 1968 1972 1976 1980 1984 1988 1992 1996 2000 2004 Projected 2008 JoCoPop 143,792 177,137 212,245 231,933 243,953 266,489 283,666 328,537 374,801 411,635 451,086 496,691 530,000 Brian D. Newby, February 17, 2006 Growth% 23% 20% 9% 5% 9% 6% 16% 14% 10% 10% 10% 7% November 77,420 84,059 100,610 120,407 140,956 155,769 169,773 185,727 222,815 246,497 312,788 348,552 411,291 Growth% 9% 20% 20% 17% 11% 9% 9% 20% 11% 27% 11% 18% Total Voted November 65,033 72,483 88,314 104,136 117,040 125,637 141,715 155,267 197,265 192,202 218,486 259,599 301,135 Turnout % Growth% 11% 22% 18% 12% 7% 13% 10% 27% -3% 14% 19% 16% November 84% 86% 88% 86% 83% 81% 83% 84% 89% 78% 70% 75% 73% Trend 2% 2% -2% -3% -2% 2% 1% 5% -11% -8% 5% -2% 8
  • 9.
    Johnson County Statistics RegisteredVoters Year 1960 1964 1968 1972 1976 1980 1984 1988 1992 1996 2000 2004 Projected 2008 JoCoPop 143,792 177,137 212,245 231,933 243,953 266,489 283,666 328,537 374,801 411,635 451,086 496,691 530,000 Brian D. Newby, February 17, 2006 Growth% 23% 20% 9% 5% 9% 6% 16% 14% 10% 10% 10% 7% November 77,420 84,059 100,610 120,407 140,956 155,769 169,773 185,727 222,815 246,497 312,788 348,552 411,291 Growth% 9% 20% 20% 17% 11% 9% 9% 20% 11% 27% 11% 18% Total Voted November 65,033 72,483 88,314 104,136 117,040 125,637 141,715 155,267 197,265 192,202 218,486 259,599 301,135 Turnout % Growth% 11% 22% 18% 12% 7% 13% 10% 27% -3% 14% 19% 16% November 84% 86% 88% 86% 83% 81% 83% 84% 89% 78% 70% 75% 73% Trend 2% 2% -2% -3% -2% 2% 1% 5% -11% -8% 5% -2% 9
  • 10.
    Further Areas ofStudy Further research that would bring greater learnings: • Understand national and regional trends, including urban vs. rural, socio-economic, and demographic trends. • Identify more specifically the reasons why persons do not vote and determine specific root causes, if any. • Cite examples where efforts to raise voter participation appeared successful and determine if they actually were. Brian D. Newby, February 17, 2006 10