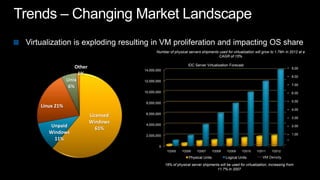
Number of physical servers shipments used for virtualization will grow to 1.7M+ in 2012 at a
                                                                              CAGR of 15%

                                                             IDC Server Virtualization Forecast
               Other                                                                                                          9.00
                                  14,000,000
                 1%
                                                                                                                              8.00
            Unix                  12,000,000
                                                                                                                              7.00
             6%
                                  10,000,000                                                                                  6.00

                                   8,000,000                                                                                  5.00
Linux 21%
                                                                                                                              4.00
                                   6,000,000
                       Licensed                                                                                               3.00
                       Windows
   Unpaid                 61%
                                   4,000,000                                                                                  2.00

   Windows                                                                                                                    1.00
                                   2,000,000
     11%
                                          0
                                                Y2005    Y2006     Y2007       Y2008   Y2009     Y2010   Y2011    Y2012

                                                              Physical Units           Logical Units        VM Density

                                               19% of physical server shipments will be used for virtualization, increasing from
                                                                              11.7% in 2007
www.virtualrealitycheck.net
http://www.enterprisestrategygroup.com/2010/07/microsoft-hyper-v-r2-scalable-native-server-virtualization-for-the-enterprise/
http://www.infostor.com/index/articles/display/5976242552/articles/infostor/esg-lab-review/2010/july-2010/microsoft-hyper-v.html
2010 ESG Lab Highlights: VM Scalability
       Hyper-V R2 on 16 servers with Microsoft Cluster Shared Volumes (CSV) stored on a
       single SAN attached disk array supported 1,024 virtual machines
                                                                           Virtual Machine Scalability
                                                                   1 through 16 Microsoft Hyper-V R2 Servers
                                                   1,024

                                                    896

                                                    768
                               Vrirtual Machines


                                                    640

                                                    512

                                                    384

                                                    256

                                                    128

                                                      0
                                                           0   2       4               6              8              10             12             14            16

                                                                                Clustered Hyper-V R2 Servers
       http://www.enterprisestrategygroup.com/2010/11/emc-symmetrix-vmax-and-microsoft-server-virtualization-scalable-enterprise-class-virtual-infrastructure/

© 2011 Enterprise Strategy Group                                                                10
2010 ESG Lab Highlights: Mixed Workloads
       Hyper-V R2 on 2 servers with 16 VMs sharing a single disk array:
       •   18,750 mailboxes with the Microsoft Exchange 2010 Jetstress utility
       •   and 3,475 small database IOs per second with the Microsoft SQLIO utility
       •   and 650 MB/sec of database throughput with the SQLIO utility
       •   and 3,106 simulated web server IOPs with the Iometer utility
       •   and 413 MB/sec of simulated backup throughput with the Iometer utility
       •   with predictably fast response times and scalability
                                                                14,000

                                                                12,000
                                      I/O's per second (IOPS)


                                                                10,000

                                                                 8,000
                                                                                                                            Exchange
                                                                 6,000                                                      SQL Server
                                                                                                                            Web Server
                                                                 4,000
                                                                                                                            Scan/read
                                                                 2,000

                                                                    0
                                                                         1   2               3                4

                                                                             Virtual Machines
   http://www.enterprisestrategygroup.com/2010/06/ibm-system-storage-ds5020ds3950-express-and-ibm-system-x3950-m2-mixed-workload-performance-in-microsoft-hyper-v-r2-environments/
© 2011 Enterprise Strategy Group                                                           11
2011 ESG Lab Test Bed (Physical)


                   HP BL680C
            up to 24 cores and 128 GB                                     LAN
                 RAM per blade
                                                                                         F5 BIG-IP


                                                 2x4 Gbps FC per server
                                           SAN


                                                                                RAID-10 Pools:
                                                             Data (88):
                    EMC CX4-960
                                                              Logs(16):
              155 15K RPM FC disk drives
                                                               OS(24):
                                                             Apps(16):


© 2011 Enterprise Strategy Group
2011 SharePoint Test Bed (Logical)

    Application: SharePoint 2010/ SQL 2008 R2
    VM configuration: 2 vCPU, 4 GB/ 4vCPU, 32 GB
    Microsoft Windows Server 2008 R2 SP1
                                                        Hyper-V R2


    Hypervisor: Microsoft Hyper-V R2
    Physical OS: Windows Server 2008 R2 SP1


                                                            SAN             Load generator:
                                                                     Microsoft Visual Studio 2010

     Virtual machine images:       Fixed VHD

      SQL data and logs:           Fixed VHD


© 2011 Enterprise Strategy Group                   13
2011 SharePoint Workload
                                   Visual Studio 2010 for SharePoint Load Generation
   • Hyper-V stress test with a non-blocking lightweight workload

           • 89% browse

           • 10% upload

           • 1% check in/check out

           • 22 GB SQL database

   • Scale from 1 to 3 web server VMs (5 VMs total)

   • Hardware load-balanced web traffic

   • Constant workload
© 2011 Enterprise Strategy Group                          14
2011 SharePoint Workload Results

                                              Guest CPU Utilization (3 VMs, 1 web server)
                                        ( SharePoint 2010, Windows 2008 R2 SP1, SQL Server 2008 R2)


                   SharePoint


                  Web Server


                                                                                                        CPU bottleneck

                             SQL


                                   0%           20%             40%               60%             80%             100%

                                                               vCPU Utilization
© 2011 Enterprise Strategy Group                                      15
2011 SharePoint Workload Results
                                                 CPU Utilization (5 VMs, 3 web servers)
                                        ( SharePoint 2010, Windows 2008 R2 SP1, SQL Server 2008 R2)


                   SharePoint


                  Web Server


                  Web Server


                  Web Server


                             SQL


                                   0%           20%             40%              60%             80%   100%
                                                              vCPU Utilization

© 2011 Enterprise Strategy Group                                      16
2011 SharePoint Workload Results
                                                                           Hyper-V R2 Application Workload Scalability
                                                                    ( SharePoint 2010, Windows 2008 R2 SP1, SQL Server 2008 R2)
                                                  600,000                                                                         3.0
            Users (light-weight, 1% concurrent)


                                                                                                                                        Average Page Response Time (sec)
                                                  500,000                                                                         2.5


                                                  400,000                                                                         2.0


                                                  300,000                                                                         1.5


                                                  200,000                                                                         1.0


                                                  100,000                                                                         0.5


                                                        0                                                                         0
                                                                       1                          2                          3
                                                  Web Server VMs:     1                           2                           3
                                                  Total VMs:          3                           4                           5


© 2011 Enterprise Strategy Group                                                                 17
2011 SharePoint Results Summary
                                   Hyper-V R2 SharePoint Workload Scalability

   • Up to 460,800 simulated SharePoint users*
   • As expected, the front end is the bottleneck during single web server VM
     testing
   • Adding web server VMs alleviates the bottleneck
   • Response times improve and more requests per second are delivered as
     VMs are added
   • 90% scaling efficiency from 1 to 2 web servers**


   *1% concurrent users derived from the requests per second measured during the three web server test
   ** Based on a comparison of requests per second divided by average page response time
© 2011 Enterprise Strategy Group                                            18
The Bigger Truth

       Why This Matters
       Performance scaled and response times dropped as Hyper-V R2 web server VMs were
       added to a consolidated SharePoint deployment on a single physical server.

       The manageably low performance impact of Hyper-V R2 won’t be detected by the vast
       majority of end-users and applications.

       The performance, scalability, and low overhead of Hyper-V R2 can be used to reduce
       costs and improve the manageability, flexibility, and availability of consolidated
       SharePoint applications.


© 2011 Enterprise Strategy Group                19
Issues to Consider
   • Mileage varies; test with your workloads and your data

   • Hyper-V
           • Included for free with Windows Server 2008
           • Proven to perform with demanding applications
   • Size matters
           • Application and web server roles are good candidates for virtualization
           • For larger deployments, consider deploying resource-bound SQL Server and Index
             roles on physical servers
   • High availability matters

   • Leverage ESG Lab Validations, Microsoft and its partners’ best practices/proof points

© 2011 Enterprise Strategy Group                 20
Microsoft/Intel iSCSI test


• Used Windows Server 2008
  R2, Intel Xeon 5500
  processors, and Intel 10Gbps
  Ethernet Adapters
• Reached over One Million IOPS
  over a single 10 Gbps Ethernet
  link using a software iSCSI initiator
  on Native HW
• Reached over 700,000IOPS over a
  single 10 Gbps Ethernet link using
  a software iSCSI initiator on
  Hyper-V to the Guest OS
Microsoft/Intel iSCSI test


Native Performance                                          In-Guest VM Performance


http://gestaltit.com/all/tech/storage/stephen/microsoft-and-intel-push-one-million-iscsi-iops/
Static Memory


         http://www.microsoft.com/whdc/system/sysperf/Perf_tun_srv-R2.mspx
Dynamic Memory
http://www.buildwindows.com
http://www.citrix.com/xendesktop
http://www.microsoft.com/hyperv
http://www.quest.com/vworkspace
http://www.ipexpo.co.uk/

https://msevents.microsoft.com/CUI/EventDetail.aspx?EventID=1032493495&C
ulture=en-GB


http://www.microsoftvirtualacademy.com

Vmug hyper v overview

  • 3.
    Number of physicalservers shipments used for virtualization will grow to 1.7M+ in 2012 at a CAGR of 15% IDC Server Virtualization Forecast Other 9.00 14,000,000 1% 8.00 Unix 12,000,000 7.00 6% 10,000,000 6.00 8,000,000 5.00 Linux 21% 4.00 6,000,000 Licensed 3.00 Windows Unpaid 61% 4,000,000 2.00 Windows 1.00 2,000,000 11% 0 Y2005 Y2006 Y2007 Y2008 Y2009 Y2010 Y2011 Y2012 Physical Units Logical Units VM Density 19% of physical server shipments will be used for virtualization, increasing from 11.7% in 2007
  • 7.
  • 9.
  • 10.
    2010 ESG LabHighlights: VM Scalability Hyper-V R2 on 16 servers with Microsoft Cluster Shared Volumes (CSV) stored on a single SAN attached disk array supported 1,024 virtual machines Virtual Machine Scalability 1 through 16 Microsoft Hyper-V R2 Servers 1,024 896 768 Vrirtual Machines 640 512 384 256 128 0 0 2 4 6 8 10 12 14 16 Clustered Hyper-V R2 Servers http://www.enterprisestrategygroup.com/2010/11/emc-symmetrix-vmax-and-microsoft-server-virtualization-scalable-enterprise-class-virtual-infrastructure/ © 2011 Enterprise Strategy Group 10
  • 11.
    2010 ESG LabHighlights: Mixed Workloads Hyper-V R2 on 2 servers with 16 VMs sharing a single disk array: • 18,750 mailboxes with the Microsoft Exchange 2010 Jetstress utility • and 3,475 small database IOs per second with the Microsoft SQLIO utility • and 650 MB/sec of database throughput with the SQLIO utility • and 3,106 simulated web server IOPs with the Iometer utility • and 413 MB/sec of simulated backup throughput with the Iometer utility • with predictably fast response times and scalability 14,000 12,000 I/O's per second (IOPS) 10,000 8,000 Exchange 6,000 SQL Server Web Server 4,000 Scan/read 2,000 0 1 2 3 4 Virtual Machines http://www.enterprisestrategygroup.com/2010/06/ibm-system-storage-ds5020ds3950-express-and-ibm-system-x3950-m2-mixed-workload-performance-in-microsoft-hyper-v-r2-environments/ © 2011 Enterprise Strategy Group 11
  • 12.
    2011 ESG LabTest Bed (Physical) HP BL680C up to 24 cores and 128 GB LAN RAM per blade F5 BIG-IP 2x4 Gbps FC per server SAN RAID-10 Pools: Data (88): EMC CX4-960 Logs(16): 155 15K RPM FC disk drives OS(24): Apps(16): © 2011 Enterprise Strategy Group
  • 13.
    2011 SharePoint TestBed (Logical) Application: SharePoint 2010/ SQL 2008 R2 VM configuration: 2 vCPU, 4 GB/ 4vCPU, 32 GB Microsoft Windows Server 2008 R2 SP1 Hyper-V R2 Hypervisor: Microsoft Hyper-V R2 Physical OS: Windows Server 2008 R2 SP1 SAN Load generator: Microsoft Visual Studio 2010 Virtual machine images: Fixed VHD SQL data and logs: Fixed VHD © 2011 Enterprise Strategy Group 13
  • 14.
    2011 SharePoint Workload Visual Studio 2010 for SharePoint Load Generation • Hyper-V stress test with a non-blocking lightweight workload • 89% browse • 10% upload • 1% check in/check out • 22 GB SQL database • Scale from 1 to 3 web server VMs (5 VMs total) • Hardware load-balanced web traffic • Constant workload © 2011 Enterprise Strategy Group 14
  • 15.
    2011 SharePoint WorkloadResults Guest CPU Utilization (3 VMs, 1 web server) ( SharePoint 2010, Windows 2008 R2 SP1, SQL Server 2008 R2) SharePoint Web Server CPU bottleneck SQL 0% 20% 40% 60% 80% 100% vCPU Utilization © 2011 Enterprise Strategy Group 15
  • 16.
    2011 SharePoint WorkloadResults CPU Utilization (5 VMs, 3 web servers) ( SharePoint 2010, Windows 2008 R2 SP1, SQL Server 2008 R2) SharePoint Web Server Web Server Web Server SQL 0% 20% 40% 60% 80% 100% vCPU Utilization © 2011 Enterprise Strategy Group 16
  • 17.
    2011 SharePoint WorkloadResults Hyper-V R2 Application Workload Scalability ( SharePoint 2010, Windows 2008 R2 SP1, SQL Server 2008 R2) 600,000 3.0 Users (light-weight, 1% concurrent) Average Page Response Time (sec) 500,000 2.5 400,000 2.0 300,000 1.5 200,000 1.0 100,000 0.5 0 0 1 2 3 Web Server VMs: 1 2 3 Total VMs: 3 4 5 © 2011 Enterprise Strategy Group 17
  • 18.
    2011 SharePoint ResultsSummary Hyper-V R2 SharePoint Workload Scalability • Up to 460,800 simulated SharePoint users* • As expected, the front end is the bottleneck during single web server VM testing • Adding web server VMs alleviates the bottleneck • Response times improve and more requests per second are delivered as VMs are added • 90% scaling efficiency from 1 to 2 web servers** *1% concurrent users derived from the requests per second measured during the three web server test ** Based on a comparison of requests per second divided by average page response time © 2011 Enterprise Strategy Group 18
  • 19.
    The Bigger Truth Why This Matters Performance scaled and response times dropped as Hyper-V R2 web server VMs were added to a consolidated SharePoint deployment on a single physical server. The manageably low performance impact of Hyper-V R2 won’t be detected by the vast majority of end-users and applications. The performance, scalability, and low overhead of Hyper-V R2 can be used to reduce costs and improve the manageability, flexibility, and availability of consolidated SharePoint applications. © 2011 Enterprise Strategy Group 19
  • 20.
    Issues to Consider • Mileage varies; test with your workloads and your data • Hyper-V • Included for free with Windows Server 2008 • Proven to perform with demanding applications • Size matters • Application and web server roles are good candidates for virtualization • For larger deployments, consider deploying resource-bound SQL Server and Index roles on physical servers • High availability matters • Leverage ESG Lab Validations, Microsoft and its partners’ best practices/proof points © 2011 Enterprise Strategy Group 20
  • 21.
    Microsoft/Intel iSCSI test •Used Windows Server 2008 R2, Intel Xeon 5500 processors, and Intel 10Gbps Ethernet Adapters • Reached over One Million IOPS over a single 10 Gbps Ethernet link using a software iSCSI initiator on Native HW • Reached over 700,000IOPS over a single 10 Gbps Ethernet link using a software iSCSI initiator on Hyper-V to the Guest OS
  • 22.
    Microsoft/Intel iSCSI test NativePerformance In-Guest VM Performance http://gestaltit.com/all/tech/storage/stephen/microsoft-and-intel-push-one-million-iscsi-iops/
  • 27.
    Static Memory http://www.microsoft.com/whdc/system/sysperf/Perf_tun_srv-R2.mspx
  • 28.
  • 32.
  • 33.
  • 34.

Editor's Notes

  • #5 BenefitsBetter consolidation ratios with predictable performanceEnables linear scalability for deployment environmentsDesigned for production useRecommendations for use for server applications still being evaluated.With the SP1 release, we will meet all the Gartner/Burton group requirements for an Enterprise ready Hypervisor
  • #23 iSCSI Performance can be as good or better than either Fibre Channel or FCoE. iSCSI can offer a compelling offering for those who don’t want to invest in FC.Windows Server and Hyper-V is not a limiting factor to IO performance. There shouldn’t be any significant concern around IO for virtualizing with Hyper-V.More details (along with a great Photoshop picture) at http://gestaltit.com/all/tech/storage/stephen/microsoft-and-intel-push-one-million-iscsi-iops/