The research paper examines the vitality of the Devayan language in Simeulue, Indonesia, highlighting its critical status among younger generations. Using questionnaires and interviews across seven sub-districts, the study found that only 12% of the G4 generation actively acquired the language, indicating a decline in proficiency and use. The research concludes that the Devayan language is marginalized by outside influences and faces significant preservation challenges.
![Quest Journals
Journal of Research in Humanities and Social Science
Volume 5 ~ Issue 3 (2017) pp: 72-81
ISSN(Online) : 2321-9467
www.questjournals.org
*Corresponding Author: Ratri Candrasari1
72 | Page
Post-Graduate Department Of Linguistics, University Of Sumatera Utara (Indonesia)
Research Paper
Vitality of Simeulue’s Devayan Language
Ratri Candrasari1
, T. Silvana Sinar2
, Dwi Widayati3
, and Nurlela4
1,2,3,4
Post-Graduate Department Of Linguistics, Faculty Of Cultural Sciences,
University Of Sumatera Utara (Indonesia)
Received 27 Feb, 2017; Accepted 31 Mar, 2017 © The author(s) 2017. Published with open access at
www.questjournals.org
ABSTRACT: It is important for native speakers of a language to be able to measure the vitality of their own
language and then to decide concrete steps to preserve it. Language vitality refers to the ability of a language
to accommodate and perform a variety of functions and purposes of communication. This study examines
vitality of Simeulue’s Devayan language (SDL) in the Indonesia’s Simeulue Island and covers seven out of ten
sub-districts. Questionnaires and interviews were used to collect data about aspects of first language
acquisition process, about uses of mother tongue in nine domains, and of language proficiency of G1, G2, G3,
and G4. The preliminary results of the research showed that only 12% of the G4 generation have acquired SDL
since they recognized that language. In terms of language use, using spider web diagram, the result of the
stretched index scale of the language use was categorized stable, but eroded. From language proficiency
lexical, translating, comprehension and speaking tests, the results varied corresponding to the age group. The
conclusion can be drawn that SDL is relatively unknown in Aceh Province and that SDL is marginalized by
languages brought by immigrants.
Keywords: Devayan Language, minority language, spider web diagram, vitality.
I. INTRODUCTION
The development of information and communication technology greatly brings impacts on the opening
of communication system and on the chance of contact with the outside world which brings new choices and
challenges in the culture, lifestyle, identity, and, of course, language (Sinar, 2013).[1]
In this context, it is
important for ethnic community to measure the vitality of their own language and then decide the concrete steps
to save it. This study is focused on SDL as the main research object on the grounds that most of the island
population uses SDL. Therefore, the research areas include seven out of ten sub-districts, for instance, West
Simeulue, West Teupah, Central Teupah, South Teupah, Central Simeulue, Simeulue Cut, and Teluk Dalam.
Fig. 1 shows three native languages in Simeulue Island (SI): Devayan, Sigulai, and Leukon. The first is
indicated in light blue and spoken in seven sub-districts; the second in light green is spoken in three other sub-
districts, and the last is used by native speakers in Alafan sub-district. A preliminary study on SDL has been
conducted, and other studies will be conducted for two other languages.
Figure 1. Language map in Simeulue Island
Language vitality refers to the ability of a language to accommodate and perform a variety of functions
and purposes of communication. The term was first introduced to ethno-linguistics by Giles et.al. (1977).[2]
The
vitality of an ethno-linguistic group will influence a speech group to behave as a distinctive entity. The more
vitality a speech group has, the more likely it will survive; conversely, if a language has little vitality or none, it
will likely cease to survive. In other words, language vitality becomes the benchmark of language maintenance
by measuring the use of language as a means of daily communication in various social contexts for different
purposes.](https://image.slidesharecdn.com/l537281-170715085428/85/Vitality-of-Simeulue-s-Devayan-Language-1-320.jpg)
![Quest Journals
Journal of Research in Humanities and Social Science
Volume 5 ~ Issue 3 (2017) pp: 72-81
ISSN(Online) : 2321-9467
www.questjournals.org
*Corresponding Author: Ratri Candrasari1
72 | Page
Post-Graduate Department Of Linguistics, University Of Sumatera Utara (Indonesia)
Research Paper
Vitality of Simeulue’s Devayan Language
Ratri Candrasari1
, T. Silvana Sinar2
, Dwi Widayati3
, and Nurlela4
1,2,3,4
Post-Graduate Department Of Linguistics, Faculty Of Cultural Sciences,
University Of Sumatera Utara (Indonesia)
Received 27 Feb, 2017; Accepted 31 Mar, 2017 © The author(s) 2017. Published with open access at
www.questjournals.org
ABSTRACT: It is important for native speakers of a language to be able to measure the vitality of their own
language and then to decide concrete steps to preserve it. Language vitality refers to the ability of a language
to accommodate and perform a variety of functions and purposes of communication. This study examines
vitality of Simeulue’s Devayan language (SDL) in the Indonesia’s Simeulue Island and covers seven out of ten
sub-districts. Questionnaires and interviews were used to collect data about aspects of first language
acquisition process, about uses of mother tongue in nine domains, and of language proficiency of G1, G2, G3,
and G4. The preliminary results of the research showed that only 12% of the G4 generation have acquired SDL
since they recognized that language. In terms of language use, using spider web diagram, the result of the
stretched index scale of the language use was categorized stable, but eroded. From language proficiency
lexical, translating, comprehension and speaking tests, the results varied corresponding to the age group. The
conclusion can be drawn that SDL is relatively unknown in Aceh Province and that SDL is marginalized by
languages brought by immigrants.
Keywords: Devayan Language, minority language, spider web diagram, vitality.
I. INTRODUCTION
The development of information and communication technology greatly brings impacts on the opening
of communication system and on the chance of contact with the outside world which brings new choices and
challenges in the culture, lifestyle, identity, and, of course, language (Sinar, 2013).[1]
In this context, it is
important for ethnic community to measure the vitality of their own language and then decide the concrete steps
to save it. This study is focused on SDL as the main research object on the grounds that most of the island
population uses SDL. Therefore, the research areas include seven out of ten sub-districts, for instance, West
Simeulue, West Teupah, Central Teupah, South Teupah, Central Simeulue, Simeulue Cut, and Teluk Dalam.
Fig. 1 shows three native languages in Simeulue Island (SI): Devayan, Sigulai, and Leukon. The first is
indicated in light blue and spoken in seven sub-districts; the second in light green is spoken in three other sub-
districts, and the last is used by native speakers in Alafan sub-district. A preliminary study on SDL has been
conducted, and other studies will be conducted for two other languages.
Figure 1. Language map in Simeulue Island
Language vitality refers to the ability of a language to accommodate and perform a variety of functions
and purposes of communication. The term was first introduced to ethno-linguistics by Giles et.al. (1977).[2]
The
vitality of an ethno-linguistic group will influence a speech group to behave as a distinctive entity. The more
vitality a speech group has, the more likely it will survive; conversely, if a language has little vitality or none, it
will likely cease to survive. In other words, language vitality becomes the benchmark of language maintenance
by measuring the use of language as a means of daily communication in various social contexts for different
purposes.](https://image.slidesharecdn.com/l537281-170715085428/75/Vitality-of-Simeulue-s-Devayan-Language-1-2048.jpg)
![Vitality Of Simeulue’s Devayan Language
*Corresponding Author: Ratri Candrasari1
73 | Page
The number of studies on language vitality (Greenoble and Whaley, 2003).[3]
of indigenous language is
still limited, while the information about it is absolutely necessary in language planning that will encounter
some difficulties in its design without any accurate information about language vitality.This research focuses on
some indicators of language vitality, for instance, mother tongue acquisition, language use, and language skills
through a set of questionnaires and tests conducted on 220 respondents spreading across seven sub-districts.
Besides, the number of respondents is adjusted with the ratio of the population of each sub-district. Investigation
on these three factors is conducted to answer the question: Up to which level is native speakers‟ vitality towards
SDL reached at this time?
II. REVIEW OF RELATED LITERATURE
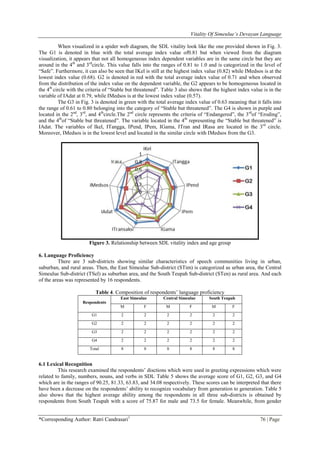
Discussion on how to measure the vitality of SDL is conducted by first knowing the criteria of SDL
vitality based on the relationship between the language use index and the characteristics of the respondents. The
language use is based on the domain concept introduced by Fishman (1972a/b)[4]
includes 7 domains, namely a
family domain, neighborhood domain, education domain, office domain, religious domain, transaction domain,
and custom domain. However, the vitality measurement in this research also includes the language use in social
media and feelings which are determined for the purpose of collecting data of language use which corresponds
to the development of language use today.
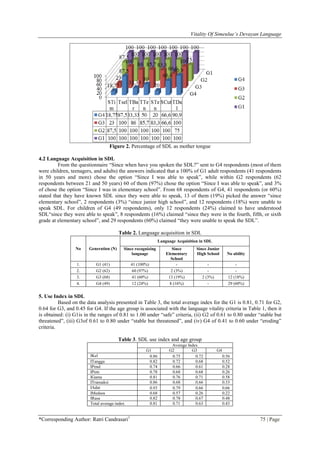
The analysis is carried out to measure the vitality of SDL by using a non-parametric statistical analysis,
namely Kruskal Wallis and Median, which is used to compare the average value of two or more groups of
independent samples with different testing levels among the groups. The value of test results is shown by an
index number abbreviated in capital letter “I”. The parametric statistics include the following variables (1) IKel
for family index, (2) ITangga for Household index, (3) IPend for Education index, (4) IPem for
Office/Government, (5) IGama for Religious index, (6) ITransaksi for Transaction index, and (7) IAdat for
Custom index. Moreover, to provide comparative measurements, two independent variables are added, such as,
(8) IMedsos for Social Media index, and (9) IRasa for Feeling index.
The resulting index number on the average of each index or total index is adjusted to the criteria of
Grimes‟ (2000) language vitality[5]
who categorized language vitality into six levels:
1. Critically Endangered: Having very few speakers of 70 years old and more (or great-grandparent).
2. Severely endangered: Having speakers of 40 years old and more (or grandparent age).
3. Endangered. Having speakers of 20 years old and more (or parent age).
4. Eroding. Speakers are some children and older people. Most children do not speak it.
5. Stable but threatened. All children and older people are speakers, but few in numbers.
6. Safe. Not endangered. Language is expected to be learned by all children and others in the ethnic group.
In this research, such levels are adapted into five levels by combining the first and the second criteria
because the first generation (G1) starts from the age of 51 years. The adapted levels are then (1) critically and
severely endangered, (2) endangered, (3) eroding, (4) stable but threatened, and (5) stable. With such criteria,
the index calculation is shown in the following:
I =
I = Index
= Average value
Xmin = Minimum Average
Xmax = Maximum Average
Such level is made in a stretched scale to form a level visualized in the Table 1 and interpreted through
the index number of Spider-Profit with a range of index numbers from 0-1. This index refers to the consensus of
participants of “Consignment of Endangered Languages” held in Ciawi on December 2 to 4, 2011, resulting in
an index of language vitality measurement. Table 1 shows the basis of measuring or leveling of SDL vitality.
Table 1. Language vitality criteria (Grimes 2000)
No. Language Vitality Criteria
Index Number in Spider Web
Diagram
1. Critically and Severely Endangered 0,00 - 0,20
2. Endangered 0,21-0,40
3. Eroding 0,41 - 0,60
4. Stable but threatened 0,61 - 0,80
5. Safe 0,81 - 1,00](https://image.slidesharecdn.com/l537281-170715085428/85/Vitality-of-Simeulue-s-Devayan-Language-2-320.jpg)
![Vitality Of Simeulue’s Devayan Language
*Corresponding Author: Ratri Candrasari1
74 | Page
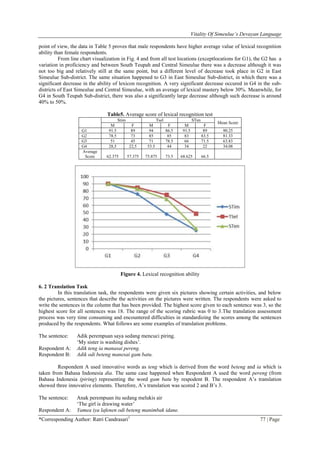
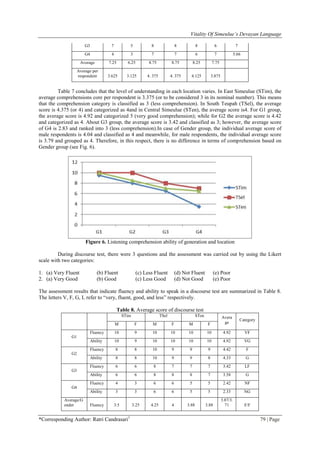
To measure the language proficiency, a series of tests of Linguistic Vitality Test proposed by Lewis
and Simons (2015) was used.[6]
This test has ever been tested in Maluku, Indonesia. There were three kinds of
test: (1) lexical recognition, (2) translation task, and (3) discourse test. A lexical recognition test consists of
greeting expressions in the family context, numbers, and vocabulary operating on nouns and verbs. In
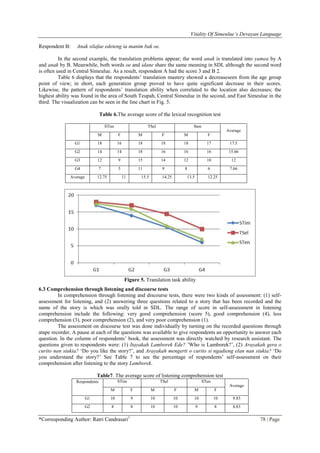
translation task, the respondents were given a sentence that had to be translated into SDL in writing, and for
those who did not have ability or had less ability in writing would be assisted by research assistant in writing the
answers on a space provided. The questionnaire was added with pictures to facilitate comprehension and
perception.
III. METHODOLOGY
3.1 Type of research
This is a sociolinguistics research with quantitative approach. This is in line with Mahsun‟s (2011)
opinion arguing that the field of linguistics associated with language use is one of the studies in sociolinguistics,
especially the one focusing on language use based on its social contexts.[7]
3.2 Location and time of research
The research was conducted in seven of ten sub-districts including (1) East Simeulue, (2) South
Teupah, (3) West Teupah, (4) Central Teupah, (5) Central Simeulue, (6) Simeulue Cut, and (7) Teluk Dalam.
Those sub-districts were chosen as the research locations because people in these districts use SDL while in
other 3 sub-districts people speak Sigulai and Leukon languages.
3.3 Data collection
The data were collected using questionnaires distributed to the respondents in seven districts of
Simeulue Region. Two types of questionnaires were distributed to the respondents. The first questionnaire was
named KPBS designed to obtain the data on the first language acquisition and the language use. The data were
analyzed to find out the pattern of language use, to calculate the index number of language use, and to measure
the language vitality. The second questionnaire was called KKB designed to test the language ability of the
Devayan Language Speakers. This questionnaire tested the receptive and productive ability; nevertheless,
considering that SDL served only as a spoken language, this test measured the ability in terms of performance
but not competence (Sumarsono, 2007).[8]
3.4 Population and sample
The respondents in this research are native speakers of SDL or whose parent is a Devayan Language
native speaker, aged over 5 years, and living in the Devayan speaking areas. As already mentioned above, the
people living in the seven sub-districts of Devayan speaking areas become the population of this research. Based
on the population statistics of Simeulue Region in 2014, the total population of the region is 87,598 people,
spread across all sub-districts, composed of 138 villages and 20,884 households. However, the Devayan
speaking areas include only seven sub-districts whose population is 59,904 people.
Mahsun (2011) argued a linguistic research does not need a large sample because linguistic behaviors
tend to be more homogeneous than other behaviors.[9]
Considering the opinion mentioned above this research is
not a pure survey; the researchers tend to use a stratified random sampling, i.e. the choice of a group of
respondents was based on the given characteristics or properties of population. The sample variables are devided
into four age groups: G1 (>50 years of age), G2 (21-50), G3 (13-20),and G4 (6-12). The number of samples
obtained was 220 subjects.
IV. FINDINGS AND DISCUSSION
4.1 The Percentage of SDL as Mother Tongue
The data indicates that all generations (100%) from G1 and G2 respondents speak SDL as their mother
tongue, except in East Simeulue and Teluk Dalam Sub-districts. All G3 (100%) from South Teupah and Teluk
Dalam Sub-districts speak SDL while respondents from other sub-districts claimed Jamu Language and Bahasa
Indonesia as their first language. Jamu language is, in particular, found to be spoken only in East Simeulue.
With regard to G4, none of respondents failed to prove that their mother tongue is Devayan Language.
In Teluk Dalam, 10 respondents out of 11 (90.9%) claimed SDL is their mother tongue and only 18.75% of G4
respondents claimed SDL as their mother tongue East Simeulue , 87.5% in South Teupah, 33.33% in West
Teupah, 50% in Central Teupah, 20% in Central Simeulue, and 66.6% in Simeulue Cut. In Simeulue Cut, the
G1 and G2 respondents (100%) speak SDL.](https://image.slidesharecdn.com/l537281-170715085428/85/Vitality-of-Simeulue-s-Devayan-Language-3-320.jpg)
![Vitality Of Simeulue’s Devayan Language
*Corresponding Author: Ratri Candrasari1
81 | Page
V. CONCLUSIONS
It can be concluded that the verbal repertoire in the seven districts shows that there are almost
homogeneous characteristics of language communities except the one in East Simeulue Sub-district. SDL serves
as the mother tongue or first language for the native speakers in Simeulue in which G1 speak SDL 100%, G2
94.64%, and G3 77.8%; however, G4 are only recorded at 55.24%. At every generation, there is a decrease in
the quantity of respondents who use as their first language. The language use associated with the age group of
G1, G2, G3, and G4 shows a pattern of „>Bdev and always BDev‟ which are dominated by G1 and G2 in all
domains. For G3, the largest percentage is in the pattern of „BI = BDev‟ but G3 still show quite good usage in
SDL despite being lower in percentage. For G4, in particular, the largest percentage is in the pattern of „always
BI‟ in all domains and it shows the 0% use of the pattern of „always BDev‟ in all domains, except in the
neighborhood domain. For the overall average index, the Devayan Language vitality is in the range of values
from 0.61 to 0.80 with the value of 6.25 for the average index of seven major domains and 0.631 for the nine
domains of language use. This shows that the vitality level of SDL is located in the 3rd
circle which belongs to a
„Stable but threatened‟ category.
REFERENCES
[1] S. Sinar. 2014. Bahasa Ibu di Sumatera Utara: Cermin Kearifan Masyarakat Lokal. Denpasar: Seminar Bahasa Ibu VII 27-28
Februari 2014.
[2] H. Giles, R.Y. Bourhis, D.M. Taylor. 1977. Towards a Theory in Ethnic Group Relations. In Language Ethnicity and Intergroup
Relations.
[3] L.A. Greenoble and L.J. Whaley. 2006. Saving Languages: An Introduction to Language Revitalization. Cambridge: Cambridge
University Press.
[4] J.A. Fishman. 1972a. The Sociology of Language. Massachusetts: Newbury House Plublication
[5] J.A. Fishman. 1972b. The Relationship between Micro-and Macro_Linguistics in The Study of Who Speaks What Language to
Who and When. In Pride and Holmes.15-32.
[6] P.M. Lewis andG.F. Simons. 2015. Sustaining Language Use. Perspective on Community-Based.
[7] Mahsun, 2011.Metode Penelitian Bahasa. Tahapan Strategi, Metode, danTekniknya. Edisi Revisi. Rajawali Press. Jakarta.
[8] Sumarsono. 2007. Sosiolinguistik. Yogyakarta: Pustaka Pelajar.
[9] See Mahsun 2011.](https://image.slidesharecdn.com/l537281-170715085428/85/Vitality-of-Simeulue-s-Devayan-Language-10-320.jpg)


