Download to read offline

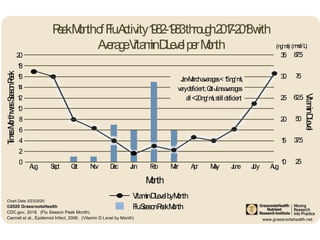
This chart shows the relationship between vitamin D levels and peak flu season months. It displays data from the CDC on the average peak month of flu activity each year from 1982-1983 to 2017-2018, with most years peaking between December and March. It also shows average vitamin D levels by month, with the lowest levels (less than 15 ng/ml) occurring between January and March, and levels below 20 ng/ml spanning October through June. The chart suggests that vitamin D deficiency, as indicated by levels below 20 ng/ml, may be associated with increased flu activity and the typical winter peak of the flu season.


