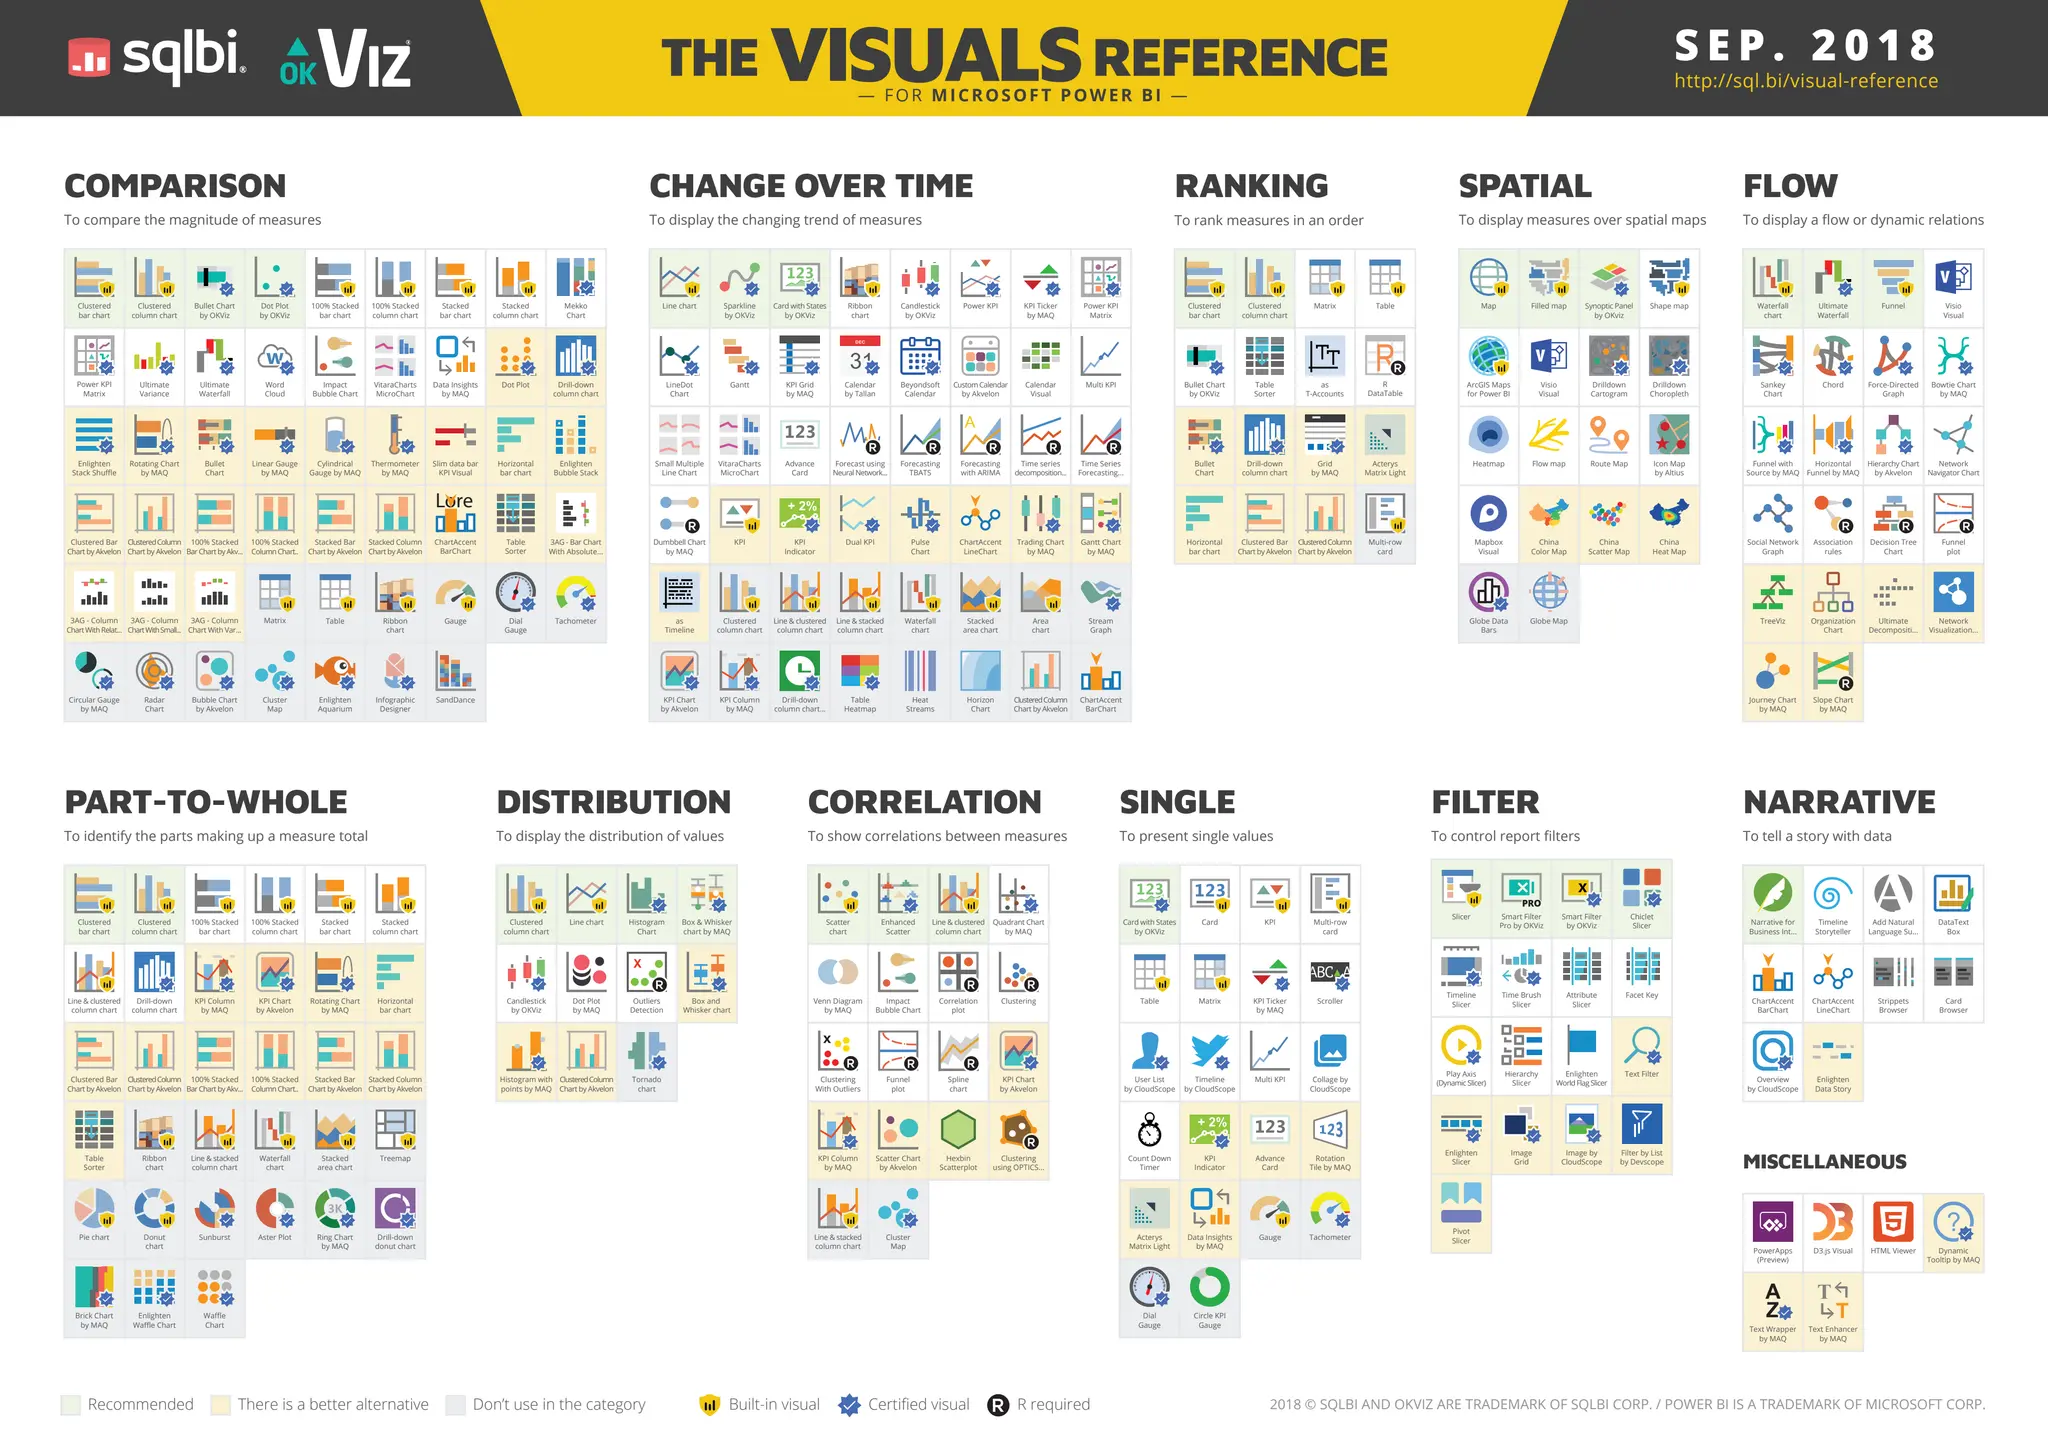
THE VISUALSREFERENCE
— FOR MICROSOFT POWER BI —
2018 © SQLBI AND OKVIZ ARE TRADEMARK OF SQLBI CORP. / POWER BI IS A TRADEMARK OF MICROSOFT CORP.
S E P . 2 0 1 8
http://sql.bi/visual-reference
Recommended There is a better alternative Don’t use in the category Built-in visual Certified visual R required
3AG - Bar Chart
With Absolute...
3AG - Column
Chart With Relat...
Thermometer
by MAQ
Cluster
Map
Enlighten
Aquarium
Infographic
Designer
SandDance
Bubble Chart
by Akvelon
Circular Gauge
by MAQ
Radar
Chart
Tachometer
FILTER
To control report filters
Facet Key
Hierarchy
Slicer
Filter by List
by Devscope
Image by
CloudScope
Image
Grid
Chiclet
Slicer
Attribute
Slicer
Enlighten
Slicer
Enlighten
World Flag Slicer
Play Axis
(Dynamic Slicer)
Pivot
Slicer
Slicer Smart Filter
by OKViz
Text Filter
Smart Filter
Pro by OKViz
Time Brush
Slicer
Timeline
Slicer
Enlighten
Bubble Stack
Horizontal
bar chart
Slim data bar
KPI Visual
ChartAccent
BarChart
Lore
m
NARRATIVE
To tell a story with data
MISCELLANEOUS
PowerApps
(Preview)
Text Wrapper
by MAQ
Text Enhancer
by MAQ
D3.js Visual HTML Viewer Dynamic
Tooltip by MAQ
Enlighten
Data Story
DataText
Box
Overview
by CloudScope
Card
Browser
Add Natural
Language Su...
Timeline
Storyteller
Strippets
Browser
Narrative for
Business Int...
ChartAccent
LineChart
ChartAccent
BarChart
Bullet
Chart
Cylindrical
Gauge by MAQ
Dot Plot
Enlighten
Stack Shuffle
Linear Gauge
by MAQ
Rotating Chart
by MAQ
Drill-down
column chart
CORRELATION
To show correlations between measures
Enhanced
Scatter
Correlation
plot
Hexbin
Scatterplot
Clustering
Clustering
With Outliers
Clustering
using OPTICS...
Quadrant Chart
by MAQ
Scatter
chart
Scatter Chart
by Akvelon
Venn Diagram
by MAQ
Spline
chart
Cluster
Map
Funnel
plot
Impact
Bubble Chart
KPI Chart
by Akvelon
KPI Column
by MAQ
Line & clustered
column chart
Line & stacked
column chart
DISTRIBUTION
To display the distribution of values
Dot Plot
by MAQ
Histogram
Chart
Histogram with
points by MAQ
Box & Whisker
chart by MAQ
Box and
Whisker chart
Tornado
chart
Outliers
Detection
Candlestick
by OKViz
Clustered
column chart
Line chart
3AG - Column
ChartWithSmall...
3AG - Column
Chart With Var...
Dial
Gauge
Gauge
Ribbon
chart
Matrix Table
Data Insights
by MAQ
Impact
Bubble Chart
Word
Cloud
VitaraCharts
MicroChart
Ultimate
Variance
Ultimate
Waterfall
Power KPI
Matrix
Table
Sorter
SINGLE
To present single values
Circle KPI
Gauge
Card
Matrix
Table
Multi-row
card
Rotation
Tile by MAQ
Scroller
User List
by CloudScope
Timeline
by CloudScope
Count Down
Timer
Collage by
CloudScope
Acterys
Matrix Light
Advance
Card
Card with States
by OKViz
Data Insights
by MAQ
Dial
Gauge
Gauge
KPI
KPI
Indicator
KPI Ticker
by MAQ
Multi KPI
Tachometer
SPATIAL
To display measures over spatial maps
Drilldown
Choropleth
Drilldown
Cartogram
Filled map Shape map
China
Color Map
ArcGIS Maps
for Power BI
China
Scatter Map
China
Heat Map
Globe Data
Bars
Globe Map
Heatmap
Map
Icon Map
by Altius
Mapbox
Visual
Route Map
Synoptic Panel
by OKviz
Flow map
Visio
Visual
FLOW
To display a flow or dynamic relations
Force-Directed
Graph
Funnel
plot
Funnel with
Source by MAQ
Bowtie Chart
by MAQ
Association
rules
Chord
Decision Tree
Chart
Hierarchy Chart
by Akvelon
Horizontal
Funnel by MAQ
Journey Chart
by MAQ
Network
Navigator Chart
Organization
Chart
Network
Visualization...
Sankey
Chart
Slope Chart
by MAQ
TreeViz
Social Network
Graph
Ultimate
Decompositi...
Funnel Visio
Visual
Waterfall
chart
Ultimate
Waterfall
PART-TO-WHOLE
To identify the parts making up a measure total
Brick Chart
by MAQ
Drill-down
column chart
Donut
chart
Drill-down
donut chart
Enlighten
Waffle Chart
Aster Plot
Line & clustered
column chart
Pie chart Ring Chart
by MAQ
Sunburst
Treemap
Waffle
Chart
100% Stacked
bar chart
100% Stacked
column chart
Clustered
bar chart
Clustered
column chart
Horizontal
bar chart
KPI Chart
by Akvelon
KPI Column
by MAQ
Line & stacked
column chart
Ribbon
chart
Rotating Chart
by MAQ
Stacked
area chart
Stacked
bar chart
Stacked
column chart
Table
Sorter
Waterfall
chart
100% Stacked
Bar Chart by Akv...
100% Stacked
Column Chart..
Clustered Bar
Chart by Akvelon
ClusteredColumn
Chart by Akvelon
Stacked Bar
Chart by Akvelon
Stacked Column
Chart by Akvelon
ClusteredColumn
Chart by Akvelon
RANKING
To rank measures in an order
Grid
by MAQ
as
T-Accounts
Acterys
Matrix Light
Table
Sorter
R
DataTable
Bullet
Chart
Bullet Chart
by OKViz
Clustered
bar chart
Clustered
column chart
Drill-down
column chart
Horizontal
bar chart
Matrix Table
Multi-row
card
Clustered Bar
Chart by Akvelon
ClusteredColumn
Chart by Akvelon
CHANGE OVER TIME
To display the changing trend of measures
Candlestick
by OKViz
Calendar
Visual
ChartAccent
LineChart
Custom Calendar
by Akvelon
Drill-down
column chart...
Dual KPI
Dumbbell Chart
by MAQ
Line chart Card with States
by OKViz
Advance
Card
as
Timeline
Beyondsoft
Calendar
Calendar
by Tallan
Forecasting
TBATS
Forecast using
Neural Network...
Forecasting
with ARIMA
Gantt
Gantt Chart
by MAQ
Heat
Streams
Horizon
Chart
KPI
KPI Column
by MAQ
KPI Chart
by Akvelon
KPI Grid
by MAQ
KPI
Indicator
KPI Ticker
by MAQ
LineDot
Chart
Power KPI
Multi KPI
Power KPI
Matrix
Pulse
Chart
Small Multiple
Line Chart
Sparkline
by OKViz
Table
Heatmap
Stream
Graph
Time series
decomposition...
Time Series
Forecasting...
Trading Chart
by MAQ
ChartAccent
BarChart
Area
chart
Line & stacked
column chart
Stacked
area chart
Waterfall
chart
Clustered
column chart
Line & clustered
column chart
Ribbon
chart
VitaraCharts
MicroChart
ClusteredColumn
Chart by Akvelon
COMPARISON
To compare the magnitude of measures
Clustered
column chart
Clustered
bar chart
100% Stacked
bar chart
100% Stacked
column chart
Bullet Chart
by OKViz
Dot Plot
by OKViz
Mekko
Chart
Stacked
bar chart
Stacked
column chart
100% Stacked
Bar Chart by Akv...
100% Stacked
Column Chart..
Clustered Bar
Chart by Akvelon
ClusteredColumn
Chart by Akvelon
Stacked Bar
Chart by Akvelon
Stacked Column
Chart by Akvelon

visuals-reference-sep2018-A3_pdfdoooo.pdf

  • 1.
    THE VISUALSREFERENCE — FORMICROSOFT POWER BI — 2018 © SQLBI AND OKVIZ ARE TRADEMARK OF SQLBI CORP. / POWER BI IS A TRADEMARK OF MICROSOFT CORP. S E P . 2 0 1 8 http://sql.bi/visual-reference Recommended There is a better alternative Don’t use in the category Built-in visual Certified visual R required 3AG - Bar Chart With Absolute... 3AG - Column Chart With Relat... Thermometer by MAQ Cluster Map Enlighten Aquarium Infographic Designer SandDance Bubble Chart by Akvelon Circular Gauge by MAQ Radar Chart Tachometer FILTER To control report filters Facet Key Hierarchy Slicer Filter by List by Devscope Image by CloudScope Image Grid Chiclet Slicer Attribute Slicer Enlighten Slicer Enlighten World Flag Slicer Play Axis (Dynamic Slicer) Pivot Slicer Slicer Smart Filter by OKViz Text Filter Smart Filter Pro by OKViz Time Brush Slicer Timeline Slicer Enlighten Bubble Stack Horizontal bar chart Slim data bar KPI Visual ChartAccent BarChart Lore m NARRATIVE To tell a story with data MISCELLANEOUS PowerApps (Preview) Text Wrapper by MAQ Text Enhancer by MAQ D3.js Visual HTML Viewer Dynamic Tooltip by MAQ Enlighten Data Story DataText Box Overview by CloudScope Card Browser Add Natural Language Su... Timeline Storyteller Strippets Browser Narrative for Business Int... ChartAccent LineChart ChartAccent BarChart Bullet Chart Cylindrical Gauge by MAQ Dot Plot Enlighten Stack Shuffle Linear Gauge by MAQ Rotating Chart by MAQ Drill-down column chart CORRELATION To show correlations between measures Enhanced Scatter Correlation plot Hexbin Scatterplot Clustering Clustering With Outliers Clustering using OPTICS... Quadrant Chart by MAQ Scatter chart Scatter Chart by Akvelon Venn Diagram by MAQ Spline chart Cluster Map Funnel plot Impact Bubble Chart KPI Chart by Akvelon KPI Column by MAQ Line & clustered column chart Line & stacked column chart DISTRIBUTION To display the distribution of values Dot Plot by MAQ Histogram Chart Histogram with points by MAQ Box & Whisker chart by MAQ Box and Whisker chart Tornado chart Outliers Detection Candlestick by OKViz Clustered column chart Line chart 3AG - Column ChartWithSmall... 3AG - Column Chart With Var... Dial Gauge Gauge Ribbon chart Matrix Table Data Insights by MAQ Impact Bubble Chart Word Cloud VitaraCharts MicroChart Ultimate Variance Ultimate Waterfall Power KPI Matrix Table Sorter SINGLE To present single values Circle KPI Gauge Card Matrix Table Multi-row card Rotation Tile by MAQ Scroller User List by CloudScope Timeline by CloudScope Count Down Timer Collage by CloudScope Acterys Matrix Light Advance Card Card with States by OKViz Data Insights by MAQ Dial Gauge Gauge KPI KPI Indicator KPI Ticker by MAQ Multi KPI Tachometer SPATIAL To display measures over spatial maps Drilldown Choropleth Drilldown Cartogram Filled map Shape map China Color Map ArcGIS Maps for Power BI China Scatter Map China Heat Map Globe Data Bars Globe Map Heatmap Map Icon Map by Altius Mapbox Visual Route Map Synoptic Panel by OKviz Flow map Visio Visual FLOW To display a flow or dynamic relations Force-Directed Graph Funnel plot Funnel with Source by MAQ Bowtie Chart by MAQ Association rules Chord Decision Tree Chart Hierarchy Chart by Akvelon Horizontal Funnel by MAQ Journey Chart by MAQ Network Navigator Chart Organization Chart Network Visualization... Sankey Chart Slope Chart by MAQ TreeViz Social Network Graph Ultimate Decompositi... Funnel Visio Visual Waterfall chart Ultimate Waterfall PART-TO-WHOLE To identify the parts making up a measure total Brick Chart by MAQ Drill-down column chart Donut chart Drill-down donut chart Enlighten Waffle Chart Aster Plot Line & clustered column chart Pie chart Ring Chart by MAQ Sunburst Treemap Waffle Chart 100% Stacked bar chart 100% Stacked column chart Clustered bar chart Clustered column chart Horizontal bar chart KPI Chart by Akvelon KPI Column by MAQ Line & stacked column chart Ribbon chart Rotating Chart by MAQ Stacked area chart Stacked bar chart Stacked column chart Table Sorter Waterfall chart 100% Stacked Bar Chart by Akv... 100% Stacked Column Chart.. Clustered Bar Chart by Akvelon ClusteredColumn Chart by Akvelon Stacked Bar Chart by Akvelon Stacked Column Chart by Akvelon ClusteredColumn Chart by Akvelon RANKING To rank measures in an order Grid by MAQ as T-Accounts Acterys Matrix Light Table Sorter R DataTable Bullet Chart Bullet Chart by OKViz Clustered bar chart Clustered column chart Drill-down column chart Horizontal bar chart Matrix Table Multi-row card Clustered Bar Chart by Akvelon ClusteredColumn Chart by Akvelon CHANGE OVER TIME To display the changing trend of measures Candlestick by OKViz Calendar Visual ChartAccent LineChart Custom Calendar by Akvelon Drill-down column chart... Dual KPI Dumbbell Chart by MAQ Line chart Card with States by OKViz Advance Card as Timeline Beyondsoft Calendar Calendar by Tallan Forecasting TBATS Forecast using Neural Network... Forecasting with ARIMA Gantt Gantt Chart by MAQ Heat Streams Horizon Chart KPI KPI Column by MAQ KPI Chart by Akvelon KPI Grid by MAQ KPI Indicator KPI Ticker by MAQ LineDot Chart Power KPI Multi KPI Power KPI Matrix Pulse Chart Small Multiple Line Chart Sparkline by OKViz Table Heatmap Stream Graph Time series decomposition... Time Series Forecasting... Trading Chart by MAQ ChartAccent BarChart Area chart Line & stacked column chart Stacked area chart Waterfall chart Clustered column chart Line & clustered column chart Ribbon chart VitaraCharts MicroChart ClusteredColumn Chart by Akvelon COMPARISON To compare the magnitude of measures Clustered column chart Clustered bar chart 100% Stacked bar chart 100% Stacked column chart Bullet Chart by OKViz Dot Plot by OKViz Mekko Chart Stacked bar chart Stacked column chart 100% Stacked Bar Chart by Akv... 100% Stacked Column Chart.. Clustered Bar Chart by Akvelon ClusteredColumn Chart by Akvelon Stacked Bar Chart by Akvelon Stacked Column Chart by Akvelon