Download to read offline


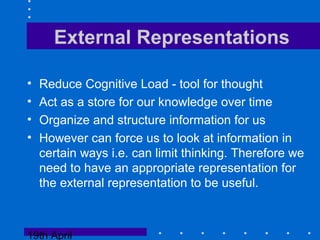


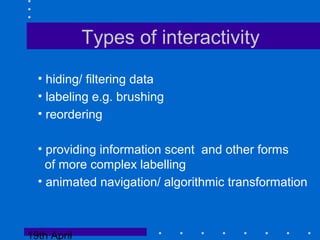


This document summarizes a lecture on advanced human-computer interaction. It discusses external representations and interactivity, types of representations including those of data values and data structure, and types of interactivity such as filtering, labeling, and animated navigation. Effective representations reduce cognitive load, organize information, and structure data to ask questions. However, finding the right representation is still challenging. Interactivity allows users to explore data in an iterative dialogue. The spreadsheet is presented as a killer application due to its interactivity.