The document describes several free and easy-to-use tools for visualizing data: Excel conditional formatting for finding patterns in spreadsheet data; OpenHeatMap for mapping spreadsheet data that includes locations; Piktochart for creating infographics from data; Google Motion Charts and VOSviewer for animating and visualizing networks in data. Each tool is summarized, describing what is required to use the tool and examples of how it can help visualize and explore tabular, spatial, and network data.
BrandZ Top 100 Most Valuable Global Brands 2016 - By Millward Brown & WPPBea Fdez V
Every year, it´s a must! Not only a list, a very complete review, trends, insights, solutions, action points and much more...
- The Future of Brands
- B2B
- Regions & Countries
- Categories
Download here.
How to Master Difficult Conversations at Work – Leader’s GuidePiktochart
Confrontation and having difficult conversations with employees is one of the hardest jobs of a leader. Learn how to approach them using the GROW acronym:
G is for Goals
Start every difficult conversation by stating its purpose
R is for Reality
State the reality of how the person is performing or how he or she is behaving.
O is for Options
Lay out a few options to help this person improve.
W is for Willingness
Ask this person what they would do and give them time to respond
Here's the full article about it: https://piktochart.com/blog/master-difficult-conversations
Let us know how you approach difficult conversations!
Bibliotecas ante el siglo XXI: nuevos medios y caminosJulián Marquina
Informe APEI sobre Bibliotecas ante el siglo XXI: nuevos medios y caminos (por Julián Marquina, 2013). Se puede decir que las bibliotecas son unas auténticas supervivientes con el paso del tiempo. Su capacidad de adaptación, transformación y evolución ante los cambios sociales, tecnológicos y económicos dan fe de ello. Las bibliotecas deben mirar al futuro viviendo el presente y teniendo muy claro cuál es su pasado.
Conferencia guía para el debate del pensamiento crítico con docentes de bachillerato. Esta presentación ha servido para el debate en diferentes Instituciones Educativas. Concreción de objetivos de asignatura y proyectos empleando estandares universales y formas de elevar el nivel cognitivo de las asignaturas
Majorly focused on Object Oriented way of plotting in Matplotlib, this review intends to serve as go to reference guide for quick plotting
#Matplotlib #Python #Pandas #Seaborn
This set of slides has been presented to the Illinois Program for Research in the Humanities at the University of Illinois at Urbana-Champaign on 02-27-2009
All too often front-end JavaScript code has been considered a second class citizen, and when treated without due care and attention it can be buggy and hard to maintain. This attitude is changing though, and thanks to the rapid growth in popularity of JavaScript as a first-class language, there is a large and expanding ecosystem of tools that a developer should know to make their client-side code as “clean” as the rest of their stack.
This talk aims to introduce and discuss how to implement modularisation, functional idioms and testing in JavaScript in an idiomatic way, to allow you to code JavaScript to a higher quality and, ultimately, more sustainably.
In a time where more and more tasks happen directly in the web and media suggests the "paperless office" to be within reach, digital documents take on an important role.
The PDF format is one very interesting standard to work with since PDF documents offer an interesting range of features:
* High compatibility with a huge range of devices and operating systems
* Preservation of the documents optical appearance
* Important documents can be digitally signed
* Can be printed and signed manually (e. g. for contracts)
* Offline storage of downloaded documents is easy
Many libraries exist that allow the creation of PDF documents. Unfortunately most are somehow limited in functionality, require good programming skills or come with high licensing cost.
On the other hand an immensly powerful solution to PDF creation under a free license exists with LaTeX.
This inspired us at dkd to write an Open Source service to make the power of LaTeX available to web applications via a REST interface. "Indoctrinatr" is a powerful toolkit that enables developers to easily create LaTeX templates that can be accessed via web- or REST-interface and thus create data driven PDF documents with ease.
This talk will give a very short introduction to LaTeX and why it is a great choice for PDF creation. By means of different real world examples the advantages of a document generation service will be demonstrated. Within the range of examples will be:
* Generation of customised contracts via the web-interface
* Generation of data driven graphics within a PDF
* Generation of custom address labels with generated barcodes via a TYPO3 extension using the REST-interface
Using R to Visualize Spatial Data: R as GIS - Guy LansleyGuy Lansley
This talk demonstrates some of the benefits of using R to visualize spatial data efficiently and clearly.
It was originally presented by Guy Lansley (UCL and the Consumer Data Research Centre) to the GIS for Social Data and Crisis Mapping Workshop at the University of Kent.
Drupal is an open source content management system, used to make many of the websites and applications you use every day. Drupal has great standard features, like easy content authoring, reliable performance, and excellent security.
Our expert instructor walks you through the essentials of creating your first Drupal website. By the end, you’ll have an understanding of Drupal’s fundamental building blocks and a working sandbox on Pantheon that you can continue to use for as long as you like. From there, you can continue to explore at your own pace with our recommended self-serve training resources.
Reveal's Advanced Analytics: Using R & PythonPoojitha B
Learn how you can use Reveal’s R & Python scripting capability to bring advanced data preparation, deeper analytics, and richer visualizations to your users!
Rapid Product Prototyping In Ordnance SurveySafe Software
Rapid prototyping of new and improved products is key to Ordnance Survey being able to understand and respond to customer feedback, and create evermore innovative products.
The presentation will go through a variety of products that have been created by the product development team over the last year, including Gazetteers and 3D models and explain how FME has helped to deliver them.
As a taster:
One product allowed customers, i.e. the emergency services, to quickly find access points to prominent places like schools, airports, etc... FME enabled us to bring many data sources togther, perform complex spatial tasks and write out to numerous data formats.
Another produced 3D models for a customer to allow them to see what there data looked like in 3D space before work on a national data model was undertaken.
All of these would not have been possible without the flexibility of FME and the endless possibilities that it provides.
Dave Page
This talk will give an insight into the infrastructure behind the PostgreSQL project - what servers do we have and what do they all do? How do we monitor and manage them? How does the website cope with the Slashdot effect on release days? We will also look at how things are likely to change as the Sysadmin and Web teams work to modernize and improve our infrastructure for the future.
Bibliographic software allows you to create databases of references which can then be stored, searched and used in conjunction with Word to input citations as you write an article or to create independent bibliographies.
This tutorial will introduce the bibliographic software choices available and help you decide which features are most important.
3. Some easy-to-use visualisation tools
• Find data patterns with Excel conditional formatting
• Map your data with OpenHeatMap
• Create infographics with Piktochart
• Animate our data with Google Motion Charts
• Visualise networks with VOSviewer
4. Some easy-to-use visualisation tools
• Find data patterns with Excel conditional formatting
• Map your data with OpenHeatMap
• Create infographics with Piktochart
• Animate our data with Google Motion Charts
• Visualise networks with VOSviewer
5. Some easy-to-use visualisation tools
• Find data patterns with Excel conditional formatting
• Map your data with OpenHeatMap
• Create infographics with Piktochart
• Animate our data with Google Motion Charts
• Visualise networks with VOSviewer
6. Some easy-to-use visualisation tools
• Find data patterns with Excel conditional formatting
• Map your data with OpenHeatMap
• Create infographics with Piktochart
• Visualise networks with VOSviewer
8. Excel conditional formatting
• What you need
• A copy of Excel 2000 (Windows or Mac OS X)
• Some spreadsheet data (numbers, text, or both)
• Time to explore
e
es ity th
• A colour printer, ideally
i c rs y
Le ve d b
r
te
o ni e
U d vi
ro
P
f
9. Excel conditional formatting
• What you can do with it
• Identify duplicates or unique values
• Highlight cells according to rules you define (e.g. top 10%, above average)
• Add data bars to cells
• Add icon sets (e.g. traffic lights to show values above and below user-defined
thresholds)
• ... essentially a tool to explore tabular data and to help you and your
readers to pick out what really matters
12. OpenHeatMap
• What you need
• A good internet connection and a browser
• OpenHeatMap is a free cloud application so
you don’t need to download or install any
other software: just upload your data onto
their remote server
• No need to register or sign in
ti d
u
n
• Spreadsheet data where the first column
ca o
o
contains a spatial reference (e.g. country
li l
p c
names, UK councils, US zip codes) and the
p e
other columns contain numerical information
a re
that you want to project onto a map
F
13. OpenHeatMap
• What you can do with it
• Project any data that comprises a location and a number onto a zoomable
map
• ... offers a more meaningful way to present spatial data
14. OpenHeatMap location plus data
• Data format
country wine production*
Italy 46,245
France 42,582
Spain 41,583
Germany 9,991
Romania 6,786
Portugal 5,620
*1,000 hectolitres in 2011/12
19. Piktochart
• What you need
ll d
fu u
• A good internet connection and a browser
o
(U s s; cl
• A debit or credit card!
o ir ic e
9)
ti u v th
• Time and creativity
.9
n e e
p q er n
S$ a
29
ri re s o
sc e d ss
it ce
su rv m c
b ic e
se li a e
re
F
to
20. Piktochart
• What you can do with it
• Create an infographic and tell a story using numbers
• Summarise and present a lot of complex information on a single sheet
• Design principles are already embedded in templates: you do not need to be
a graphic artist!
• ... a great way to clear your head and really get to the nub of what you
are trying to say (and impress)
25. VOSviewer
• What you need
• Free software download at www.vosviewer.com
• Java 6 or higher must be installed
x)
u
o ad
n
• Spreadsheet data, saved as .csv or .txt
Li
a lo
r
• You can also import Web of Science records
M wn
(remember to check the full cited records option
c
s, o
and select .txt)
w d
o e
d re
in F
(W
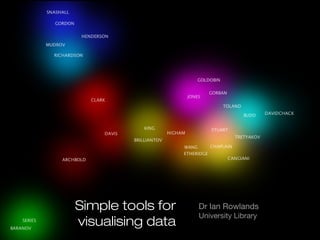
26. VOSviewer
• What you can do with it
• Make the relationships between members of a network visible
• Import search results from the Web of Science and automatically generate
maps of the literature
• Explore relationships between papers, journals, authors and institutions
• ... understand the structure of complex networks, revealing hidden
relationships