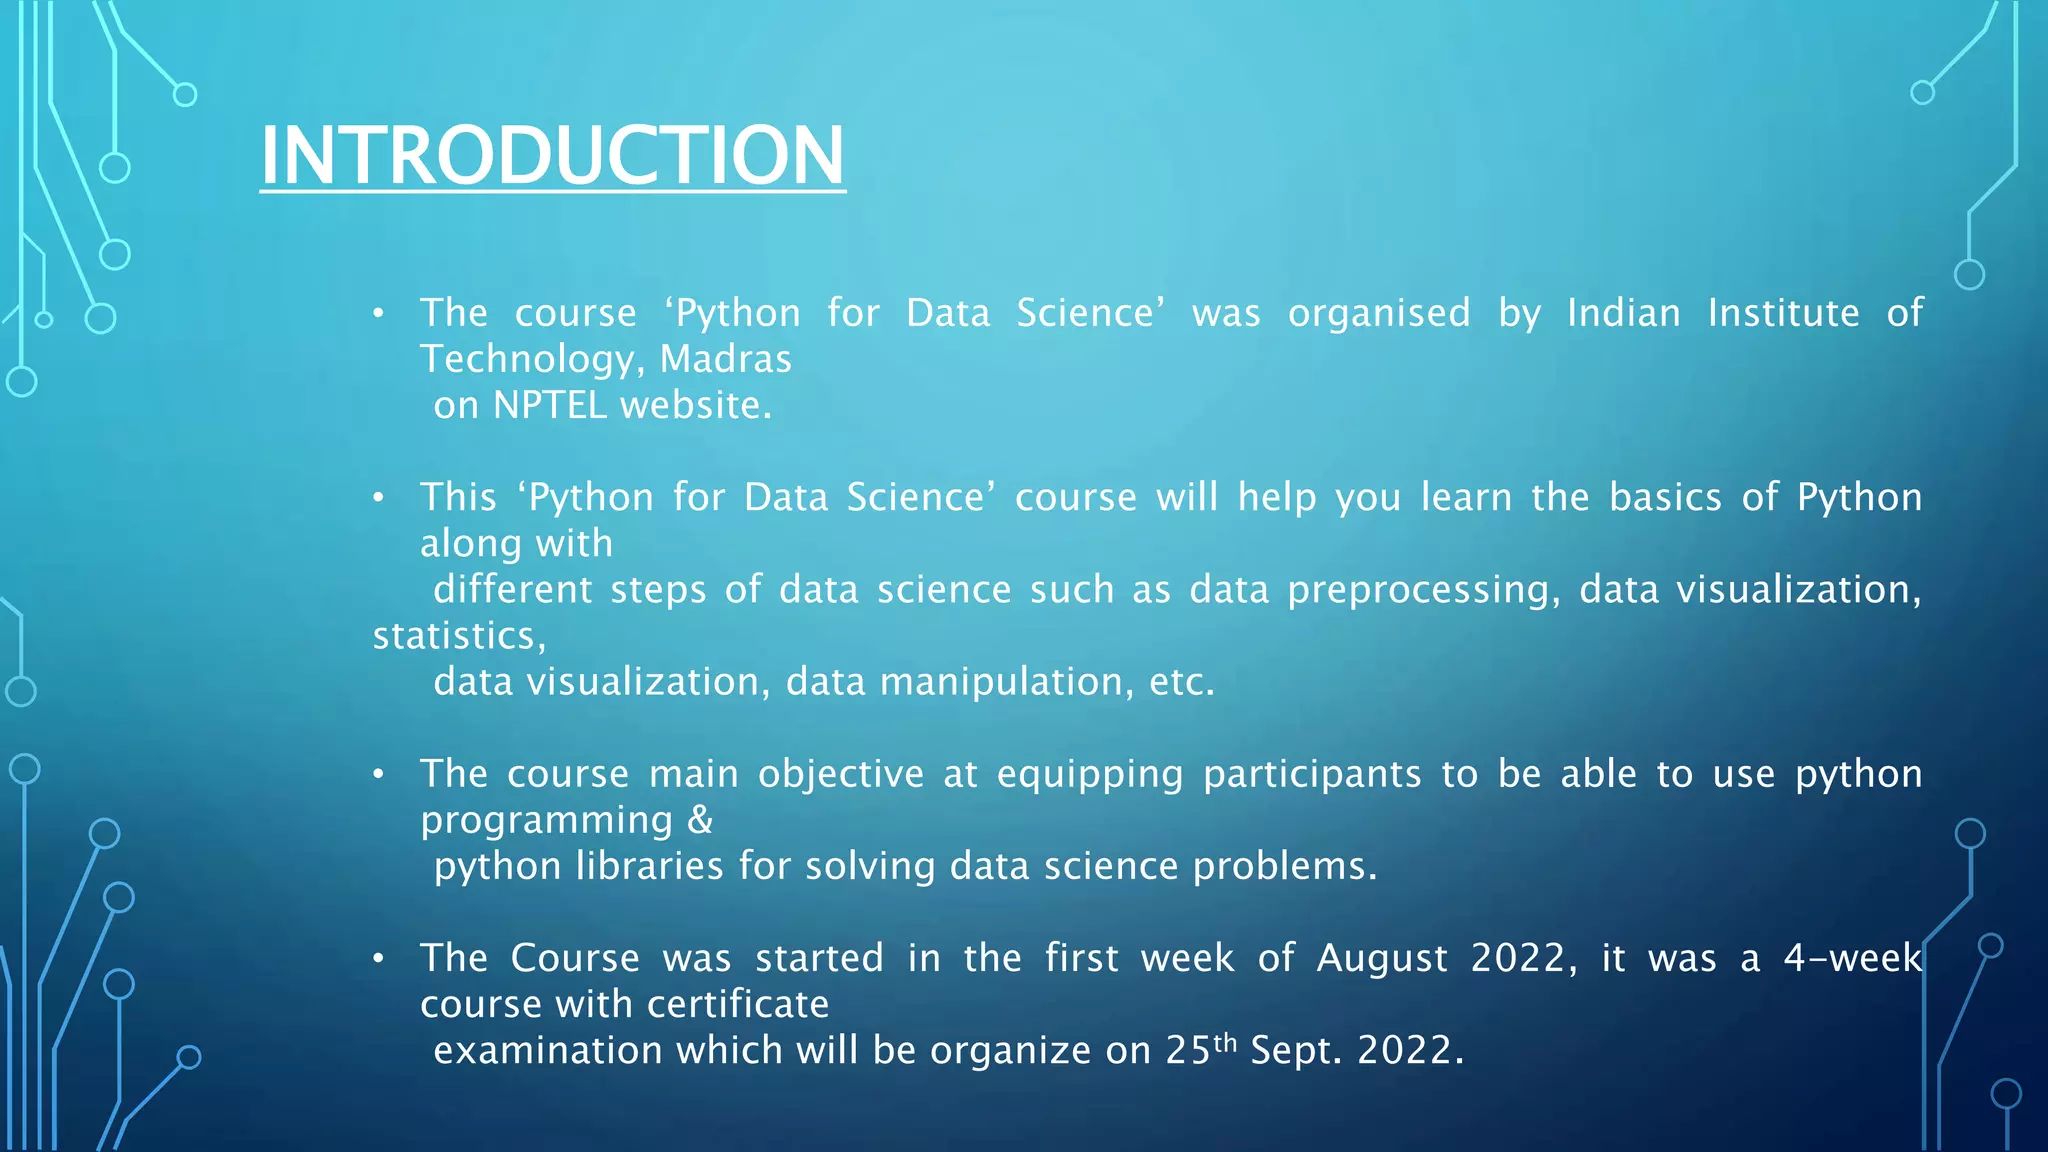
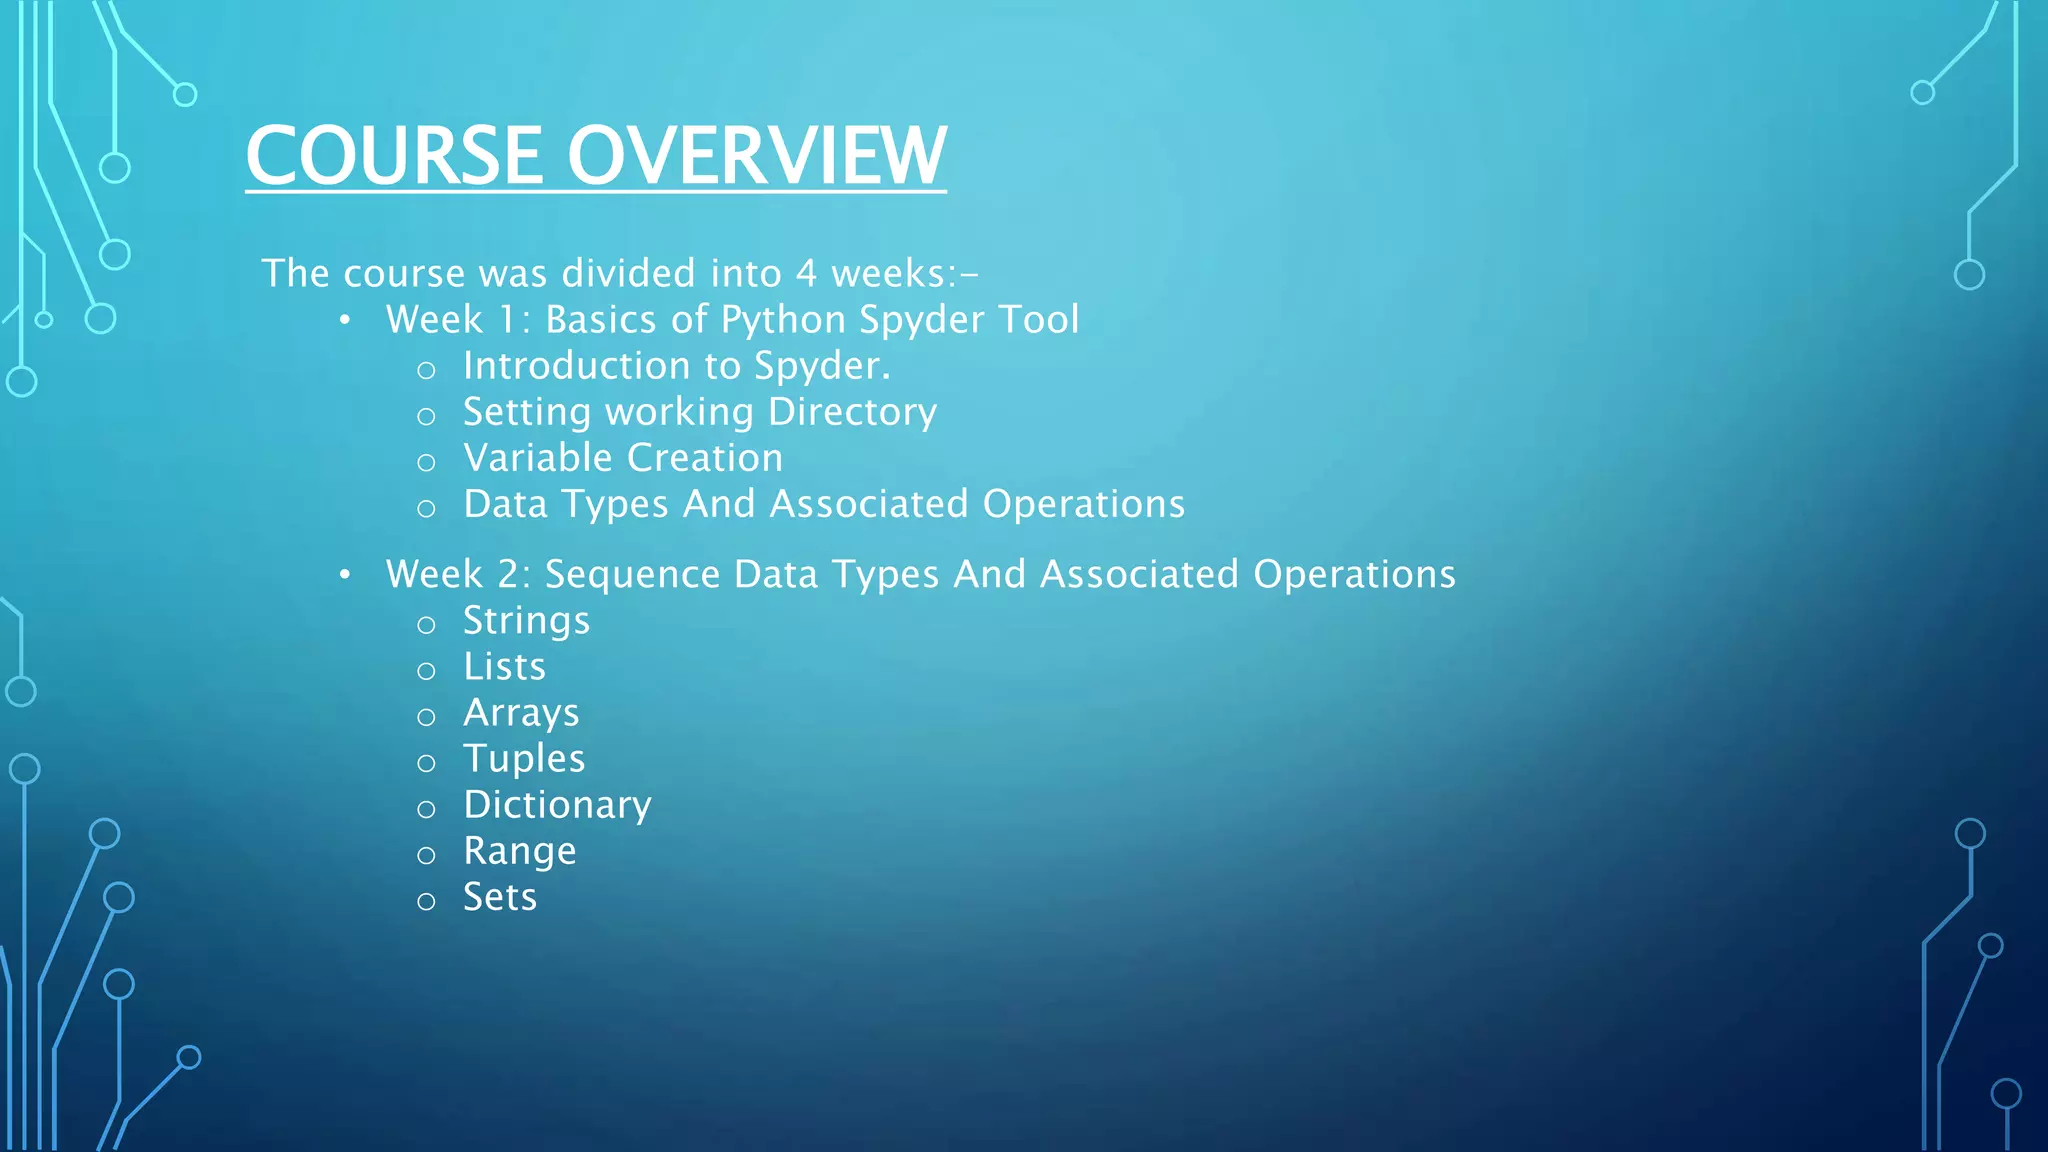
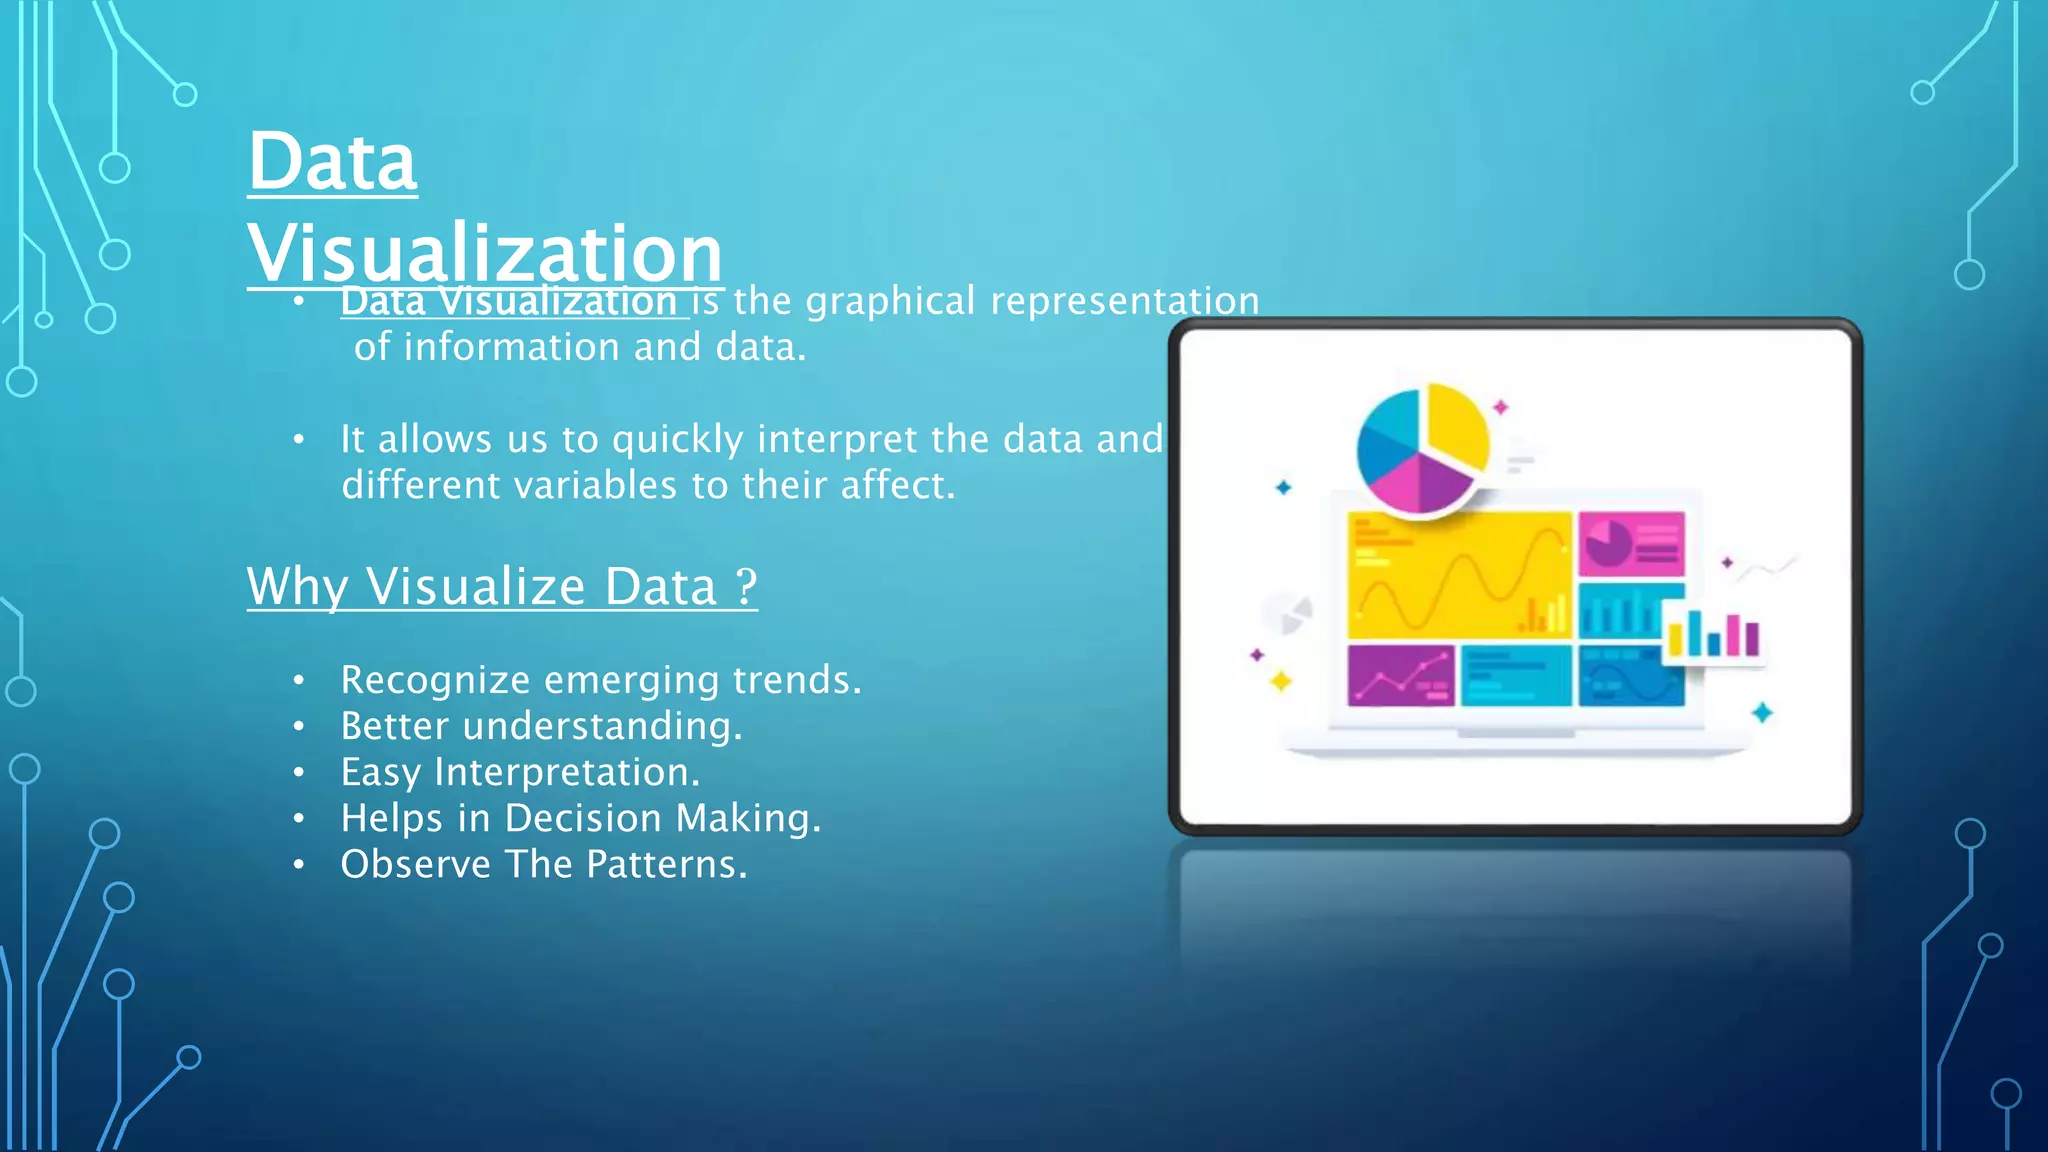
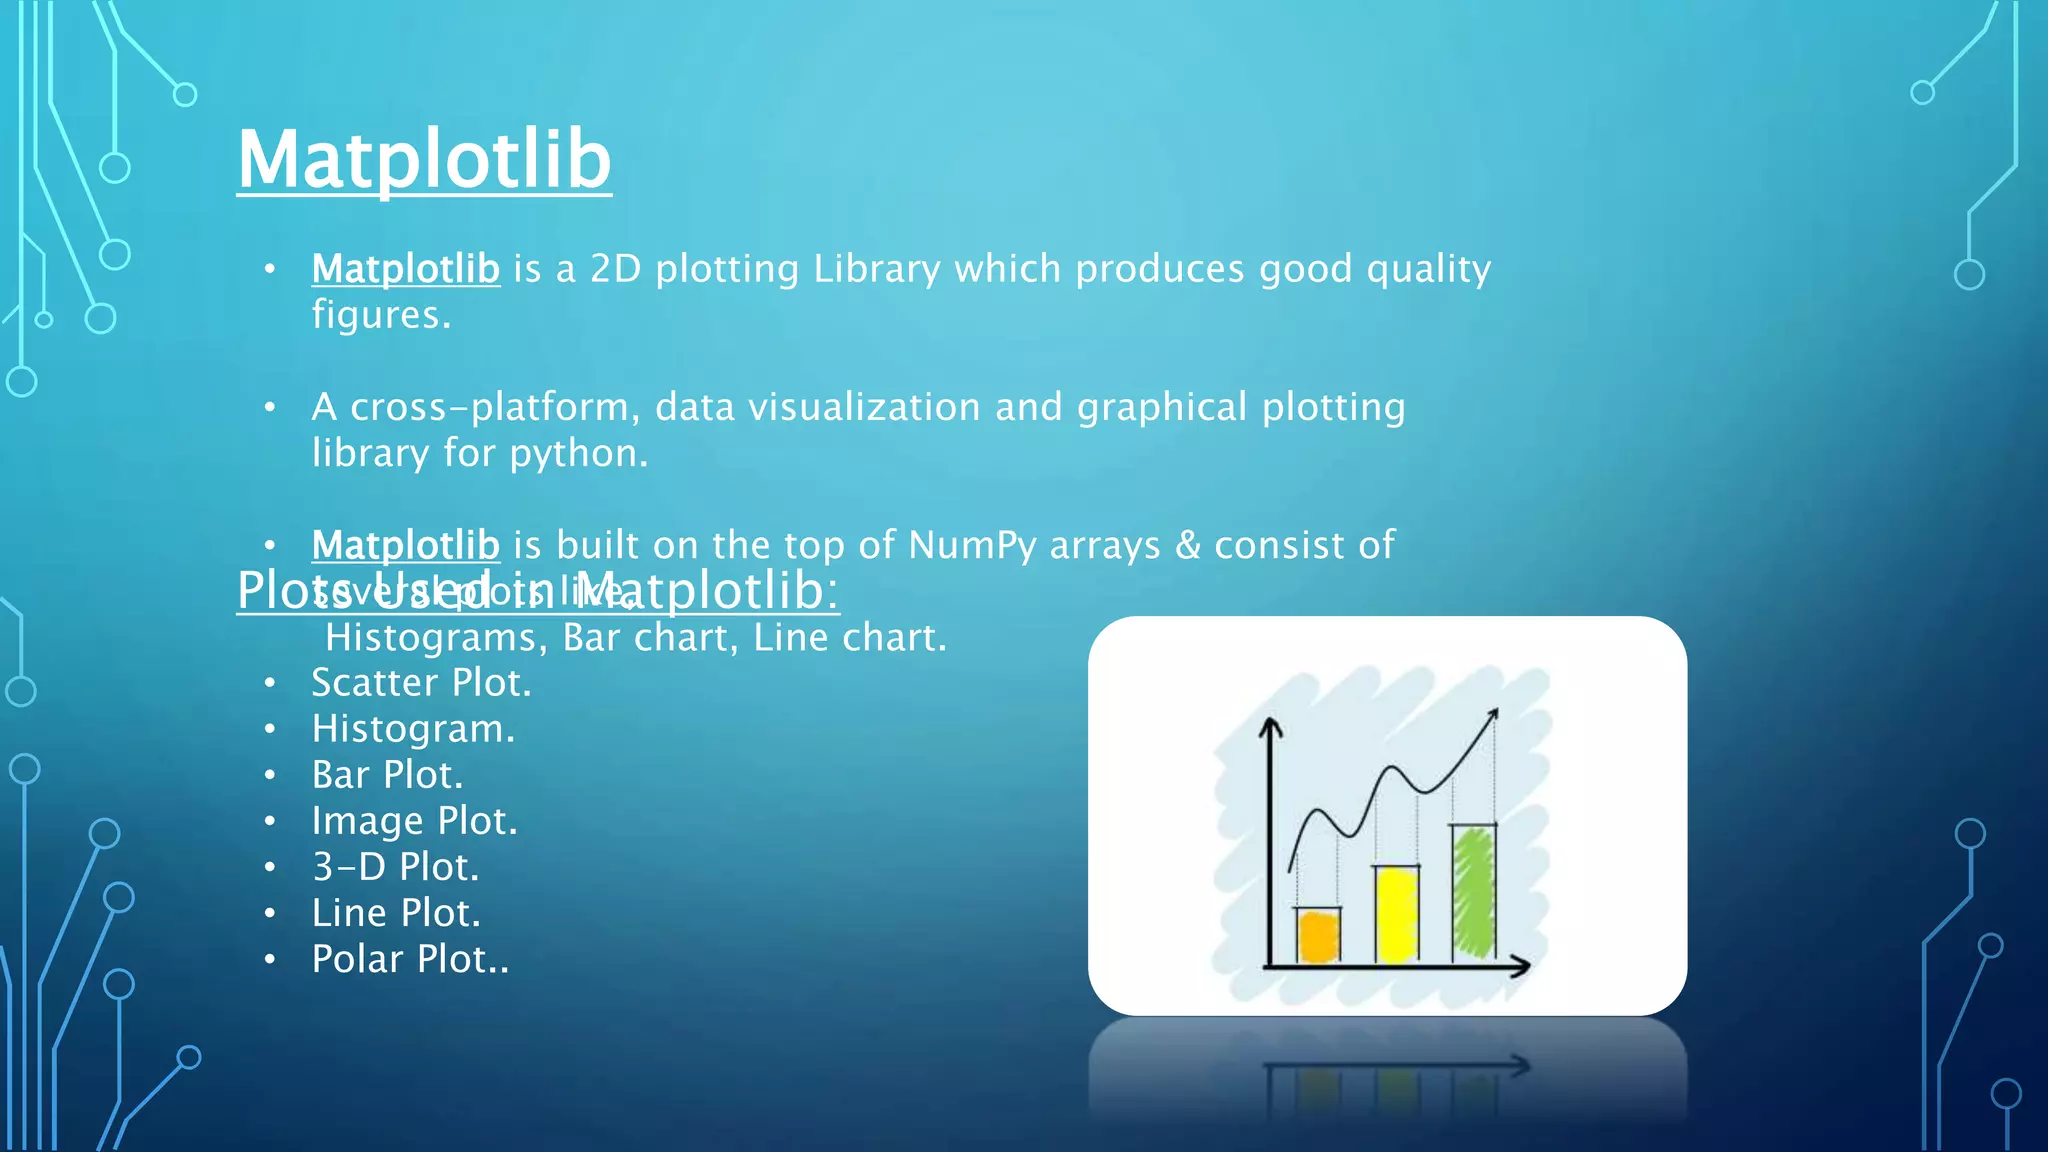
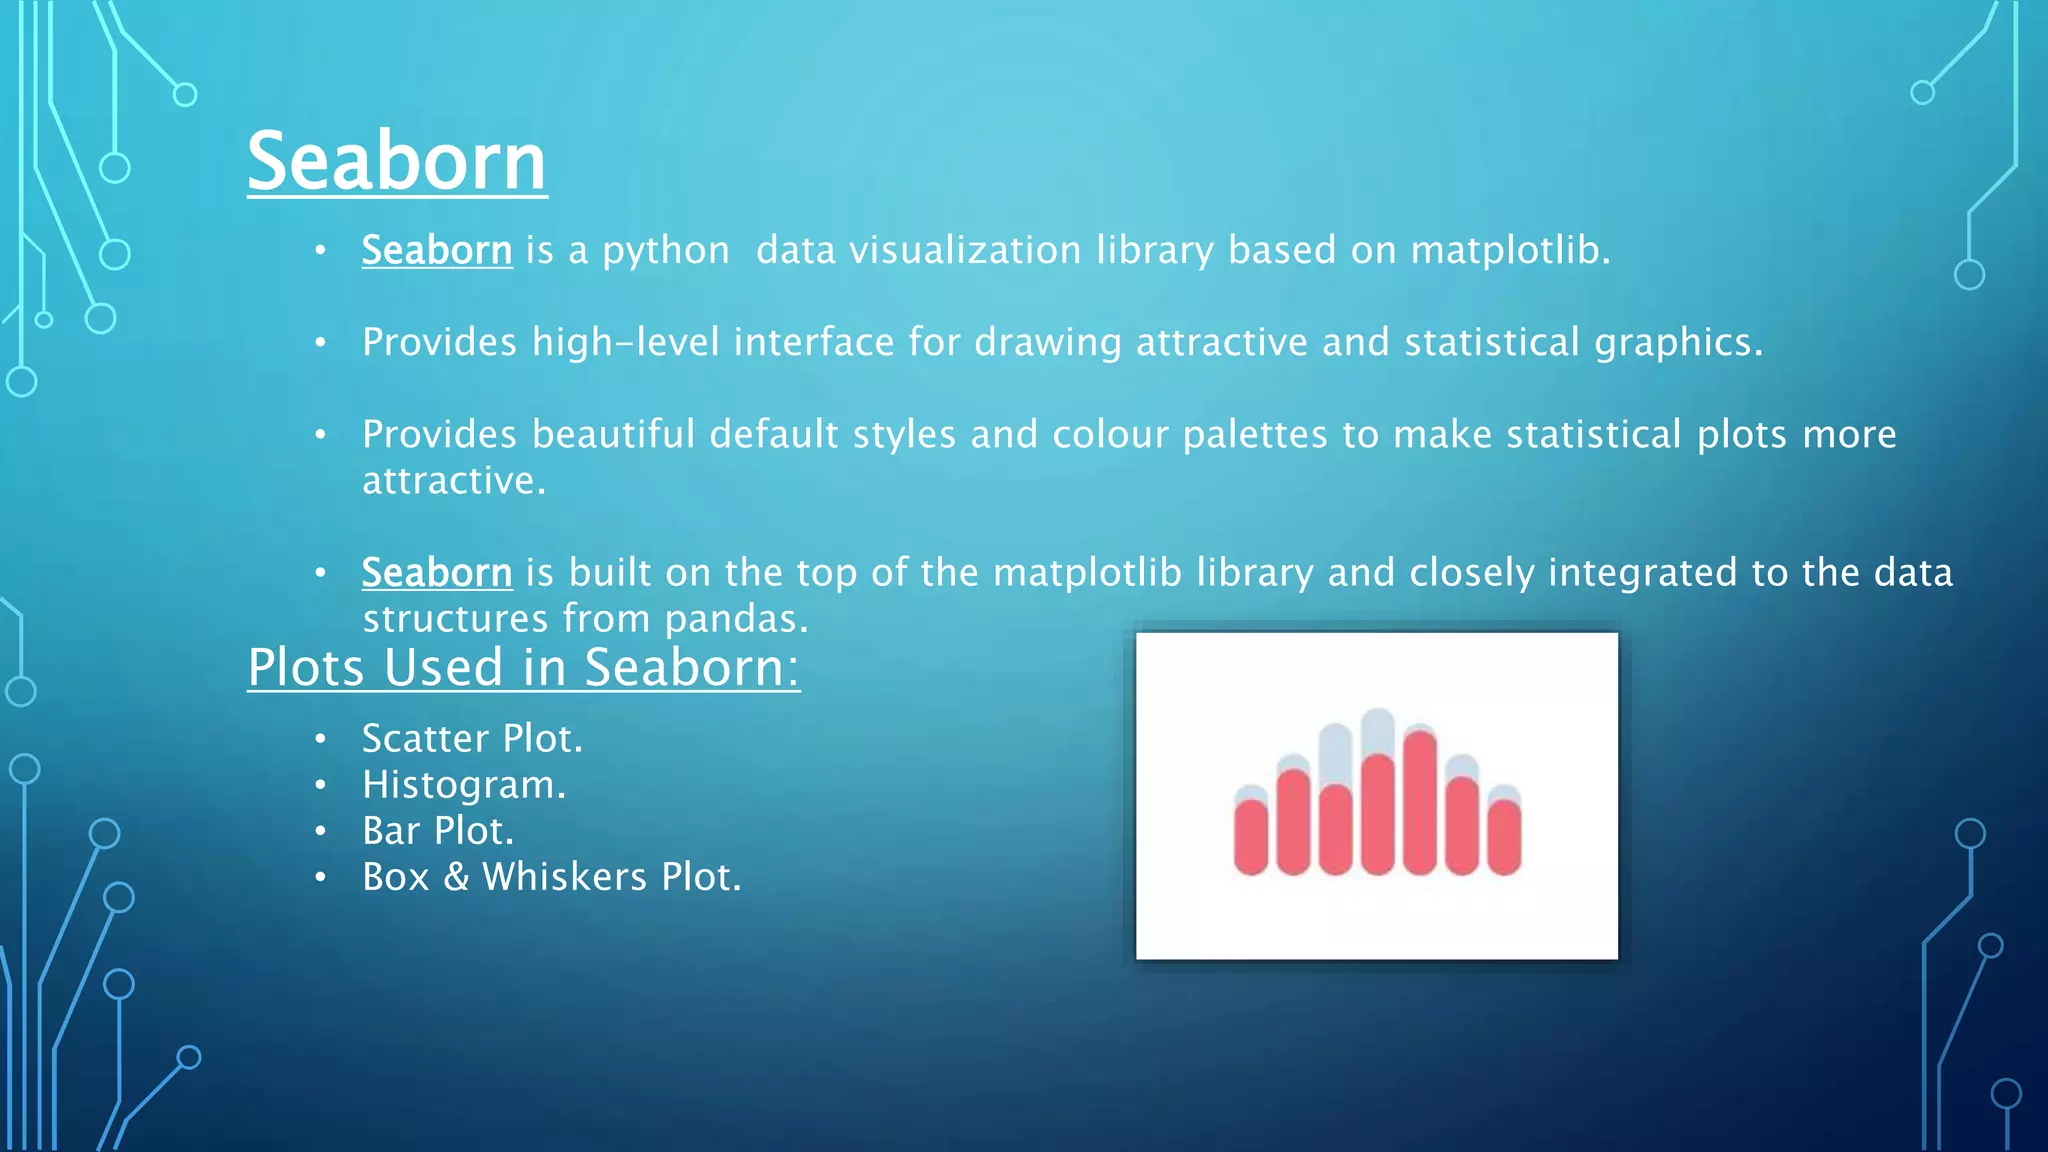
PYTHON FOR DATA
SCIENCE
• PRESENTED T0: DR. AMITA MALIK
• PRESENTED BY: ABHISHEK
INTRODUCTION
• The course ‘Python for Data Science’ was organised by Indian Institute of
Technology, Madras
on NPTEL website.
• This ‘Python for Data Science’ course will help you learn the basics of Python
along with
different steps of data science such as data preprocessing, data visualization,
statistics,
data visualization, data manipulation, etc.
• The course main objective at equipping participants to be able to use python
programming &
python libraries for solving data science problems.
• The Course was started in the first week of August 2022, it was a 4-week
course with certificate
examination which will be organize on 25th Sept. 2022.
COURSE OVERVIEW
The course was divided into 4 weeks:-
• Week 1: Basics of Python Spyder Tool
o Introduction to Spyder.
o Setting working Directory
o Variable Creation
o Data Types And Associated Operations
• Week 2: Sequence Data Types And Associated Operations
o Strings
o Lists
o Arrays
o Tuples
o Dictionary
o Range
o Sets
• Week 3: Pandas Data frame & Data frame Related Operations On Toyota
Corolla Dataset
o Reading Files
o Exploratory Data Analysis
o Data Pre processing And Preparation
• Week 4: Data Visualization Using Matplotlib & Seaborn Libraries
o Scatter Plot
o Bar Plot
o Histogram
o Box Plot
COURSE OVERVIEW
Technologies Learnt
• Spyder IDE
• NumPy
• Jupyter Notebook
• Pandas Dataframes
• Matplotlib
• Seaborn
DATA SCIENCE
• Data Science is the field of applying advanced analytics techniques and
scientific principles to extract valuable information from data for business
decision-making, strategic planning and other uses like data visualization,
data manipulation, etc.
• It is the analysis and extracting of meaningful insights from raw data.
• Data science is used in many industries to make better decisions like, better
hiring decisions, better purchasing decisions.
• Need of Data Science:
o Data Analysis
o Data Mining
o E-commerce
o Machine Learning
o Pattern Recognition
o Logistics
o Sports
o Medical Diagnosis
SPYDER (Integrated Development
Environment)
• Spyder is an open-source cross-platform integrated development
environment (IDE) for scientific programming in the Python language.
• Spyder integrates with a number of prominent packages in the scientific
Python stack, including NumPy, SciPy, Matplotlib, pandas, IPython, SymPy
and Cython, as well as other open-source software.
• Powerful Python IDE with advanced editing, interactive testing, debugging
& introspection features.
JupyterLab: A Next-Generation Notebook
Interface
• JupyterLab is the latest web-based interactive development environment
for notebooks, code, and data.
• Web-based, interactive computing notebook environment.
• Edit & run human-readable docs while describing the data analysis.
• Its flexible interface allows users to configure and arrange workflows in
data science, scientific computing, computational journalism, and
machine learning
SEQUENCE DATA TYPES
• Sequences Allows you to store multiple values in an organised &
efficient manner.
• These offer unique functionalities for the variables to contain &
handle more than one data type at a time.
PANDAS DATAFRAME
• Pandas is a library which is used to deals with the Dataframes and to
manipulate data.
• It provides high performance, easy to use data structure and analysis
tools for python programming language.
Data
Visualization
• Data Visualization is the graphical representation
of information and data.
• It allows us to quickly interpret the data and adjust
different variables to their affect.
Why Visualize Data ?
• Recognize emerging trends.
• Better understanding.
• Easy Interpretation.
• Helps in Decision Making.
• Observe The Patterns.
Matplotlib
• Matplotlib is a 2D plotting Library which produces good quality
figures.
• A cross-platform, data visualization and graphical plotting
library for python.
• Matplotlib is built on the top of NumPy arrays & consist of
several plots like,
Histograms, Bar chart, Line chart.
Plots Used in Matplotlib:
• Scatter Plot.
• Histogram.
• Bar Plot.
• Image Plot.
• 3-D Plot.
• Line Plot.
• Polar Plot..
Seaborn
• Seaborn is a python data visualization library based on matplotlib.
• Provides high-level interface for drawing attractive and statistical graphics.
• Provides beautiful default styles and colour palettes to make statistical plots more
attractive.
• Seaborn is built on the top of the matplotlib library and closely integrated to the data
structures from pandas.
Plots Used in Seaborn:
• Scatter Plot.
• Histogram.
• Bar Plot.
• Box & Whiskers Plot.
Thank You
!

Abhishek Training PPT.pptx

  • 1.
    PYTHON FOR DATA SCIENCE •PRESENTED T0: DR. AMITA MALIK • PRESENTED BY: ABHISHEK
  • 2.
    INTRODUCTION • The course‘Python for Data Science’ was organised by Indian Institute of Technology, Madras on NPTEL website. • This ‘Python for Data Science’ course will help you learn the basics of Python along with different steps of data science such as data preprocessing, data visualization, statistics, data visualization, data manipulation, etc. • The course main objective at equipping participants to be able to use python programming & python libraries for solving data science problems. • The Course was started in the first week of August 2022, it was a 4-week course with certificate examination which will be organize on 25th Sept. 2022.
  • 3.
    COURSE OVERVIEW The coursewas divided into 4 weeks:- • Week 1: Basics of Python Spyder Tool o Introduction to Spyder. o Setting working Directory o Variable Creation o Data Types And Associated Operations • Week 2: Sequence Data Types And Associated Operations o Strings o Lists o Arrays o Tuples o Dictionary o Range o Sets
  • 4.
    • Week 3:Pandas Data frame & Data frame Related Operations On Toyota Corolla Dataset o Reading Files o Exploratory Data Analysis o Data Pre processing And Preparation • Week 4: Data Visualization Using Matplotlib & Seaborn Libraries o Scatter Plot o Bar Plot o Histogram o Box Plot COURSE OVERVIEW
  • 5.
    Technologies Learnt • SpyderIDE • NumPy • Jupyter Notebook • Pandas Dataframes • Matplotlib • Seaborn
  • 6.
    DATA SCIENCE • DataScience is the field of applying advanced analytics techniques and scientific principles to extract valuable information from data for business decision-making, strategic planning and other uses like data visualization, data manipulation, etc. • It is the analysis and extracting of meaningful insights from raw data. • Data science is used in many industries to make better decisions like, better hiring decisions, better purchasing decisions. • Need of Data Science: o Data Analysis o Data Mining o E-commerce o Machine Learning o Pattern Recognition o Logistics o Sports o Medical Diagnosis
  • 7.
    SPYDER (Integrated Development Environment) •Spyder is an open-source cross-platform integrated development environment (IDE) for scientific programming in the Python language. • Spyder integrates with a number of prominent packages in the scientific Python stack, including NumPy, SciPy, Matplotlib, pandas, IPython, SymPy and Cython, as well as other open-source software. • Powerful Python IDE with advanced editing, interactive testing, debugging & introspection features.
  • 8.
    JupyterLab: A Next-GenerationNotebook Interface • JupyterLab is the latest web-based interactive development environment for notebooks, code, and data. • Web-based, interactive computing notebook environment. • Edit & run human-readable docs while describing the data analysis. • Its flexible interface allows users to configure and arrange workflows in data science, scientific computing, computational journalism, and machine learning
  • 9.
    SEQUENCE DATA TYPES •Sequences Allows you to store multiple values in an organised & efficient manner. • These offer unique functionalities for the variables to contain & handle more than one data type at a time.
  • 10.
    PANDAS DATAFRAME • Pandasis a library which is used to deals with the Dataframes and to manipulate data. • It provides high performance, easy to use data structure and analysis tools for python programming language.
  • 11.
    Data Visualization • Data Visualizationis the graphical representation of information and data. • It allows us to quickly interpret the data and adjust different variables to their affect. Why Visualize Data ? • Recognize emerging trends. • Better understanding. • Easy Interpretation. • Helps in Decision Making. • Observe The Patterns.
  • 12.
    Matplotlib • Matplotlib isa 2D plotting Library which produces good quality figures. • A cross-platform, data visualization and graphical plotting library for python. • Matplotlib is built on the top of NumPy arrays & consist of several plots like, Histograms, Bar chart, Line chart. Plots Used in Matplotlib: • Scatter Plot. • Histogram. • Bar Plot. • Image Plot. • 3-D Plot. • Line Plot. • Polar Plot..
  • 13.
    Seaborn • Seaborn isa python data visualization library based on matplotlib. • Provides high-level interface for drawing attractive and statistical graphics. • Provides beautiful default styles and colour palettes to make statistical plots more attractive. • Seaborn is built on the top of the matplotlib library and closely integrated to the data structures from pandas. Plots Used in Seaborn: • Scatter Plot. • Histogram. • Bar Plot. • Box & Whiskers Plot.
  • 14.