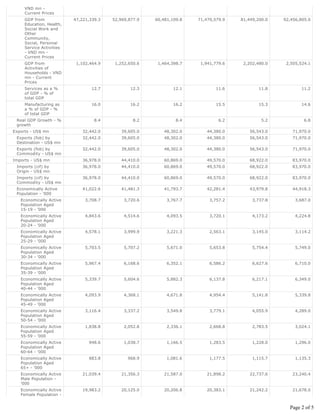
This document provides economic data for Vietnam from 2005 to 2010, including GDP, GDP by sector, exports, imports, labor force participation rates, employment levels by age group and sector. Some key points:
- GDP grew steadily over this period, with real GDP growth averaging around 7% annually.
- Manufacturing and agriculture were large contributors to GDP, together accounting for around 30-35% of GDP.
- Exports and imports both increased substantially, with exports growing from $32 billion to nearly $72 billion between 2005-2010.
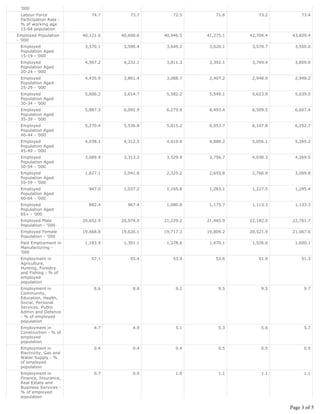
- The labor force participation rate was stable at around 73% and total employment increased from 40 million to nearly 44 million.
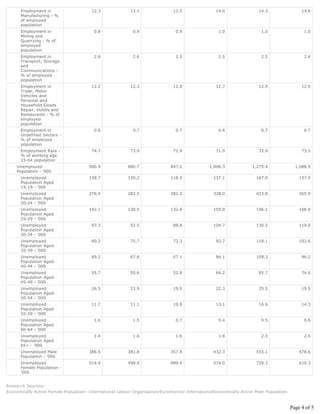
- Employment in manufacturing, trade, and agriculture accounted