SlideShare a Scribd company logo
1 of 2
Download to read offline
R


    Kentucky                                                                 novel


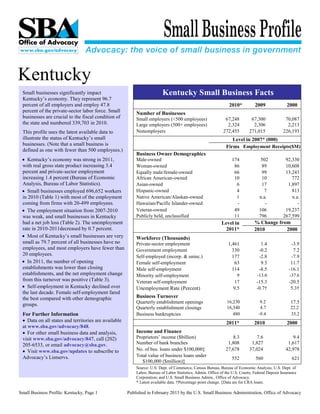
     Small businesses significantly impact                                   Kentucky Small Business Facts
     Kentucky’s economy. They represent 96.7
     percent of all employers and employ 47.8                                                                       2010*          2009               2000
     percent of the private-sector labor force. Small         Number of Businesses
     businesses are crucial to the fiscal condition of        Small employers (<500 employees)                    67,248         67,300              70,087
     the state and numbered 339,703 in 2010.                  Large employers (500+ employees)                     2,324          2,306               2,213
     This profile uses the latest available data to           Nonemployers                                       272,455        271,015             226,193
     illustrate the status of Kentucky’s small                                                                       Level in 2007* (000)
     businesses. (Note that a small business is                                                                   Firms Employment Receipts($M)
     defined as one with fewer than 500 employees.)
                                                              Business Owner Demographics
     • Kentucky’s economy was strong in 2011,                 Male-owned                                              174              502           92,330
     with real gross state product increasing 3.4             Woman-owned                                              86              89            10,608
     percent and private-sector employment                    Equally male/female-owned                                66              99            13,243
     increasing 1.4 percent (Bureau of Economic               African American-owned                                   10              10               772
     Analysis, Bureau of Labor Statistics).                   Asian-owned                                               6              17             1,897
     • Small businesses employed 696,652 workers              Hispanic-owned                                            4               7               813
     in 2010 (Table 1) with most of the employment            Native American/Alaskan-owned                             1             n.a.              n.a.
     coming from firms with 20-499 employees.                 Hawaiian/Pacific Islander-owned                           -                -                 -
     • The employment situation from 2007-2010                Veteran-owned                                            49             106            19,237
     was weak, and small businesses in Kentucky               Publicly held, unclassified                              11             796           267,599
     had a net job loss (Table 2). The unemployment                                                             Level in           % Change from
     rate in 2010-2011decreased by 0.7 percent.                                                                   2011*            2010        2000
     • Most of Kentucky’s small businesses are very           Workforce (Thousands)
     small as 79.7 percent of all businesses have no          Private-sector employment                             1,461              1.4              -3.9
     employees, and most employers have fewer than            Government employment                                   330             -0.2               7.2
     20 employees.                                            Self-employed (incorp. & uninc.)                        177             -2.8              -7.9
     • In 2011, the number of opening                         Female self-employment                                   63              9.5              11.7
     establishments was lower than closing                    Male self-employment                                    114             -8.5             -16.1
     establishments, and the net employment change            Minority self-employment                                   9           -13.0              -37.6
     from this turnover was positive (Table 3).               Veteran self-employment                                  17           -15.3              -20.5
     • Self-employment in Kentucky declined over              Unemployment Rate (Percent)                             9.5           -0.7†               5.3†
     the last decade. Female self-employment fared
     the best compared with other demographic                 Business Turnover
                                                              Quarterly establishment openings                     16,230             9.2               17.5
     groups.
                                                              Quarterly establishment closings                     16,340             4.7               22.2
     For Further Information                                  Business bankruptcies                                   480            -9.4               35.2
     • Data on all states and territories are available                                                           2011*            2010               2000
     at www.sba.gov/advocacy/848.
     • For other small business data and analysis,            Income and Finance
     visit www.sba.gov/advocacy/847, call (202)               Proprietors’ income ($billion)                         8.3           7.6                  9.4
     205-6533, or email advocacy@sba.gov.                     Number of bank branches                              1,808         1,827                1,617
     • Visit www.sba.gov/updates to subscribe to              No. of bus. loans under $100,000‡                   27,678        37,024               42,978
     Advocacy’s Listservs.                                    Total value of business loans under
                                                                                                                      552           560                  621
                                                                 $100,000 ($million)‡
                                                              Source: U.S. Dept. of Commerce, Census Bureau, Bureau of Economic Analysis; U.S. Dept. of
                                                              Labor, Bureau of Labor Statistics; Admin. Office of the U.S. Courts; Federal Deposit Insurance
                                                              Corporation; and U.S. Small Business Admin., Office of Advocacy.
                                                              * Latest available data. †Percentage point change. ‡Data are for CRA loans.

    Small Business Profile: Kentucky, Page 1              Published in February 2013 by the U.S. Small Business Administration, Office of Advocacy
Table 1: Firms and Employment in Kentucky by Industry and Firm Size, 2010
(Nonfarm, Thousands)
                                                                           Employer Firms                               Employment
                                                   Nonemployer    All Firms    1-19       1-499            All Firms       1-19      1-499
Industry                                              Firms         Total    Employees Employees             Total       Employees Employees
Total                                                   272.5          69.6          58.9        67.2       1,456.8 258.3      696.7
Forestry, etc. and agriculture support                    4.9            0.2          0.2         0.2           1.9   0.8         1.8
Mining                                                    1.8            0.5          0.3         0.5          21.2   1.8         8.6
Utilities                                                 0.2            0.1          0.1         0.1           8.3   0.3         2.5
Construction                                             41.4            7.7          7.0         7.6          64.3  27.5        59.4
Manufacturing                                             3.6            3.4          2.1         3.0         203.0  12.3        71.8
Wholesale trade                                           4.2            3.5          2.5         3.1          67.9  11.5        36.9
Retail trade                                             27.1            9.9          8.6         9.6         217.7  40.9        80.6
Transportation and warehousing                           13.0            2.5          1.9         2.2          79.9   7.6        19.6
Information                                               2.6            0.8          0.5         0.7          31.8   2.5         8.6
Finance and insurance                                     7.3            3.1          2.5         2.9          66.8   8.9        26.5
Real estate and rental and leasing                       26.2            2.8          2.6         2.7          18.0   7.6        12.7
Professional, scientific, and technical svcs.            27.8            7.5          6.8         7.3          65.5  23.7        45.0
Management of companies and enterprises                   0.0            0.4          0.1         0.3          25.4   0.2         3.6
Admin., support, waste mgt., remed. svcs.                28.0            3.4          2.8         3.2          82.0  10.6        33.1
Educational services                                      5.3            0.7          0.6         0.7          27.9   2.8        15.8
Health care and social assistance                        17.7            8.1          6.8         7.9         241.4  37.2      110.2
Arts, entertainment, and recreation                      11.3            1.2          1.0         1.2          17.0   4.7        13.8
Accommodation and food services                           3.3            5.4          3.8         5.2         150.6  24.0        91.2
Other services (except public admin.)                    46.8            8.9          8.2         8.8          65.7  33.0        54.3
Unclassified                                              0.0            0.7          0.7         0.7           0.4   0.4         0.4
Source: U.S. Dept. of Commerce, Bureau of the Census, Statistics of U.S. Businesses. (See www.sba.gov/advocacy/849/12162 for data
from other years, and for starts, closures, job creation and destruction by industry and by size category.)


Table 2: Net Job Change by Firm Size, 2007–2010 (Nonfarm)
                      Total Net                                         Employment Size of Firm
                      New Jobs         1-4             5-9           10-19     20-99       100-499           <500          500+
  2010                    -17,061          7,641          214         -1,468        -8,234      -7,742         -9,589       -7,472
  2009                    -71,854          5,129       -4,215         -6,837       -15,595     -17,352        -38,870      -32,984
  2008                     21,939          7,051       -1,449         -3,652        -2,348         553            155       21,784
  2007                      8,612          9,046          550         -1,565          -163        -878          6,990        1,622
Note: Data source differs from previous publications.
Source: U.S. Dept. of Commerce, Bureau of the Census, Business Dynamic Statistics. (For more detailed data see www.sba.gov/advocacy/849/12162.)

Table 3: Establishment and Employment Turnover by Quarter, 2011 (Nonfarm, Thousands)
                                       Establishments                                                          Employment
                       Quarter 1    Quarter 2 Quarter 3            Quarter 4                 Quarter 1     Quarter 2 Quarter 3        Quarter 4

Openings                       3.4          4.2         4.4          4.3                     12.2           14.3          14.6              13.0
Expansions                   19.1         18.8         19.0         18.8                     68.9           72.4          74.1              74.2
Contractions                 19.0         19.1         19.0         19.1                     70.8           66.6          67.9              68.2
Closings                       4.2          4.5         3.7          4.0                     12.6           13.7          10.5              13.5
Source: U.S. Dept. of Labor, Bureau of Labor Statistics, Business Employment Dynamics. (For more detailed data
see www.bls.gov/bdm/.)
Note: These figures contain all firm sizes; Census data from 2010 show that 87 percent of establishment births and deaths
were in firms with fewer than 500 employees.


Small Business Profile: Kentucky, Page 2                        Published in Feb. 2013 by the U.S. Small Business Administration, Office of Advocacy

More Related Content

What's hot

Launch Tennessee-A Five-Year Strategic Plan to Make Tennessee A National Inno...
Launch Tennessee-A Five-Year Strategic Plan to Make Tennessee A National Inno...Launch Tennessee-A Five-Year Strategic Plan to Make Tennessee A National Inno...
Launch Tennessee-A Five-Year Strategic Plan to Make Tennessee A National Inno...Ed Dodds
 
Us Economy Update October 2009
Us Economy Update October 2009Us Economy Update October 2009
Us Economy Update October 2009noahstayton
 
progressive mreport-01/07
progressive mreport-01/07progressive mreport-01/07
progressive mreport-01/07finance18
 
Weekly Market Snapshot, September 25, 2009
Weekly Market Snapshot, September 25, 2009Weekly Market Snapshot, September 25, 2009
Weekly Market Snapshot, September 25, 2009Jeff Green
 

What's hot (9)

Launch Tennessee-A Five-Year Strategic Plan to Make Tennessee A National Inno...
Launch Tennessee-A Five-Year Strategic Plan to Make Tennessee A National Inno...Launch Tennessee-A Five-Year Strategic Plan to Make Tennessee A National Inno...
Launch Tennessee-A Five-Year Strategic Plan to Make Tennessee A National Inno...
 
Market Watch April 2011
Market Watch April 2011Market Watch April 2011
Market Watch April 2011
 
Macquarie
MacquarieMacquarie
Macquarie
 
Us Economy Update October 2009
Us Economy Update October 2009Us Economy Update October 2009
Us Economy Update October 2009
 
Checking2 Br
Checking2 BrChecking2 Br
Checking2 Br
 
An Analysis of Berkshire Hathaway
An Analysis of Berkshire HathawayAn Analysis of Berkshire Hathaway
An Analysis of Berkshire Hathaway
 
progressive mreport-01/07
progressive mreport-01/07progressive mreport-01/07
progressive mreport-01/07
 
Weekly Market Snapshot, September 25, 2009
Weekly Market Snapshot, September 25, 2009Weekly Market Snapshot, September 25, 2009
Weekly Market Snapshot, September 25, 2009
 
Market Watch December 2012
Market Watch December 2012Market Watch December 2012
Market Watch December 2012
 

Similar to Kentucky Small Business Profile

Key stats of small business survival rates
Key stats of small business survival ratesKey stats of small business survival rates
Key stats of small business survival ratesJuan Solana
 
Morris county-data-demographics-labor-employment
Morris county-data-demographics-labor-employmentMorris county-data-demographics-labor-employment
Morris county-data-demographics-labor-employmentfianacone
 
Meeting with investors of march 2013
Meeting with investors of march 2013Meeting with investors of march 2013
Meeting with investors of march 2013TIM RI
 
Gfarmer Birmingham Visit 090409
Gfarmer Birmingham Visit 090409Gfarmer Birmingham Visit 090409
Gfarmer Birmingham Visit 090409Wade Kwon
 
Yardi Matrix Office Webinar 3/21/2018
Yardi Matrix Office Webinar 3/21/2018Yardi Matrix Office Webinar 3/21/2018
Yardi Matrix Office Webinar 3/21/2018Jeffrey W. Adler
 
Hagerstown breakfast discussion 12.5.12 for public
Hagerstown breakfast discussion 12.5.12 for publicHagerstown breakfast discussion 12.5.12 for public
Hagerstown breakfast discussion 12.5.12 for publicHagerstownChamber
 
Canadian (Non)Exceptionalism: Crisis, Recovery, Austerity
Canadian (Non)Exceptionalism: Crisis, Recovery, AusterityCanadian (Non)Exceptionalism: Crisis, Recovery, Austerity
Canadian (Non)Exceptionalism: Crisis, Recovery, AusterityLeft Streamed
 
Franchising Economic Outlook 2011
Franchising Economic Outlook 2011Franchising Economic Outlook 2011
Franchising Economic Outlook 2011rjashe
 
The Linneman Letter: Volume 10 Issue 2
The Linneman Letter: Volume 10 Issue 2The Linneman Letter: Volume 10 Issue 2
The Linneman Letter: Volume 10 Issue 2Dan Hutchins
 
Economic potential of future growth at the halifax shipyard
Economic potential of future growth at the halifax shipyardEconomic potential of future growth at the halifax shipyard
Economic potential of future growth at the halifax shipyardHalifax Partnership
 
Government Role in supporting small business in South Africa
Government Role in supporting small business in South AfricaGovernment Role in supporting small business in South Africa
Government Role in supporting small business in South AfricaZapreneur
 
Economic update (feb 2013)
Economic update (feb 2013)Economic update (feb 2013)
Economic update (feb 2013)Jacob Rhoades
 
Construction e business inaugural lecture
Construction e business inaugural lectureConstruction e business inaugural lecture
Construction e business inaugural lectureSrinath Perera
 
Monmouth county-data-demographics-labor-employment
Monmouth county-data-demographics-labor-employmentMonmouth county-data-demographics-labor-employment
Monmouth county-data-demographics-labor-employmentfianacone
 
Meeting with investors of february 2013
Meeting with investors of february 2013Meeting with investors of february 2013
Meeting with investors of february 2013TIM RI
 
Nevada's Economy - February 2012
Nevada's Economy - February 2012Nevada's Economy - February 2012
Nevada's Economy - February 2012Katie Madanat
 
Gloucester county-data-demographics-labor-employment
Gloucester county-data-demographics-labor-employmentGloucester county-data-demographics-labor-employment
Gloucester county-data-demographics-labor-employmentfianacone
 

Similar to Kentucky Small Business Profile (20)

Key stats of small business survival rates
Key stats of small business survival ratesKey stats of small business survival rates
Key stats of small business survival rates
 
Morris county-data-demographics-labor-employment
Morris county-data-demographics-labor-employmentMorris county-data-demographics-labor-employment
Morris county-data-demographics-labor-employment
 
Meeting with investors of march 2013
Meeting with investors of march 2013Meeting with investors of march 2013
Meeting with investors of march 2013
 
CONNECT 2011 - Michael Shuman
CONNECT 2011 - Michael ShumanCONNECT 2011 - Michael Shuman
CONNECT 2011 - Michael Shuman
 
Gfarmer Birmingham Visit 090409
Gfarmer Birmingham Visit 090409Gfarmer Birmingham Visit 090409
Gfarmer Birmingham Visit 090409
 
Yardi Matrix Office Webinar 3/21/2018
Yardi Matrix Office Webinar 3/21/2018Yardi Matrix Office Webinar 3/21/2018
Yardi Matrix Office Webinar 3/21/2018
 
Hagerstown breakfast discussion 12.5.12 for public
Hagerstown breakfast discussion 12.5.12 for publicHagerstown breakfast discussion 12.5.12 for public
Hagerstown breakfast discussion 12.5.12 for public
 
Canadian (Non)Exceptionalism: Crisis, Recovery, Austerity
Canadian (Non)Exceptionalism: Crisis, Recovery, AusterityCanadian (Non)Exceptionalism: Crisis, Recovery, Austerity
Canadian (Non)Exceptionalism: Crisis, Recovery, Austerity
 
Franchising Economic Outlook 2011
Franchising Economic Outlook 2011Franchising Economic Outlook 2011
Franchising Economic Outlook 2011
 
2009 108 ch7
2009 108 ch72009 108 ch7
2009 108 ch7
 
The Linneman Letter: Volume 10 Issue 2
The Linneman Letter: Volume 10 Issue 2The Linneman Letter: Volume 10 Issue 2
The Linneman Letter: Volume 10 Issue 2
 
Economic potential of future growth at the halifax shipyard
Economic potential of future growth at the halifax shipyardEconomic potential of future growth at the halifax shipyard
Economic potential of future growth at the halifax shipyard
 
Government Role in supporting small business in South Africa
Government Role in supporting small business in South AfricaGovernment Role in supporting small business in South Africa
Government Role in supporting small business in South Africa
 
Economic update (feb 2013)
Economic update (feb 2013)Economic update (feb 2013)
Economic update (feb 2013)
 
Salary Survey Northern Ireland 2010
Salary Survey Northern Ireland 2010 Salary Survey Northern Ireland 2010
Salary Survey Northern Ireland 2010
 
Construction e business inaugural lecture
Construction e business inaugural lectureConstruction e business inaugural lecture
Construction e business inaugural lecture
 
Monmouth county-data-demographics-labor-employment
Monmouth county-data-demographics-labor-employmentMonmouth county-data-demographics-labor-employment
Monmouth county-data-demographics-labor-employment
 
Meeting with investors of february 2013
Meeting with investors of february 2013Meeting with investors of february 2013
Meeting with investors of february 2013
 
Nevada's Economy - February 2012
Nevada's Economy - February 2012Nevada's Economy - February 2012
Nevada's Economy - February 2012
 
Gloucester county-data-demographics-labor-employment
Gloucester county-data-demographics-labor-employmentGloucester county-data-demographics-labor-employment
Gloucester county-data-demographics-labor-employment
 

More from Kentucky Small Business Development Center (10)

Grow Kentucky 2015 Economic Gardening Program
Grow Kentucky 2015 Economic Gardening ProgramGrow Kentucky 2015 Economic Gardening Program
Grow Kentucky 2015 Economic Gardening Program
 
Ksbdc Sales & Marketing Directory
Ksbdc Sales & Marketing DirectoryKsbdc Sales & Marketing Directory
Ksbdc Sales & Marketing Directory
 
Grow Kentucky - Economic Gardening Presentation
Grow Kentucky - Economic Gardening PresentationGrow Kentucky - Economic Gardening Presentation
Grow Kentucky - Economic Gardening Presentation
 
KSBDC Louisville Funding Sources for Business
KSBDC Louisville Funding Sources for BusinessKSBDC Louisville Funding Sources for Business
KSBDC Louisville Funding Sources for Business
 
Lexington Minority and Women Business Training Program Application
Lexington Minority and Women Business Training Program ApplicationLexington Minority and Women Business Training Program Application
Lexington Minority and Women Business Training Program Application
 
Lexington Minority and Women Business Training Program Brochure
Lexington Minority and Women Business Training Program BrochureLexington Minority and Women Business Training Program Brochure
Lexington Minority and Women Business Training Program Brochure
 
Marketing Art - Marketing for Artisans and Craftspeople
Marketing Art - Marketing for Artisans and CraftspeopleMarketing Art - Marketing for Artisans and Craftspeople
Marketing Art - Marketing for Artisans and Craftspeople
 
What The New Healthcare Law Means For Your Small Business
What The New Healthcare Law Means For Your Small BusinessWhat The New Healthcare Law Means For Your Small Business
What The New Healthcare Law Means For Your Small Business
 
The Bootstrapper's Bible
The Bootstrapper's BibleThe Bootstrapper's Bible
The Bootstrapper's Bible
 
About The KSBDC
About The KSBDCAbout The KSBDC
About The KSBDC
 

Recently uploaded

Call Girls In Connaught Place Delhi ❤️88604**77959_Russian 100% Genuine Escor...
Call Girls In Connaught Place Delhi ❤️88604**77959_Russian 100% Genuine Escor...Call Girls In Connaught Place Delhi ❤️88604**77959_Russian 100% Genuine Escor...
Call Girls In Connaught Place Delhi ❤️88604**77959_Russian 100% Genuine Escor...lizamodels9
 
Cash Payment 9602870969 Escort Service in Udaipur Call Girls
Cash Payment 9602870969 Escort Service in Udaipur Call GirlsCash Payment 9602870969 Escort Service in Udaipur Call Girls
Cash Payment 9602870969 Escort Service in Udaipur Call GirlsApsara Of India
 
BEST Call Girls In Greater Noida ✨ 9773824855 ✨ Escorts Service In Delhi Ncr,
BEST Call Girls In Greater Noida ✨ 9773824855 ✨ Escorts Service In Delhi Ncr,BEST Call Girls In Greater Noida ✨ 9773824855 ✨ Escorts Service In Delhi Ncr,
BEST Call Girls In Greater Noida ✨ 9773824855 ✨ Escorts Service In Delhi Ncr,noida100girls
 
(Best) ENJOY Call Girls in Faridabad Ex | 8377087607
(Best) ENJOY Call Girls in Faridabad Ex | 8377087607(Best) ENJOY Call Girls in Faridabad Ex | 8377087607
(Best) ENJOY Call Girls in Faridabad Ex | 8377087607dollysharma2066
 
8447779800, Low rate Call girls in Saket Delhi NCR
8447779800, Low rate Call girls in Saket Delhi NCR8447779800, Low rate Call girls in Saket Delhi NCR
8447779800, Low rate Call girls in Saket Delhi NCRashishs7044
 
Case study on tata clothing brand zudio in detail
Case study on tata clothing brand zudio in detailCase study on tata clothing brand zudio in detail
Case study on tata clothing brand zudio in detailAriel592675
 
8447779800, Low rate Call girls in Shivaji Enclave Delhi NCR
8447779800, Low rate Call girls in Shivaji Enclave Delhi NCR8447779800, Low rate Call girls in Shivaji Enclave Delhi NCR
8447779800, Low rate Call girls in Shivaji Enclave Delhi NCRashishs7044
 
Keppel Ltd. 1Q 2024 Business Update Presentation Slides
Keppel Ltd. 1Q 2024 Business Update  Presentation SlidesKeppel Ltd. 1Q 2024 Business Update  Presentation Slides
Keppel Ltd. 1Q 2024 Business Update Presentation SlidesKeppelCorporation
 
Sales & Marketing Alignment: How to Synergize for Success
Sales & Marketing Alignment: How to Synergize for SuccessSales & Marketing Alignment: How to Synergize for Success
Sales & Marketing Alignment: How to Synergize for SuccessAggregage
 
8447779800, Low rate Call girls in Kotla Mubarakpur Delhi NCR
8447779800, Low rate Call girls in Kotla Mubarakpur Delhi NCR8447779800, Low rate Call girls in Kotla Mubarakpur Delhi NCR
8447779800, Low rate Call girls in Kotla Mubarakpur Delhi NCRashishs7044
 
Vip Female Escorts Noida 9711199171 Greater Noida Escorts Service
Vip Female Escorts Noida 9711199171 Greater Noida Escorts ServiceVip Female Escorts Noida 9711199171 Greater Noida Escorts Service
Vip Female Escorts Noida 9711199171 Greater Noida Escorts Serviceankitnayak356677
 
Intro to BCG's Carbon Emissions Benchmark_vF.pdf
Intro to BCG's Carbon Emissions Benchmark_vF.pdfIntro to BCG's Carbon Emissions Benchmark_vF.pdf
Intro to BCG's Carbon Emissions Benchmark_vF.pdfpollardmorgan
 
Kenya’s Coconut Value Chain by Gatsby Africa
Kenya’s Coconut Value Chain by Gatsby AfricaKenya’s Coconut Value Chain by Gatsby Africa
Kenya’s Coconut Value Chain by Gatsby Africaictsugar
 
(8264348440) 🔝 Call Girls In Mahipalpur 🔝 Delhi NCR
(8264348440) 🔝 Call Girls In Mahipalpur 🔝 Delhi NCR(8264348440) 🔝 Call Girls In Mahipalpur 🔝 Delhi NCR
(8264348440) 🔝 Call Girls In Mahipalpur 🔝 Delhi NCRsoniya singh
 
Pitch Deck Teardown: NOQX's $200k Pre-seed deck
Pitch Deck Teardown: NOQX's $200k Pre-seed deckPitch Deck Teardown: NOQX's $200k Pre-seed deck
Pitch Deck Teardown: NOQX's $200k Pre-seed deckHajeJanKamps
 
NewBase 19 April 2024 Energy News issue - 1717 by Khaled Al Awadi.pdf
NewBase  19 April  2024  Energy News issue - 1717 by Khaled Al Awadi.pdfNewBase  19 April  2024  Energy News issue - 1717 by Khaled Al Awadi.pdf
NewBase 19 April 2024 Energy News issue - 1717 by Khaled Al Awadi.pdfKhaled Al Awadi
 
Islamabad Escorts | Call 03274100048 | Escort Service in Islamabad
Islamabad Escorts | Call 03274100048 | Escort Service in IslamabadIslamabad Escorts | Call 03274100048 | Escort Service in Islamabad
Islamabad Escorts | Call 03274100048 | Escort Service in IslamabadAyesha Khan
 
Global Scenario On Sustainable and Resilient Coconut Industry by Dr. Jelfina...
Global Scenario On Sustainable  and Resilient Coconut Industry by Dr. Jelfina...Global Scenario On Sustainable  and Resilient Coconut Industry by Dr. Jelfina...
Global Scenario On Sustainable and Resilient Coconut Industry by Dr. Jelfina...ictsugar
 
Call Girls In Sikandarpur Gurgaon ❤️8860477959_Russian 100% Genuine Escorts I...
Call Girls In Sikandarpur Gurgaon ❤️8860477959_Russian 100% Genuine Escorts I...Call Girls In Sikandarpur Gurgaon ❤️8860477959_Russian 100% Genuine Escorts I...
Call Girls In Sikandarpur Gurgaon ❤️8860477959_Russian 100% Genuine Escorts I...lizamodels9
 
/:Call Girls In Indirapuram Ghaziabad ➥9990211544 Independent Best Escorts In...
/:Call Girls In Indirapuram Ghaziabad ➥9990211544 Independent Best Escorts In.../:Call Girls In Indirapuram Ghaziabad ➥9990211544 Independent Best Escorts In...
/:Call Girls In Indirapuram Ghaziabad ➥9990211544 Independent Best Escorts In...lizamodels9
 

Recently uploaded (20)

Call Girls In Connaught Place Delhi ❤️88604**77959_Russian 100% Genuine Escor...
Call Girls In Connaught Place Delhi ❤️88604**77959_Russian 100% Genuine Escor...Call Girls In Connaught Place Delhi ❤️88604**77959_Russian 100% Genuine Escor...
Call Girls In Connaught Place Delhi ❤️88604**77959_Russian 100% Genuine Escor...
 
Cash Payment 9602870969 Escort Service in Udaipur Call Girls
Cash Payment 9602870969 Escort Service in Udaipur Call GirlsCash Payment 9602870969 Escort Service in Udaipur Call Girls
Cash Payment 9602870969 Escort Service in Udaipur Call Girls
 
BEST Call Girls In Greater Noida ✨ 9773824855 ✨ Escorts Service In Delhi Ncr,
BEST Call Girls In Greater Noida ✨ 9773824855 ✨ Escorts Service In Delhi Ncr,BEST Call Girls In Greater Noida ✨ 9773824855 ✨ Escorts Service In Delhi Ncr,
BEST Call Girls In Greater Noida ✨ 9773824855 ✨ Escorts Service In Delhi Ncr,
 
(Best) ENJOY Call Girls in Faridabad Ex | 8377087607
(Best) ENJOY Call Girls in Faridabad Ex | 8377087607(Best) ENJOY Call Girls in Faridabad Ex | 8377087607
(Best) ENJOY Call Girls in Faridabad Ex | 8377087607
 
8447779800, Low rate Call girls in Saket Delhi NCR
8447779800, Low rate Call girls in Saket Delhi NCR8447779800, Low rate Call girls in Saket Delhi NCR
8447779800, Low rate Call girls in Saket Delhi NCR
 
Case study on tata clothing brand zudio in detail
Case study on tata clothing brand zudio in detailCase study on tata clothing brand zudio in detail
Case study on tata clothing brand zudio in detail
 
8447779800, Low rate Call girls in Shivaji Enclave Delhi NCR
8447779800, Low rate Call girls in Shivaji Enclave Delhi NCR8447779800, Low rate Call girls in Shivaji Enclave Delhi NCR
8447779800, Low rate Call girls in Shivaji Enclave Delhi NCR
 
Keppel Ltd. 1Q 2024 Business Update Presentation Slides
Keppel Ltd. 1Q 2024 Business Update  Presentation SlidesKeppel Ltd. 1Q 2024 Business Update  Presentation Slides
Keppel Ltd. 1Q 2024 Business Update Presentation Slides
 
Sales & Marketing Alignment: How to Synergize for Success
Sales & Marketing Alignment: How to Synergize for SuccessSales & Marketing Alignment: How to Synergize for Success
Sales & Marketing Alignment: How to Synergize for Success
 
8447779800, Low rate Call girls in Kotla Mubarakpur Delhi NCR
8447779800, Low rate Call girls in Kotla Mubarakpur Delhi NCR8447779800, Low rate Call girls in Kotla Mubarakpur Delhi NCR
8447779800, Low rate Call girls in Kotla Mubarakpur Delhi NCR
 
Vip Female Escorts Noida 9711199171 Greater Noida Escorts Service
Vip Female Escorts Noida 9711199171 Greater Noida Escorts ServiceVip Female Escorts Noida 9711199171 Greater Noida Escorts Service
Vip Female Escorts Noida 9711199171 Greater Noida Escorts Service
 
Intro to BCG's Carbon Emissions Benchmark_vF.pdf
Intro to BCG's Carbon Emissions Benchmark_vF.pdfIntro to BCG's Carbon Emissions Benchmark_vF.pdf
Intro to BCG's Carbon Emissions Benchmark_vF.pdf
 
Kenya’s Coconut Value Chain by Gatsby Africa
Kenya’s Coconut Value Chain by Gatsby AfricaKenya’s Coconut Value Chain by Gatsby Africa
Kenya’s Coconut Value Chain by Gatsby Africa
 
(8264348440) 🔝 Call Girls In Mahipalpur 🔝 Delhi NCR
(8264348440) 🔝 Call Girls In Mahipalpur 🔝 Delhi NCR(8264348440) 🔝 Call Girls In Mahipalpur 🔝 Delhi NCR
(8264348440) 🔝 Call Girls In Mahipalpur 🔝 Delhi NCR
 
Pitch Deck Teardown: NOQX's $200k Pre-seed deck
Pitch Deck Teardown: NOQX's $200k Pre-seed deckPitch Deck Teardown: NOQX's $200k Pre-seed deck
Pitch Deck Teardown: NOQX's $200k Pre-seed deck
 
NewBase 19 April 2024 Energy News issue - 1717 by Khaled Al Awadi.pdf
NewBase  19 April  2024  Energy News issue - 1717 by Khaled Al Awadi.pdfNewBase  19 April  2024  Energy News issue - 1717 by Khaled Al Awadi.pdf
NewBase 19 April 2024 Energy News issue - 1717 by Khaled Al Awadi.pdf
 
Islamabad Escorts | Call 03274100048 | Escort Service in Islamabad
Islamabad Escorts | Call 03274100048 | Escort Service in IslamabadIslamabad Escorts | Call 03274100048 | Escort Service in Islamabad
Islamabad Escorts | Call 03274100048 | Escort Service in Islamabad
 
Global Scenario On Sustainable and Resilient Coconut Industry by Dr. Jelfina...
Global Scenario On Sustainable  and Resilient Coconut Industry by Dr. Jelfina...Global Scenario On Sustainable  and Resilient Coconut Industry by Dr. Jelfina...
Global Scenario On Sustainable and Resilient Coconut Industry by Dr. Jelfina...
 
Call Girls In Sikandarpur Gurgaon ❤️8860477959_Russian 100% Genuine Escorts I...
Call Girls In Sikandarpur Gurgaon ❤️8860477959_Russian 100% Genuine Escorts I...Call Girls In Sikandarpur Gurgaon ❤️8860477959_Russian 100% Genuine Escorts I...
Call Girls In Sikandarpur Gurgaon ❤️8860477959_Russian 100% Genuine Escorts I...
 
/:Call Girls In Indirapuram Ghaziabad ➥9990211544 Independent Best Escorts In...
/:Call Girls In Indirapuram Ghaziabad ➥9990211544 Independent Best Escorts In.../:Call Girls In Indirapuram Ghaziabad ➥9990211544 Independent Best Escorts In...
/:Call Girls In Indirapuram Ghaziabad ➥9990211544 Independent Best Escorts In...
 

Kentucky Small Business Profile

  • 1. R Kentucky novel Small businesses significantly impact Kentucky Small Business Facts Kentucky’s economy. They represent 96.7 percent of all employers and employ 47.8 2010* 2009 2000 percent of the private-sector labor force. Small Number of Businesses businesses are crucial to the fiscal condition of Small employers (<500 employees) 67,248 67,300 70,087 the state and numbered 339,703 in 2010. Large employers (500+ employees) 2,324 2,306 2,213 This profile uses the latest available data to Nonemployers 272,455 271,015 226,193 illustrate the status of Kentucky’s small Level in 2007* (000) businesses. (Note that a small business is Firms Employment Receipts($M) defined as one with fewer than 500 employees.) Business Owner Demographics • Kentucky’s economy was strong in 2011, Male-owned 174 502 92,330 with real gross state product increasing 3.4 Woman-owned 86 89 10,608 percent and private-sector employment Equally male/female-owned 66 99 13,243 increasing 1.4 percent (Bureau of Economic African American-owned 10 10 772 Analysis, Bureau of Labor Statistics). Asian-owned 6 17 1,897 • Small businesses employed 696,652 workers Hispanic-owned 4 7 813 in 2010 (Table 1) with most of the employment Native American/Alaskan-owned 1 n.a. n.a. coming from firms with 20-499 employees. Hawaiian/Pacific Islander-owned - - - • The employment situation from 2007-2010 Veteran-owned 49 106 19,237 was weak, and small businesses in Kentucky Publicly held, unclassified 11 796 267,599 had a net job loss (Table 2). The unemployment Level in % Change from rate in 2010-2011decreased by 0.7 percent. 2011* 2010 2000 • Most of Kentucky’s small businesses are very Workforce (Thousands) small as 79.7 percent of all businesses have no Private-sector employment 1,461 1.4 -3.9 employees, and most employers have fewer than Government employment 330 -0.2 7.2 20 employees. Self-employed (incorp. & uninc.) 177 -2.8 -7.9 • In 2011, the number of opening Female self-employment 63 9.5 11.7 establishments was lower than closing Male self-employment 114 -8.5 -16.1 establishments, and the net employment change Minority self-employment 9 -13.0 -37.6 from this turnover was positive (Table 3). Veteran self-employment 17 -15.3 -20.5 • Self-employment in Kentucky declined over Unemployment Rate (Percent) 9.5 -0.7† 5.3† the last decade. Female self-employment fared the best compared with other demographic Business Turnover Quarterly establishment openings 16,230 9.2 17.5 groups. Quarterly establishment closings 16,340 4.7 22.2 For Further Information Business bankruptcies 480 -9.4 35.2 • Data on all states and territories are available 2011* 2010 2000 at www.sba.gov/advocacy/848. • For other small business data and analysis, Income and Finance visit www.sba.gov/advocacy/847, call (202) Proprietors’ income ($billion) 8.3 7.6 9.4 205-6533, or email advocacy@sba.gov. Number of bank branches 1,808 1,827 1,617 • Visit www.sba.gov/updates to subscribe to No. of bus. loans under $100,000‡ 27,678 37,024 42,978 Advocacy’s Listservs. Total value of business loans under 552 560 621 $100,000 ($million)‡ Source: U.S. Dept. of Commerce, Census Bureau, Bureau of Economic Analysis; U.S. Dept. of Labor, Bureau of Labor Statistics; Admin. Office of the U.S. Courts; Federal Deposit Insurance Corporation; and U.S. Small Business Admin., Office of Advocacy. * Latest available data. †Percentage point change. ‡Data are for CRA loans. Small Business Profile: Kentucky, Page 1 Published in February 2013 by the U.S. Small Business Administration, Office of Advocacy
  • 2. Table 1: Firms and Employment in Kentucky by Industry and Firm Size, 2010 (Nonfarm, Thousands) Employer Firms Employment Nonemployer All Firms 1-19 1-499 All Firms 1-19 1-499 Industry Firms Total Employees Employees Total Employees Employees Total 272.5 69.6 58.9 67.2 1,456.8 258.3 696.7 Forestry, etc. and agriculture support 4.9 0.2 0.2 0.2 1.9 0.8 1.8 Mining 1.8 0.5 0.3 0.5 21.2 1.8 8.6 Utilities 0.2 0.1 0.1 0.1 8.3 0.3 2.5 Construction 41.4 7.7 7.0 7.6 64.3 27.5 59.4 Manufacturing 3.6 3.4 2.1 3.0 203.0 12.3 71.8 Wholesale trade 4.2 3.5 2.5 3.1 67.9 11.5 36.9 Retail trade 27.1 9.9 8.6 9.6 217.7 40.9 80.6 Transportation and warehousing 13.0 2.5 1.9 2.2 79.9 7.6 19.6 Information 2.6 0.8 0.5 0.7 31.8 2.5 8.6 Finance and insurance 7.3 3.1 2.5 2.9 66.8 8.9 26.5 Real estate and rental and leasing 26.2 2.8 2.6 2.7 18.0 7.6 12.7 Professional, scientific, and technical svcs. 27.8 7.5 6.8 7.3 65.5 23.7 45.0 Management of companies and enterprises 0.0 0.4 0.1 0.3 25.4 0.2 3.6 Admin., support, waste mgt., remed. svcs. 28.0 3.4 2.8 3.2 82.0 10.6 33.1 Educational services 5.3 0.7 0.6 0.7 27.9 2.8 15.8 Health care and social assistance 17.7 8.1 6.8 7.9 241.4 37.2 110.2 Arts, entertainment, and recreation 11.3 1.2 1.0 1.2 17.0 4.7 13.8 Accommodation and food services 3.3 5.4 3.8 5.2 150.6 24.0 91.2 Other services (except public admin.) 46.8 8.9 8.2 8.8 65.7 33.0 54.3 Unclassified 0.0 0.7 0.7 0.7 0.4 0.4 0.4 Source: U.S. Dept. of Commerce, Bureau of the Census, Statistics of U.S. Businesses. (See www.sba.gov/advocacy/849/12162 for data from other years, and for starts, closures, job creation and destruction by industry and by size category.) Table 2: Net Job Change by Firm Size, 2007–2010 (Nonfarm) Total Net Employment Size of Firm New Jobs 1-4 5-9 10-19 20-99 100-499 <500 500+ 2010 -17,061 7,641 214 -1,468 -8,234 -7,742 -9,589 -7,472 2009 -71,854 5,129 -4,215 -6,837 -15,595 -17,352 -38,870 -32,984 2008 21,939 7,051 -1,449 -3,652 -2,348 553 155 21,784 2007 8,612 9,046 550 -1,565 -163 -878 6,990 1,622 Note: Data source differs from previous publications. Source: U.S. Dept. of Commerce, Bureau of the Census, Business Dynamic Statistics. (For more detailed data see www.sba.gov/advocacy/849/12162.) Table 3: Establishment and Employment Turnover by Quarter, 2011 (Nonfarm, Thousands) Establishments Employment Quarter 1 Quarter 2 Quarter 3 Quarter 4 Quarter 1 Quarter 2 Quarter 3 Quarter 4 Openings 3.4 4.2 4.4 4.3 12.2 14.3 14.6 13.0 Expansions 19.1 18.8 19.0 18.8 68.9 72.4 74.1 74.2 Contractions 19.0 19.1 19.0 19.1 70.8 66.6 67.9 68.2 Closings 4.2 4.5 3.7 4.0 12.6 13.7 10.5 13.5 Source: U.S. Dept. of Labor, Bureau of Labor Statistics, Business Employment Dynamics. (For more detailed data see www.bls.gov/bdm/.) Note: These figures contain all firm sizes; Census data from 2010 show that 87 percent of establishment births and deaths were in firms with fewer than 500 employees. Small Business Profile: Kentucky, Page 2 Published in Feb. 2013 by the U.S. Small Business Administration, Office of Advocacy