Download as PDF, PPTX
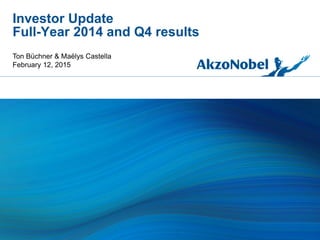

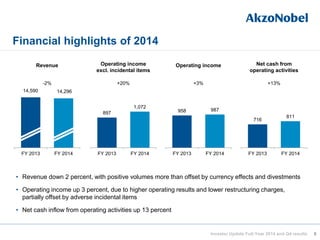
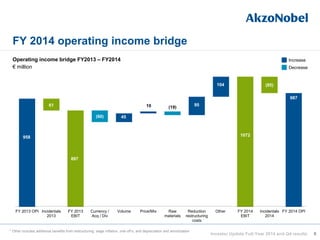
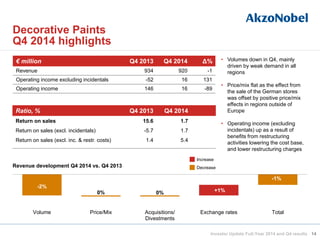
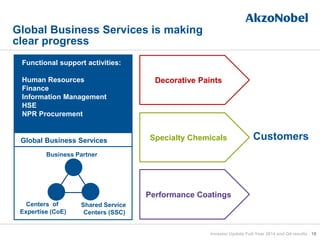
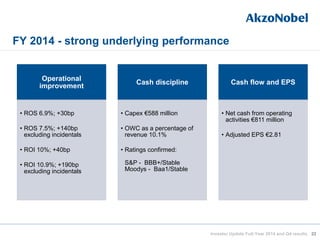
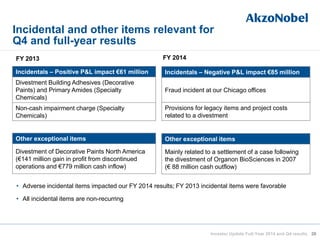
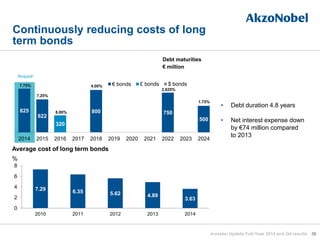
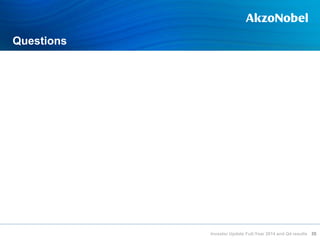
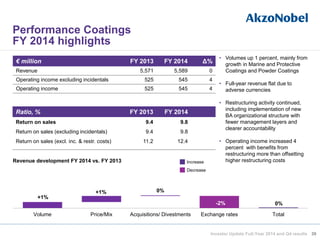
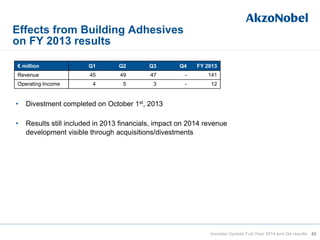
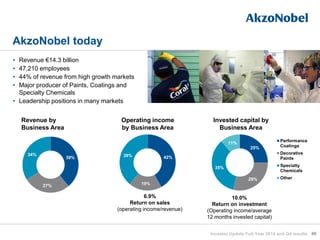
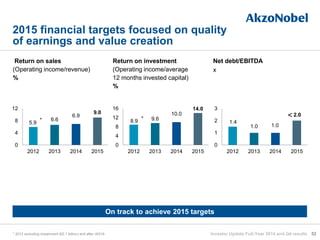
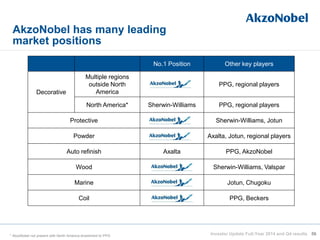
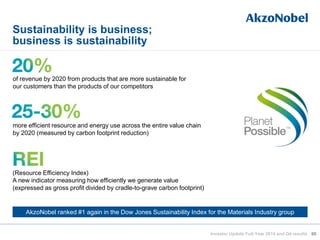
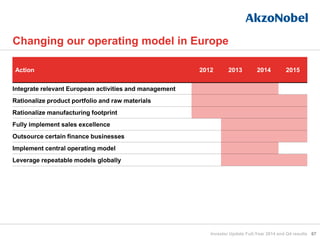
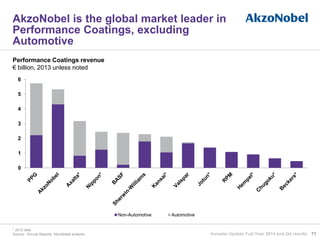
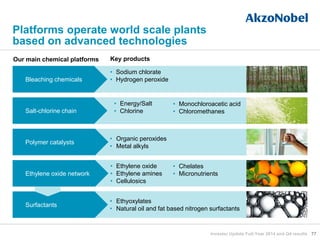
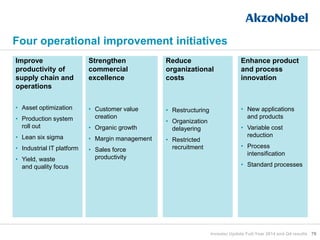
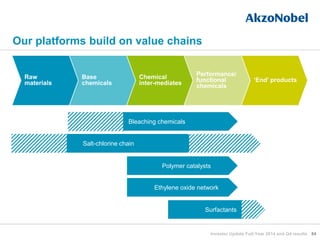
![The majority of global manufacturing
output is still anticipating expansion
11
*Bubble size=manufacturing output, 2015e (US$bn: 2010 prices)
Sources: Oxford Economics, HSBC [China], Markit [US], Swedbank (Sweden)
Purchase Managers’ Index (PMI)*
January 2015
Investor Update Full-Year 2014 and Q4 results
Russia
France China
Brazil
Germany
Japan India
US
Spain Sweden
40
50
60
ManufacturingPMI](https://image.slidesharecdn.com/akzonobelinvestorupdateq42014final-150212034540-conversion-gate01/85/AkzoNobel-Q4-and-full-year-2014-results-Investor-Update-Presentation-11-320.jpg)
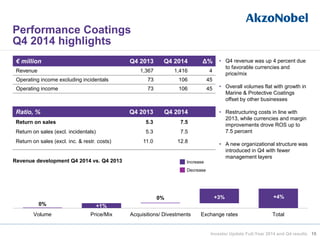
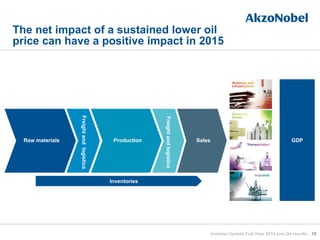
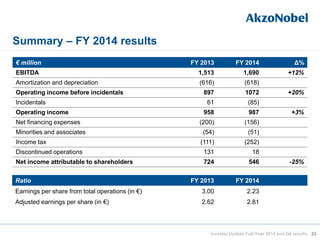
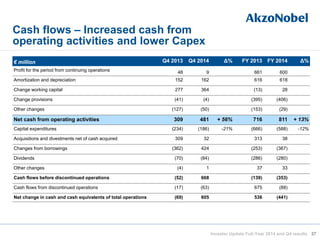

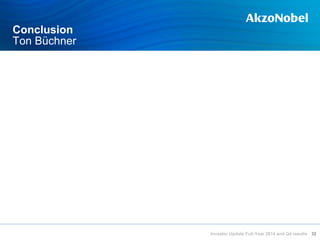
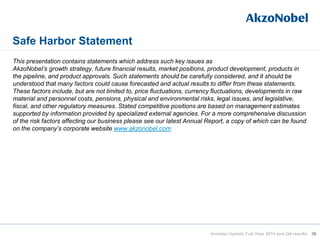
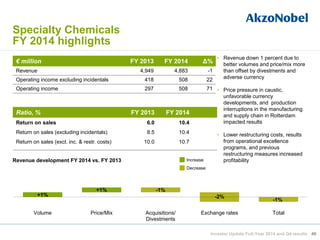
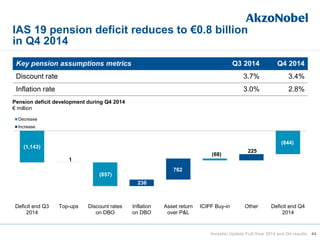

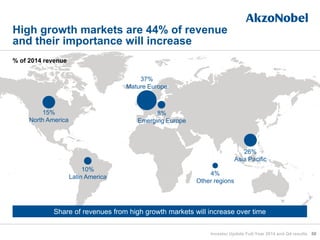
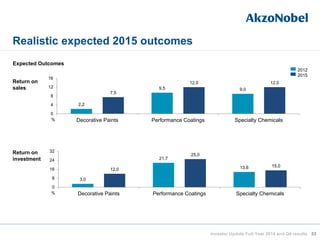
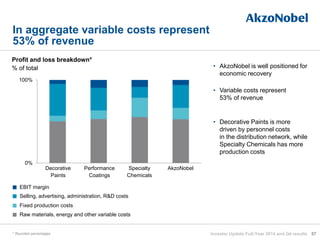

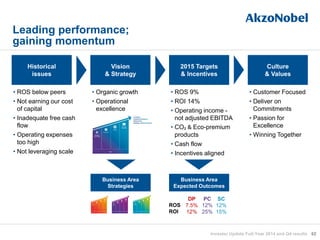


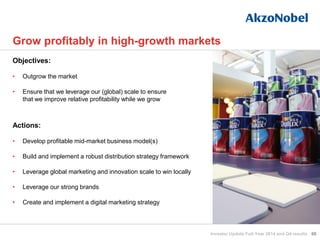
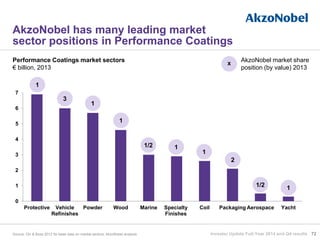
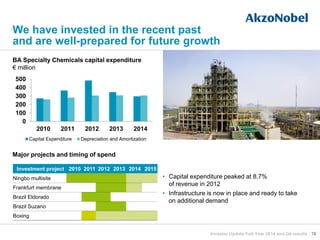

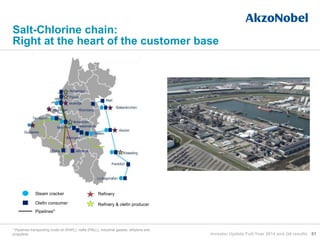
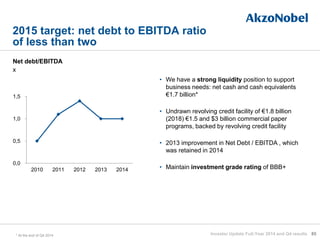
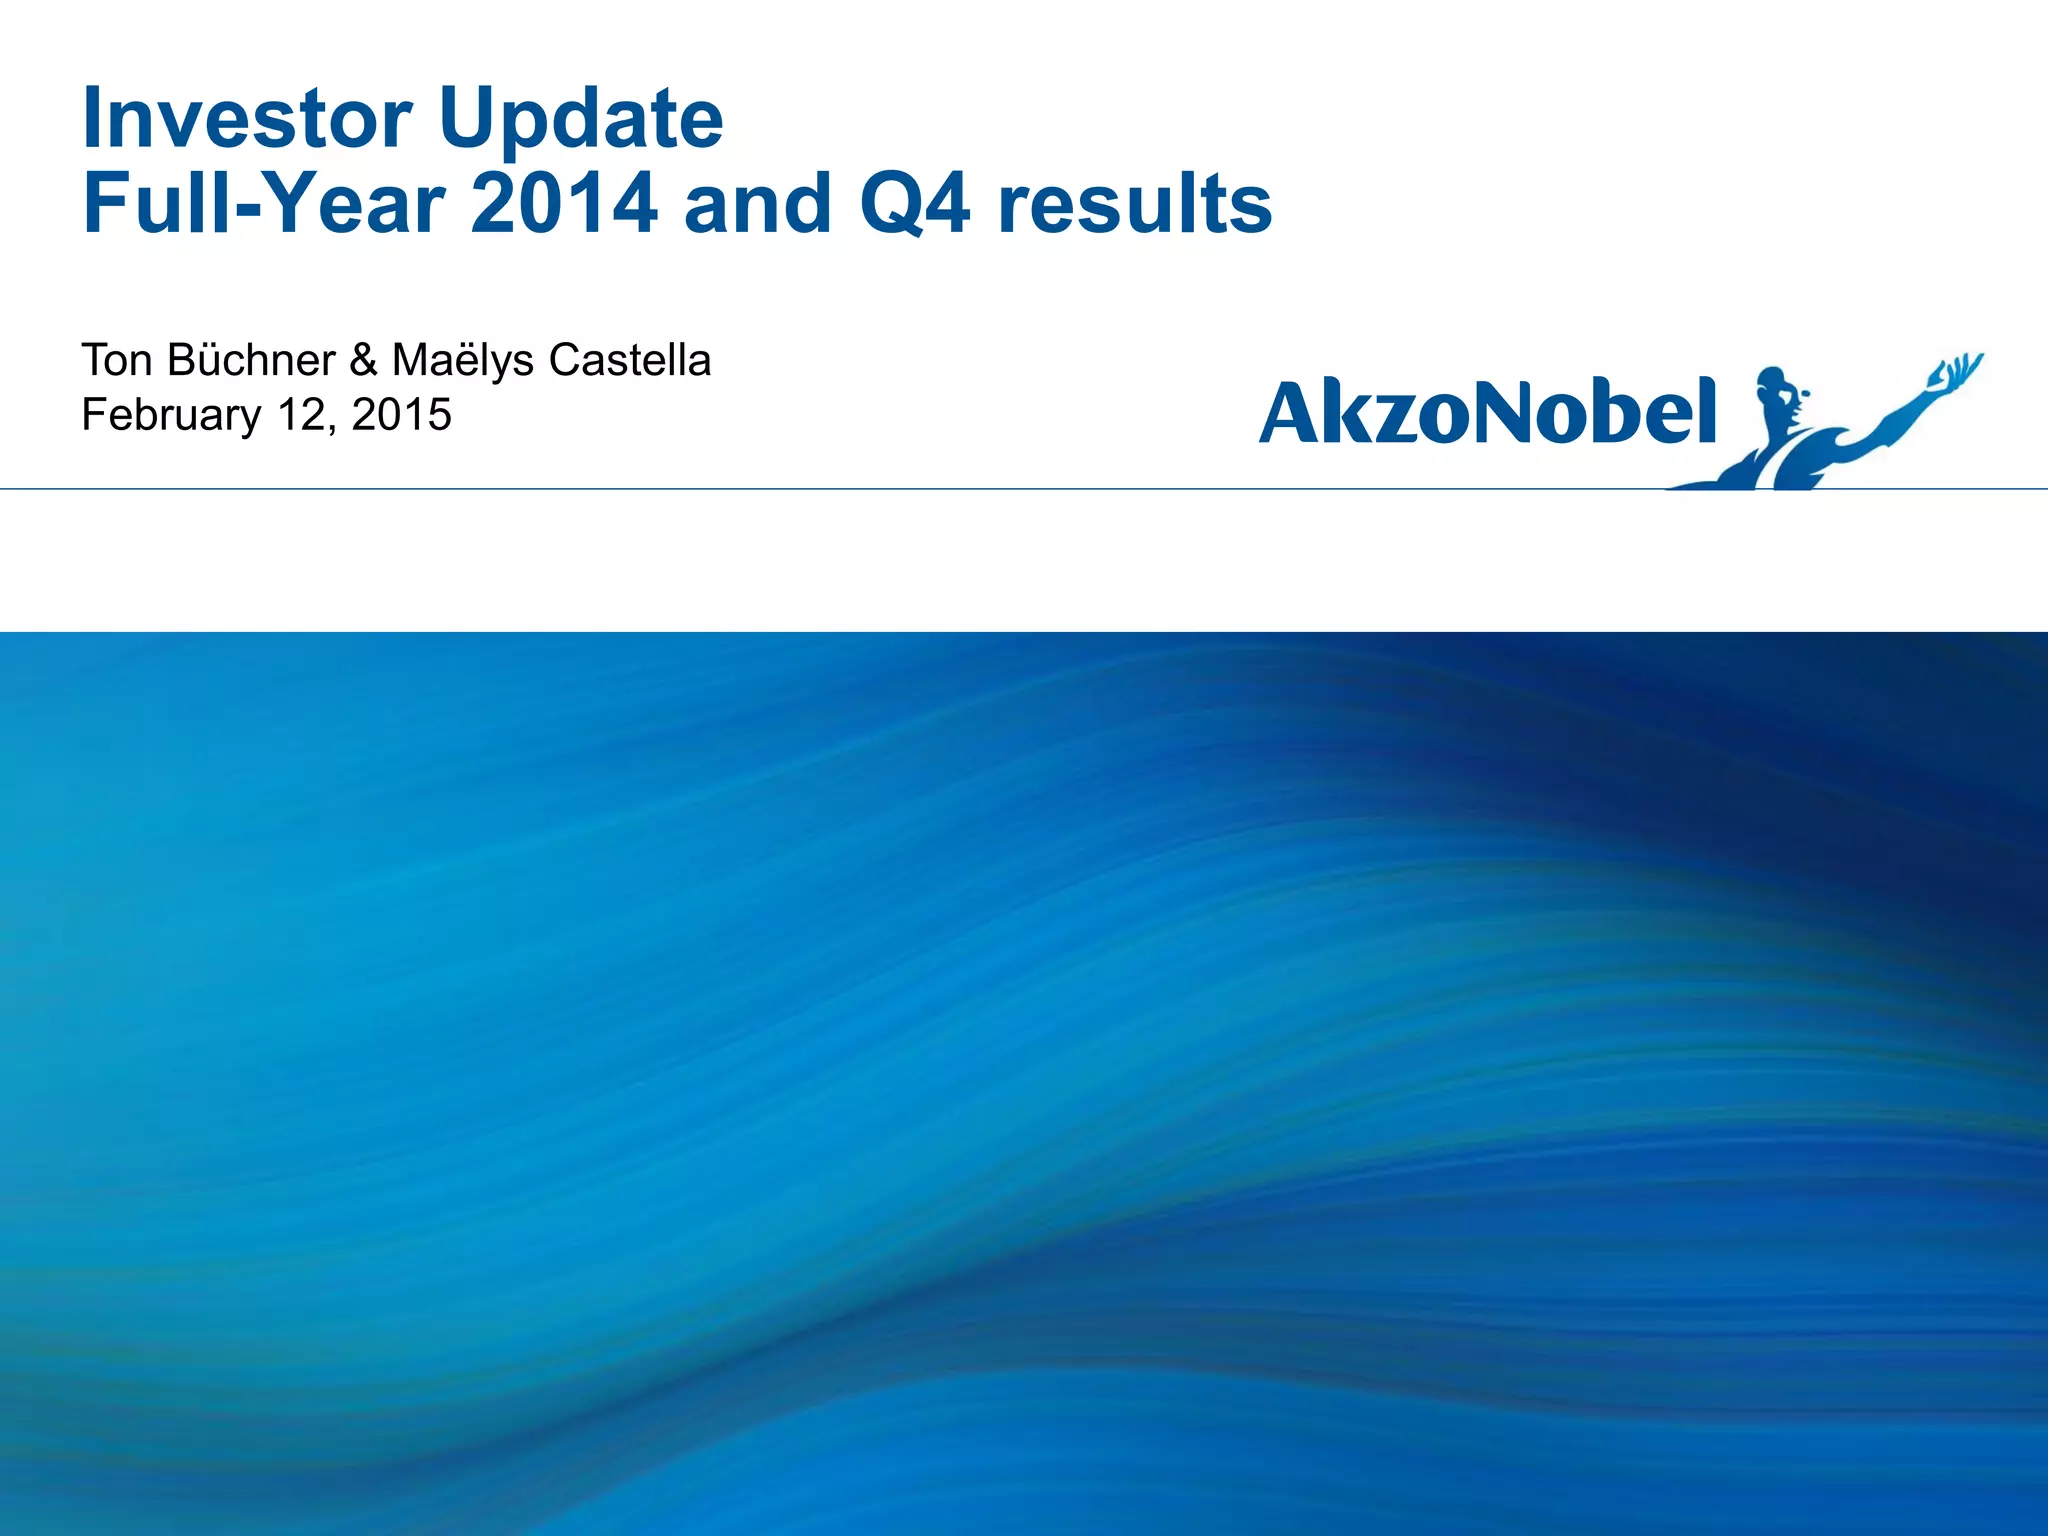
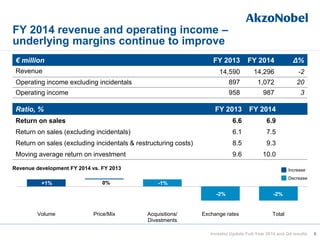
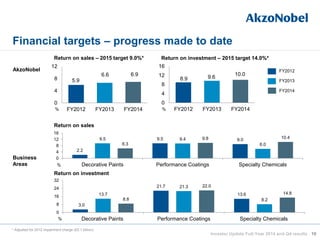
![Pension cash flow guidance
87
• Top-ups relate mainly to the 2 big UK plans, the ICI Pension Fund and the CPS
Pension Scheme
• Top-ups are based on prudent actuarial valuation of liabilities, which differs from
accounting liability
• Actuarial pension deficit of the 2 big UK plans is estimated at €1.5-2 billion
• The next triennial funding review for the ICI Pension Fund is expected to be
completed in 2015 and in 2016 for the CPS Scheme
• The forward looking estimates make no allowance for changes in the funded
status at future actuarial valuations or for additional contributions to de-risking
such as the 2013 MetLife transaction in the US
• As a result of the 2014 buy-in transactions an additional one-off payment
of £125 million (€160 million) will likely be added at the end of the top-up
schedule as part of the next valuation
Defined benefit pension cash top-ups
[Status February 2013]
€ million
2014 actual 300
2015 -17 est.* ~330/year
2018 est.* ~100
* Based upon currently agreed deficit contribution schedules for the UK plans
Regular contributions
€ million 2015 estimated
Defined benefit 100
Defined contribution 140
Investor Update Full-Year 2014 and Q4 results](https://image.slidesharecdn.com/akzonobelinvestorupdateq42014final-150212034540-conversion-gate01/85/AkzoNobel-Q4-and-full-year-2014-results-Investor-Update-Presentation-87-320.jpg)

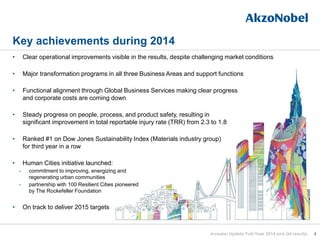
The investor update outlines the financial and operational performance of the company for the year 2014 and Q4 results, highlighting clear operational improvements despite challenging market conditions. Revenue decreased slightly, but operating income rose due to reduced restructuring charges and improved safety measures, while the company aims to meet its targets for 2015. Notable achievements include ranking #1 in the Dow Jones Sustainability Index and launching the Human Cities Initiative, emphasizing commitment to urban community enhancement.


