Download to read offline
![ESREVER MIGRATION
As urban environments become more livable, many corporations are reversing
the suburban flight of 30 years ago. Some examples:
United Airlines
The airline has signed one of the largest leases in Chicago history in the
Willis Tower, leasing 830,000 square feet through 2028.
Sara Lee
In 2005, the company moved out of its 60-year home in Chicago for
Downer’s Grove, a suburb. However, the company has announced that in
2013 it plans to relocate 500–650 employees back to downtown Chicago.
Amazon.com
The online retailer’s new headquarters, totaling 1.7 million square feet in 11
buildings, is located on a Seattle streetcar line, providing direct access to
the city’s airport.
Salesforce.com
announced in 2010 that the company spent more than $270 million to buy
14 acres in San Francisco’s Mission Bay to build a two million-square-foot
headquarters. However, in early 2012 the company abandoned its plans
for building the project, opting to remain in and expand its downtown San
Francisco presence in 3 newly available buildings that would give them
nearly the space of Mission Bay several years before that project would
be ready. According to an article in Forbes, Salesforce CEO Marc Benioff
noted “We can attract extraordinary talent [to San Francisco]. It’s not Silicon
Valley, the flatlands.”
Zappos
is scheduled to move 1,200 employees to downtown Las Vegas in 2013
from suburban Henderson.
Motorola
is moving all of its 3,000 Mobility division employees outside Chicago to
downtown, taking over several top floors of the LEED-certified
AND THE Merchandize Mart.
BUILT ENVIRONMENT
Many fast-growing startups are opting for downtowns, sometimes settling in
sub-prime parts of town. Downtown Internet firms include:
Zynga (San Francisco) • Square (San Francisco) • Tumblr (New York)
Pinterest (Palo Alto) • Twitter (San Francisco)
9 © 2012 GreenBiz Group Inc. (www.greenbizgroup.com). May be reproduced for noncommercial
purposes only, provided credit is given to GreenBiz Group Inc. and includes this copyright notice.](https://image.slidesharecdn.com/vergeandthebuiltenvironmentreport-121030161347-phpapp02/75/Verge-and-the-built-environment-report-9-2048.jpg)
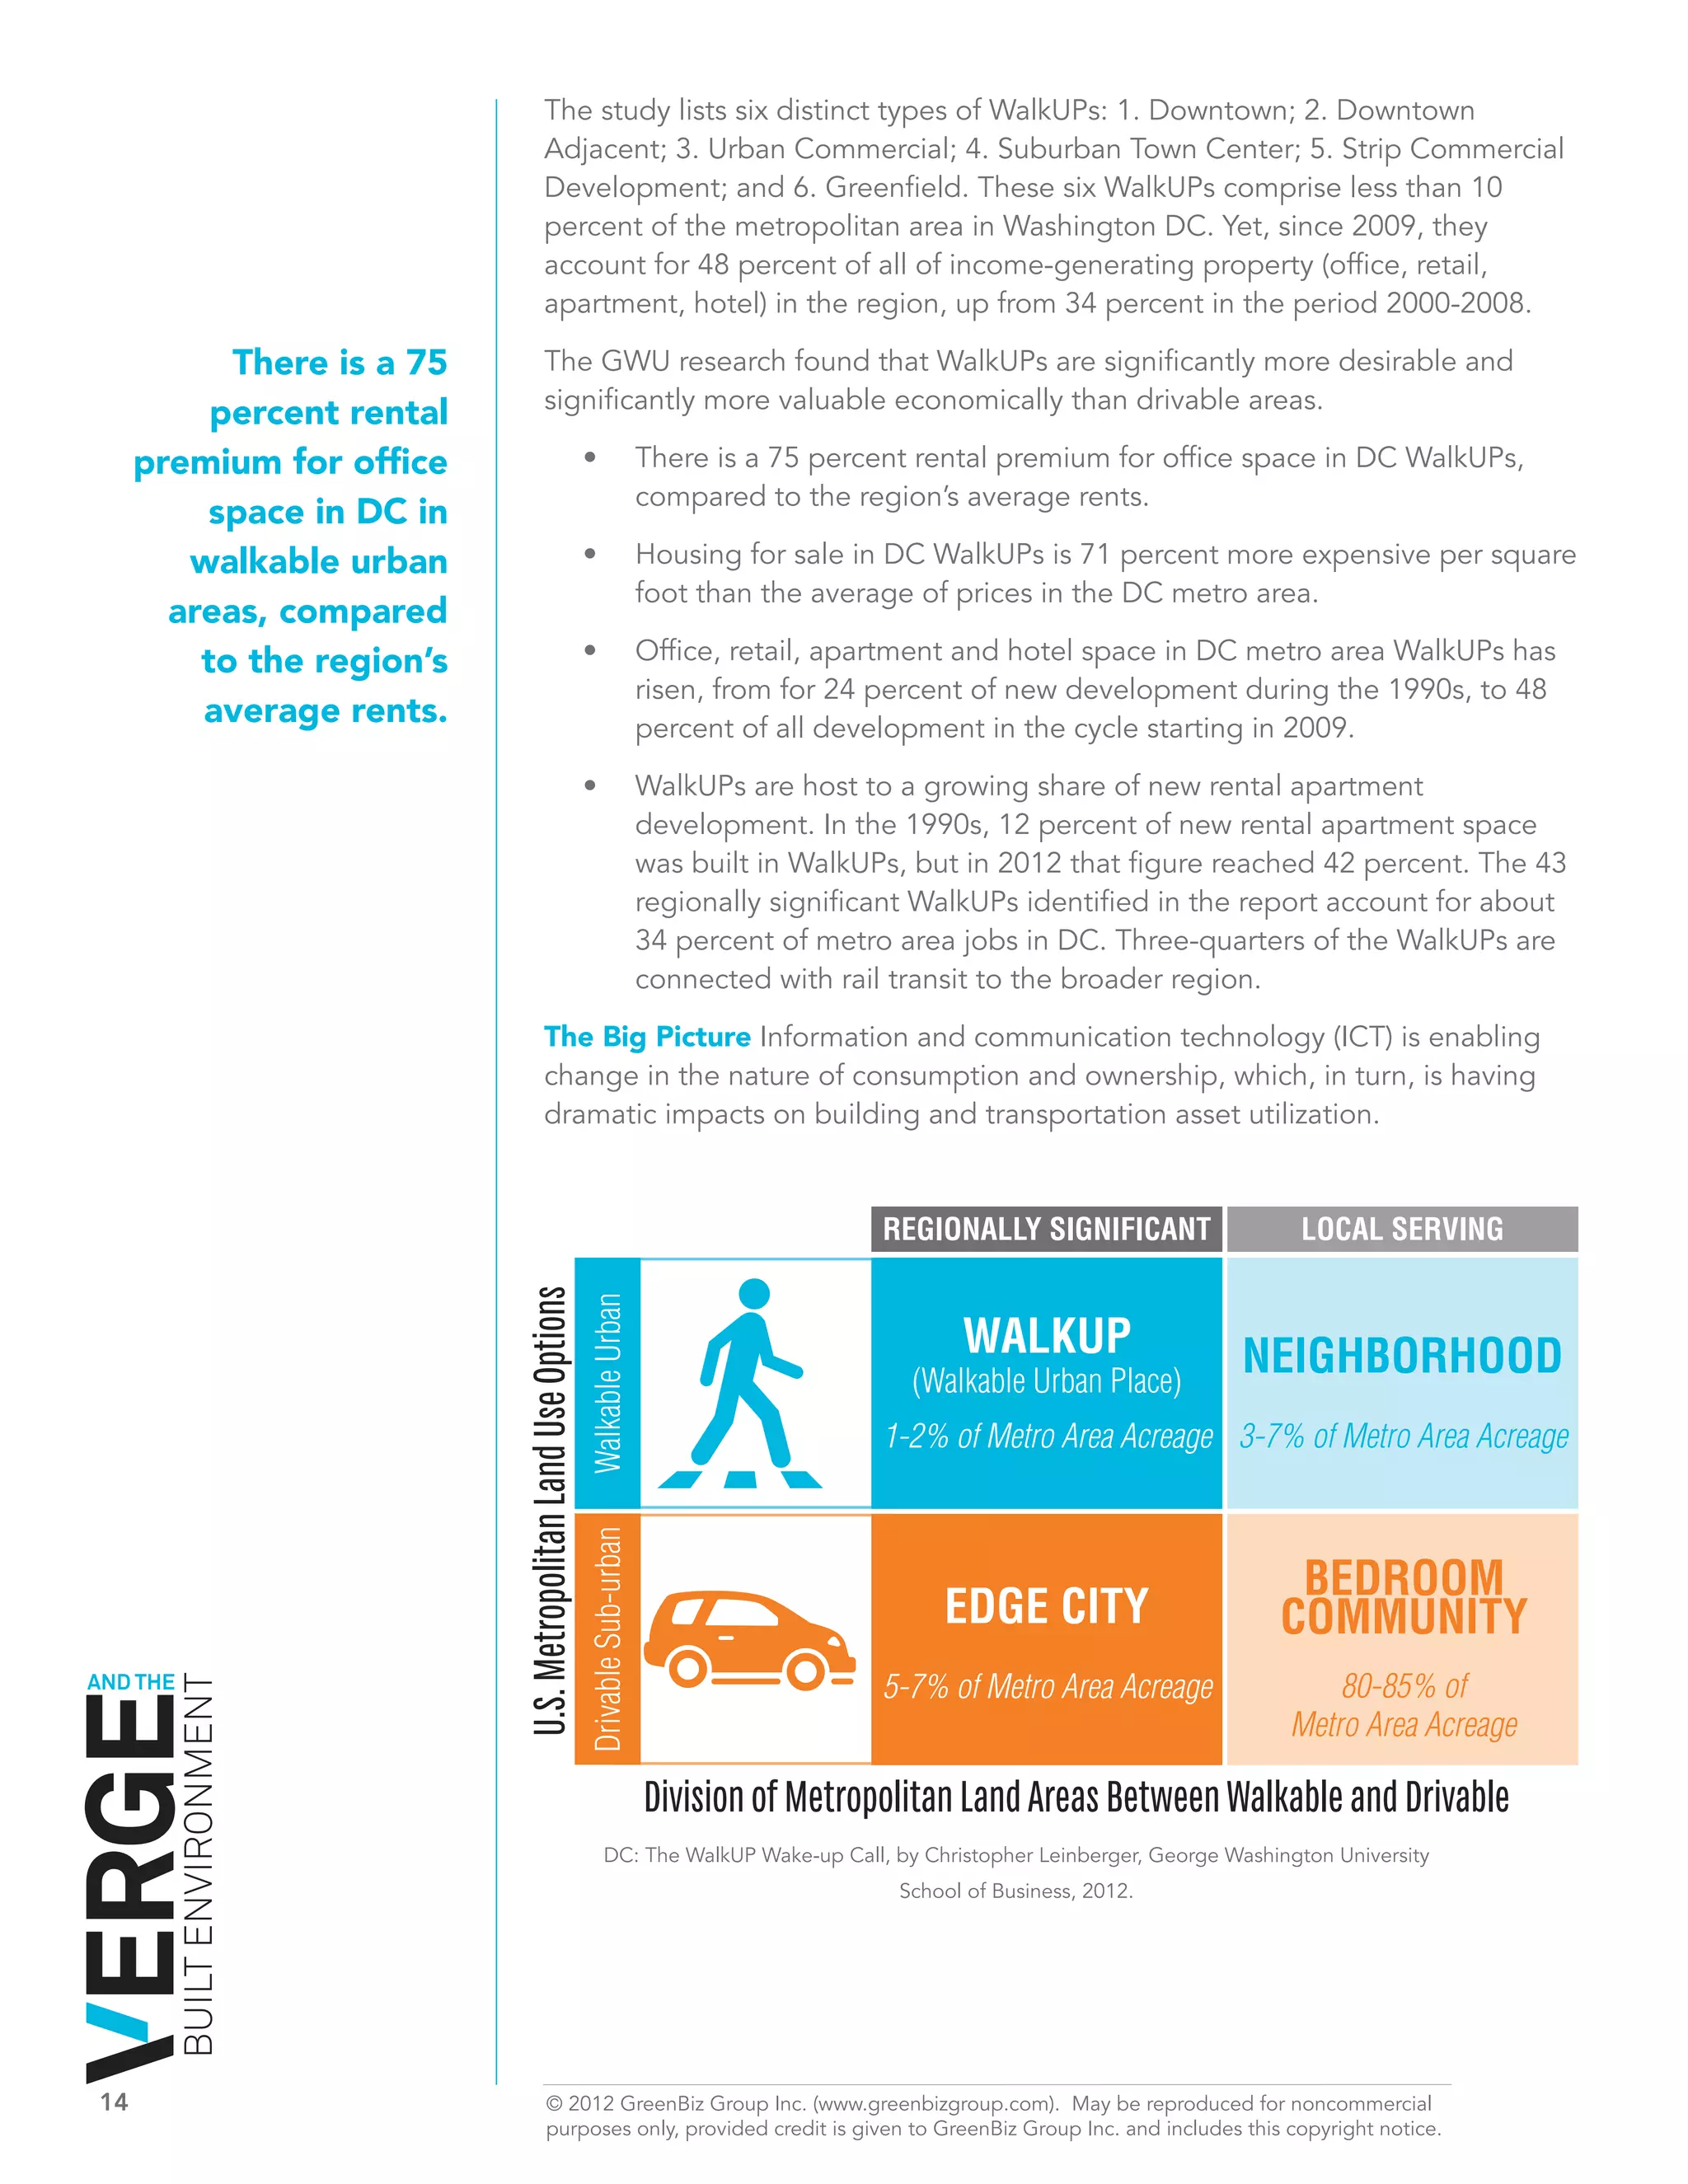

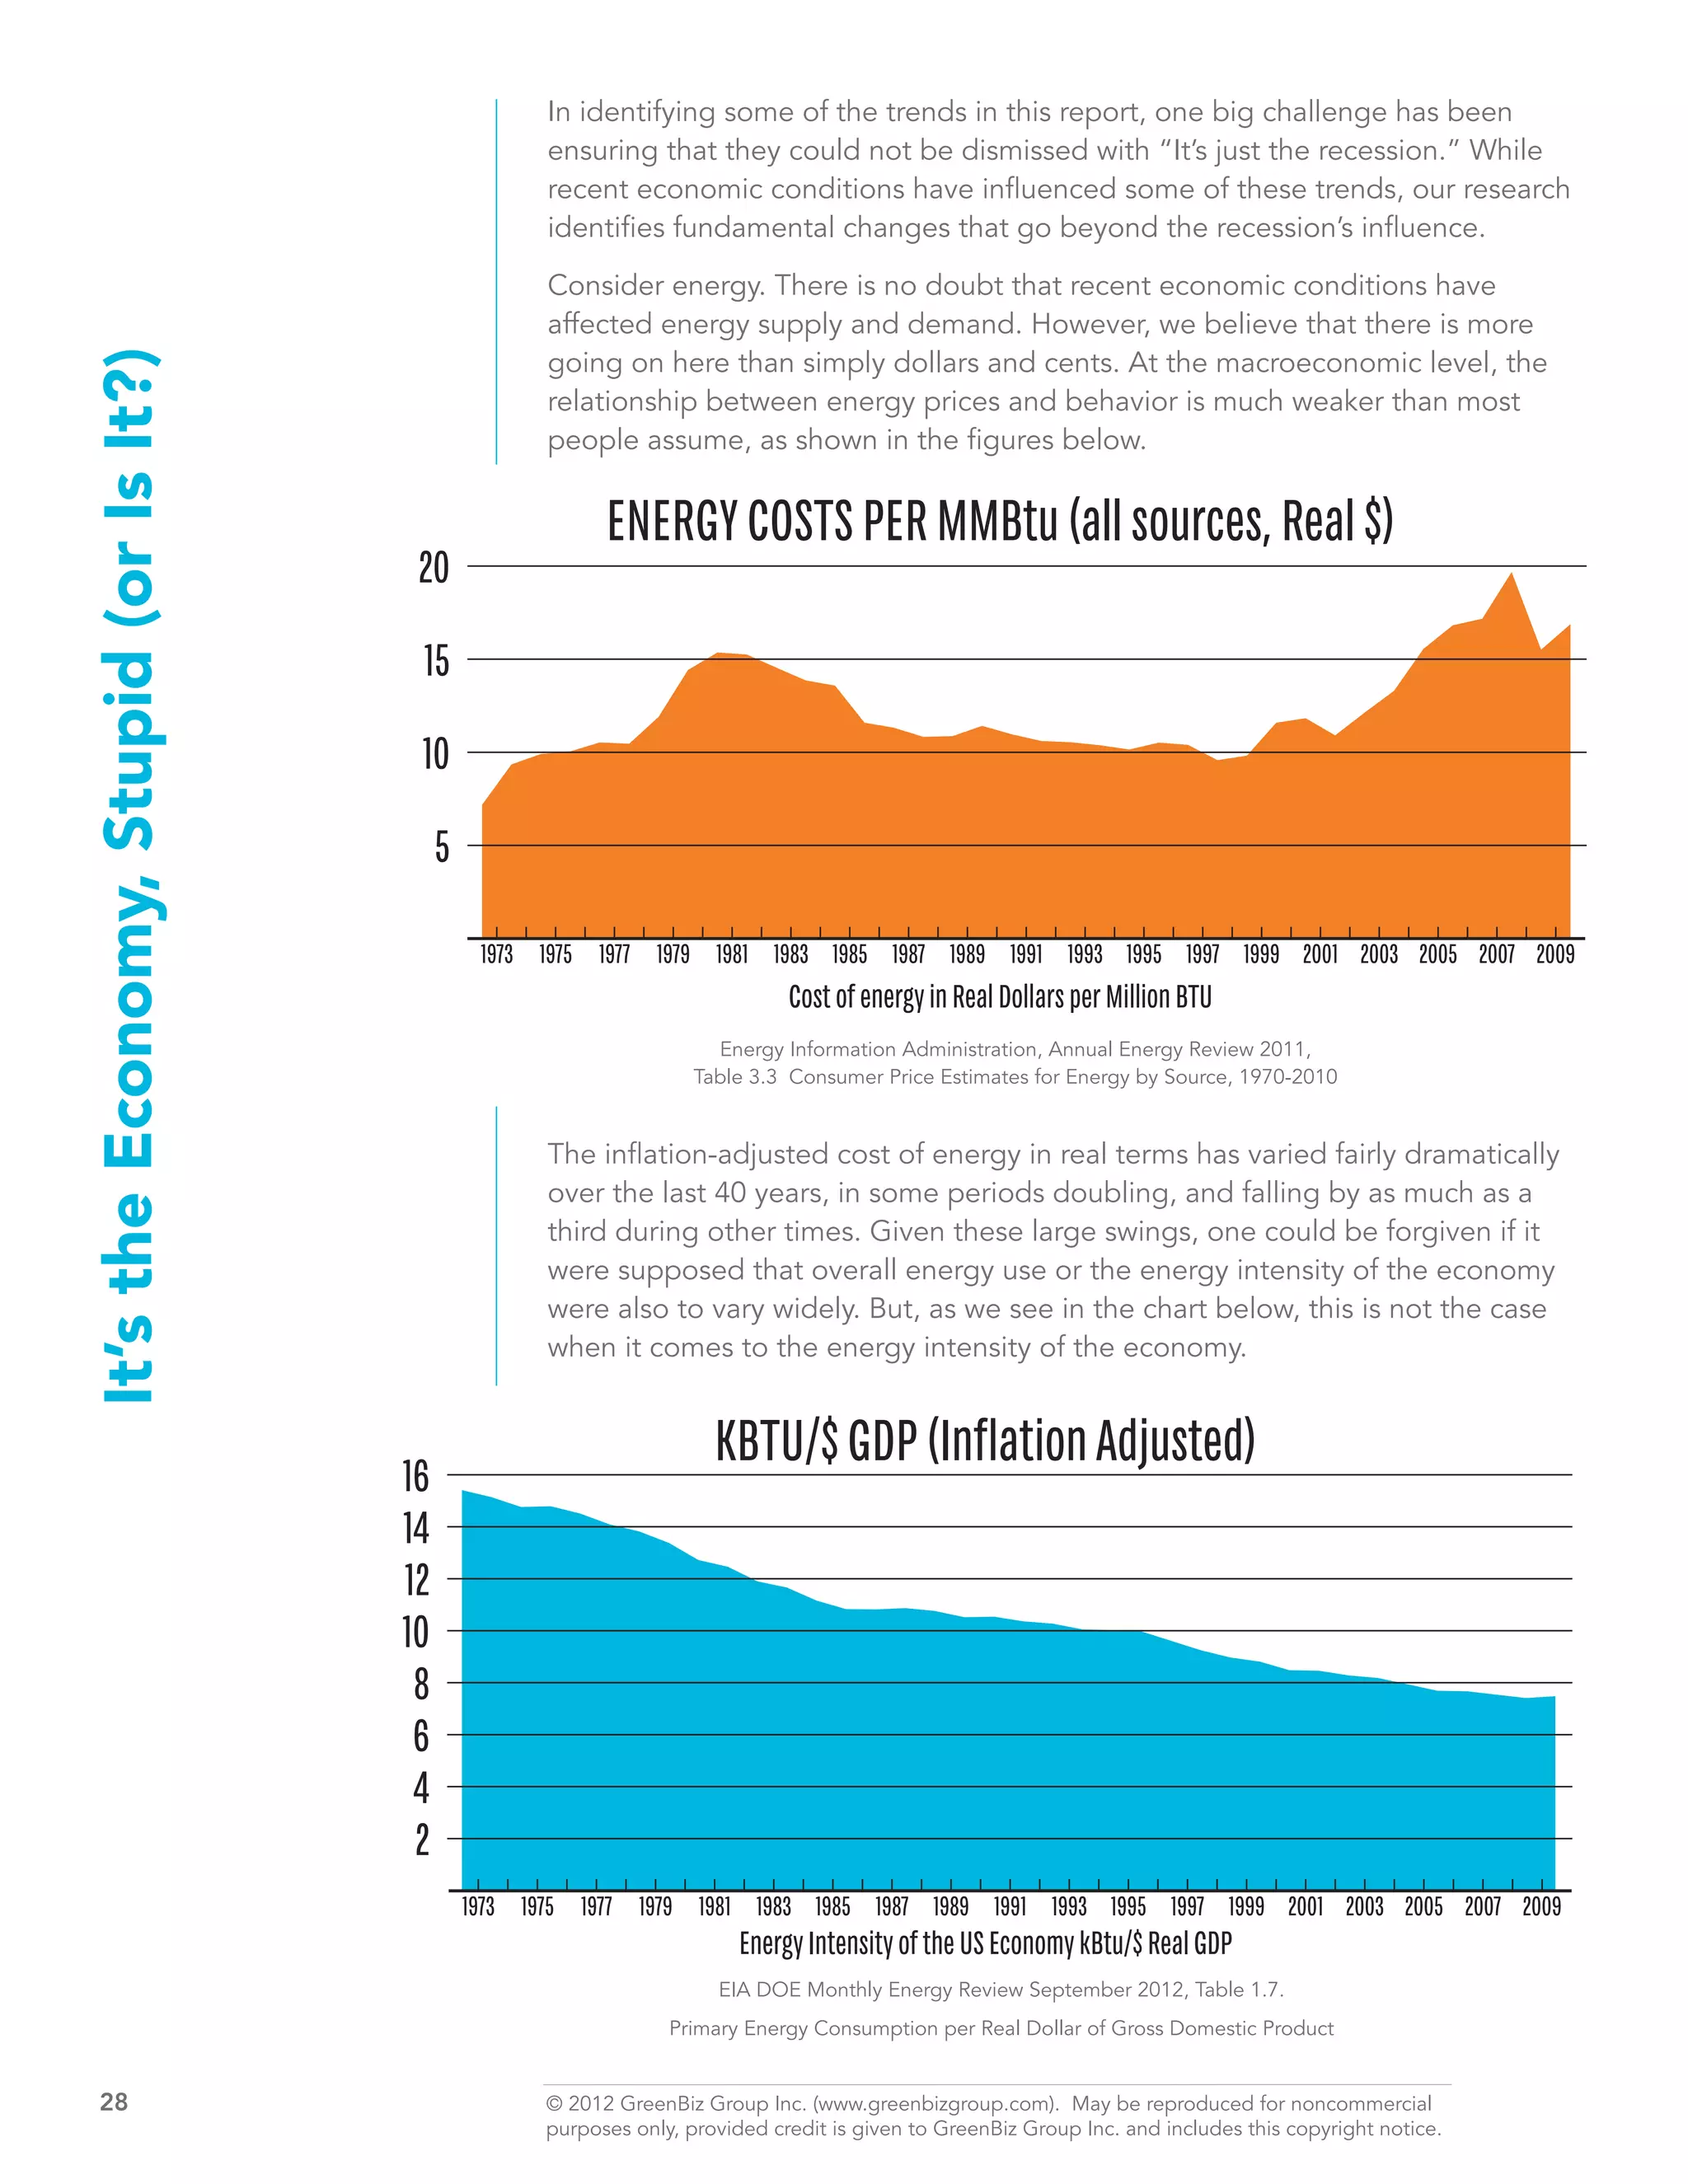

The report discusses the convergence of four key technologies—energy, information, buildings, and transportation—creating significant opportunities for sustainability in the built environment. It highlights trends such as reduced energy consumption per dollar of GDP, a decline in building sizes, and increased asset utilization driven by economic pressures and changing demographics. The shift towards greater connectivity and ICT is facilitating smarter, more efficient buildings and urban spaces, with implications for corporate real estate and telecommuting practices.


![[Challenge:Future] Abundant future](https://cdn.slidesharecdn.com/ss_thumbnails/challengefuture-abundant-future3327-130228020400-phpapp02-thumbnail.jpg?width=640&height=640&fit=bounds)


