Downloaded 20 times
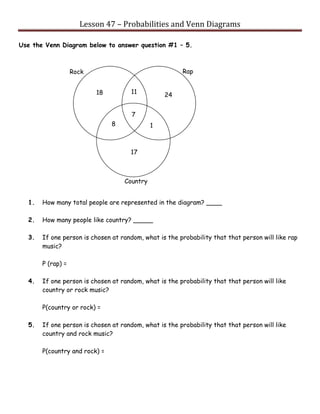
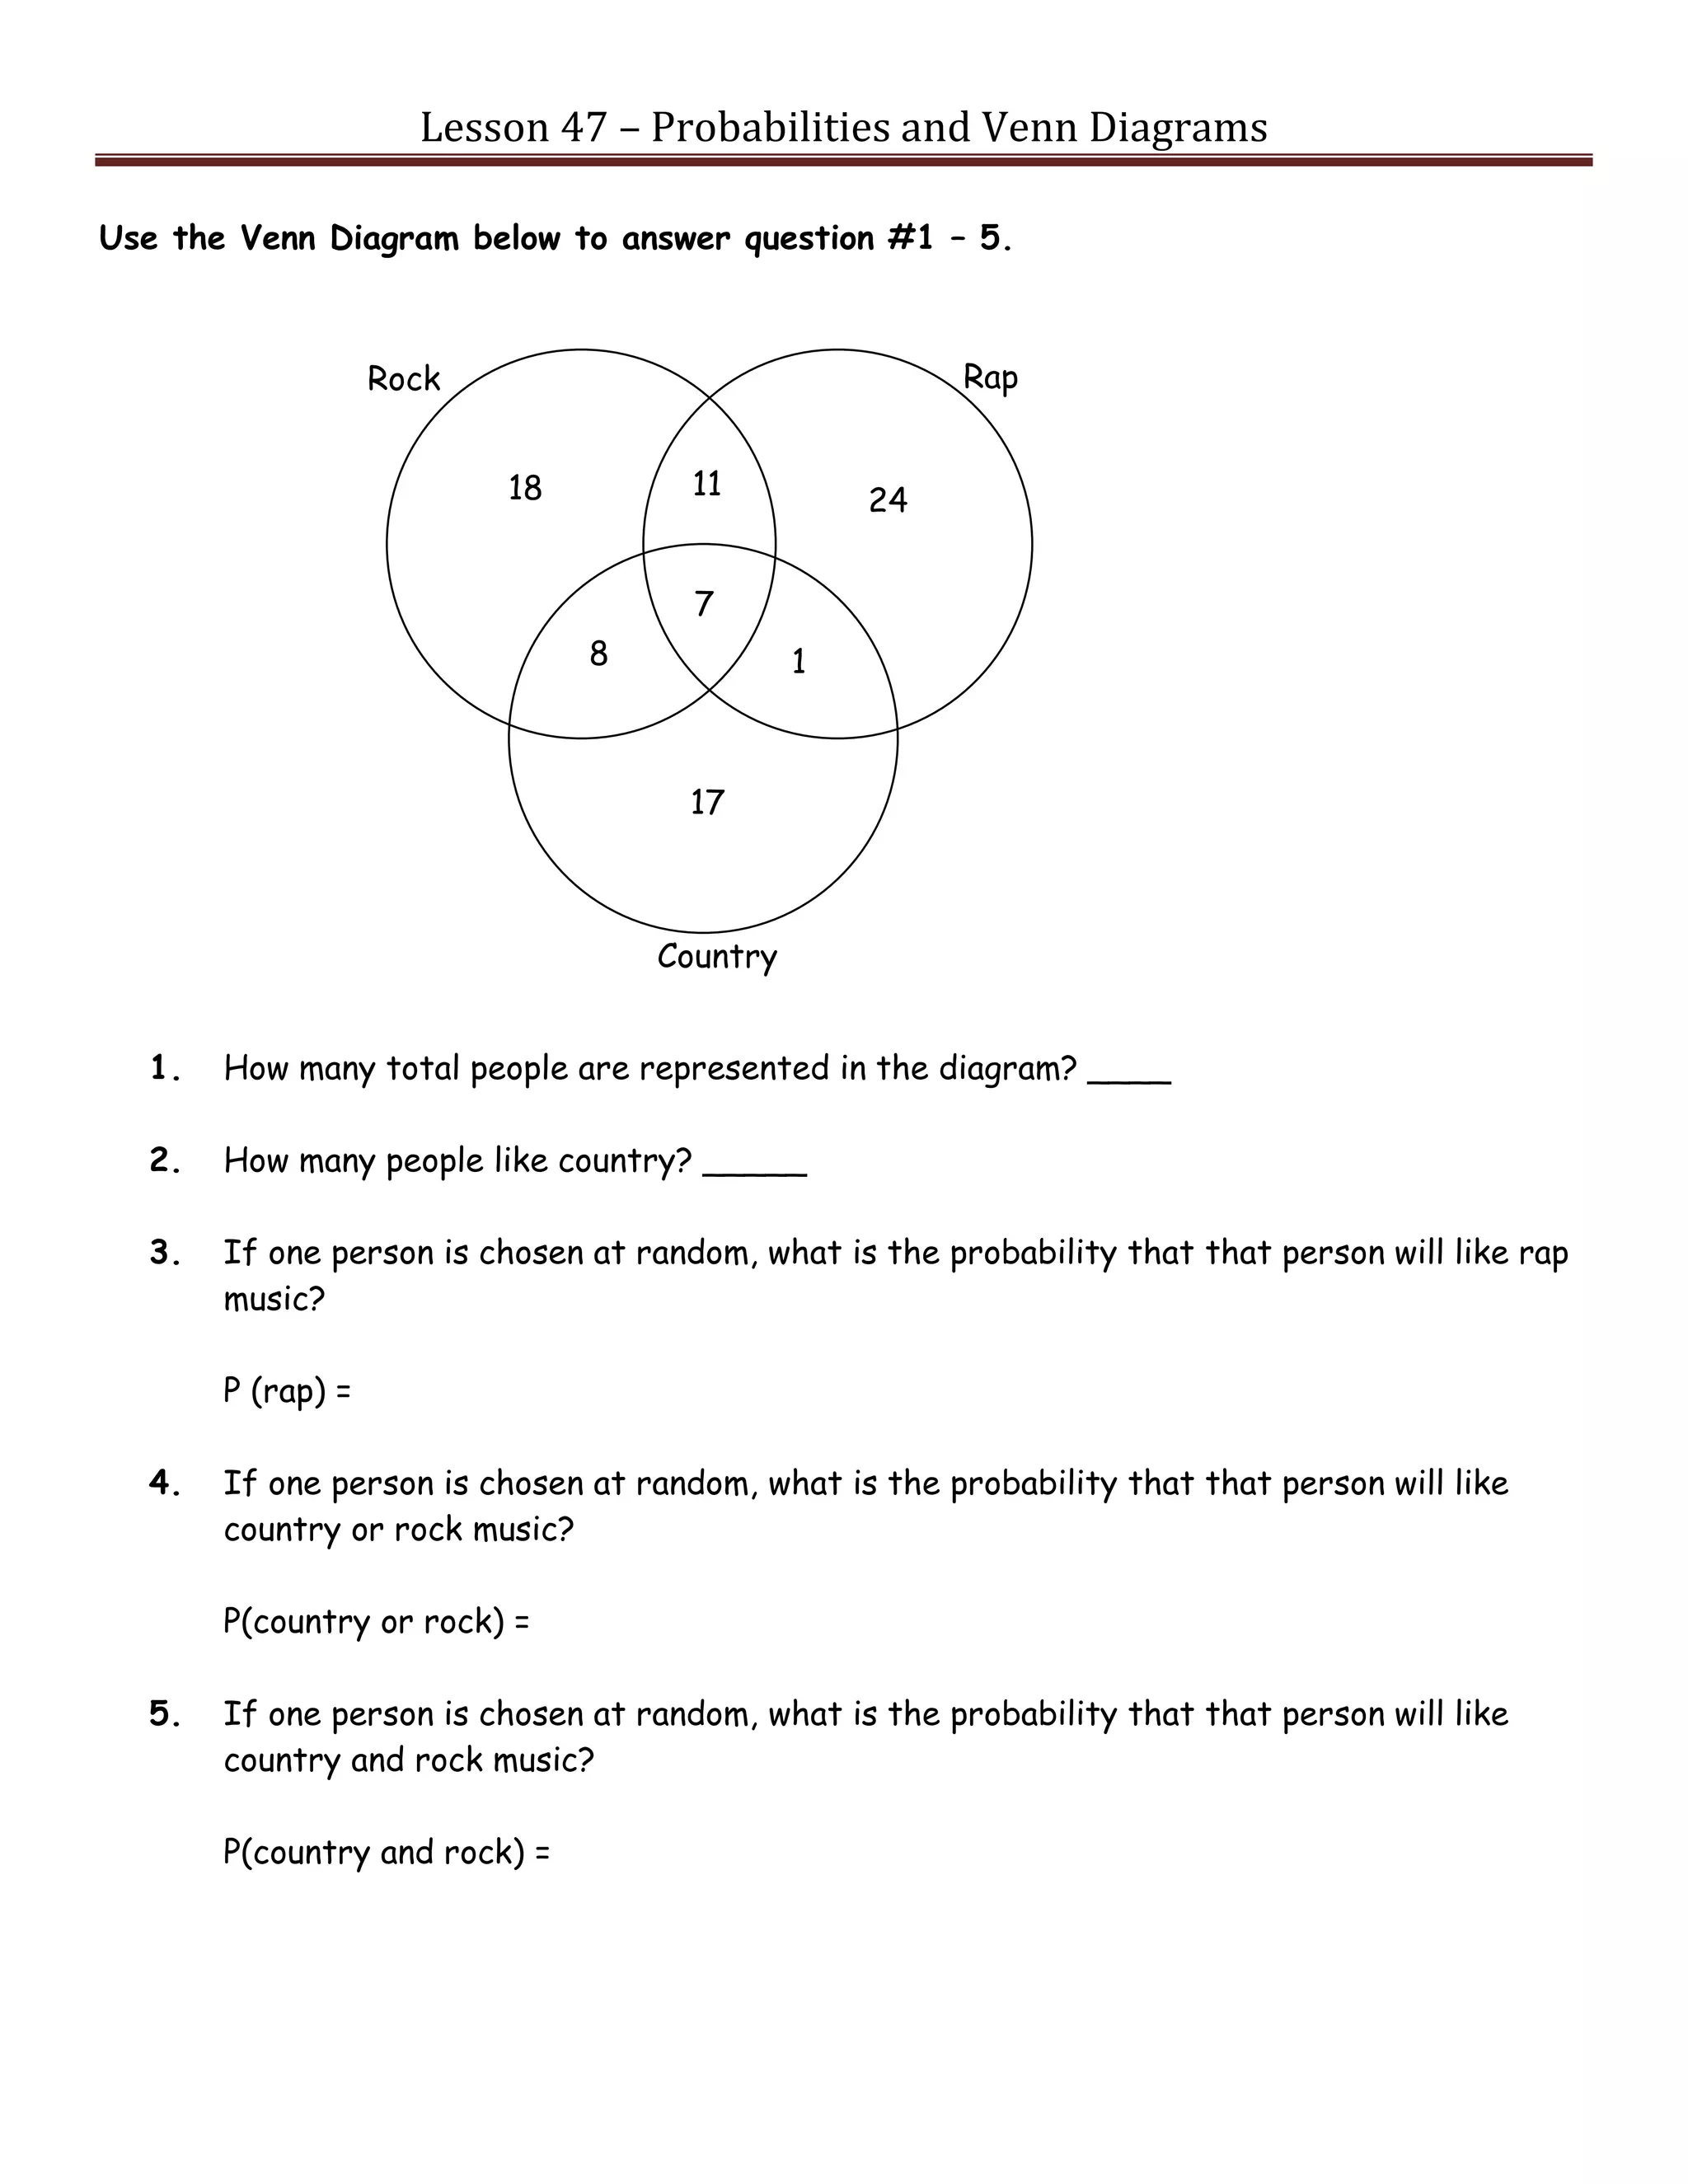
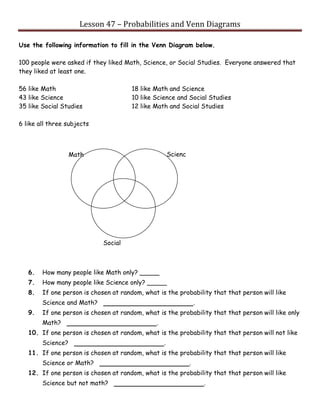

This document contains examples of using Venn diagrams and calculating probabilities from survey data. It includes 5 practice problems with Venn diagrams representing survey results on teacher issues, college student course enrollment, children's attributes, job offers, and employment rates. Participants are asked to determine probabilities based on the data, such as the likelihood of a randomly selected teacher experiencing only one issue or a couple both being employed. The document provides lessons on using Venn diagrams to visualize sample spaces and calculate probabilities.