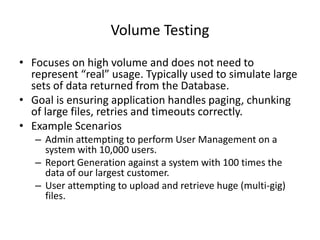
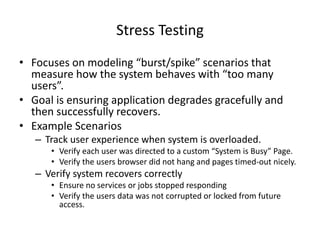
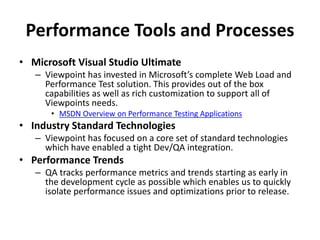
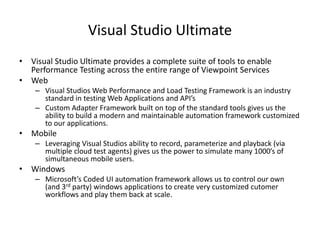
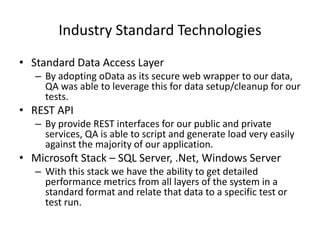
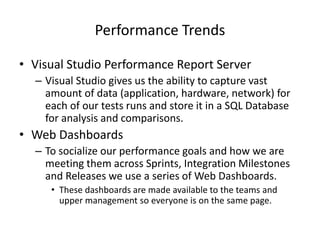
Viewpoint Construction Software
QA Overview Series
Web API Performance
Presentation Overview
• Performance Checkpoints
– We list the top 3 instances of QA Performance
Testing and then break each one down.
• Performance Testing Definition
– We detail what Performance, Load, Stress testing
means here at Viewpoint.
• Tools and Processes
– We show the tools and process that we use for
performance testing.
Viewpoint Performance Checkpoints
• Agile Scrum Teams
– As part of each Scrum team QA ensures the team builds
with performance in mind through participation in design
meetings and build->build performance trending.
• Component Integration Milestones
– Components built by different teams are merge together
for integration tests which include end-to-end
performance testing.
• Pre-Release Regression
– As part of the final release the QA team works to provide a
full performance regression on release comparable
hardware.
Agile Scrum Teams
• Each Scrum Team has QA Resources assigned to
that team focused on Functionality, Security and
Performance.
• QA ensures that the design and implementation
of each product supports performance testing.
• QA provides per-build (at least 1 per 2 week
sprint) trends for common functionality to
ensures no performance impact from new work.
Component Integration Milestones
• As part of the Product Release Plan several
integration milestones will be identified and
QA will participate to ensure that
performance is reviewed and communicated
to all teams.
• Performance issues found during these
integrations will be marked as Bugs and QA
will work to ensure they are addressed and
retested before new work begins.
Pre-Release Regression
• Prior to a final release the QA Team will rerun
the entire performance test suite against each
Release Candidate.
• This performance profile will be made
available to the management team to assist in
the go-no-go decision.
Performance Testing Definitions
• Load Testing
– Models realistic usage scenarios for existing and
future customers to vet new Features.
• Volume Testing
– Focuses on high volume to track how the application
handles paging, chunking, retries and timeouts.
• Stress Testing
– Focus on “burst/spike” scenarios and tracks how the
system degrades with “too many users.”
Load Testing
• Focuses on “How Much” instead of “How Fast” and
models realist user scenarios, roles and functions.
• Goal is ensuring existing/future customer load is
supported with planned feature or system changes.
• Example Scenarios
– 300 concurrent users with 5% performing Admin
Functions.
– End of Month Report Generation – spiked on top of 300
User Load.
– V6 Ad-hoc Report Run – spiked on top of 300 Users Load
Volume Testing
• Focuses on high volume and does not need to
represent “real” usage. Typically used to simulate large
sets of data returned from the Database.
• Goal is ensuring application handles paging, chunking
of large files, retries and timeouts correctly.
• Example Scenarios
– Admin attempting to perform User Management on a
system with 10,000 users.
– Report Generation against a system with 100 times the
data of our largest customer.
– User attempting to upload and retrieve huge (multi-gig)
files.
Stress Testing
• Focuses on modeling “burst/spike” scenarios that
measure how the system behaves with “too many
users”.
• Goal is ensuring application degrades gracefully and
then successfully recovers.
• Example Scenarios
– Track user experience when system is overloaded.
• Verify each user was directed to a custom “System is Busy” Page.
• Verify the users browser did not hang and pages timed-out nicely.
– Verify system recovers correctly
• Ensure no services or jobs stopped responding
• Verify the users data was not corrupted or locked from future
access.
Performance Tools and Processes
• Microsoft Visual Studio Ultimate
– Viewpoint has invested in Microsoft’s complete Web Load and
Performance Test solution. This provides out of the box
capabilities as well as rich customization to support all of
Viewpoints needs.
• MSDN Overview on Performance Testing Applications
• Industry Standard Technologies
– Viewpoint has focused on a core set of standard technologies
which have enabled a tight Dev/QA integration.
• Performance Trends
– QA tracks performance metrics and trends starting as early in
the development cycle as possible which enables us to quickly
isolate performance issues and optimizations prior to release.
Visual Studio Ultimate
• Visual Studio Ultimate provides a complete suite of tools to enable
Performance Testing across the entire range of Viewpoint Services
• Web
– Visual Studios Web Performance and Load Testing Framework is an industry
standard in testing Web Applications and API’s
– Custom Adapter Framework built on top of the standard tools gives us the
ability to build a modern and maintainable automation framework customized
to our applications.
• Mobile
– Leveraging Visual Studios ability to record, parameterize and playback (via
multiple cloud test agents) gives us the power to simulate many 1000’s of
simultaneous mobile users.
• Windows
– Microsoft’s Coded UI automation framework allows us to control our own
(and 3rd party) windows applications to create very customized cutomer
workflows and play them back at scale.
Industry Standard Technologies
• Standard Data Access Layer
– By adopting oData as its secure web wrapper to our data,
QA was able to leverage this for data setup/cleanup for our
tests.
• REST API
– By provide REST interfaces for our public and private
services, QA is able to script and generate load very easily
against the majority of our application.
• Microsoft Stack – SQL Server, .Net, Windows Server
– With this stack we have the ability to get detailed
performance metrics from all layers of the system in a
standard format and relate that data to a specific test or
test run.
Performance Trends
• Visual Studio Performance Report Server
– Visual Studio gives us the ability to capture vast
amount of data (application, hardware, network) for
each of our tests runs and store it in a SQL Database
for analysis and comparisons.
• Web Dashboards
– To socialize our performance goals and how we are
meeting them across Sprints, Integration Milestones
and Releases we use a series of Web Dashboards.
• These dashboards are made available to the teams and
upper management so everyone is on the same page.

VCS_QAPerformanceSlides

  • 1.
    Viewpoint Construction Software QAOverview Series Web API Performance
  • 2.
    Presentation Overview • PerformanceCheckpoints – We list the top 3 instances of QA Performance Testing and then break each one down. • Performance Testing Definition – We detail what Performance, Load, Stress testing means here at Viewpoint. • Tools and Processes – We show the tools and process that we use for performance testing.
  • 3.
    Viewpoint Performance Checkpoints •Agile Scrum Teams – As part of each Scrum team QA ensures the team builds with performance in mind through participation in design meetings and build->build performance trending. • Component Integration Milestones – Components built by different teams are merge together for integration tests which include end-to-end performance testing. • Pre-Release Regression – As part of the final release the QA team works to provide a full performance regression on release comparable hardware.
  • 4.
    Agile Scrum Teams •Each Scrum Team has QA Resources assigned to that team focused on Functionality, Security and Performance. • QA ensures that the design and implementation of each product supports performance testing. • QA provides per-build (at least 1 per 2 week sprint) trends for common functionality to ensures no performance impact from new work.
  • 5.
    Component Integration Milestones •As part of the Product Release Plan several integration milestones will be identified and QA will participate to ensure that performance is reviewed and communicated to all teams. • Performance issues found during these integrations will be marked as Bugs and QA will work to ensure they are addressed and retested before new work begins.
  • 6.
    Pre-Release Regression • Priorto a final release the QA Team will rerun the entire performance test suite against each Release Candidate. • This performance profile will be made available to the management team to assist in the go-no-go decision.
  • 7.
    Performance Testing Definitions •Load Testing – Models realistic usage scenarios for existing and future customers to vet new Features. • Volume Testing – Focuses on high volume to track how the application handles paging, chunking, retries and timeouts. • Stress Testing – Focus on “burst/spike” scenarios and tracks how the system degrades with “too many users.”
  • 8.
    Load Testing • Focuseson “How Much” instead of “How Fast” and models realist user scenarios, roles and functions. • Goal is ensuring existing/future customer load is supported with planned feature or system changes. • Example Scenarios – 300 concurrent users with 5% performing Admin Functions. – End of Month Report Generation – spiked on top of 300 User Load. – V6 Ad-hoc Report Run – spiked on top of 300 Users Load
  • 9.
    Volume Testing • Focuseson high volume and does not need to represent “real” usage. Typically used to simulate large sets of data returned from the Database. • Goal is ensuring application handles paging, chunking of large files, retries and timeouts correctly. • Example Scenarios – Admin attempting to perform User Management on a system with 10,000 users. – Report Generation against a system with 100 times the data of our largest customer. – User attempting to upload and retrieve huge (multi-gig) files.
  • 10.
    Stress Testing • Focuseson modeling “burst/spike” scenarios that measure how the system behaves with “too many users”. • Goal is ensuring application degrades gracefully and then successfully recovers. • Example Scenarios – Track user experience when system is overloaded. • Verify each user was directed to a custom “System is Busy” Page. • Verify the users browser did not hang and pages timed-out nicely. – Verify system recovers correctly • Ensure no services or jobs stopped responding • Verify the users data was not corrupted or locked from future access.
  • 11.
    Performance Tools andProcesses • Microsoft Visual Studio Ultimate – Viewpoint has invested in Microsoft’s complete Web Load and Performance Test solution. This provides out of the box capabilities as well as rich customization to support all of Viewpoints needs. • MSDN Overview on Performance Testing Applications • Industry Standard Technologies – Viewpoint has focused on a core set of standard technologies which have enabled a tight Dev/QA integration. • Performance Trends – QA tracks performance metrics and trends starting as early in the development cycle as possible which enables us to quickly isolate performance issues and optimizations prior to release.
  • 12.
    Visual Studio Ultimate •Visual Studio Ultimate provides a complete suite of tools to enable Performance Testing across the entire range of Viewpoint Services • Web – Visual Studios Web Performance and Load Testing Framework is an industry standard in testing Web Applications and API’s – Custom Adapter Framework built on top of the standard tools gives us the ability to build a modern and maintainable automation framework customized to our applications. • Mobile – Leveraging Visual Studios ability to record, parameterize and playback (via multiple cloud test agents) gives us the power to simulate many 1000’s of simultaneous mobile users. • Windows – Microsoft’s Coded UI automation framework allows us to control our own (and 3rd party) windows applications to create very customized cutomer workflows and play them back at scale.
  • 13.
    Industry Standard Technologies •Standard Data Access Layer – By adopting oData as its secure web wrapper to our data, QA was able to leverage this for data setup/cleanup for our tests. • REST API – By provide REST interfaces for our public and private services, QA is able to script and generate load very easily against the majority of our application. • Microsoft Stack – SQL Server, .Net, Windows Server – With this stack we have the ability to get detailed performance metrics from all layers of the system in a standard format and relate that data to a specific test or test run.
  • 14.
    Performance Trends • VisualStudio Performance Report Server – Visual Studio gives us the ability to capture vast amount of data (application, hardware, network) for each of our tests runs and store it in a SQL Database for analysis and comparisons. • Web Dashboards – To socialize our performance goals and how we are meeting them across Sprints, Integration Milestones and Releases we use a series of Web Dashboards. • These dashboards are made available to the teams and upper management so everyone is on the same page.