Download as ODP, PPTX


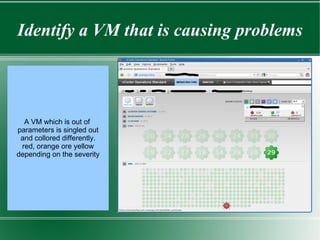


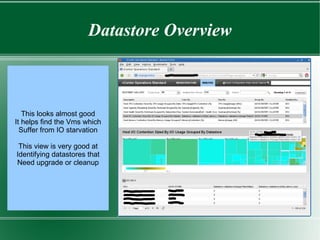


VMWare vCenter Operations allows IT teams to monitor their virtualized infrastructure from a single interface. It identifies VMs experiencing problems based on parameters like CPU and memory usage. Administrators can drill down on alerts to determine the root cause of issues, such as resource contention or storage performance problems. The tool helps VM administrators troubleshoot more efficiently and prove where issues lie within the infrastructure or workload.


