Permeability measurement and scan imaging to assess clogging of pervious conc...
Risk-Based Soil Survey Benefits for A4 Highway Construction
1. The benefits of a risk based soil survey for the A4
highway Delft – Schiedam
Les avantages d'une étude de risque basée sur les sols pour l'autoroute
A4 Delft - Schiedam
Ir. J.J. van Meerten*
, dr. M.P. Hijma, dr. F.H. Kloosterman 1
, ir. J. Brinkman 2
1
Deltares, Delft, The Netherlands
2
Rijkswaterstaat, Utrecht, The Netherlands
*
Corresponding Author
ABSTRACT The last part of the A4 highway between Delft and Schiedam is constructed in a shallow to deep cutting. The subsurface con-
sists of very soft peat and clay with sand layers. Unexpected soil conditions occurred due to the undocumented presence of sand piles be-
low old road embankments. The project risked a significant budget overrun. Re-evaluation of the soil survey was necessary, considering the
uncertainty about the depth of sand piles, the variation in thickness and depth of impermeable soil layers and consequently a large risk of
leakages to the low level road. Geostatistical analysis proved to be beneficial during the decision process in the consideration of specific
measures to be taken in the realization phase.
RÉSUMÉ La dernière part de l'autoroute A4 entre Delft et Schiedam est réalisée dans une coupe modérée jusqu’à profonde. Le sous-sol
est composé de tourbe très meuble et d'argile avec des couches de sable. Toutefois, des conditions de sol inattendues ont été rencontrées en
raison de la présence non-documentée de pieux de sable en-dessous de vieux remblais routiers. Le projet risquait un dépassement budgé-
taire significatif. Une réévaluation de l'étude de sol fut nécessaire, causée par l'incertitude sur la profondeur des pieux de sable, la variation
de l'épaisseur et de la profondeur des couches de sol imperméables et par conséquent un grand risque de fuites jusqu’au niveau bas de la
coupe. Des analyses géostatistiques se sont avérées bénéfiques dans le processus de prise de décision en vue de prendre des mesures spéci-
fiques au cours de la phase de réalisation.
1 DEMANDS AND PERMITS FOR THE ROAD
CONSTRUCTION
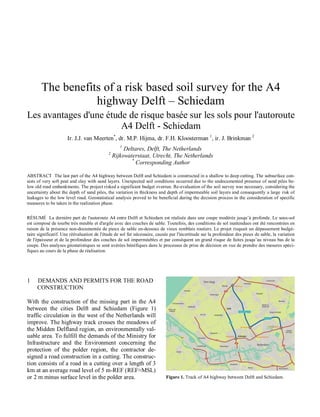
With the construction of the missing part in the A4
between the cities Delft and Schiedam (Figure 1)
traffic circulation in the west of the Netherlands will
improve. The highway track crosses the meadows of
the Midden Delfland region, an environmentally val-
uable area. To fulfill the demands of the Ministry for
Infrastructure and the Environment concerning the
protection of the polder region, the contractor de-
signed a road construction in a cutting. The construc-
tion consists of a road in a cutting over a length of 3
km at an average road level of 5 m-REF (REF≈MSL)
or 2 m minus surface level in the polder area. Figure 1. Track of A4 highway between Delft and Schiedam.
2. Figure 2. Axisymmetric section of shallow cutting highway A4.
To create a watertight construction, shallow cut off
walls to 7.5 m-REF were designed to prevent
groundwater inflow from the flanks (Figure 2). The
width between cut off walls is 62 m. The underlying
natural clay layers provide the vertical watertightness
of the construction.
A deeper part of the road over a total length of 0.5
km is designed to realize a viaduct and aqueduct,
having ramps at both sides with a surface level down
to 8 m-REF and cut off walls to 40 m-REF.
The authorities on water management demanded
protection of the sensible natural environment in the
polder. According to the permit, intrusion of brackish
groundwater from the aquifer to the cutting is limited
to 400 m3
/day. This can only be met if the sealing of
the cutting is ensured by a high resistance against
upward groundwater flow in underlying clay layers.
The bidding for the D&C contract was rewarded
based on this design. However, a complexity was en-
countered by the contractor A4All in the final design
phase. Just before the construction started, remains of
forty year old road works were found beneath the
surface. The old sand embankment with a thickness
of 3 m was known, but the presence of sand piles
with 0.3 m diameter in a 3 m grid was unknown. At
the time, those sand piles were installed to accelerate
the consolidation of the soft Holocene sediments.
2 PROBLEM ANALYSIS
2.1 Hydrogeological design aspects
To explain the resulting problem, it is necessary to
expand on the complex hydrogeological setting. The
drainage level in the cutting is at 7 m–REF. Local da-
ta of groundwater heads show a present head at 2.5 to
3 m–REF in the deep (upper) Pleistocene aquifer (see
Section Geology). However, in the near future the
industrial groundwater extraction in the city of Delft
will be terminated and it is expected that the ground-
water head in the region will rise to 1.9 m–REF .
Holocene clay and peat layers are found down to
20 m–REF. These layers were expected to have a
very large resistance to vertical groundwater flow.
The preliminary soil survey by the contractor proved
this hypothesis, because laboratory permeability tests
showed very low values. Therefore, in the prelimi-
nary design the contractor expected that the low
amount of permitted upward flow was achievable.
The unexpected information about the presence of
sand piles was an enormous drawback for the realiza-
tion of the highway. The effect of thousands of sand
piles on the vertical resistance and groundwater flow
could lead to a large overrun of the permitted flow
Therefore, the road authorities decided to execute
extra studies. Several important issues needed to be
investigated: i) the presence and exact end depth of
sand piles, ii) the geological distribution and level of
Pleistocene and Holocene sand layers in detail and
iii) the representative value of hydrological parame-
ters and hence the resulting groundwater fluxes. Es-
pecially essential was to know whether local short-
cuts existed between the upper Pleistocene aquifer
and the sand piles, as this would create an undesired
increase in vertical groundwater flow.
2.2 Sand piles
The first issue was addressed by checking the end
depth of the sand piles by excavating up to 50 old
sand piles. The bottom levels are shown in Figure 6.
The examined sand piles end in clay at a good dis-
tance above the underlying sand layers. Hence, there
was no hydrogeological short cut expected and it
seems that 40 years ago the applied techniques al-
ready complied with the geological conditions.
2.3 Geology
The second issue could only be addressed by a de-
tailed analysis of the local geology and the additional
survey for subsurface data. The general geological
phenomena in this region are described in a PhD the-
3. sis, based on an extensive set of regional subsurface
data (boreholes, CPTs) [Hijma, 2009]. In short, the
geological layers consist of 16 m of Holocene sedi-
ments (sand, clay, peat) lying on top of the Pleisto-
cene Kreftenheije Formation that consists of 15 m of
fluvial sand. The top of the Pleistocene sand lies at
19.3 to 17.6 m-REF. This variation is the result of the
occurrence of residual channels and small eolian
dunes. The Kreftenheije sand was deposited by riv-
ers during periods of relatively low sea level and
consists predominantly of medium to coarse sand.
During the Holocene, sea-level rise resulted in
drowning of the area and within the resulting estua-
rine setting, thick layers of clay and sand were (most-
ly) subaqueously deposited by a complex network of
channels. Near the end of the Holocene, the rate of
sea-level rise dropped, the formation of beach ridges
closed the shoreline in front of the area and peat
started to grow. Although a solid understanding of
the general geological history of the area existed, it
became clear that a very high density of subsurface
data was needed to really tackle the problem of po-
tential short cuts to sand piles. Therefore a large new
dataset of CPTs was gathered.
3 PERFORMED SOIL SURVEY
3.1 Probability of hydrogeological connections
For the additional soil survey the main concern
was to determine the variation in the top of the Holo-
cene and Pleistocene sand layers (Figure 6). Where
the top of the Holocene sand layer is relatively high,
leakage and hydrological shortcuts through sand piles
could occur, especially if the Holocene sand layer is
in contact with the Pleistocene sand. At first all
available CPT data were interpreted. In the 3.5 km of
low lying road and ramps to the viaduct there were
211 CPTs and 38 borings from the preliminary soil
survey for the road construction. This is about 1
measurement per 1000 m2
. Using GIS, the distribu-
tion of the Pleistocene and Holocene sand layer lev-
els were evaluated. The geologist interpreted the re-
sults by assigning likelihood scales of possible direct
connections between the Holocene and Pleistocene
sand to intervals in the CPT map (Table 1).
Table 1. Geological interpretation of probability of connections
between sand layers.
Probability of
connection
Type of area.
1.00 Shortcut exists
0.75 in line with and/or next to shortcut
channel
0.50 in between CPTs with and without a
short cut
0.20 area 100 m off shortcut river channel
0.005 area without evidence for shortcut
channels, but with limited data density
< 0.001 area with sufficient data and no evi-
dence for shortcut channels
To assess the probability of shortcuts through a sand
pile with a sand layer, the geologist interpreted pos-
sible high levels of the Holocene sand by assigning
95%-likelihood and extreme values in relation to dis-
tances between CPT locations. For a CPT distance of
only 10 m the extreme value of height difference in
the top level of a sand layer could be as big as 0.4 m.
In addition, maps were made that showed the top of
the Holocene sand layer, to identify areas where the
risk of a connection between sand piles and the Hol-
ocene sand was the highest.
Based on this analysis areas were selected where
extra surveys should be performed to reduce the un-
certainty about the existence of shortcuts. The goal of
the geological analysis was to provide the critical in-
formation needed to determine the extent of the prob-
lem. The surveys were done in weekends on a week-
ly basis during 1.5 months. The complete soil survey
was performed with a total of 225 new CPTs. Inter-
pretations of the CPTs and decisions about necessary
supplementary CPTs had to be made within three
days after each weekend. With this effort the average
covered area per CPT went down to 500 m2
(distance
between CPTs of 22 m on average). The amount of
CPTs in the deep viaduct ramps was larger than in
the shallower road cutting, but mainly the CPTs were
located near river channel phenomena pinpointed by
the geologist. In those areas, the distance between
CPTs in the ramps had to go back to 10 m to deter-
mine the occurrence of the sand layers in sufficient
detail. Of course the fast interpretation demanded per
round of measurements could not have been done
without the aid of automated interpretation tools.
4. 3.2 Advanced soil modeling and geostatistical
analysis
A subsurface model was based on a partially auto-
mated data interpretation of some hundreds of CPT’s
with the geological analysis program Rockworks v15
and GIS (ArcMAP).
CPT-datafiles from all participating companies
were converted to the uniform standard data file for-
mat GEF for CPTs and interpreted to determine the
local soil profile per location. Based on available
borehole data the local soil profile was simplified to
5 layer types with specific geomechanical character-
istics. Earlier in the design phase during the prelimi-
nary soil survey by the contractor, a consistent data-
base of properties was set up giving soil specific
weight, soil compression and permeability per layer.
To recognize soil layer types from CPT data an eval-
uation method was followed comparable to the meth-
od by Robertson [CUR 1996, Lunne, 1997]. The
method was limited to the 5 soil layers expected in
this project, by judging the ratio between CPT cone
resistance and friction ratio (Figure 3).
Figure 3. Limits between location specific lithology classifications
in CPT interpretation diagram.
The interpretation was automated with the aid of
Rockworks and the transformation from CPT meas-
ured values to layer types was programmed in a dedi-
cated module in SQL. Transformation into layer type
was done per 0.02 m depth and stacked per 5 depth
levels into a single layer interval. When layer inter-
vals with equal soil type occur, the module aggre-
gates them to one layer. Profiles were drawn with a
standard Rockworks visualization tool (Figure 6).
Before production of maps in GIS, the proper con-
touring procedure was selected. Methods like Inverse
Distance contouring or Linear Interpolation were
found incorrect because discontinuities could be ex-
pected. Also the Kriging method could produce in-
correct results because a spatial relation in changing
sand levels was debatable. Therefore we chose the
simple method of Nearest Neighbor [Burrough
1998,]. In that way the sand level value found in each
CPT result can only be used for the area of influence
or validity of that specific CPT. GIS ArcMap soft-
ware [ESRI 2007] can produce a Thiessen polygon
for each measurement based on the distance to all di-
rectly neighboring CPT measurements (Figure 5).
3.3 Evaluation of measurements
After data handling with the developed tools, the pro-
ject team evaluated that a connection between Holo-
cene and Pleistocene sand existed at the location of a
large Holocene river channel. Fortunately, this loca-
tion is at the north of the road track, and posed no
significant risk for extra leakage. Below the major
part of the shallow road cutting the variation in the
undulating top and base of the Pleistocene and Holo-
cene sand layers respectively, was relatively small.
In the northern ramp to the aqueduct, the top of
Holocene sand lies relatively shallow at 14 m-REF,
while the sand piles reach 13 m-REF. Due to varia-
tions in sand level and sand pile end depth, the thick-
ness of the clay below the sand piles at this location
can be less than 1 m. There is a risk of leakage but
the chances of hydrological shortcut are very small.
At the southern ramp remnants of (Pleistocene)
river channel deposits with high sandy levees were
detected. The interpretation of CPT-data at the top of
the Pleistocene sediments was complex as both high
cone resistances and high sleeve frictions were
found. This indicated that clayey sand was present,
but without further information the exact nature and
permeability of the sediments could not be assessed.
If predominantly sand, this would imply that the local
thickness of clay below the sand piles most likely re-
duces to less than 0.6 m. If the distribution of the
sand levels is evaluated, the 99% limit of the confi-
dence interval is found at 15,2 m-REF, so very close
to end depth of the sand piles at 15 m-REF. Thus the
leakage of a sand pile can get significant and even
the risk of shortcut is substantial.
5. 4 DETERMINISTIC AND STOCHASTIC
MODELING OF GROUNDWATER FLUX
Figure 4. Plaxflow results for flow rate through 15 m long sand
pile in clay layer with varying clay thickness below the sand pile.
!
!
!
!
!
!
! !
!
!
!
!
!
!
! !
!
!
!
!
!
!
!
!
!
!
!
!
!
!
!
!
!
!
!
!
!
!
! !
!
!
!
!
!
!
!
!
!
!
!
!
!
!
!
!
!
!
!
!
!
!
!
!
!
!
!
!
!
!
!
!
!
! !
!
!
!
! !
!
!
!
!
!
!
!
!
!
!
!
!
!
!
!
!
!
!
!
!
!
!
!
!
!
!
!
!
!
!
!
61200.000
61300.000
61400.000
2.3e-004
2.3e-004
1.4e-013
1. 9e-009
7.0e-013
1.0e-008
3.3e-017
1. 5e-006
1.2e-007
5.9e-007
3. 7e-010
3. 7e-010
8.8e-010
4.1e-007
1.6e-007
2. 0e-006
9. 3e-007
3. 2e-007
5.9e-006
2.3e-006
7.4e-006
5.7e-005
8.4e-008
1.5e-004
3. 8e-005
2.0e-004
3.9e-004
1.8e-004
1.4e-004
1.3e-0042. 1e-004
1. 7e-004
1.4e-005
1.1e-003
5.6e-0052.1e-004
4.6e-004
5.5e-004
2.9e-005
3. 4e-004
1.7e-004
9.7e-004
8.1e-005
5.7e-004
1. 9e-004
7.3e-004
8. 5e-004
5.6e-005
8.1e-004
1.8e-004
4. 7e-004
2.4e-003
5.2e-004
9.0e-004
1.5e-003
4.1e-005
1.3e-003
6.8e-005
8.4e-005
3.4e-005
5.6e-003
4.7e-005
4.7e-005
5.7e-008
4.8e-005
6.3e-004
2.4e-005
1.2e-005
1.1e-0072.4e-004
1.9e-006
3. 5e-008
4.1e-003
3.0e-011
6.3e-010
9.2e-010
1.4e-007
2.4e-025
1. 4e-037
3.4e-016
9.3e-012
3.0e-043
6.5e-009
6.3e-011
4.0e-006
3. 2e-011
8.1e-008
2. 2e-006
4.8e-017
5.5e-020
1.3e-013
1.7e-0131.5e-013
1.6e-014
7.9e-015
1.5e-010
6.9e-015
7.1e-012
1.2e-014
3.1e-013
3.2e-012
1.1e-013
3.6e-014
9.7e-011
3.4e-010
1.9e-011
2. 3e-004
2.3e-004
8.4e-005
2.6e-004
1.2e-010
84050
84050
84100
84100
84150
84150
84200
84200
440100
440100
440150
440150
440200
440200
440250
440250
440300
440300
440350
440350
Expected flux of
groundwater seepage
due to sand pile short cuts
expressed in m3/day/m2
Flux
< 1.0e-10
1.1e-10 - 1.0e-6
1.1e-6 - 5.0e-6
5.1e-6 - 1.0e-5
1.1e-5 - 5.0e-5
5.1e-5 - 1.0e-4
1.1e-4 - 5.0e-4
5.1e-4 - 1.0e-3
1.1e-3 - 5.0e-3
5.1e-3 - 1.0e-2
1.1e-2 - 1.5e-2
1.6e-2 - 1.0
Area B:
Figure 5. Distribution of mean flow in case of sand pile short cuts.
After this detailed analysis of the geology the third,
and remaining issue, of groundwater flux was tack-
led. Plaxflow calculations (axial symmetric) to model
the 3D flow to a sand pile were performed. The depth
of sand piles in the clay layer, clay permeability and
rate of clay anisotropy were varied. The leakage of
the sand piles was determined to an amount between
0.0025 and 0.035 m3
/day (Figure 4). The latter value
is for a case with a clay thickness of 0.5 m below the
pile, a permeability of 3*10-8
m/s and no anisotropy.
Assuming 20000 sand piles are present, the seepage
to the cutting is calculated at 700 m3
/day, which is
almost twice as much as permitted.
However if sand piles create a shortcut from the
aquifer to the drained road cutting the flow would in-
crease even more. Per sand pile the flow could be-
come 0.25 to 1 m3
/day, resulting in much larger total
leakage than mentioned above. Therefore a stochastic
analysis was performed to evaluate what the proba-
bility is of sand pile shortcuts and the total effect for
the road cutting. In this stochastic analysis all the pa-
rameters were allocated with ranges according to ex-
pected statistical distribution. The soil data per CPT
location, including the area of validity (Thiessen pol-
ygon), were used as input. With this analysis it was
possible to allocate areas with the largest shortcut
risk (Figure 5).
For the decision making process it was essential to
systematically gain insight in the mean and the upper
bound values of the increase in leakage due to
shortcut of sand piles. The mean value of the addi-
tional groundwater flux was based on the probability
of shortcut of sand piles per CPT location times the
expected leakage of sand pile shortcut based on mean
values. The probability of shortcut of sand piles was
derived from the thickness of the clay layer under a
sand pile based on the assumed normal distribution
of sand pile depth and top of the sand layers.
The 95% upper bound value of leakage was based
on the probability of a direct shortcut per CPT loca-
tion and the resulting additional groundwater flux,
varying 7 independent parameters: a) average sand
pile depth, b) standard deviation of sand pile depth,
c) standard deviation of the top of the sand layer, d)
standard deviation in CPT depth registration, e) aver-
age cross sectional area of a sand pile, f) average
sand pile grid, g) average permeability of sand piles.
A FOSM-approach [Haldar 2000] was used with a
6. linearization to 95% values of the 7 parameters to
combine the variation in results quadratically. With
this simple method it was possible to calculate the
95% upper bound of shortcut leakage per CPT. By
multiplying shortcut flow through sand piles with
their CPT area of validity (Thiessen polygons, Figure
5) cumulative values per section were found for
mean and 95% upper bound of leakage.
Figure 6. Part of the resulting geological profile along axis high-
way A4 with presentation of sand pile depth.
5 FINAL CONSTRUCTION PROCESS
For the remediation of leakage by a change of con-
struction several options are open. The most rigorous
solution would be building a closed concrete con-
struction or by closing off the aquifer with deep cut
off walls. At the other end of the spectrum are repair
measures, like overdrilling of sand piles and filling
the boreholes with concrete, jetgrouting or injection
into the sand piles and creating compartments. Be-
cause our analysis pinpointed critical spots in the un-
derlying clay layer, the most economical choice was
to excavate the top to detect sand piles with suspect-
ed leaks. To check whether repairs were necessary,
drainage tests were executed within compartments.
Evaluation of the drainage tests seemed complex due
to different contributing hydrological sources in the
water balance. The simplest method was to check if
drainage during depletion would become lower than
the attention limit agreed in the permit. These tests
confirmed that leakages were present at the highest
bank of the Pleistocene channel ridge in the ramp to
the aqueduct. In that compartment several hundreds
of sand piles were filled with concrete or jetgrouting.
6 CONCLUSIONS
Especially in regions with heterogeneous soil condi-
tions it can be advantageous to enhance the soil sur-
vey density. Based on a risk-based plan with an effi-
cient strategy for data assembly. an increased data
density can be achieved in areas where risks for soil
related construction problems are largest. Input by a
geological expert is essential to refine the soil survey,
taking the depositional environment to determine the
geometry (depth, width) of the sediments. A stepwise
approach might result in large datasets. To handle
these data smoothly, a Rockworks routine proved to
be useful for CPT interpretation, moreover when
combined with GIS mapping. During each step, the
identification of knowledge gaps helps to pinpoint
areas where data density is not sufficient. In the
mapping procedure geostatistical analysis and model-
ing of layer properties can be performed, considering
the probability distribution for the layer. The results
can be used as input for stochastic modeling of geo-
mechanical behaviour, in this case groundwater flux
to a cutting. The analysis created a basis for decisions
about geotechnical solutions, use of the observational
method and repair of sand piles at incidental leak-
ages. During construction of the A4 highway near
Delft, specific measures were optimized by reduction
of uncertainties, fitting the conditions and restraints
of the design and the environment, without delay and
at a fraction of costs for traditional solutions.
REFERENCES
Burrough, P.A. and McDonnell, R.A. eds., 1998, Principles of Ge-
ographical Information Systems, Oxford: Oxford University Press
CUR Centre for Civil Engineering Research and Codes, 1996,
Building on soft soils, CUR Report 162, A.A. Balkema, Rotterdam
ESRI, 2007, Working with ARCGIS Spatial Analyst 9.3
Haldar A. and S. Mahadevan, Probability, Reliability, and Statisti-
cal Methods in Engineering Design. John Wiley & Sons, 2000
Hijma, M.P. 2009. From river valley to estuary, the early-mid
Holocene transgressions of the Rhine-Meuse valley The Nether-
lands, Netherlands Geographical Studies 389, Utrecht.
Lunne, T., Robertson, P.K. and Powell, J.J.M. 1997. Cone Pene-
tration Testing in Geotechnical Practice, Blackie, New York.