Explosive Compaction of Foundation Soils Seymour Falls Dam
1. Explosive Compaction of Foundation Soils for the Seismic
Upgrade of the Seymour Falls Dam
by
Ron J. Elliott, AScT, Lewis Clarke, Pacific Blasting & Demolition Ltd.,
Blair Gohl, Ph.D., P.Eng., Ed Fulop, Explosive Compaction Inc., Neil
K. Singh, P. Eng., Klohn Crippen Berger Ltd., & Frank Huber,
P. Eng., Greater Vancouver Water District
Abstract
This paper covers the successful application of explosive compaction technology
for the densification of the foundation soils for the seismic upgrade of the
Seymour Falls Dam, Vancouver, BC. The original earthfill embankment
constructed during 1958 to 1961 was upgraded in 2004 to 2007 to withstand the
effects of a maximum credible earthquake.
This paper provides general background information on the theory of the
explosive compaction of soils, history of use, geology of the site, project
constraints, explosives selection, blast designs, instrumentation used, problems
encountered and solutions implemented, and the results achieved.
The project involved the use of electronic detonators and cap sensitive emulsion
explosives subjected to an extreme overpressure environment. The project is an
excellent example of what can be achieved through the use of “state of the art”
explosives technology coupled with the latest instrumentation. The project
demanded the close cooperation of a team of drillers, blasters and engineers to
accomplish a difficult goal under very demanding conditions.
Introduction
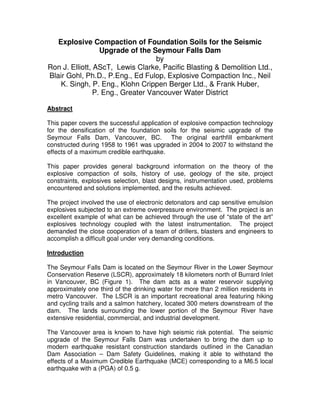
The Seymour Falls Dam is located on the Seymour River in the Lower Seymour
Conservation Reserve (LSCR), approximately 18 kilometers north of Burrard Inlet
in Vancouver, BC (Figure 1). The dam acts as a water reservoir supplying
approximately one third of the drinking water for more than 2 million residents in
metro Vancouver. The LSCR is an important recreational area featuring hiking
and cycling trails and a salmon hatchery, located 300 meters downstream of the
dam. The lands surrounding the lower portion of the Seymour River have
extensive residential, commercial, and industrial development.
The Vancouver area is known to have high seismic risk potential. The seismic
upgrade of the Seymour Falls Dam was undertaken to bring the dam up to
modern earthquake resistant construction standards outlined in the Canadian
Dam Association – Dam Safety Guidelines, making it able to withstand the
effects of a Maximum Credible Earthquake (MCE) corresponding to a M6.5 local
earthquake with a (PGA) of 0.5 g.
2. Figure 1: Location plan of Seymour Falls Dam
A 9 meter high concrete dam was originally constructed on the Seymour River in
the late 1920’s to supply drinking water to the Vancouver area. This dam was
incorporated into a new concrete and earthfill dam in the early 1960’s with a
height of about 30 meters. The earthfill portion of this new dam was 220 meters
long. To accomplish the MCE seismic upgrade of the earthfill portion of the dam,
it was decided to construct a new earthfill embankment at the downstream toe of
the existing dam.
Deep explosive compaction (EC) work from the 10 to 20m depth in combination
with dynamic compaction (DC) over the upper 10 m of the soil profile was
required for ground improvement for the base of the new earthfill embankment.
The EC was designed to take out volumetric compaction settlements induced
under design levels of earthquake shaking with target volumetric strains in the
range of 2 to 5%. The DC was designed to create an upper layer of compacted
granular soil with equivalent Standard Penetration Test N1,60 values in excess of
25.
3. Geology
The easternmost concrete section of the Seymour Falls Dam is built on bedrock
consisting of hard, massive granodiorite of the Coast Range Complex. This
bedrock surface plunges westward and is covered with coarse sands and gravels
from the Cougar Creek fan covering a semi-circular area with a radius of
approximately 800 meters. The earthfill portion of the dam is built on this
outwash debris originating from Cougar Creek on the west wall of the valley. The
upper 20m to 40m portion of the Cougar Creek fan is composed of loose
granular material with the upper 18m section containing coarse boulders,
cobbles, sand, and gravel. The material becomes progressively finer,
transitioning to coarse sand at about the 30 meter depth. A typical gradation
curve for the in situ material is found in Figure 2.
GRAIN SIZE DISTRIBUTION
0
10
20
30
40
50
60
70
80
90
100
0.0010.010.11101001000
Grain Size (mm)
PercentFinerbyWeight
COBBLES
GRAVEL SAND
SILT OR CLAY
coarse fine medium finecoarse
SIEVE OPENINGS IN U.S. SIEVE NUMBERS
6 3 1.5 3/4 3/8 4 10 20 40 60 100 200
l
816 12
Typical Native Material Envelope
(scalped at 12 inches)
Figure 2: Gradation for native soil scalped at 305 mm (12 inches)
The water table in the granular deposit below the dam is influenced by seepage
through the existing earthfill dam and westerly recharge from the Cougar Creek
fan. The groundwater flows southeasterly towards the fish hatchery.
Environmental Concerns
As the fish hatchery, located 300m below the dam, partly relied on groundwater
emanating from the Cougar Creek fan, chemical residuals from the explosive
compaction process had to meet regulatory requirements for aquatic life.
Ammonia was restricted to <25.7 mg/L and nitrates <200 mg/L. Groundwater
monitoring was carried out at 4 monitoring wells following each blast to confirm
that any post blast chemical residuals were within acceptable limits.
4. Overpressure measured within the spawning pools at the fish hatchery was to be
kept less than 50 kPa to protect spawning salmon. Peak particle velocity (PPV)
induced by blasting was to be kept less than 13 mm/sec.
Dam Safety Concerns
Peak particle velocity (PPV) was restricted to ensure dam stability during
explosive compaction. PPV was not to exceed:
• 13mm/sec at the fish hatchery
• 75mm/sec at the chlorination building located 18m from the nearest blast panel
• 25mm/sec at the crest of the concrete dam
• 120mm/sec at the 2.29m diameter Seymour Main #2 pipeline located 18m from
the nearest blast panel
• 120mm/sec at the toe of the existing earth fill dam
An array of 13 seismographs (using redundancy of instrumentation at most
locations) was used to confirm compliance with these limits.
Explosive Compaction – General Principles
Explosive compaction was carried out over approximately two-thirds of the
footprint of the new dam in 18 panels. Explosive compaction is carried out by
setting off explosive charges in the ground using sequential detonations. The
energy released causes cyclic straining of the soil. This strain process, repeated
over many cycles due to the sequential detonation of explosives, induces a
tendency for volumetric compaction of looser sub soils. It is thought that
shearing strains are predominantly responsible for this volumetric compaction,
particularly at distances more than a few meters from a blast hole. For saturated
soils and due to the relative incompressibility of the pore water, the tendency for
shakedown settlements of the soil means that overburden pressures are thrown
onto the pore fluid and excess pore pressures develop during blasting. Provided
strain amplitudes and number of cycles of straining are sufficient, the soil mass
liquefies (i.e. pore water pressures are temporarily elevated to the effective
vertical overburden stress in the soil mass so that a heavy fluid is created).
Time-dependent dissipation of the water pressures causes reconsolidation within
the soil mass. This reconsolidation typically happens within hours to days
following blasting, depending on the permeability of the sub soils and drainage
boundary conditions, and is reflected by release of large volumes of water at the
ground surface or up spent blast casings. “Short term” volume change is also
caused by passage of the blast-induced shock front through the soil mass.
Within a few meters of a charge detonation, the hydrodynamic pressures are
large enough to cause compression of the pore fluid even though the bulk
compressibility is relatively small.
5. Once an area of ground has been shot and pore pressures have largely
dissipated, repeated applications (“passes”) of shaking caused by controlled
blast sequences cause additional settlement depending on soil density and
stiffness. The first pass destroys any bonds existing between cohesionless soil
particles due to ageing and other geologic processes. Subsequent passes cause
additional settlement following pore pressure dissipation. The blasting results in
surface settlement and increased soil resistance to the effects of future
earthquake shaking at the site. In this way, EC pre-conditions the ground to the
effects of future cyclic loading.
Because of the coarse grained nature of the overburden soils and the relatively
high internal friction of these materials, previous blasting trials at the site carried
out in 1998 had indicated the potential for arching of the soil mass above a
localized zone of liquefaction at depth. This arching process can reduce
settlements occurring at the ground surface. Thus, it was considered desirable
to create as broad a zone of liquefaction as possible at any one depth to
minimize the arching process. This was achieved by detonating sequentially all
charges at a particular depth across an array of blast holes using time delays in
excess of 25 ms. to minimize superposition of the blast vibrations. Explosive
decks were detonated using a “bottom-up” sequence with 2 second delays
between adjacent decks. Any residual arching would be addressed by the
following dynamic compaction work.
Drilling Challenges
The explosive compaction work involved drilling approximately 800 holes, totaling
over 16,000 meters of drilling. The drilling operation was carried out by Foundex
Explorations Ltd. using DR-24 Barber and AP-1000 drill rigs mounted on tandem
axle trucks. Each rig was set up to drill 185mm diameter holes using 168mm
outside diameter threaded steel casing and a Symmetrix drilling system.
The Symmetrix system is a full-face concentric overburden drilling system that
requires less torque to drill efficiently through large boulders. The system
consists of the outer threaded casing with a casing shoe on the lead piece, 101
mm diameter CSR inner rods attached to a Down the Hole Hammer with pilot bit
and a disposable ring bit. The pilot bit on the end of the Down the Hole Hammer
locks into the casing ring bit using a bayonet-style coupling. The ring bit rotates
freely on the casing shoe and while drilling, the casing does not rotate.
The DR-24 was equipped with a 900CFM/350PSI compressor and the AP-1000
was equipped with a 750CFM/250PSI compressor to supply the air for the
drilling. While drilling, air is forced through the holes in the face of the pilot bit and
returns up wide grooves between the pilot and ring bits, then further to the
annulus between the casing and inner drill pipe. The penetration force is
transmitted only through the drill string to the pilot bit, which strikes the ring bit.
6. When the hole is drilled to target depth, the pilot bit is unlocked from the ring bit
by a slight anticlockwise motion and withdrawn up through the casing.
After the holes were drilled to depth, the inner rod string was retrieved to surface
and 104mm O.D. PVC casing was installed. The PVC casings were installed with
a cap on the end and water was used to overcome any buoyancy problems while
lowering the PVC to depth. The DR-24’s powerful lower drive with 190,00Nm of
torque combined with 34,200kg of pullback pressure was required to pull the
casing out of the ground. The AP-1000 was equipped with a pair of fifty ton
hydraulic jacks to pull the casing out of the ground.
The drill rigs worked 6-7 days per week and 24 hours per day, under extreme
drilling conditions due to the large number of granite boulders encountered.
During the excavation of the EC panels, many boulders greater than 20 cubic
meters in size were encountered. Drilling through these boulders and
unconsolidated materials led to breakage and loss of drill casing. When casing
breakage occurred, the pipe was retrieved to surface, the broken pieces changed
out, and the hole was re-drilled down to depth. The drill rigs and an example of
the size of the boulders encountered can be seen in Photo 1.
Photo 1: Barber DR-24 drill rig showing large boulders encountered during
drilling
7. Blast Design
The selection of charge weights, blast hole layouts, and sequence of detonations
was carried out by the design engineers (Klohn Crippen Berger) for the project.
The responsibility of the contractor was to implement the design and ensure the
safe detonation of all charges. In this way, the EC was carried out using a
method specification.
The footprint of the new dam foundation was broken up into a series of 18 blast
panels ranging from 225 square meters to 1200 square meters in size. Drill
patterns were designed using a 2m to 4m staggered equilateral triangle pattern
layout, divided into three passes, resulting in an even distribution of the
explosives within the soil mass. Drilling and blasting was carried out in three
individual passes, starting with the most westerly panel and progressing
eastward, gradually approaching the most sensitive areas at the toe of the dam
and the area next to the gravity wall, chlorination building, and water pipeline.
This allowed us to make adjustments in the blast design as we neared critical
structures. The panel layout can be seen in Figure 3.
Figure 3: EC panel layout design
8. Drill hole depths varied from 16 to 27 meters. The explosive chosen for the
project had to be waterproof, reliable under extreme dynamic overpressure
conditions, and meet the stringent after blast residuals requirements. It was also
important that the explosive not propagate under high shock loading. Iremite TX
(Dyno TX) was selected for its reliability under these heavy dynamic shock
conditions. The explosives were loaded into decks where the number of
explosive decks varied based on panel location and drill hole depth. Generally, 3
to 5 explosive decks were used. Two second delay timing between decks was
used with hole to hole timing set at maximum 60 ms. and minimum 25 ms.
Explosive compaction covered the zone from 10m to 20m below excavated
ground level using a powder factor of 0.10 to 0.15 kg/cu.m. Typical loading detail
can be found in Figure 4 for blast holes located in close proximity to the toe of the
existing dam. For blast holes located further away from the dam, larger
explosive charge weights up to 30 kg per deck were used.
14 kg
5 kg
8 kg
10 kg
Seymour Falls Dam Project
Typical Loading Detail
Panel 9C – Pass #3
Hole #4
Firing Time
8500ms
6500ms
4500ms
2500ms
22.8m
8.24m
Figure 4: Typical blast hole loading detail (near the dam toe)
As part of the project requirements, we were to monitor and verify the detonation
sequence to ensure that all of the explosive decks had fired successfully. There
was also a requirement that detonators were to fire within plus/minus 10 ms. of
the designed firing time. To meet this requirement, I-kon electronic detonators
with a rated accuracy of +/- 1ms were chosen for the project. These detonators
have a dynamic shock resistance of up to 96 MPa (14,000 psi). Delay timing up
to 14 seconds is possible with these electronic detonators. To ensure reliability of
the detonation sequence under high static and dynamic overpressures, each
deck was primed using a 250g cast booster.
9. Monitoring of the firing sequence was carried out using redundant systems. One
system involved the use of Nonel tracer up-lines from each cast booster in each
deck (see Photo 2). The Nonel was coiled on a stake at the collar of the hole,
and the blast was filmed using a video camera. The flashes from the Nonel coils
could confirm detonation of each deck. A second system used a seismograph
with a triaxial geophone package. A hydrophone was also connected to a
seismograph channel and the hydrophone installed close to the blast down a
water filled borehole. As long delays were used in the firing sequence, we could
pick up the firing of each deck using the trace from the hydrophone and the
vertically oriented geophone on the seismograph unit. A third system used a
high-speed data collector and high resistance coaxial cable in each blast hole to
monitor not only the firing of the explosive decks, but also monitor the velocity of
detonation of the explosives in each deck. This latter system was used to
identify the majority of charge detonations. A fourth system was also used
involving the use of electric strain gauge piezometers installed in the foundation
soils at the toe of the existing dam. Pore pressure response from the
piezometers were monitored using a second high speed data acquisition system.
Where charges were detonated in close proximity to the piezometers, pore
pressure spikes could be identified.
During the explosives loading operation, quality control checks were carried to
record:
• blast hole depth
• bottom deck elevations
• top deck elevations
• stemming height
• programmed firing time of each deck
The blasting was monitored using 13 Geosonics seismographs, 2 hydrophones,
and a high-speed data collection system monitoring the coaxial cable response.
Once the Blasting Supervisor and the Engineer had signed off on each quality
control item, the blast was allowed to proceed.
10. Photo 2: Nonel tracer lines used to verify detonation of decks
Photo 3: Loading of Dyno TX explosives and casing tie-down system
The I-kon detonators were tied-in to fire sequentially, en-echelon, starting from
the corner of the blast closest to the dam, with the detonation sequence moving
progressively away from the toe of the existing dam. This helped to direct shock
waves away from the dam and other sensitive structures and limited the
likelihood of blast waves stacking (amplifying) at the toe of the dam. All charges
in the lower deck fired before the first charges in subsequent decks. A photo of
the explosives loading process is shown in Photo 3.
11. Blasting Challenges
Problems were encountered with high transient overpressures affecting the
reliability of the detonators in the top explosive decks. This problem was solved
by installing an outer protective steel sleeve covering the electronics in the
detonator (see Photo 4). This increased the overpressure resistance of the Ikon
detonators to 138 MPa (20,000 psi). We moved the detonators for the top decks
to top-prime the explosives, resulting in greater separation of the detonator from
the deck below. The cast booster was inverted so that the cap-well was pointing
up. We also added an air cushion to the bottom of the 2nd
, 3rd
, and 4th
explosive
decks. The cast booster primers were sealed inside a plastic bag to trap air
around the booster, further protecting the detonator. The blast hole casings were
also pumped dry prior to loading to minimize potential hydrodynamic shock
between charges.
The long delay timing between decks allowed the PVC casing to ratchet upwards
during detonation of the lower decks, creating a potential safety issue. The
solution was to design a casing hold-down system using concrete weights, a
steel collar, and turn buckles. This system can be seen in Photo 3.
Photo 4: I-kon detonator on right has steel protective sleeve
12. Photo 5: Explosive compaction shot showing gas and water emanating
from blast holes
Photo 5 shows the firing of a typical blast panel, indicating the gas and water
emanating from the blast holes followed by soil and water flow around blast
casings due to liquefaction effects.
EC Program Results
Identification of Charge Detonations
Charge detonations were mainly identified using the coaxial cable system with
back-up provided using the seismograph hydrophone/geophone and electric
strain gauge piezometer systems. When the coaxial cable is sheared at a
particular level by an explosive detonation, this results in a resistance change in
the cable and a corresponding voltage spike. The voltage response is monitored
on a high speed data acquisition system. A typical voltage output for a single
charge detonation is shown in Figure 5. A small pore pressure spike from the
electric strain gauge piezometer is also evident.
13. Figure 5: Voltage response from the coaxial cable during a single charge
detonation. Electric strain gauge piezometer response is also shown.
Using the various blast monitoring systems, charge detonations were identified
and times of detonation were provided in a tabular summary to the supervising
engineers for the project. Comparison of measured to theoretical firing times
demonstrated the accuracy and reliability of the Ikon detonators when they were
fitted with the steel sleeves.
Vibration Monitoring
Ground surface vibrations were monitored using triaxial geophones at the
following locations during blasting: fish hatchery, chlorination building, water
main, top of concrete dam, top of earth fill dam, and the transition block between
earth fill and concrete dam. Following a blast, peak velocities in the 2 horizontal
and 1 vertical directions as well as the vector sum of maximum velocity (PPV)
were reported at each location to compare against limiting values. In general,
PPV’s were within acceptable limits. On occasion, higher PPV’s were
encountered at the water main location and adjustments were made in maximum
charge weights per delay for future panel blasting in closest proximity to the
water main.
14. A summary of PPV versus scaled maximum charge weight per delay W and
horizontal distance R is shown in Figure 6 for data collected during September
and October, 2004. This chart shows the close correlation between the design
expectations and actual field data.
Figure 6: Summary of PPV versus scaled distance = R/√W
Pore Pressure Monitoring
Six piezometer monitoring points were established at the toe of the old earthfill
embankment at the northern edge of the EC improvement zone with tip depths
ranging from the base of the old earthfill dam to bedrock. These piezometers,
including pneumatic, vibrating wire and strain gauge pressure transducers, were
used to monitor baseline piezometric levels and blast induced transient pore
pressure responses.
Blast induced pore pressures are the pressure response due to ground collapse
resulting from the detonations, defined as a pore pressure ratio (PPR), measured
by the increase in pore water pressure above static values divided by pre-blast
effective stress. PPR data are observed and recorded at the monitoring points
(piezometers). A PPR of 1.0 represents liquefaction. Typical plots from a single
blast episode and a summary of PPR versus scaled distance R/W0.33
are shown
in Figures 7 and 8, respectively. The data from each piezometer was monitored
15. to ensure that the PPR remained below 1.0 at the existing dam toe to ensure
dam stability. A more detailed inspection of Figure 7 shows spikes, noise and
scatter around the main blast induced pore pressure caused by secondary
pressure effects from blast shock waves and outflow of water during ground
consolidation as pore pressures dissipate.
Electric Piezometer DH04-2A(E) - Panel 9A - Pass 2
Layout 2, Blast on October 18, 2004 (16:42:55)
200
205
210
215
220
25 30 35 40 45 50 55 60 65
Time (seconds)
ElevationofWater(m)
DH04-2A(E)
Piezo. elev. 184.4 m
Time of Blast
Figure 7: Blast pressure monitoring from October 18, 2004 blast
Measured PPR vs. Rp/W1/3
0
0.1
0.2
0.3
0.4
0.5
0.6
0.7
0.8
0.9
1
0.00 5.00 10.00 15.00 20.00 25.00
Rp/W^0.33 (m/kg^0.33)
MeasuredPPR
Panel 9C Pass 1
Panel 9A Pass 1
Lower Bound Theoretical
High End Theoretical
Studer & Kok (1980) Average
Mid Range (used for blast hole)
PPR = 1.17-0.069*Rp/W^0.33
Figure 8: Panel 9A and 9C summary of PPR versus scaled distance R/W0.33
Settlement Monitoring
Settlement associated with EC was obtained from surface measurements of
each panel before and after each blast on each panel, and by measurement of
deep settlement posts (DSP’s).
16. Detailed topographic surveys were conducted at each panel prior to EC, then
after each of the three blasts on each panel. Contours of the panel surface were
prepared and average settlement per pass calculated as the difference between
surface contours. The panel surveys generally showed a dish shape with
maximum settlement at the centre with settlement extending several meters into
adjacent panels. The ultimate settlement for the site was calculated by stitching
together the final contour surveys of each panel into an overall contour map of
settlement (see Figure 9). The EC blasts achieved settlement ranging from 300
mm to over 1500 mm over the blast area. Assuming a thickness of liquefied
ground during blasting of 10 to 16 m, this gives an average vertical strain of 3 to
15%, consistent with the intent of the blast design. Local zones of large
settlement indicated collapse of the ground occurred in areas of loose soil
surrounded by nested boulders.
The DSPs were placed at the centre of ten panels and anchored at nominally 12
m depth near the top of the EC zone. DSPs were intended to provide an
indication of whether settlement at depth was similar to surface settlement.
Typically, after 3 EC passes, the DSPs showed similar settlement to the surface
surveys, indicating the three blasts were generally adequate to break down
ground arching in the bouldery ground.
Figure 9: Contour plan showing ultimate settlement in EC panels
17. Standard Penetration Test Results
Standard Penetration Testing (SPT) was conducted to assess soil conditions in
the EC zone and assess EC performance. SPTs were conducted in five mud-
rotary drill holes both pre- and post the EC work with an additional 14 drill holes
conducted following dynamic compaction ground improvement work, which
followed the EC work. Most of the post DC drill holes were advanced into the EC
improvement zone and provided further information about the EC performance.
SPT tests were completed continuously over the EC ground improvement zone
with blow counts recorded manually for every 25 mm penetration for 450 mm or
until refusal. SPT energy measurements were recorded for every blow using the
Klohn Crippen Berger SPT analyzer. Samples were tested for fines content, and
blow counts were corrected to equivalent clean sand N160-cs values.
Due to the bouldery ground conditions, an alternate method was sometimes
required to derive N1,60-cs values. The alternate method calculated the blow count
as four times the lowest blow count total for a consecutive 75 mm advance. Silt
corrections were made per Youd et al (2001), and hammer energy and stress
correction factors were applied.
The SPT results generally indicated improvement within the EC zone but due to
the frequent coarse particles, there was significant data scatter, and verification
of the adequacy of the EC ground improvement relied more heavily on the
survey/settlement results for quality assurance.
Results of Environmental Monitoring
Four monitoring wells were installed with screened intervals at nominally 12 m
below the water table immediately downstream of the EC zone. Gundfos pumps
were installed in each well, and water samples taken prior to and following blasts.
Nitrates and ammonia levels were checked using colourimetric tests of these
water samples. As well, for 5 selected blasts, a detailed suite of water sampling
was conducted with laboratory chemical tests completed at an accredited
laboratory. Following several months with all results within compliance levels,
the colourimetric testing was reduced to once per week. Compliance levels were
not exceeded during the EC blasting work.
Conclusions
The explosive compaction of the foundation soils for the new earthfill dam was
carried out successfully, achieving the required degree of compaction with no
damage to surrounding sensitive structures and no service outages to the
Seymour water reservoir. There were no measured impacts to the nearby
salmon hatchery and only minor traces of nitrates were picked up in post-blast
testing of the ground water, all well within compliance limits. Due to the nature of
18. the coarse gravel mixed with boulders, higher charge weights than what would
normally be used in sandy material had to be used. The near surface zone was
compacted using dynamic compaction techniques. The combination of the two
complimentary techniques resulted in an overall average settlement over the 20
meter depth of 600mm, indicating approximately 5-10% increase in relative
density. The newly constructed dam brings the facility into full compliance with
the Canadian Dam Association earthquake safety guidelines.
List of References
Canadian Dam Association (1999), “Dam Safety Guidelines”
Elliott, R., Otto, D. (1994), “Blast Densification to Prevent Soil Liquefaction in Volcanic
Avalanche Debris for Construction of the Coldwater Creek Bridge, Mount St. Helens”
20th
Annual Conference of Explosives and Blasting Technique, International Society of
Explosives Engineers
Elliott, R., Hatch, E., Otto, D. (2000), “Molikpaq Blast Densification Project –
Sakhalin Island, Russia” 26th
Annual Conference on Explosives and Blasting
Technique, International Society of Explosives Engineers
Gohl, W.B., Jefferies, M.G., Howie, J.A., Diggle, D. (2000), “Explosive
Compaction: Design, Implementation and Effectiveness”, Geotechnique, vol. 50,
no. 6, pp. 657-665
Gohl, W.B., Howie, J.A., Everard, J. (1996), “Use of Explosive Compaction for
Dam Foundation Preparation”, 49th
Canadian Geotechnical Conference, St.
John’s, Nfld.
Murray, L., Singh, N., Huber, F., Siu, D. (2005), “Seismic Upgrade of the
Seymour Falls Dam Using Explosive Compaction and Dynamic Compaction”,
ASDSO (Dam Safety) 2005, Orlando, Fl.
Murray, L., Singh, N., Huber, F., Siu, D. (2006). “Explosive Compaction for the
Seymour Falls Dam Seismic Upgrade” Proceedings of the 59th
Canadian
Geotechnical Conference.
Singh, N., Murray, L., Huber, F., Gant, M. (2008), “Case History – Seismic
Upgrade of the Seymour Falls Dam”, Geo-Edmonton ’08, 61st
Canadian
Geotechnical Conference and 9th
Joint CGS/IAH-CNC Groundwater Conference,
Edmonton Alberta.
Siu, D., Huber, F., Murray, L.M., Lozinski, W. (2004). “Seismic Upgrade of the
Seymour Falls Dam Design Phase.” 13th
World Conference on Earthquake
Engineering, Paper No. 994.