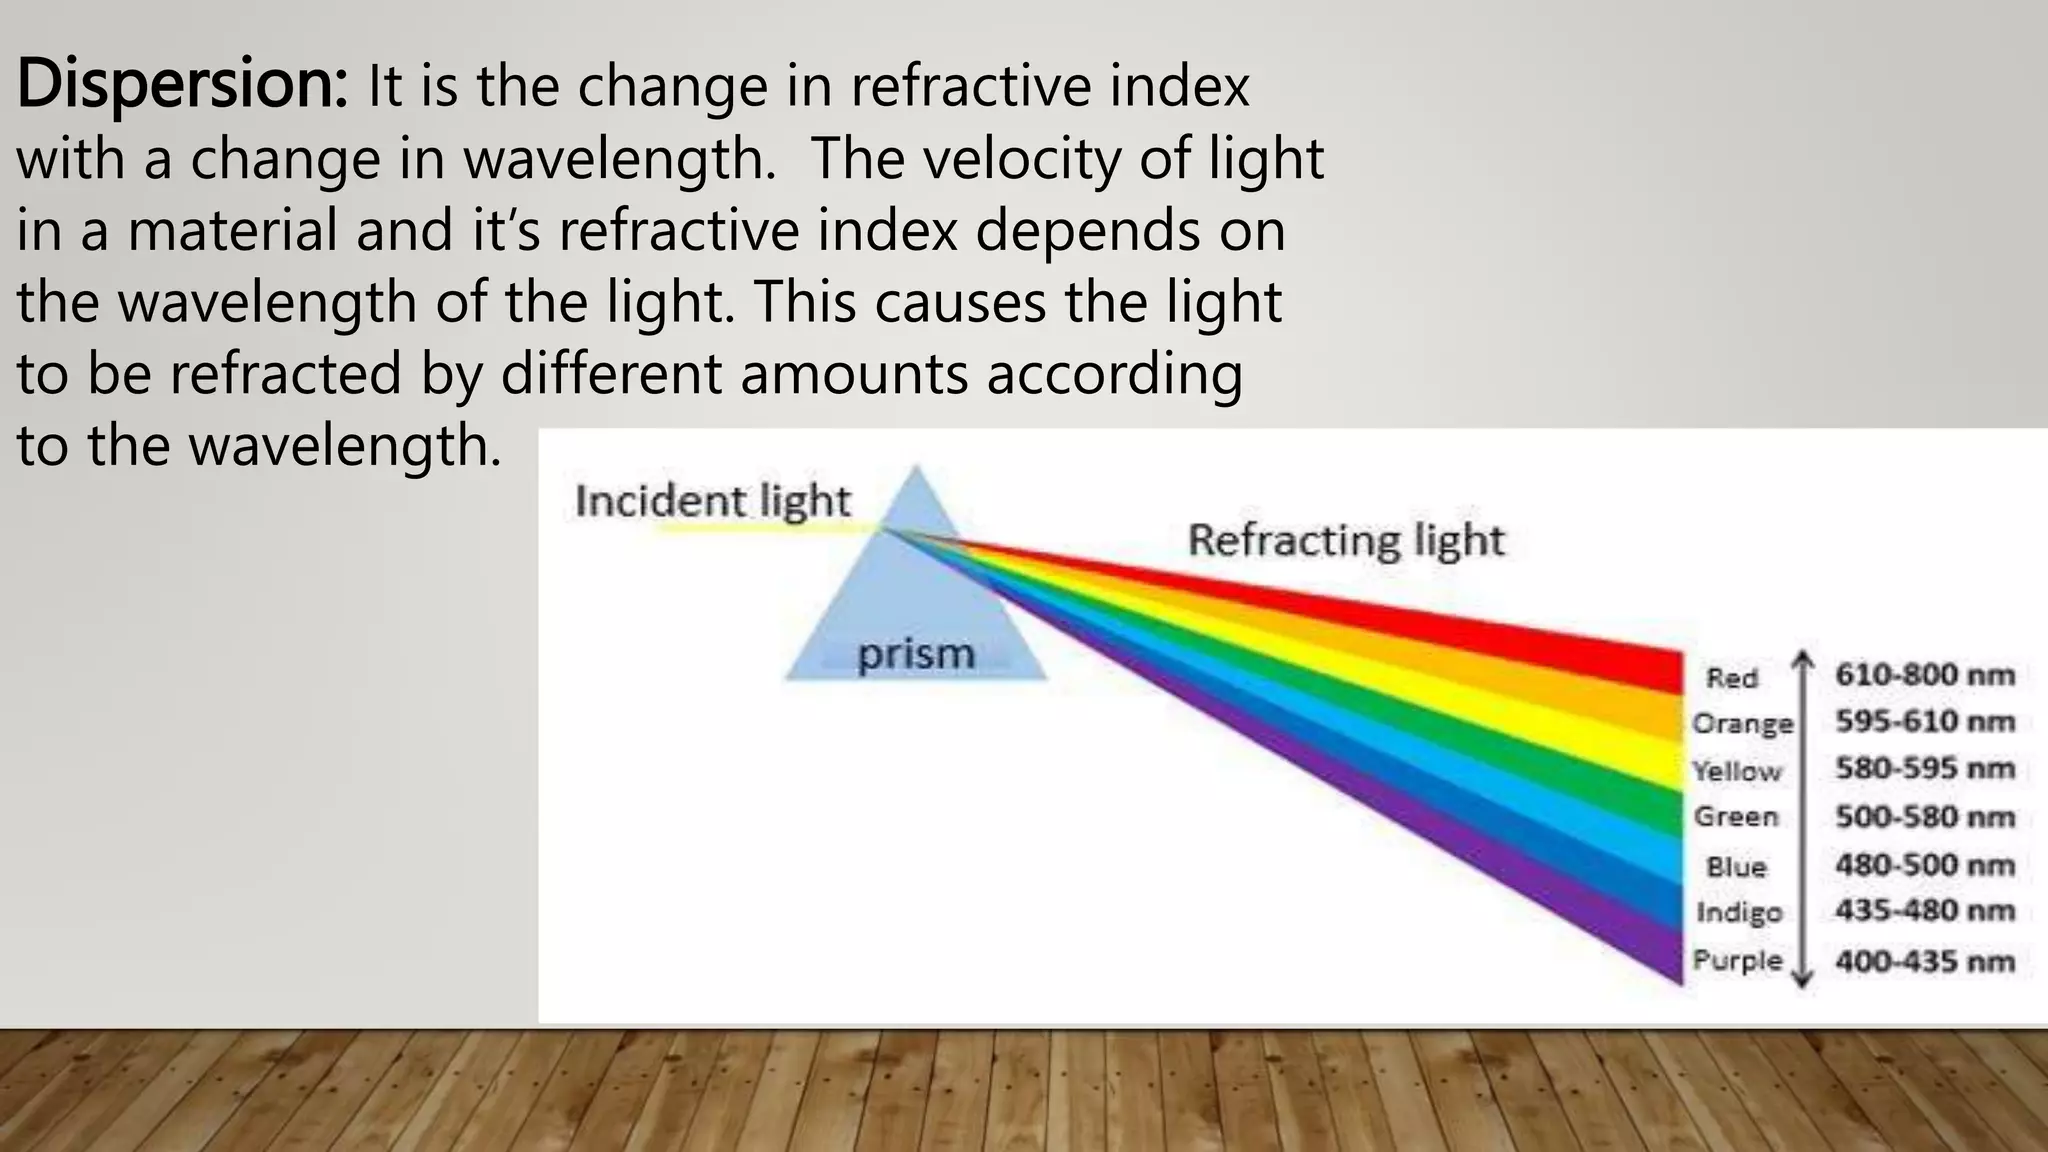
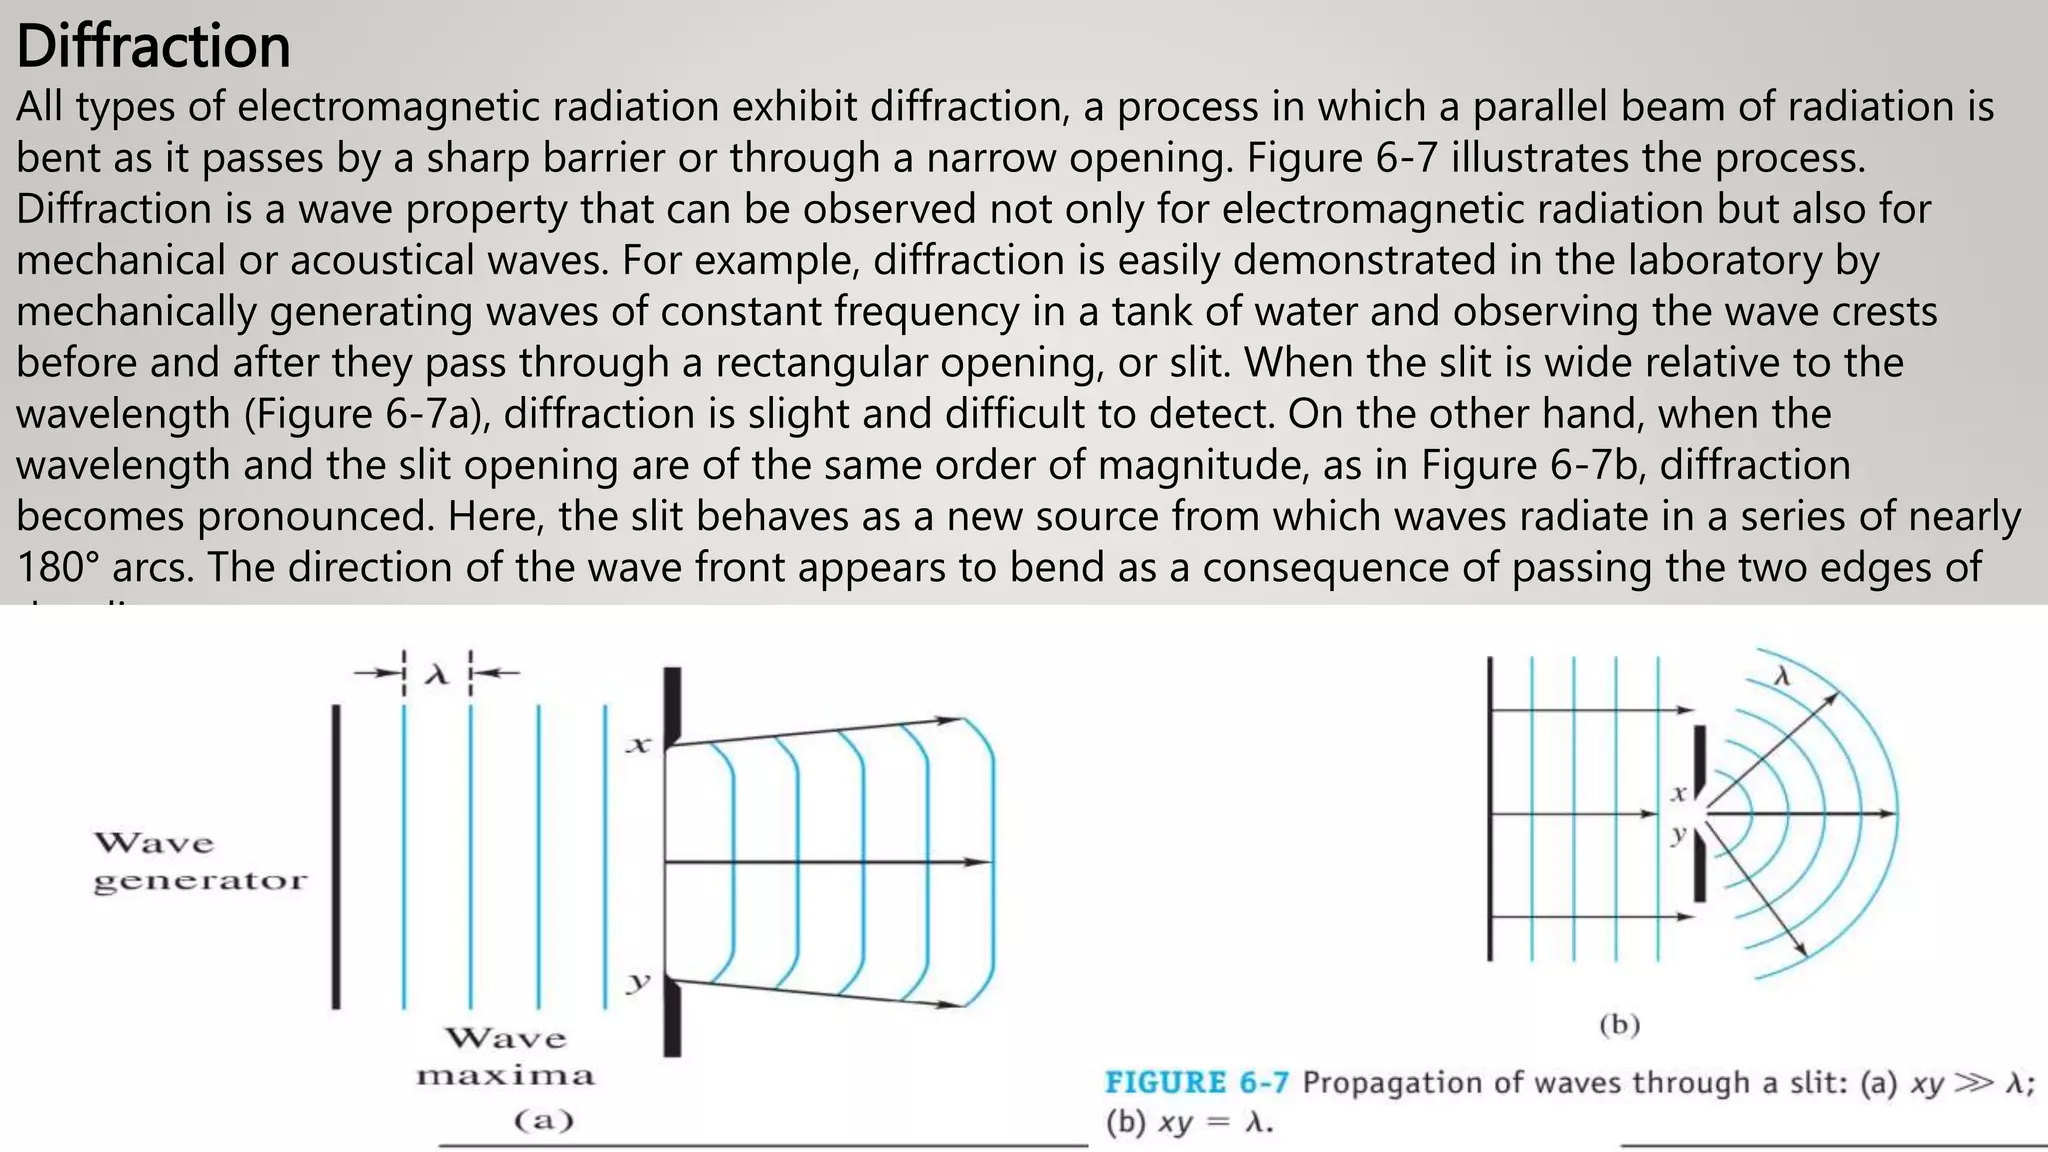
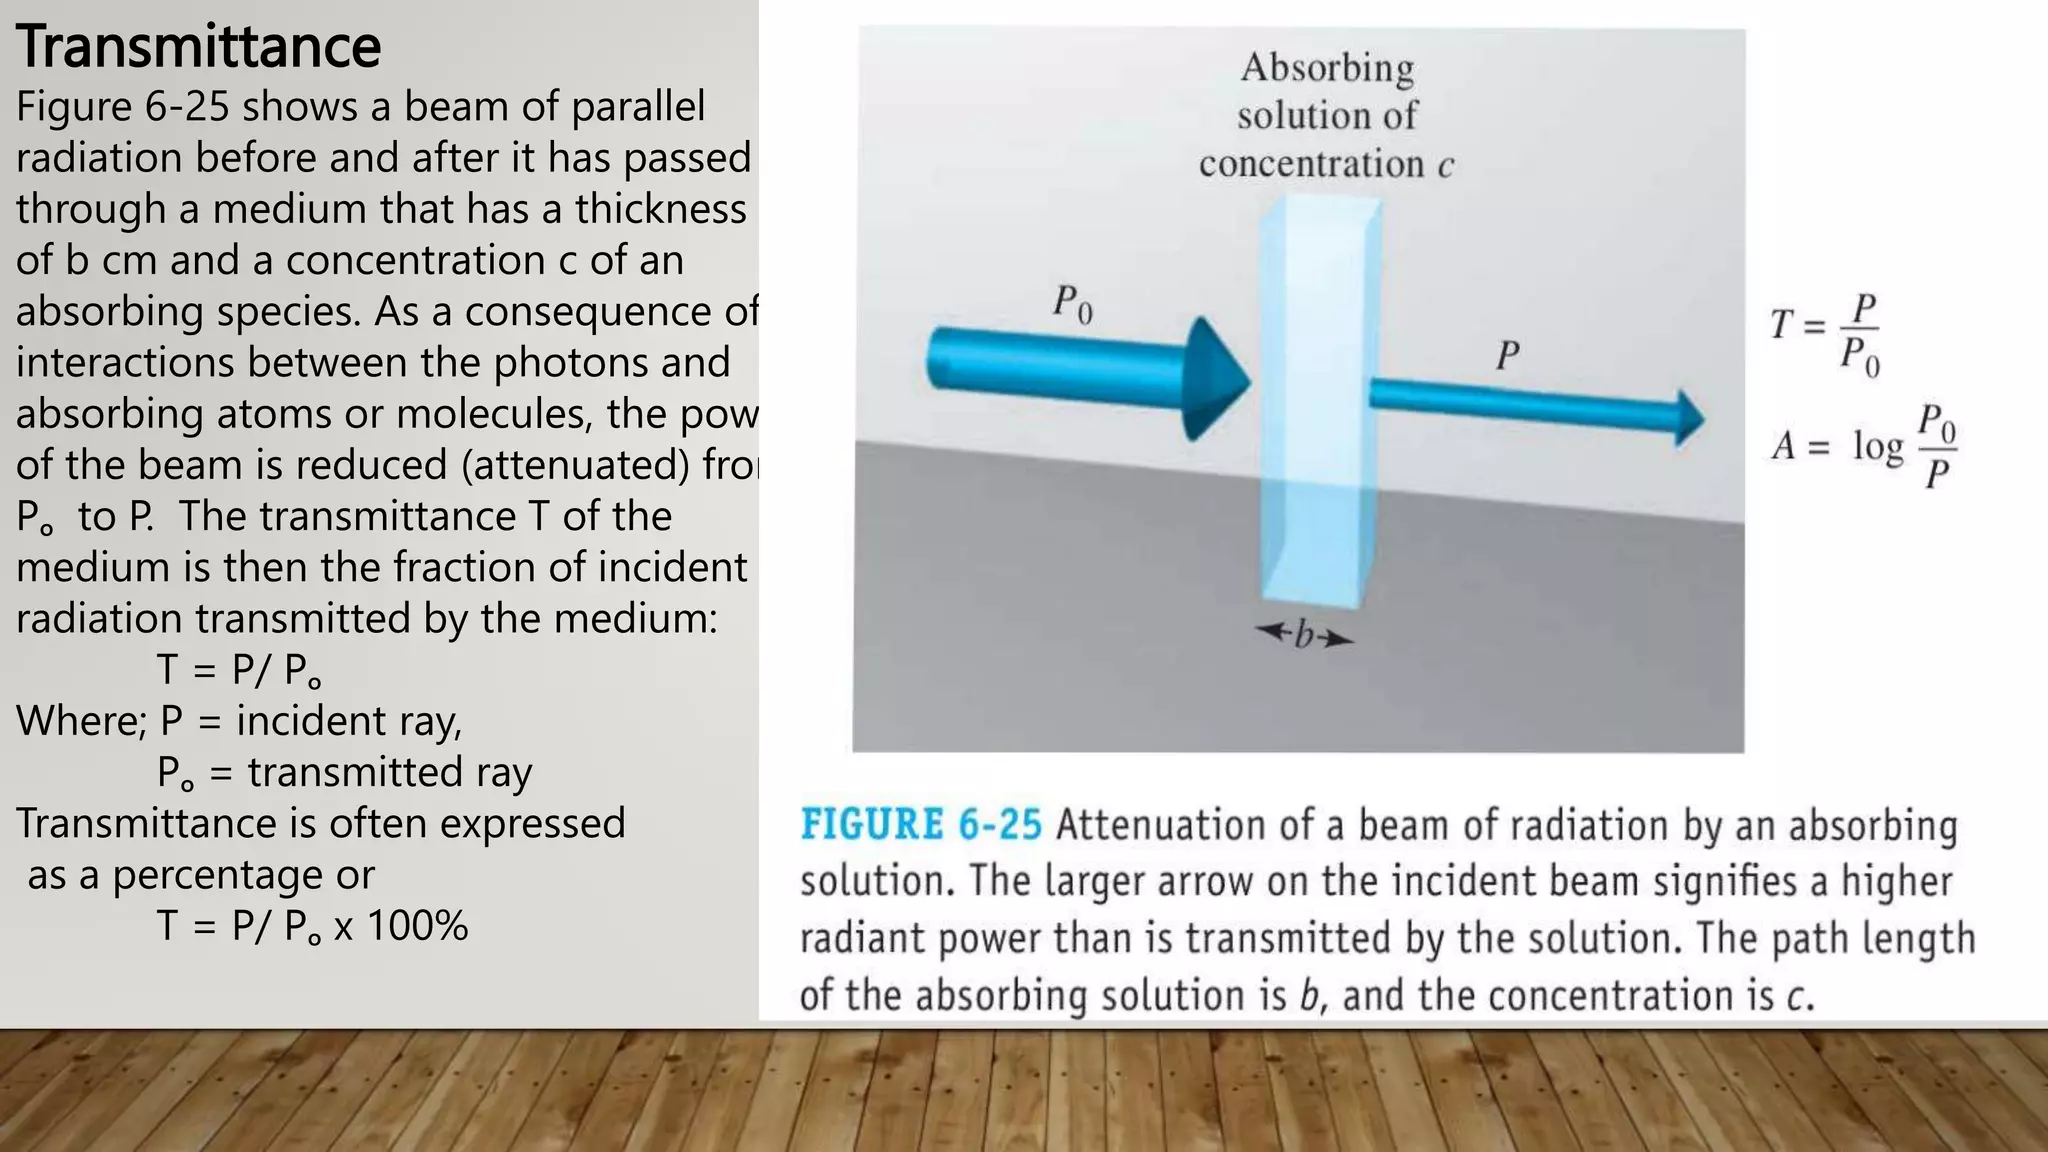
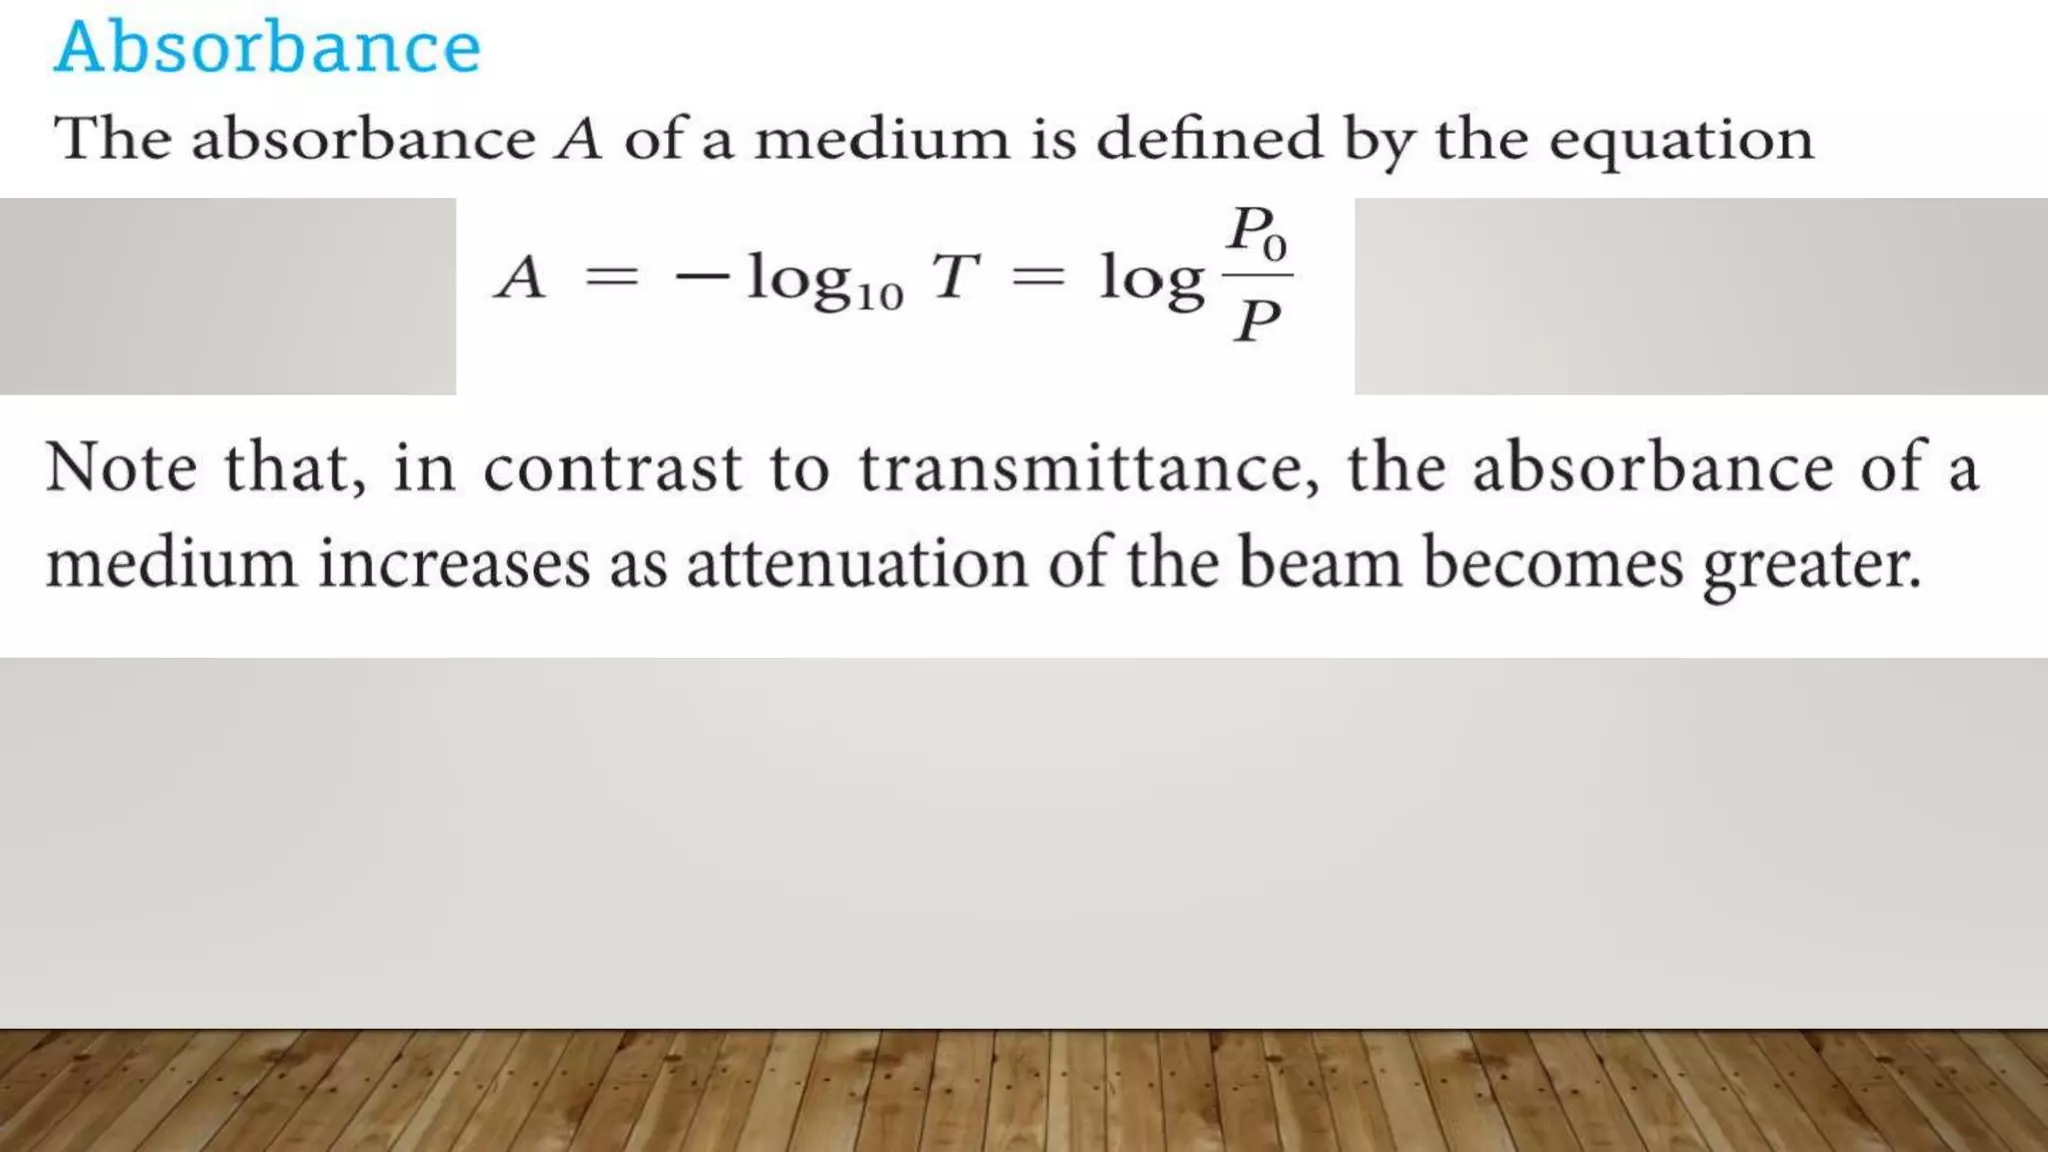
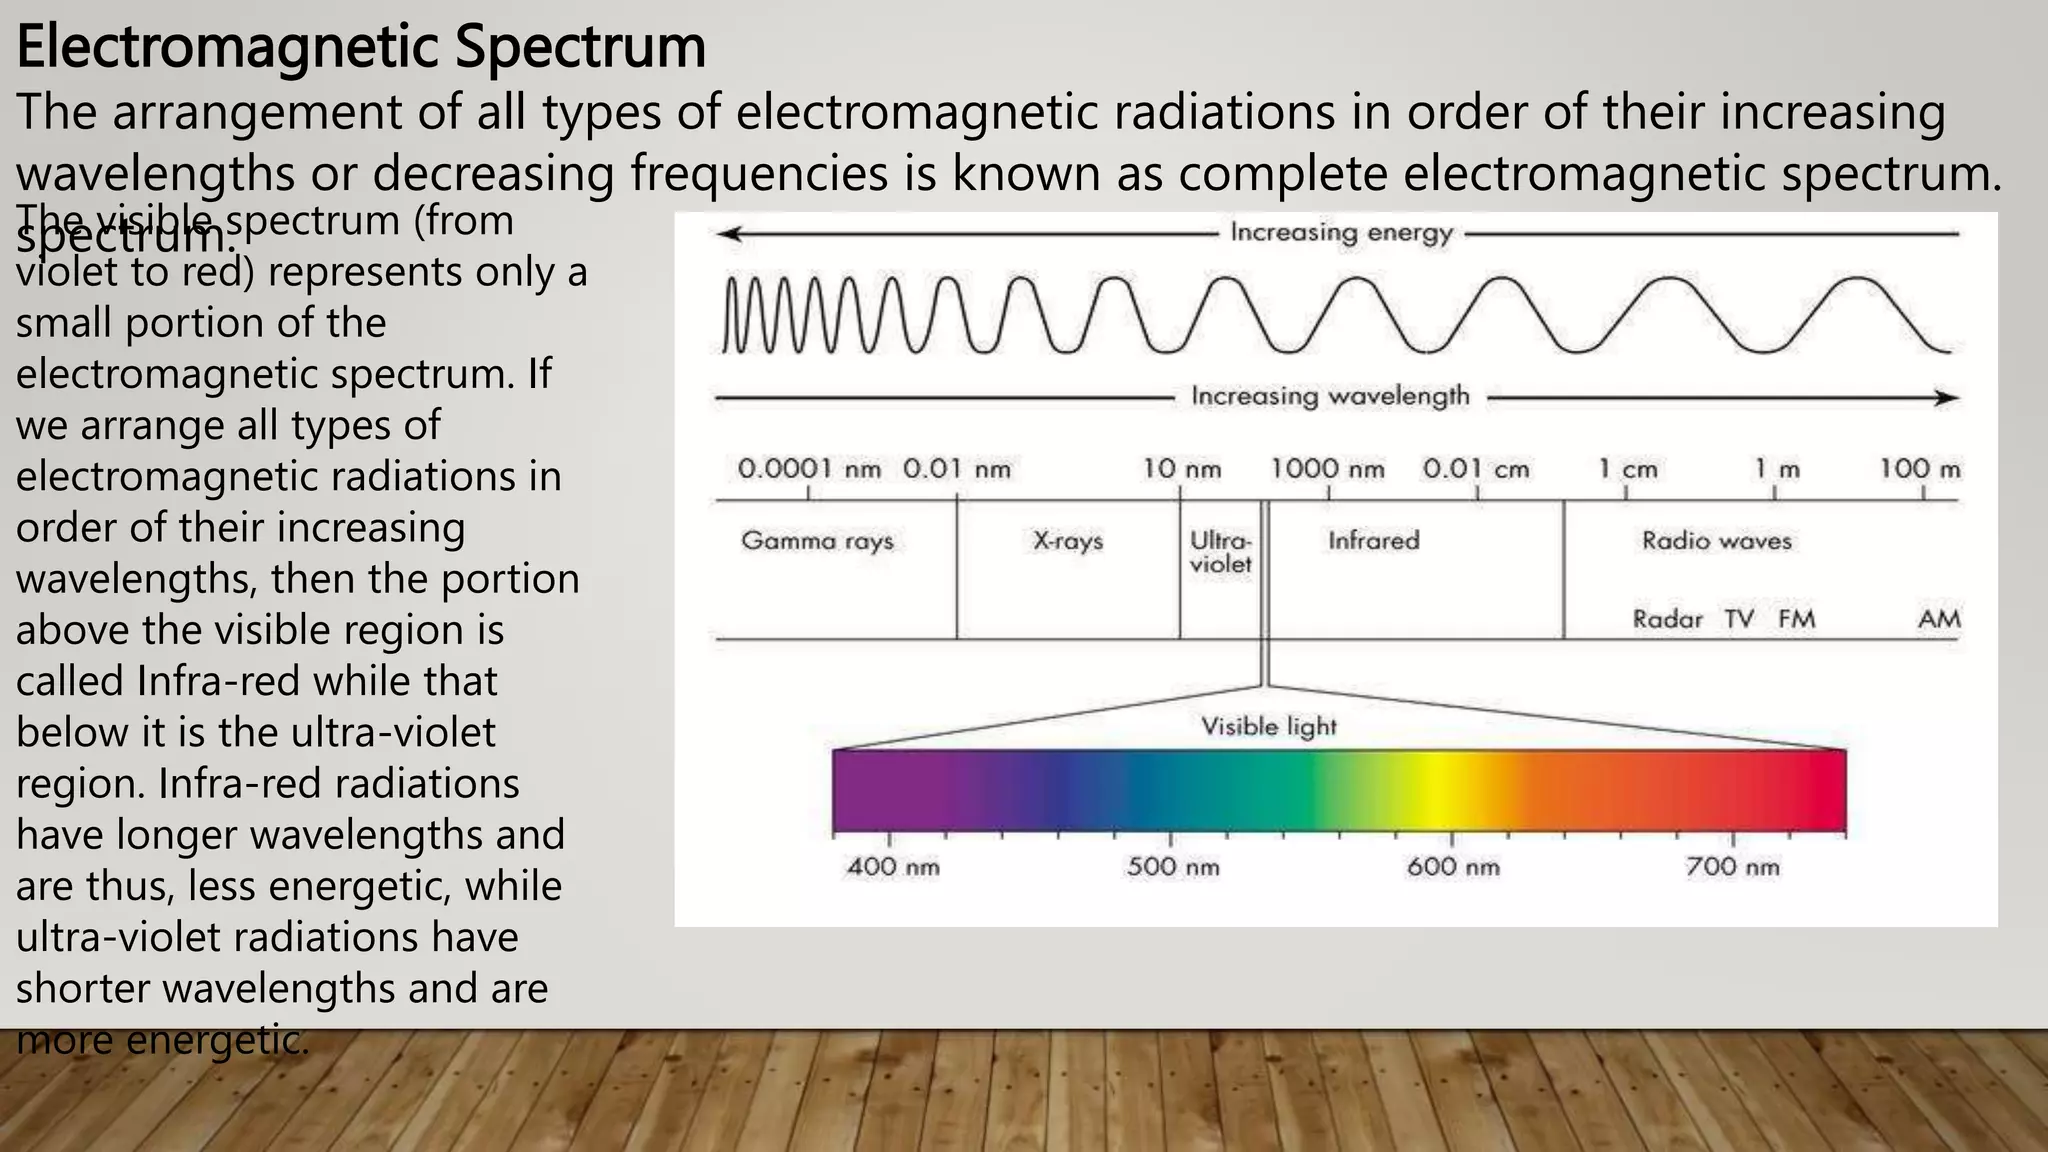
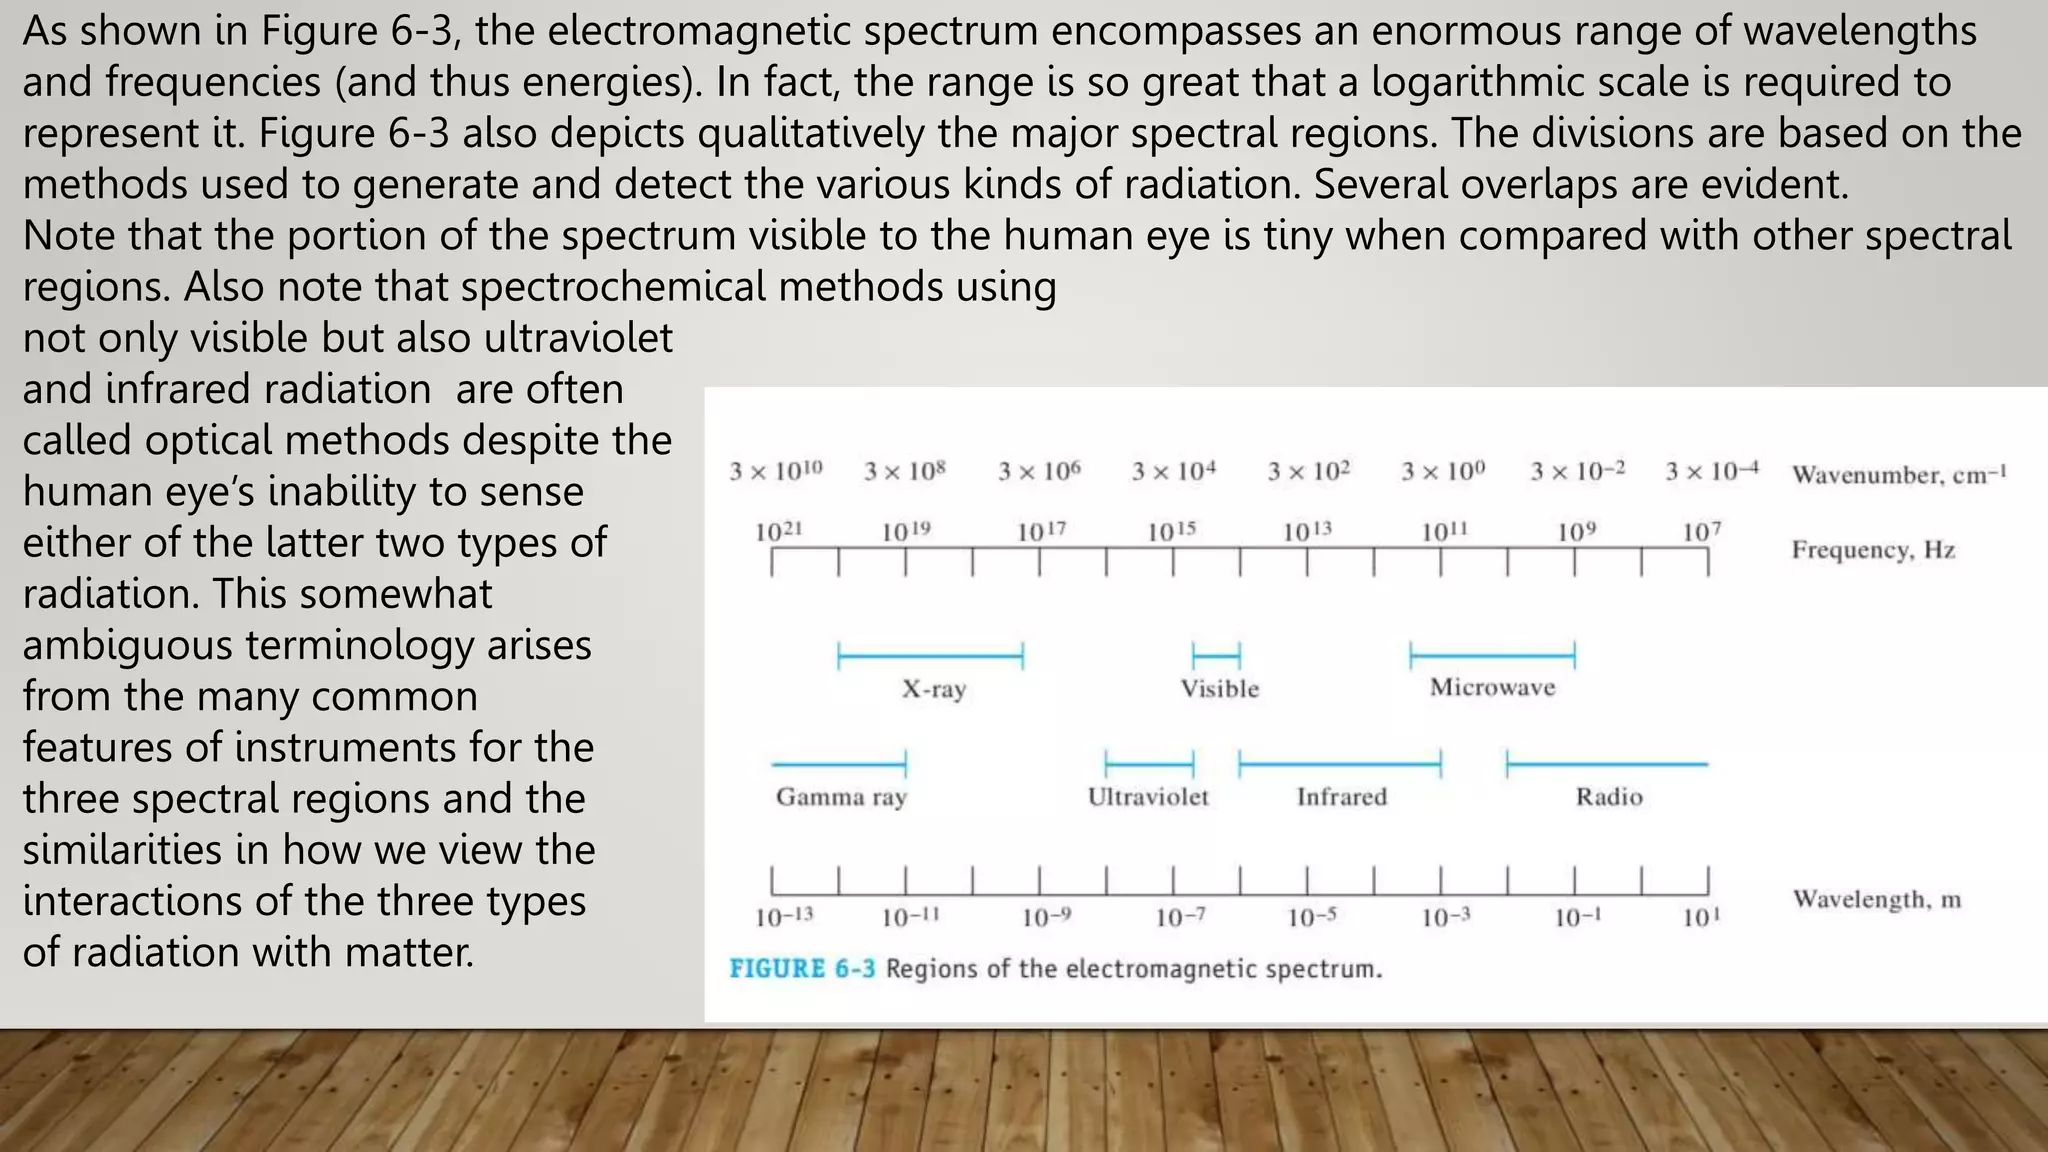
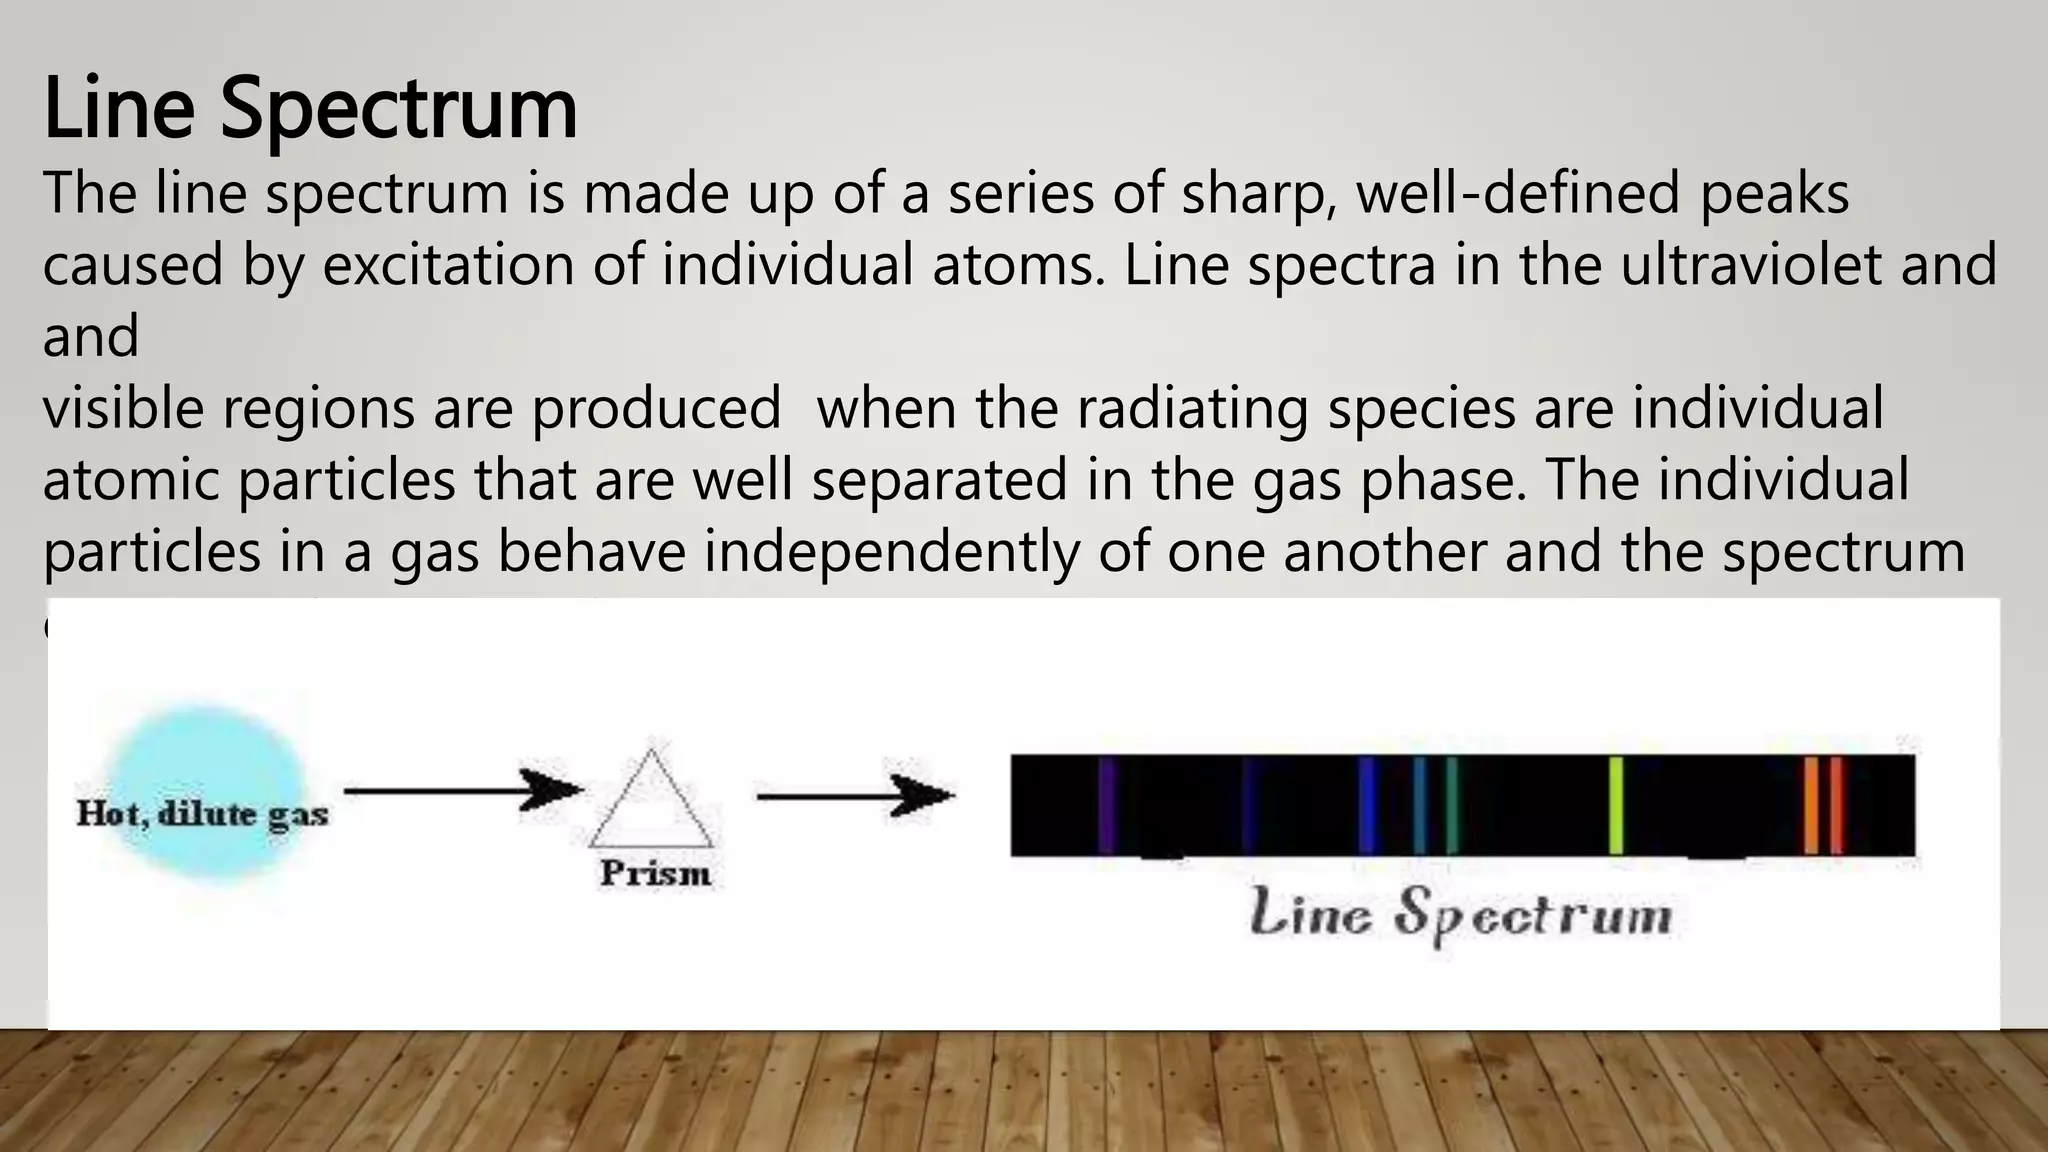
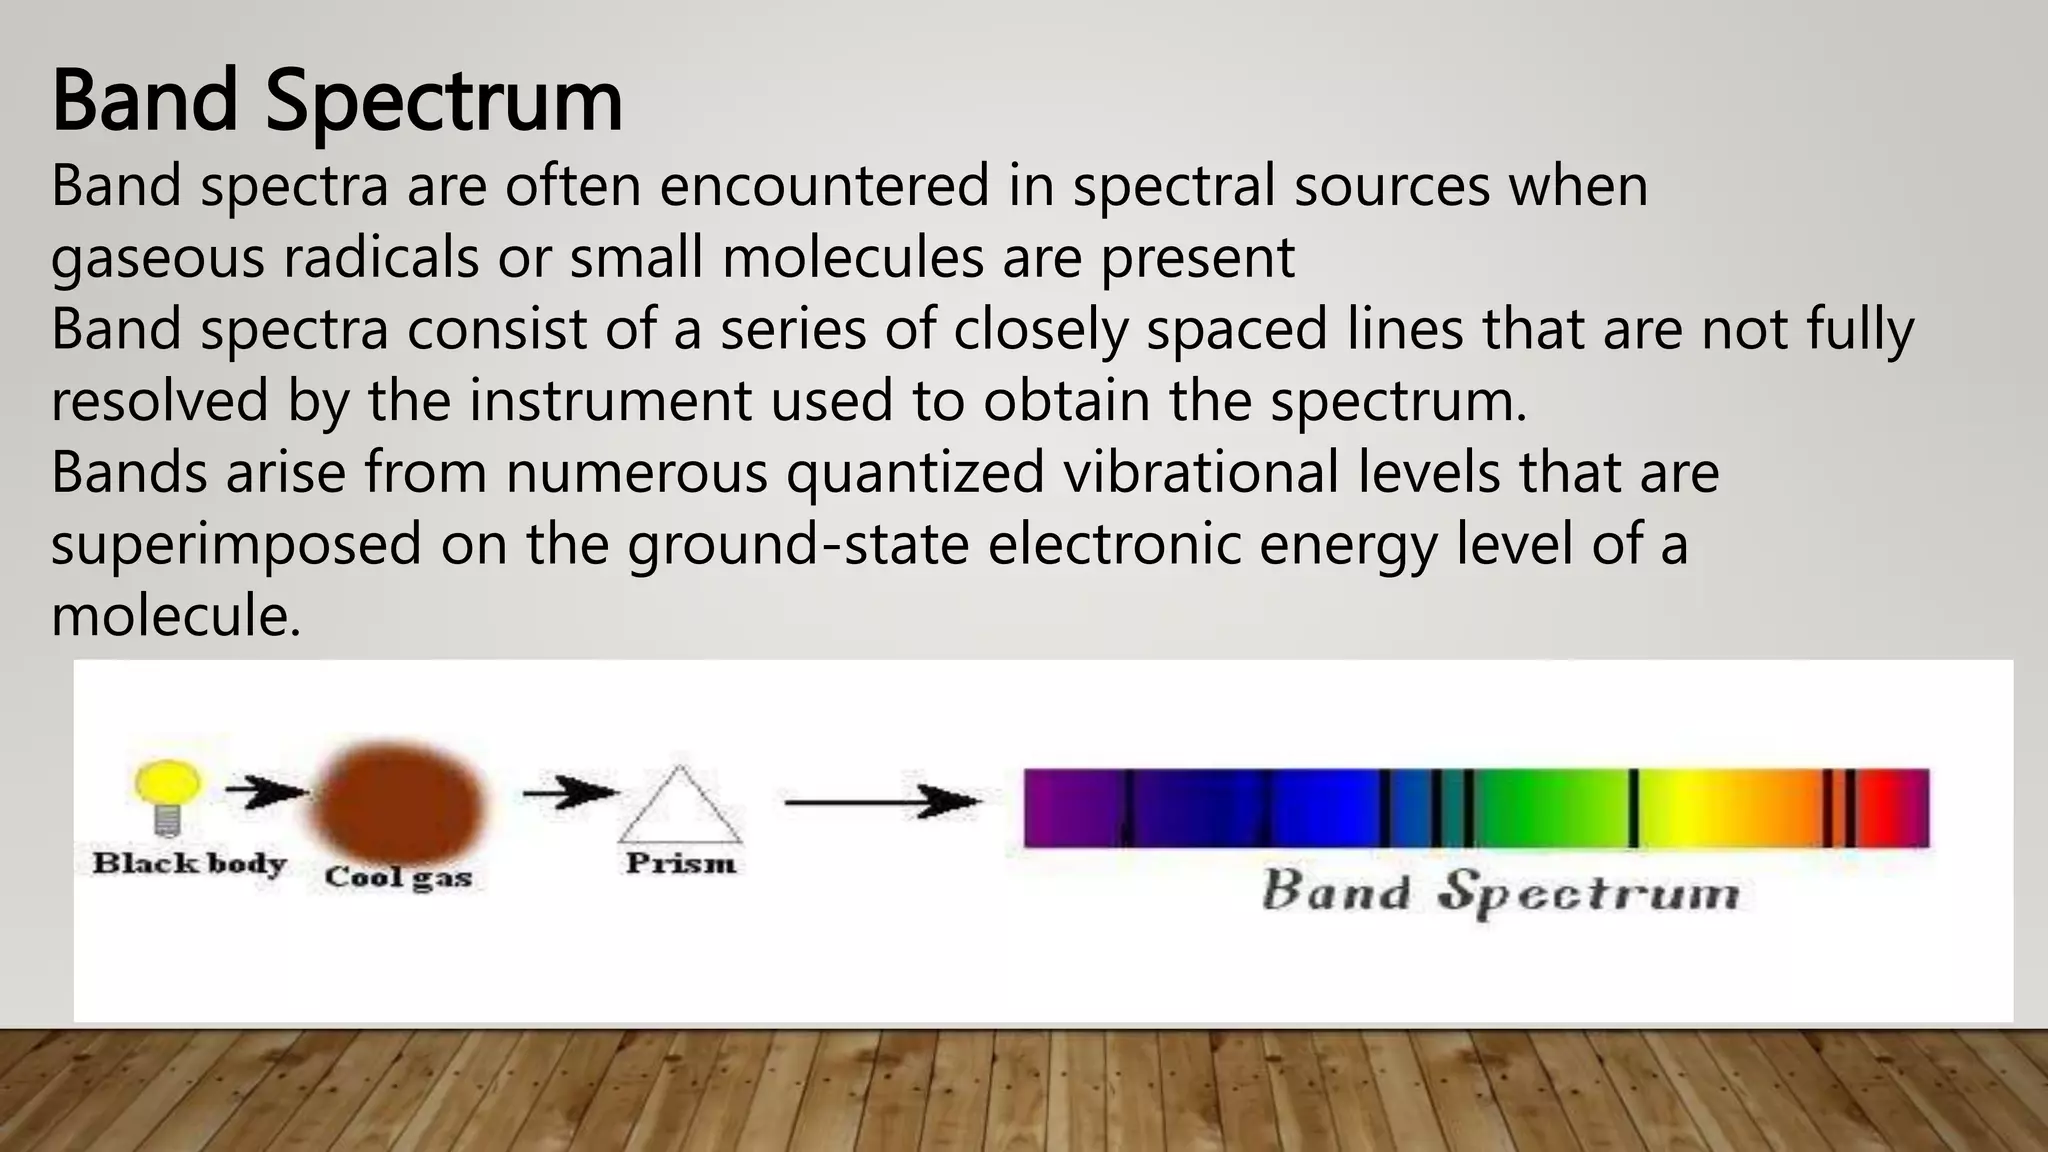
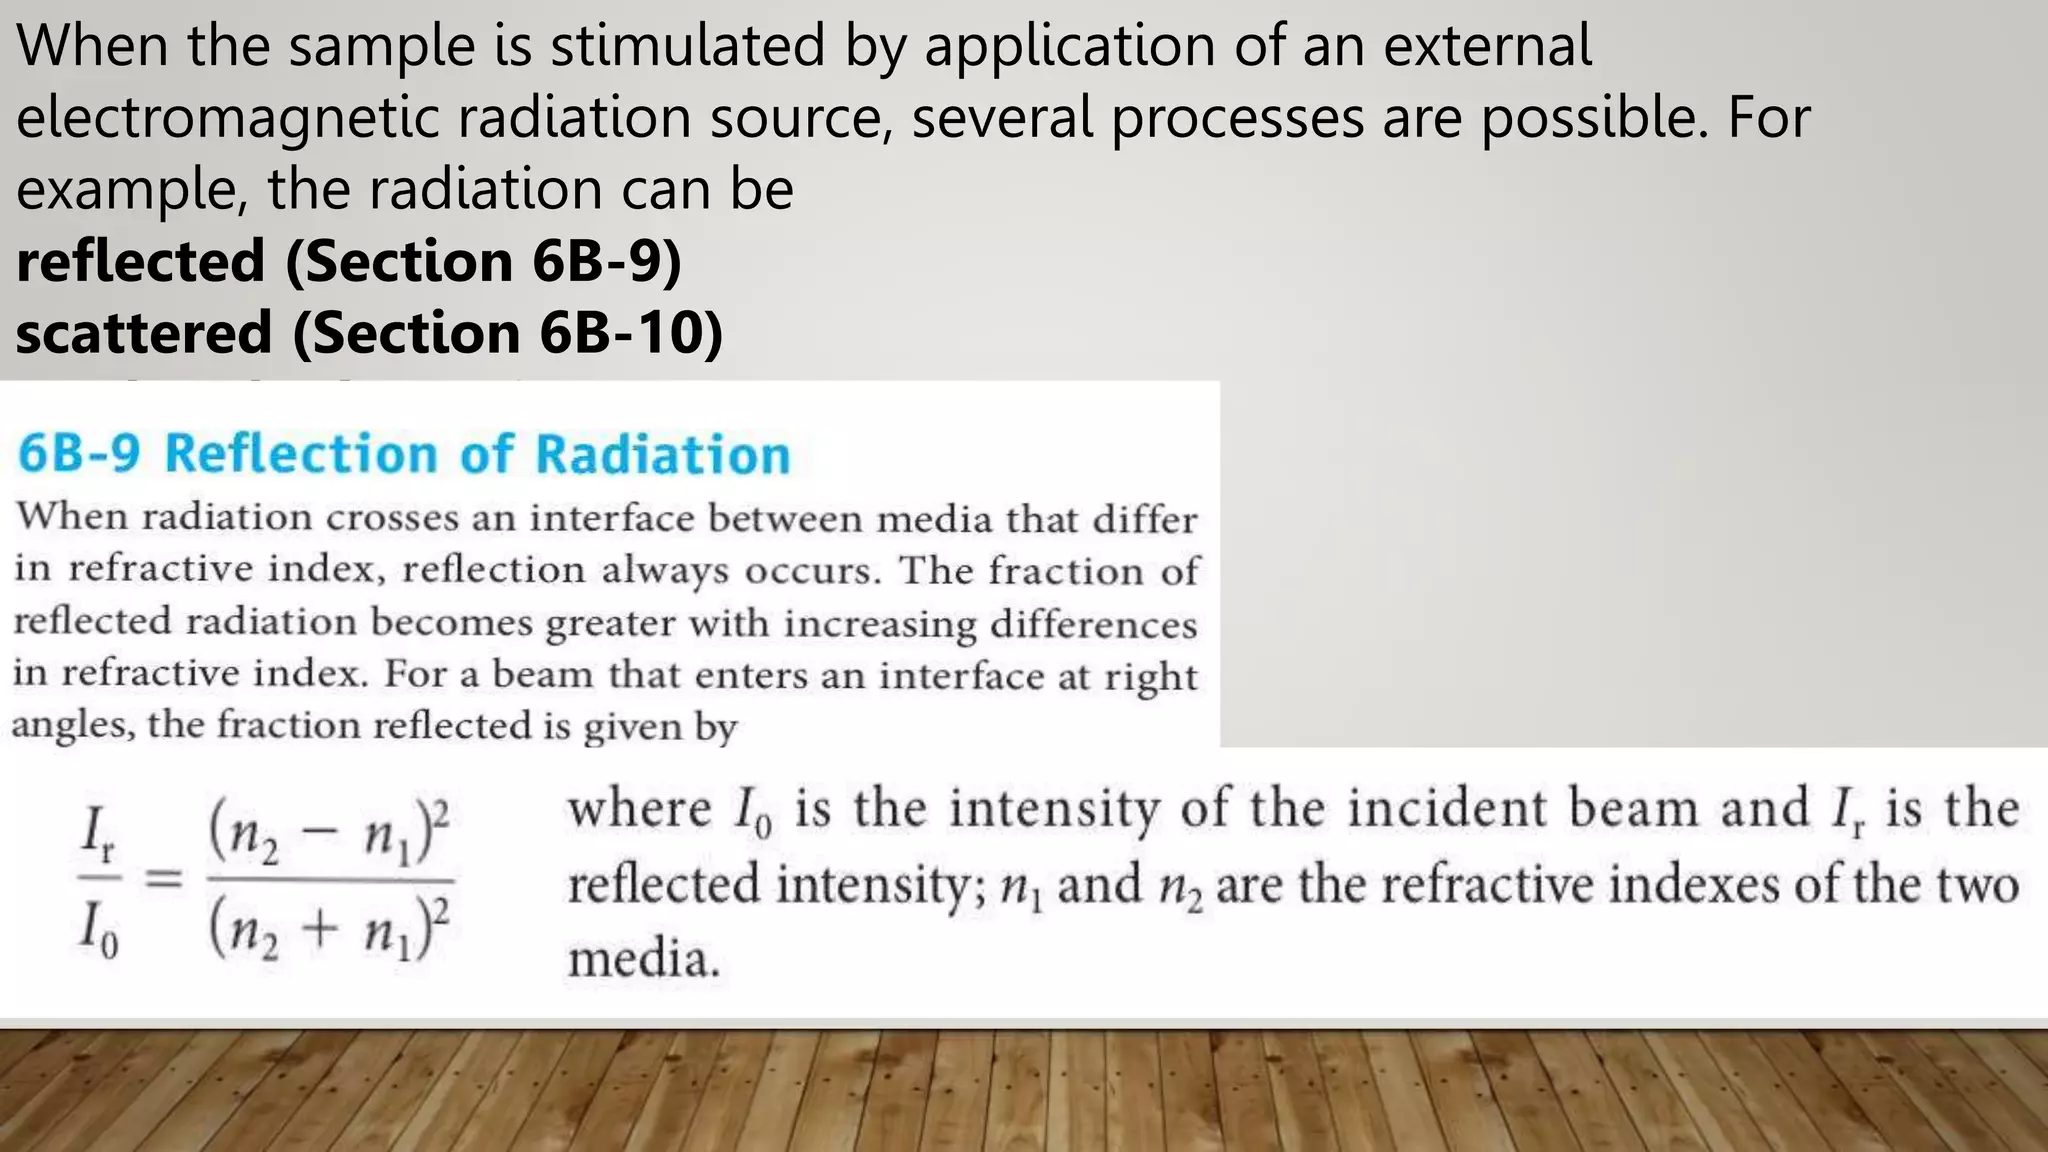
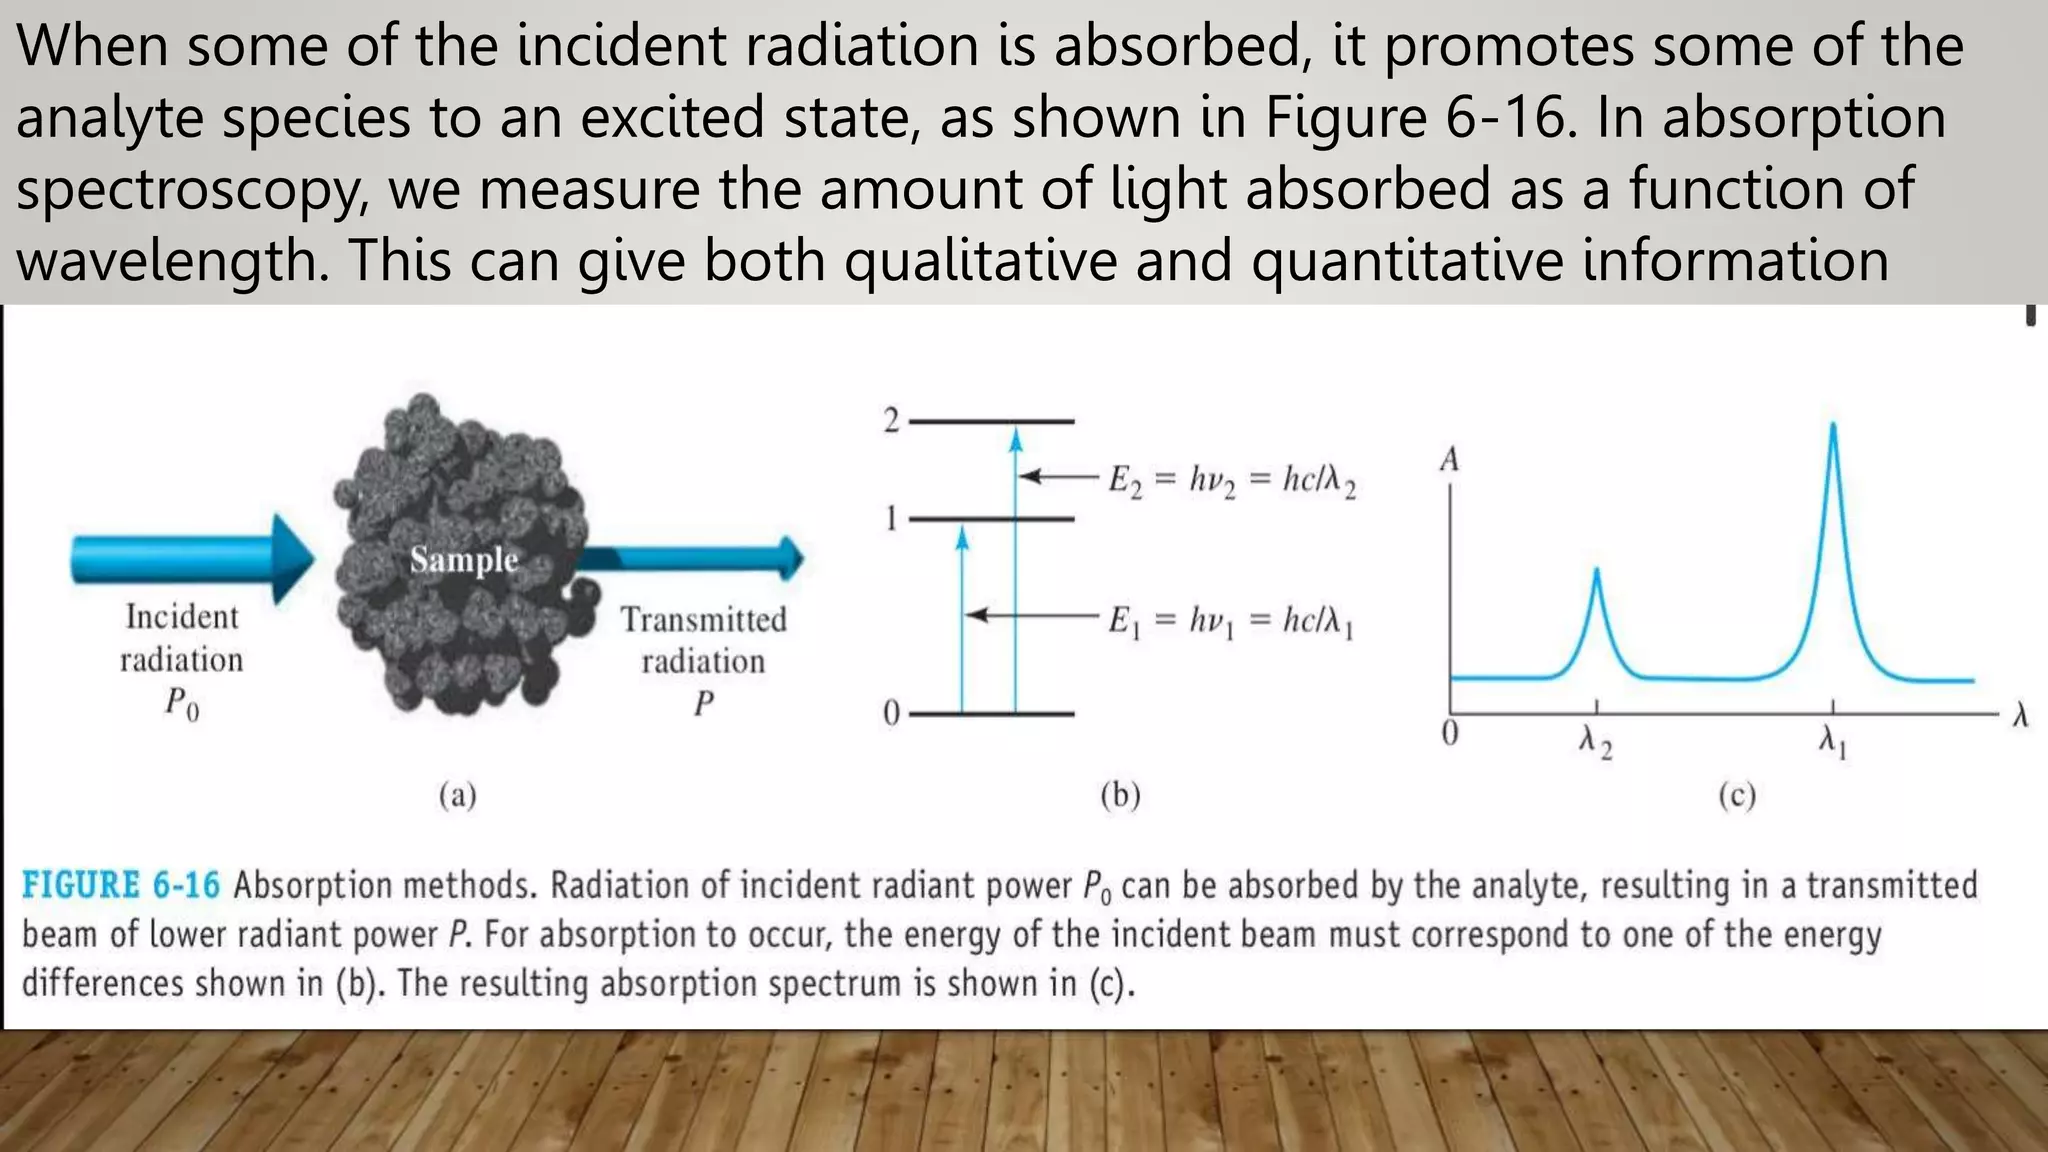
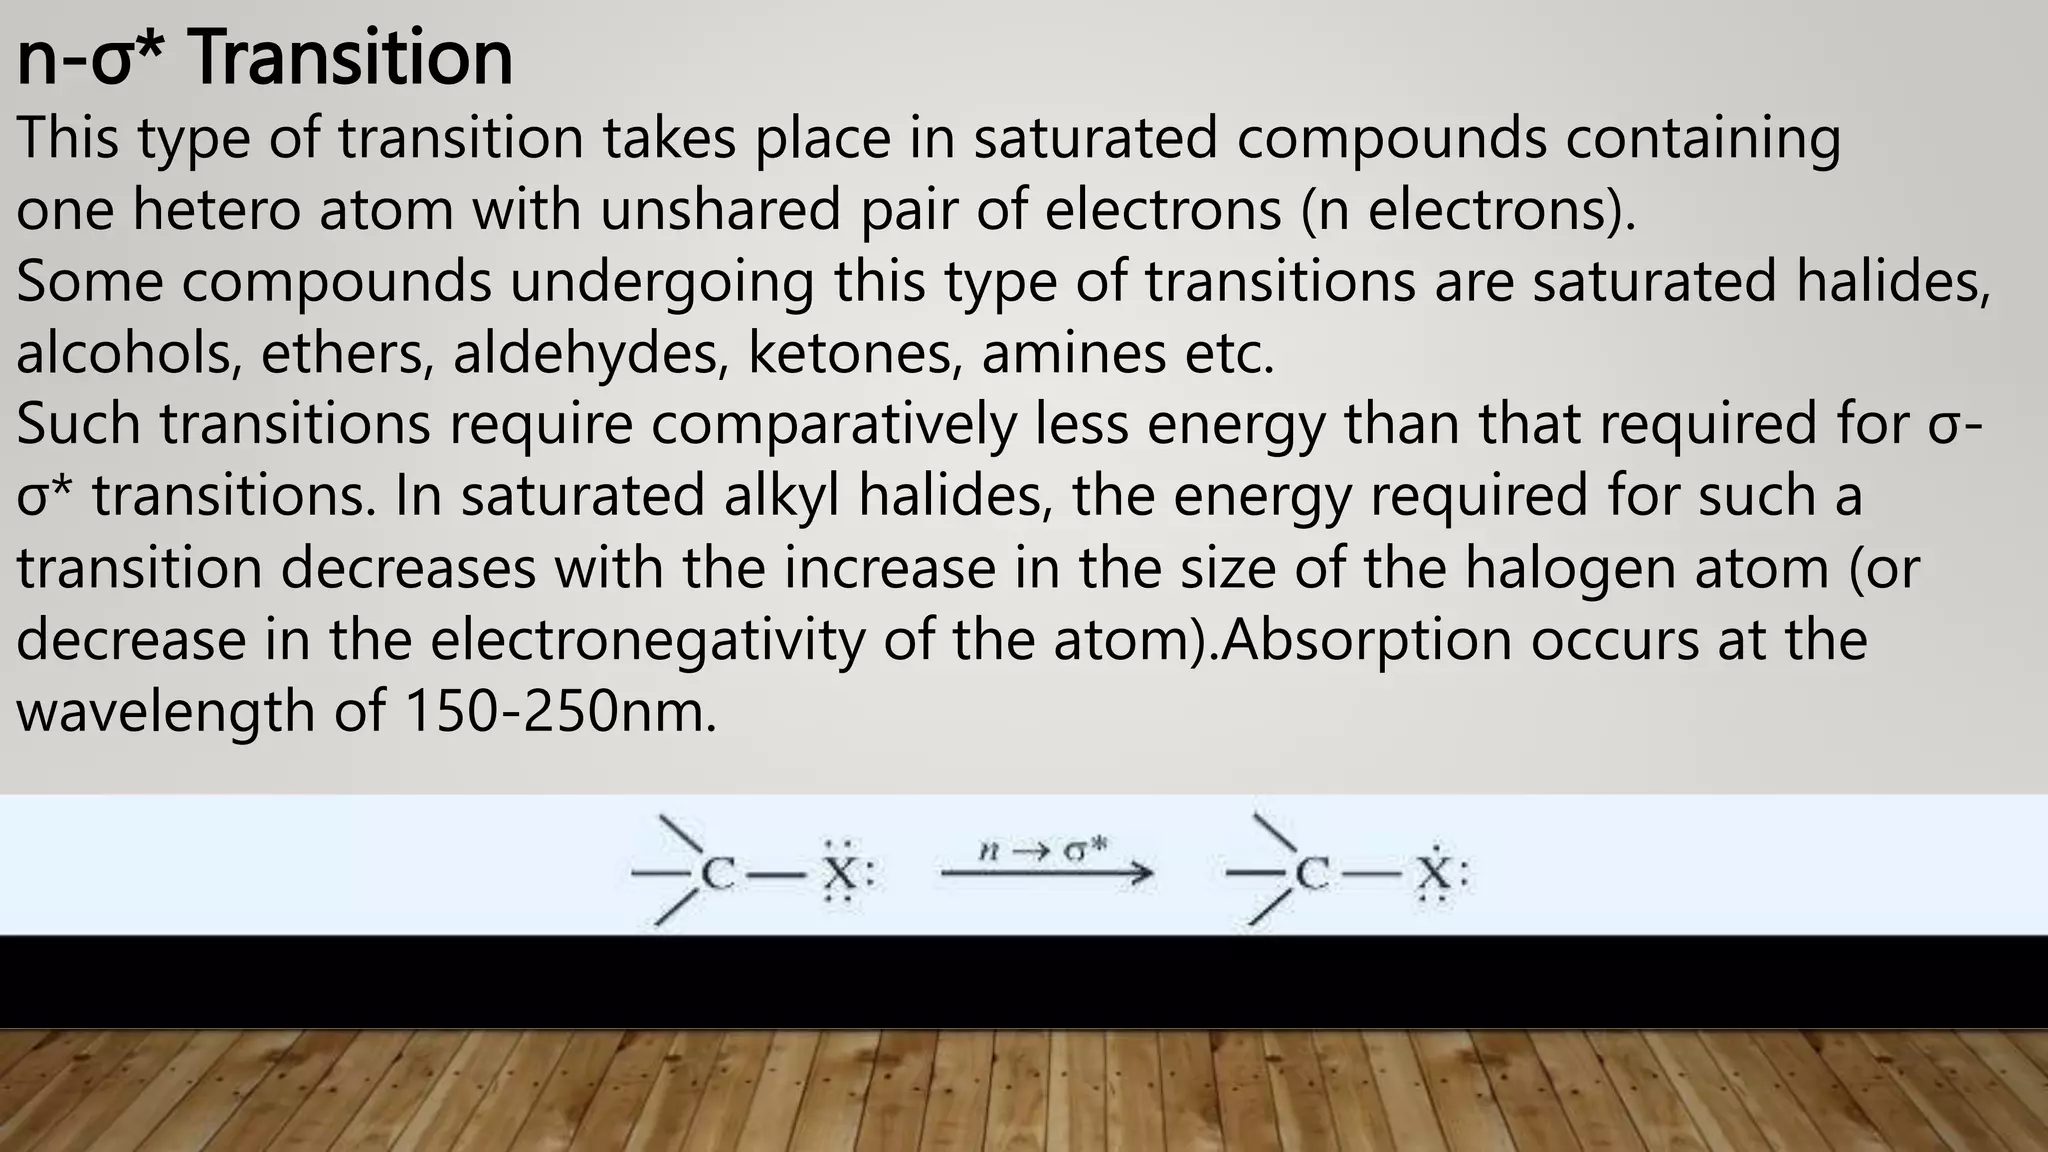
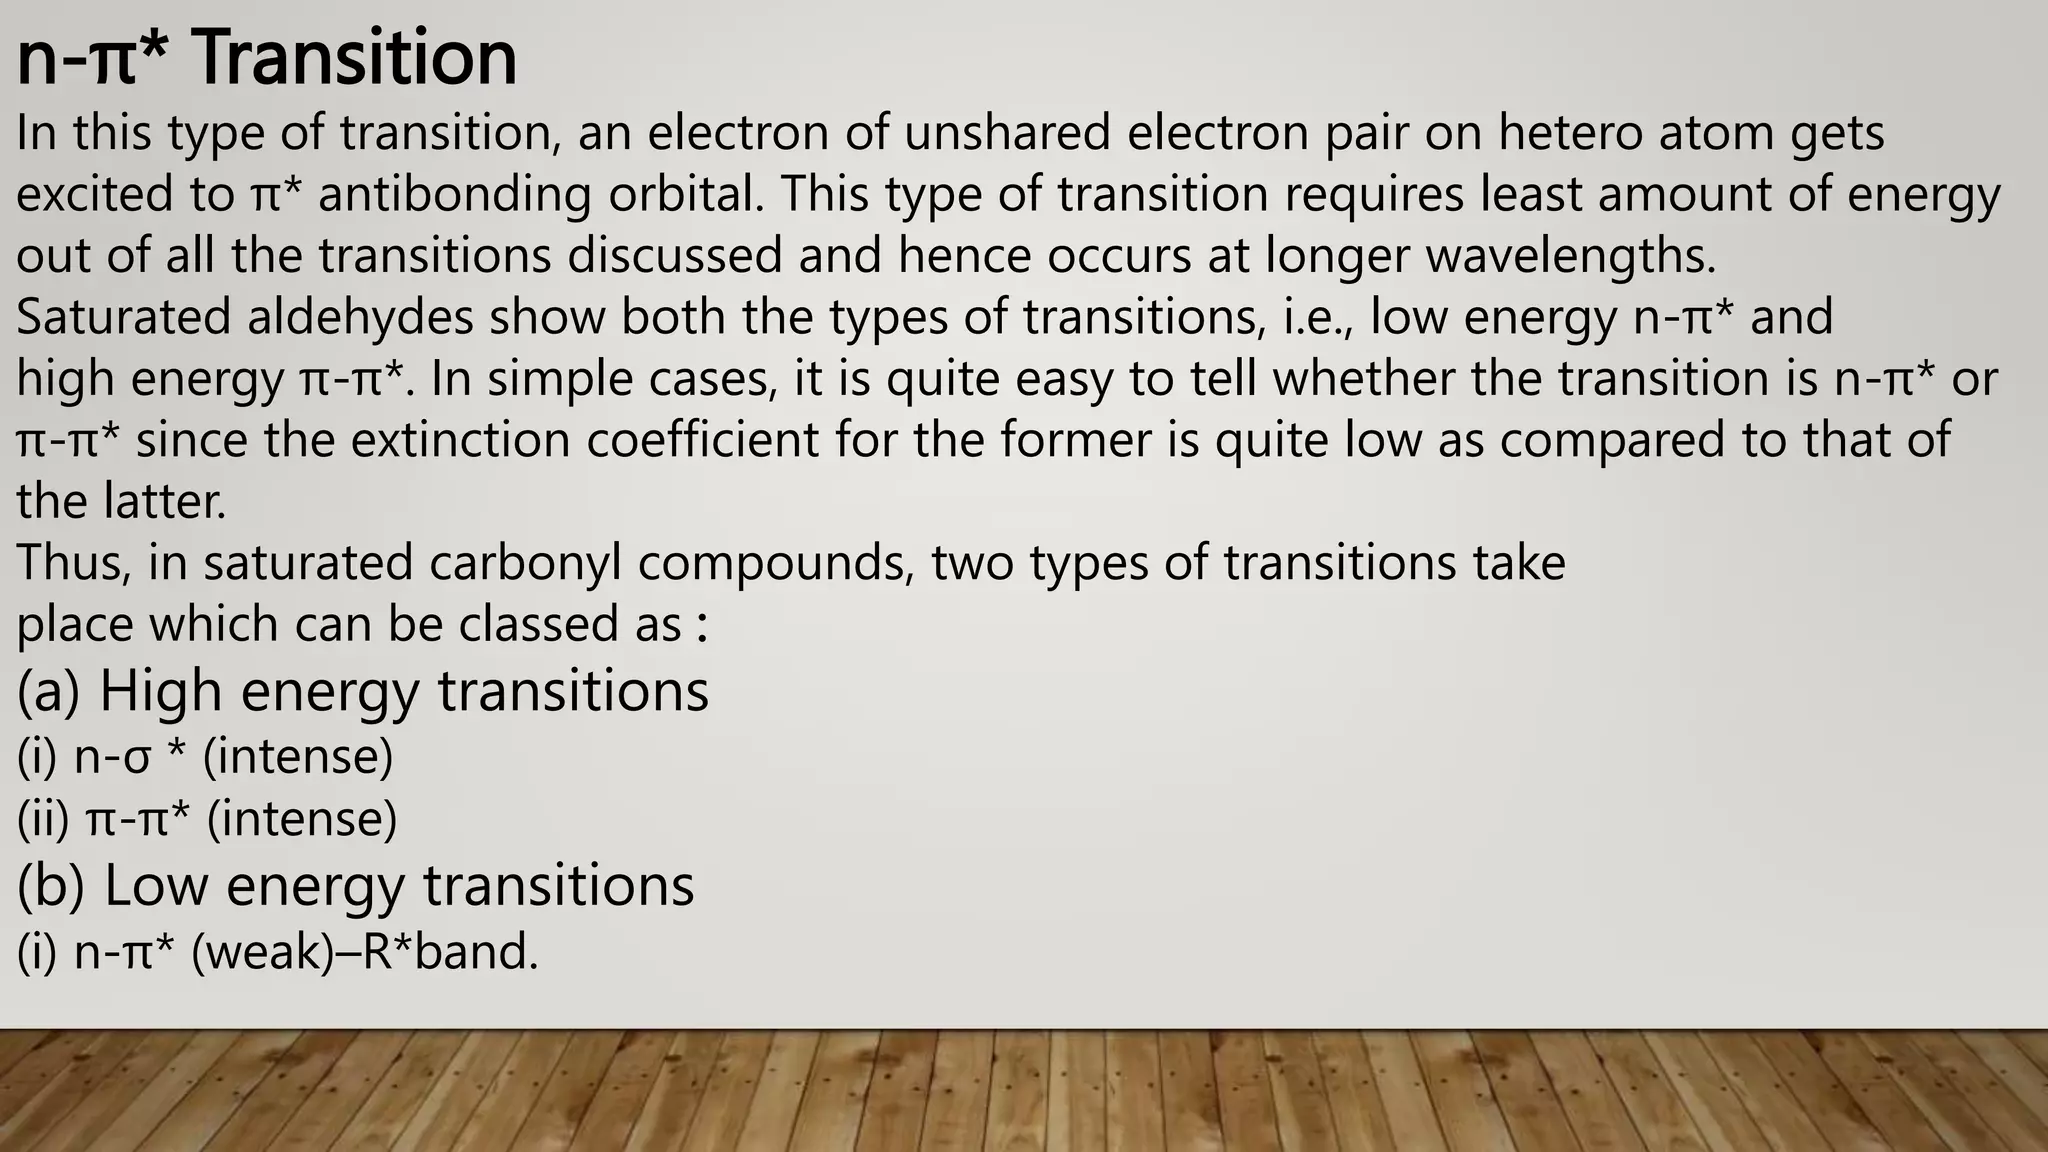
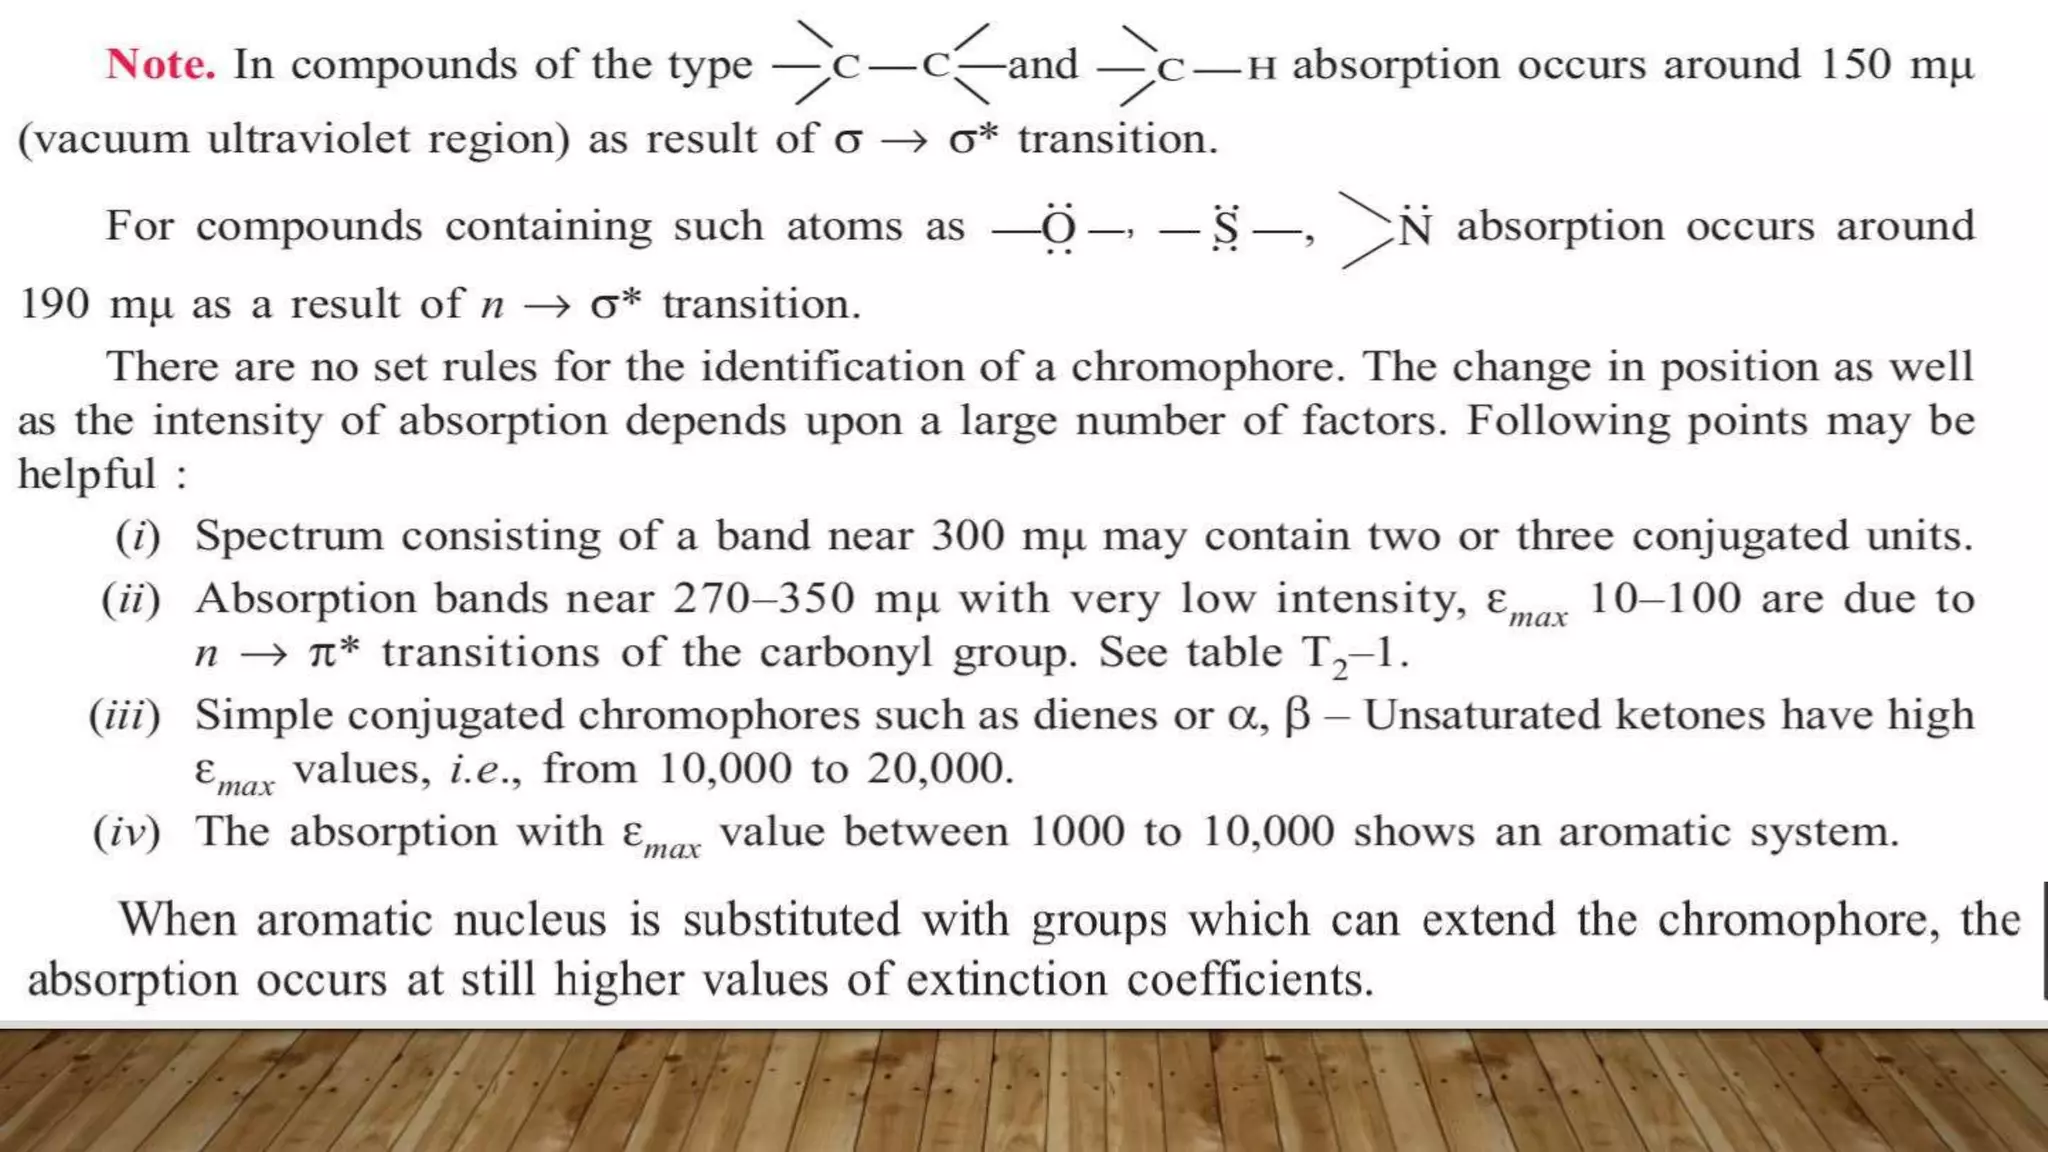
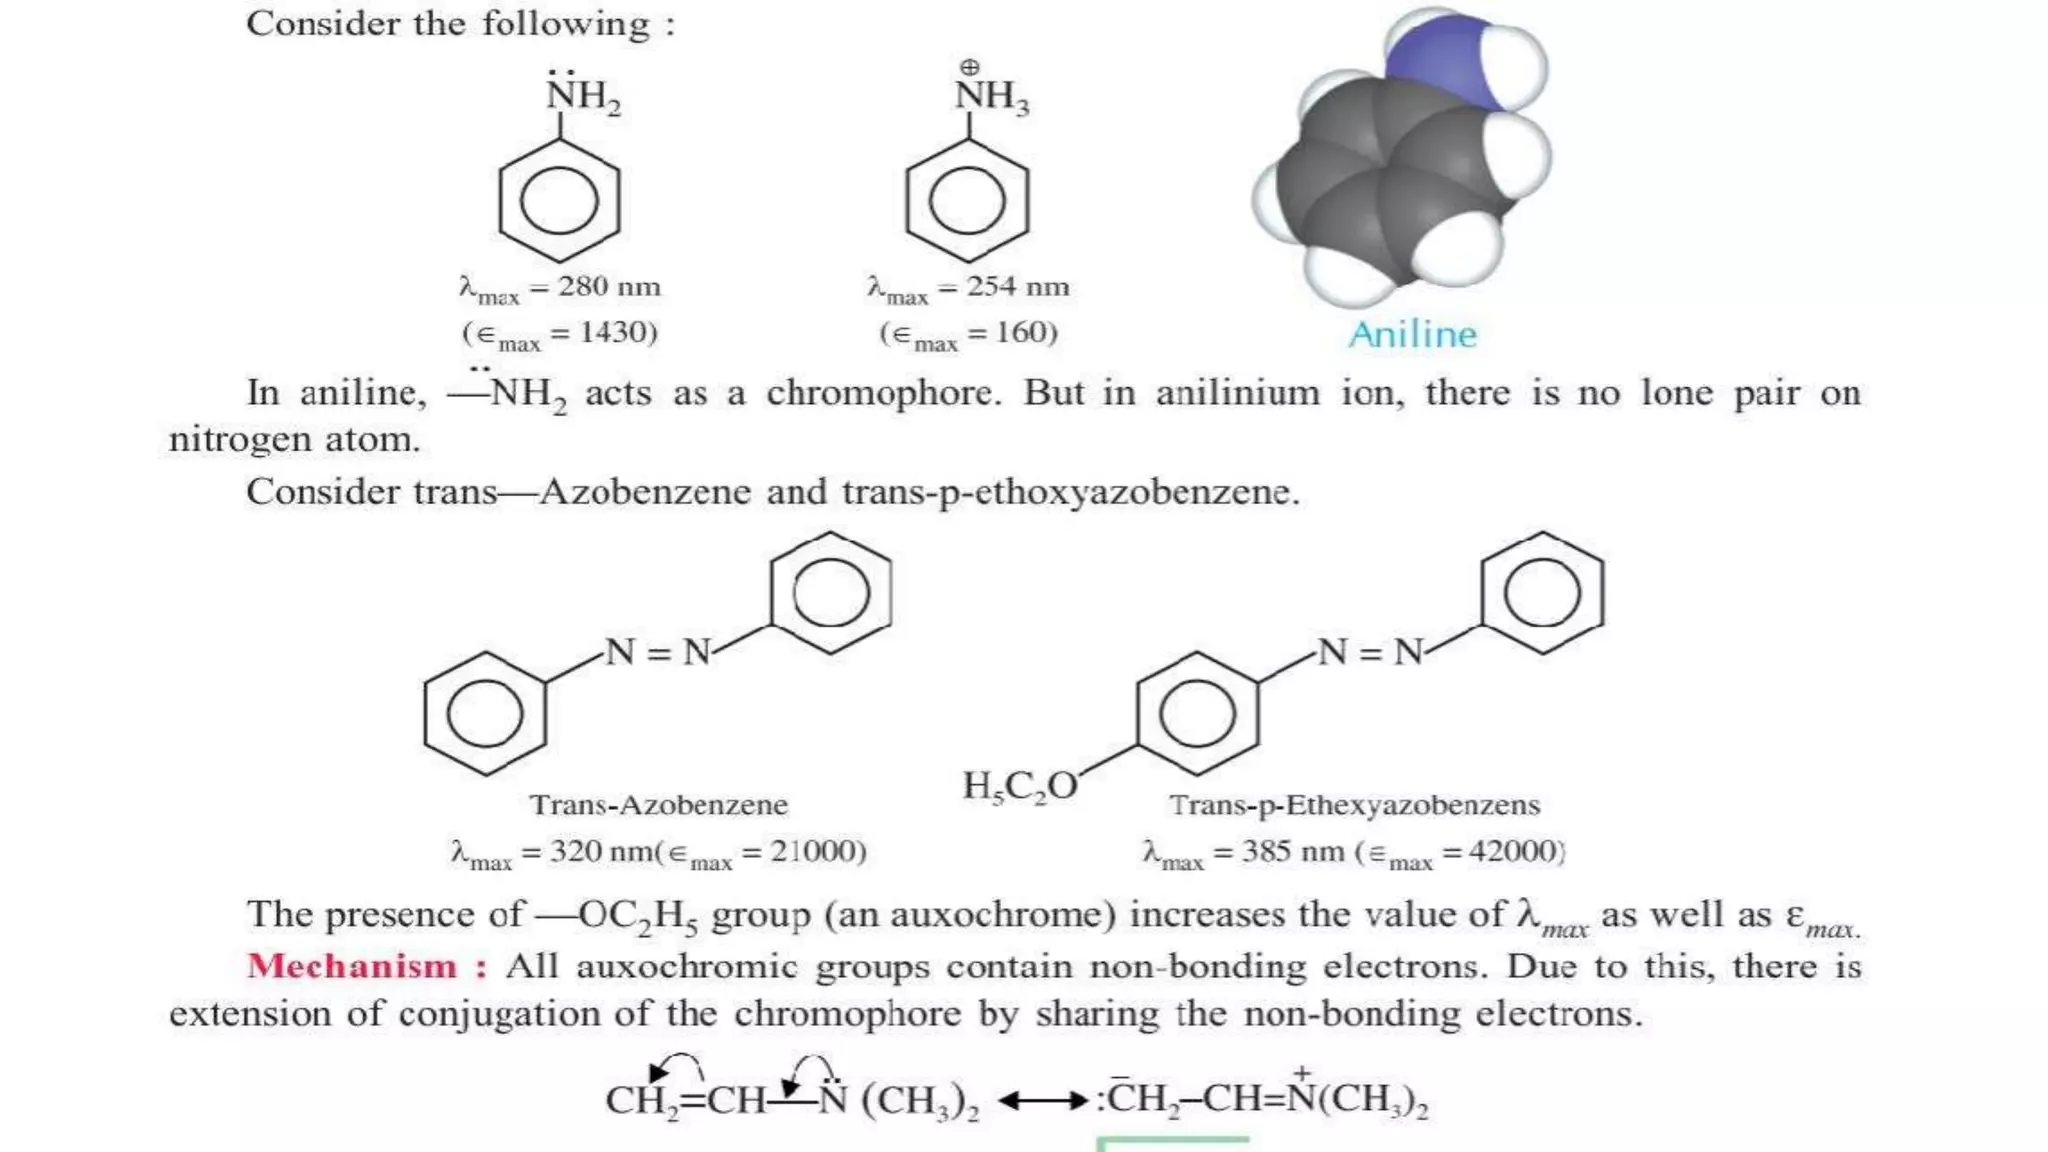
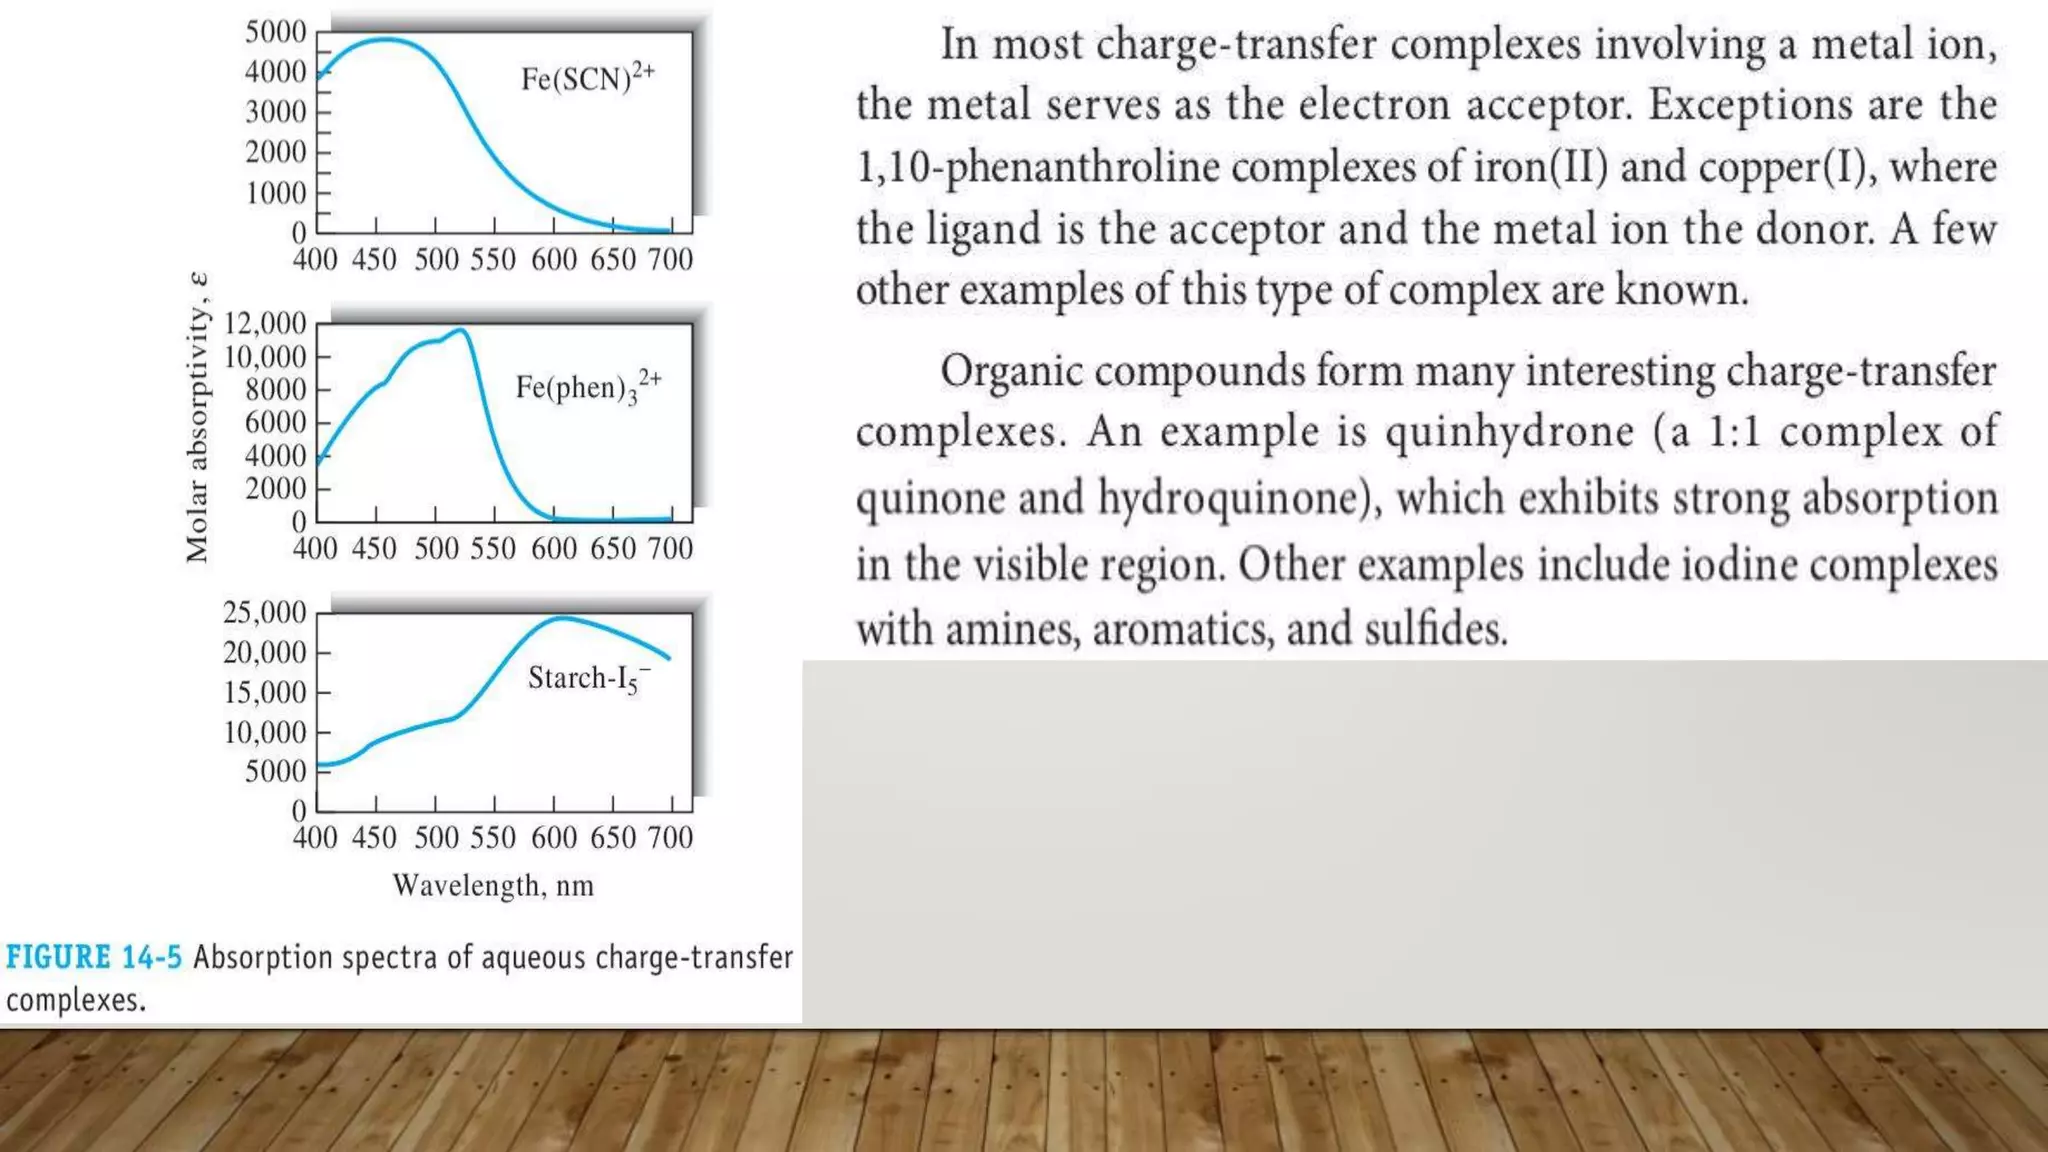
A complete and comprehensive presentation on UV-VISIBLE SPECTROSCOPY.
The purpose of making, uploading these presentations for understanding for both the students and the teachers.
Each and every topic is arranged in series.
Slide by slide the topic should be covered to make your concepts Strong.
Contemporary philippine arts from the regions_PPT_Module_12 [Autosaved] (1).pptx
UV-VISIBLE SPECTROSCOPY.pptx
1. PHARMACEUTICAL ANALYSIS
Chapter: 01
U.V./VISIBLE SPECTROSCOPY
Reference:
• Principles of Instrumental Analysis (Book by Douglas A.
Skoog, F. James Holler, and Stanley R. Crouch. 7th edition)
• Elementary Organic Spectroscopy (Book by Y. R. Sharma)
PREPARED BY: A.A.Memon
2. Pharmaceutical Analysis
The pharmaceutical analysis is a branch of chemistry, which involves the
series of process for the identification, determination, quantitation, and
purification. This is mainly used for the separation of the components
from the mixture
and for the determination of the structure of the compounds.
Analysis
To check the qualitative (safety, efficacy, purity) and quantitative
(concentration) properties of any drug by using different
instrumental methods i.e (spectroscopy, chromatography.)
3. According to the wave theory, light travels in the form of waves. It was believed that
radiant energy is emitted by fluctuation of electric charge and magnetic field. The
electric and magnetic components are mutually perpendicular to each other and are
coplanar (See Fig.)
Electromagnetic Radiations (EMR)
There are various forms of electromagnetic radiations such as Ultra-violet, Infra-red,
X-rays, Radio-waves etc. Some of the important characteristics of electromagnetic
radiations are :
• These are characterised by their wavelengths or frequencies or wavenumbers.
• The energy carried by an electromagnetic radiation is directly proportional to
its frequency.
• All types of radiations travel with the same velocity and no medium is required
for their propagation. They can travel through vacuum.
• When visible light (a group of electromagnetic radiations) is passed through a
prism, it is split up into seven colours which correspond to definite
wavelengths. This phenomenon is called dispersion.
4. Wave: It is the way of transferring the energy from one place to another. It consist of
discrete packets of energy or quanta called photons. It can be described by;
• Velocity
• Amplitude
• Wavelength
• Frequency
Velocity: Multiplication of the frequency in cycles per second by the wavelength in meters per cycle gives the
velocity of propagation vi in meters per second: In a vacuum, the velocity of radiation is independent of wavelength
and is at its maximum
Amplitude: It is the distance from the center line to the top of a crest or to the bottom
of a trough OR
The amplitude A of the electric vector at a maximum in the wave. It is denoted by(A)
5. Wavelength: It is the distance between the two adjacent crests (C—C) or troughs
(T—T) in a particular wave. It is denoted by the letter λ (lambda). It can be expressed in
angstrom units or in millimicrons (mμ).
Frequency: It is defined as the number of waves which can pass through a point in
one second. It is expressed as (nu) in cycles per second or in Hertz (Hz)
1Hz = 1 cycle/sec
Greater the wavelength, smaller is the frequency.
Period: It is the time required for one cycle to
pass a point in space OR
The time in seconds required for the passage of
successive maxima or minima through a fixed
point in space is called the period (p)
6. Wave number: It is the reciprocal of wavelength and it is expressed in
per centimeter. In other words, it is defined as the total number of waves
which can pass through a space of one cm. It is expressed as V̅
Wavenumber is widely used in infrared spectroscopy. The wavenumber is a
useful unit because, in contrast to wavelength, it is directly proportional to
the frequency, and thus the energy, of radiation. Thus, we can write
where the proportionality constant k depends on the medium and is equal to the
reciprocal of the velocity
> The power P of radiation is the energy of the beam that reaches a given
area per second, whereas the intensity I is the power per unit solid angle.
These quantities are related to the square of the amplitude A
7. Dual Nature Of Electromagnetic Radiations (EMR)
Energy transfers in the physical world either by waves or by particles.
In general EMR behaves;
• As a wave when moving through space
• As a particle when interacts with matter
The only way to observe electromagnetic radiation is by
its interaction with matter.
Interaction of EMR with matter involves:
• Dispersion
• Reflection
• Refraction
• Diffraction
• Absorption & transmission
8. Dispersion: It is the change in refractive index
with a change in wavelength. The velocity of light
in a material and it’s refractive index depends on
the wavelength of the light. This causes the light
to be refracted by different amounts according
to the wavelength.
9. Reflection
When radiation crosses an interface between media that differ in refractive
index, reflection always occurs. The fraction of reflected radiation becomes
greater with increasing differences in refractive index. For a beam that enters
an interface at right angles, the fraction reflected is given by
10. Refraction
When radiation passes at an angle through the interface between two transparent media
that have different densities, an abrupt change in direction, or refraction, of the beam is
observed as a consequence of a difference in velocity of the radiation in the two media.
When the beam passes from a less dense to a more dense environment, as in Figure 6-
10, the bending is toward the normal to the interface. Bending away from the normal
occurs when the beam passes from a more dense to a less dense medium
11. Diffraction
All types of electromagnetic radiation exhibit diffraction, a process in which a parallel beam of radiation is
bent as it passes by a sharp barrier or through a narrow opening. Figure 6-7 illustrates the process.
Diffraction is a wave property that can be observed not only for electromagnetic radiation but also for
mechanical or acoustical waves. For example, diffraction is easily demonstrated in the laboratory by
mechanically generating waves of constant frequency in a tank of water and observing the wave crests
before and after they pass through a rectangular opening, or slit. When the slit is wide relative to the
wavelength (Figure 6-7a), diffraction is slight and difficult to detect. On the other hand, when the
wavelength and the slit opening are of the same order of magnitude, as in Figure 6-7b, diffraction
becomes pronounced. Here, the slit behaves as a new source from which waves radiate in a series of nearly
180° arcs. The direction of the wave front appears to bend as a consequence of passing the two edges of
the slit
12. Inferference phenomena cause diffraction. This relationship is most easily understood by
considering an experiment, performed first by Thomas Young in 1800, in which the wave
nature of light was demonstrated unambiguously. As shown in Figure 6-8a, a parallel
beam of light is allowed to pass through a narrow slit A (or in Young’s experiment, a
pinhole) after which it is diffracted and illuminates more or less equally two closely
spaced slits or pinholes B and C; the radiation emerging from these slits is then observed
on the screen lying in a plane XY. If the radiation is monochromatic, a series of dark and
light images perpendicular to the plane of the page is observed.
13. Transmittance
Figure 6-25 shows a beam of parallel
radiation before and after it has passed
through a medium that has a thickness
of b cm and a concentration c of an
absorbing species. As a consequence of
interactions between the photons and
absorbing atoms or molecules, the power
of the beam is reduced (attenuated) from
Pₒ to P. The transmittance T of the
medium is then the fraction of incident
radiation transmitted by the medium:
T = P/ Pₒ
Where; P = incident ray,
Pₒ = transmitted ray
Transmittance is often expressed
as a percentage or
T = P/ Pₒ x 100%
14.
15. Electromagnetic Spectrum
The arrangement of all types of electromagnetic radiations in order of their increasing
wavelengths or decreasing frequencies is known as complete electromagnetic spectrum.
spectrum.
The visible spectrum (from
violet to red) represents only a
small portion of the
electromagnetic spectrum. If
we arrange all types of
electromagnetic radiations in
order of their increasing
wavelengths, then the portion
above the visible region is
called Infra-red while that
below it is the ultra-violet
region. Infra-red radiations
have longer wavelengths and
are thus, less energetic, while
ultra-violet radiations have
shorter wavelengths and are
more energetic.
16. If some light radiation is passed through a sample of an organic
compound, then some of the wavelengths are absorbed while
others belonging to that light source remain unaffected. A
molecule can only absorb radiation of certain frequency.
It is found that when light radiations are passed through an
organic compound, then electrons of the component atoms are
excited. In addition, the vibrational and the rotational energies of
the molecules as a whole are quantised. Thus, any wavelength of
light that a particular molecule will absorb will be due to the
changes in the electronic, vibrational or rotational energy levels
permissible for its atoms. The wavelengths absorbed are
measured with the help of a spectrometer.
Visible and ultra-violet radiations cover the wavelength range from 200-
800 nm
17. As shown in Figure 6-3, the electromagnetic spectrum encompasses an enormous range of wavelengths
and frequencies (and thus energies). In fact, the range is so great that a logarithmic scale is required to
represent it. Figure 6-3 also depicts qualitatively the major spectral regions. The divisions are based on the
methods used to generate and detect the various kinds of radiation. Several overlaps are evident.
Note that the portion of the spectrum visible to the human eye is tiny when compared with other spectral
regions. Also note that spectrochemical methods using
not only visible but also ultraviolet
and infrared radiation are often
called optical methods despite the
human eye’s inability to sense
either of the latter two types of
radiation. This somewhat
ambiguous terminology arises
from the many common
features of instruments for the
three spectral regions and the
similarities in how we view the
interactions of the three types
of radiation with matter.
18. Table 6-1 lists the wavelength and frequency ranges for the regions of the spectrum that are important for
analytical purposes and also gives the names of the various spectroscopic methods associated with each.
The last column of the table lists the types of nuclear, atomic, or molecular quantum transitions that serve
as the basis for the various spectroscopic techniques.
19. Radiation from an excited source is
conveniently characterized by means of an
emission spectrum.
Three types of spectra appear:
• Line spectrum
• Band spectrum
• Continuous spectrum
20. Line Spectrum
The line spectrum is made up of a series of sharp, well-defined peaks
caused by excitation of individual atoms. Line spectra in the ultraviolet and
and
visible regions are produced when the radiating species are individual
atomic particles that are well separated in the gas phase. The individual
particles in a gas behave independently of one another and the spectrum
consists of a series of sharp lines.
21. Band Spectrum
Band spectra are often encountered in spectral sources when
gaseous radicals or small molecules are present
Band spectra consist of a series of closely spaced lines that are not fully
resolved by the instrument used to obtain the spectrum.
Bands arise from numerous quantized vibrational levels that are
superimposed on the ground-state electronic energy level of a
molecule.
22. Continuous spectrum
Continuous spectra are produced when solids are heated to
incandescence. Thermal radiation of this kind is called blackbody
radiation.
23. Interaction of Electromagnetic Radiations With The Matter
Spectroscopists use the interactions of radiation with matter to obtain
information about a sample. Several of the chemical elements were
discovered by spectroscopy. The sample is usually stimulated by applying
energy in the form of heat, electrical energy, light, particles, or a chemical
reaction. Prior to applying the stimulus, the analyte is predominantly in its
lowest energy state, or ground state. The stimulus then causes some of the
analyte species to undergo a transition to a higher energy, or excited state.
We acquire information about the analyte by measuring the electromagnetic
radiation emitted as it returns to the ground state or by measuring the
amount of electromagnetic radiation absorbed or scattered as a result of
excitation.
24. Below discussed figures are available on next slide.
Figure 6-15 illustrates the processes involved in emission and
chemiluminescence spectroscopy. As shown in Figure 6-15a, the analyte is
stimulated by heat or electrical energy or by a chemical reaction. Emission
spectroscopy usually involves methods in which the stimulus is heat or
electrical energy, and chemiluminescence spectroscopy refers to excitation
of the analyte by a chemical reaction. In both cases, measurement of the
radiant power emitted as the analyte returns to the ground state, as shown
in Figure 6-15b, can give information
about its identity and concentration. The results of such a measurement are
often expressed graphically by a spectrum, which is a plot of the emitted
radiation as a function of frequency or wavelength (see Figure 6-15c).
25.
26. When the sample is stimulated by application of an external
electromagnetic radiation source, several processes are possible. For
example, the radiation can be
reflected (Section 6B-9)
scattered (Section 6B-10)
or absorbed (Section 6C-5)
27. 6B-10 Scattering of Radiation
The transmission of radiation in matter as a momentary retention of the radiant energy
by atoms, ions, or molecules followed by reemission of the radiation in all directions as
the particles return to their original state. With atomic or molecular particles that are
small relative to the wavelength of the radiation, destructive interference removes most
but not all of the reemitted radiation except the radiation that travels in the original
direction of the beam; the path of the
beam appears to be unaltered by the interaction. Careful observation, however, reveals
that a very small fraction of the radiation is transmitted at all angles from the original
path and that the intensity of this scattered radiation increases with particle size.
Rayleigh Scattering
Scattering by molecules or aggregates of molecules with dimensions significantly smaller
than the wavelength of the radiation is called Rayleigh scattering. The intensity of the
scattering is
proportional to the inverse fourth power of the wavelength, the dimensions of the
scattering particles, and the square of the polarizability of the particles. An everyday
manifestation of Rayleigh scattering is the blue color of the sky, which results from
28. Scattering by Large Molecules
With large particles, scattering can be different in different directions (Mie scattering).
Measurements of this type of scattered radiation are used to determine the size and
shape of large molecules and colloidal particles
Raman Scattering
The Raman scattering effect differs from ordinary scattering in that part of the scattered
radiation suffers quantized frequency changes. These changes are the result of
vibrational energy level transitions that occur in the molecules as a consequence of the
polarization process.
29. 6C-5 Absorption of Radiation
When radiation passes through a solid, liquid, or gaseous sample, certain
frequencies may be selectively removed by absorption, a process in which
electromagnetic energy is transferred to the atoms, ions, or molecules
composing the sample. Absorption promotes these particles from their
normal room temperature state, or ground state, to one or more higher-
energy excited states. According to quantum theory, atoms, molecules, and
ions have only a limited number of discrete energy levels; for absorption of
radiation to occur, the energy of the exciting photon must exactly match the
energy difference between the ground state and one of the excited states of
the absorbing species. Since these energy differences are unique for each
species, a study of the frequencies of absorbed radiation can be used to
characterize and identify the constituents of a sample.
30. When some of the incident radiation is absorbed, it promotes some of the
analyte species to an excited state, as shown in Figure 6-16. In absorption
spectroscopy, we measure the amount of light absorbed as a function of
wavelength. This can give both qualitative and quantitative information
about the sample
31. In photoluminescence spectroscopy (Figure 6-17), the emission of photons
is measured after absorption. The most important forms of
photoluminescence for analytical purposes are fluorescence and
phosphorescence spectroscopy.
When radiation is scattered, the interaction of the incoming radiation with
the sample may be elastic or inelastic.
In elastic scattering, the wavelength of the scattered radiation is the same as
that of the source radiation. The intensity of the elastically scattered
radiation is used to make measurements in nephelometry and turbidimetry,
and particle sizing.
32.
33. Raman spectroscopy which is mentioned briefly in Section 6B-10
uses inelastic scattering to produce a vibrational spectrum of
sample molecules as illustrated in Figure 6-18. In this type of
spectroscopic analysis, the intensity of the scattered radiation is
recorded as a function of the frequency shift of the incident
radiation. The intensity of Raman peaks is related to the
concentration of the analyte.
34.
35. Dilution
Dilution is the process of lowering the concentration of a solute in a solution
by adding more solvents to the solution, such as water and diluting a
solution on more solvent without adding more solute. The resulting solution
is thoroughly mixed to confirm that all of the solution’s components are the
same
Dilution Factor
After dilution, the dilution factor (or dilution ratio) represents how much of
the original stock solution remains in the entire solution. It’s usually
expressed as a ratio, although it can also be expressed as an exponent.
36. Spectroscopy (Spectrum = light + Scopy = to determine)
Spectroscopy may be defined as the interaction between the matter and
electromagnetic radiations
It is used for quantitative and qualitative analysis of matter/sample by
using light (EMR)
The study of spectroscopy deals with emission as well as absorption
spectra.
• An emission spectrum is produced by the emission of radiant energy by
an excited atom.
• An absorption spectrum is obtained by the production of dark pattern
of lines, due to absorption of different wavelengths of light by particular
functional group present in the compound or compound itself.
37. Spectrometric methods encompass a large group of analytical methods
based on atomic and molecular spectroscopy.
Spectroscopy is a general term for the science of the interactions of
radiation with matter. Historically, the interactions of interest were
between electromagnetic radiation and matter, but now spectroscopy
has been broadened to include interactions between matter and other
forms of energy. Examples include acoustic waves and beams of particles
such as ions and electrons. Spectrometry and spectrometric methods
refer to the
measurement of the intensity of radiation with a photoelectric
transducer or other type of electronic device. The most widely used
spectrometric methods are based on electromagnetic radiation, which is
a type of energy that takes several forms, the most readily recognizable
being light and radiant heat. Less obvious manifestations include
gamma rays and X-rays as well as ultraviolet, microwave, and radio
frequency radiation
38. Theory of Electronic Spectroscopy
When the molecule absorbs ultraviolet or visible light, its electrons get promoted from
the ground state to the higher energy state. In the ground state, the spins of the
electrons in each molecular orbital are essentially paired. In the higher energy state, if
the spins of the electrons are paired, then it is called an excited singlet state. On the
other hand, if the spins of the electrons in the excited state are parallel, it is called an
excited triplet state.
The triplet state is always lower in energy than the corresponding excited singlet state.
Therefore, triplet state is more stable as compared to the excited singlet state.
The transition from singlet ground state to excited triplet state is symmetry forbidden.
The higher energy states are designated as high energy molecular orbitals and also
called antibonding orbitals. The highly probable transition due to absorption of
quantised energy involves the promotion of one electron from the highest occupied
molecular orbital to the lowest available unfilled molecular orbital.
39. The Absorption Laws
There are two laws which govern the absorption of light by the molecules.
These are :
(i) Lambert’s law (ii) Beer’s law
(i) Lambert’s law
It states that:
When a beam of monochromatic radiation passes through a homogeneous
absorbing medium, the rate of decrease of intensity of radiation with
thickness of absorbing medium is proportional to the intensity of the
incident radiation.
Mathematically, the law is expressed as:
– dI/dx = kI
40. where
dI = infinitesimally small decrease in the intensity of radiation on passing
through infinitesimally small thickness, dx of the medium.
-dl/dx = rate of decrease of intensity of radiation with thickness of the
absorbing medium.
k = proportionality constant or absorption coefficient. Its value depends
upon the nature of the absorbing medium.
I = intensity of radiation after passing through a thickness x, of the medium.
Note :
• For ultraviolet spectrum, the region from 200 mμ to 380 mμ (called
quartz region) is considered
• As the incident ray passes through the medium after passing it’s intensity
will be decreased that means the intensity of incident light will be more
than that of transmitted light.
41. (ii) Beer’s Law
This law states that:
When a beam of monochromatic radiation is passed through a solution of an absorbing
substance, the rate of decrease of intensity of radiation with thickness of the absorbing
solution is proportional to the intensity of incident radiation as well as the concentration
of the solution.
Mathematically, this law is stated as
– dI/dx = k’Ic
where
-dl/dx = rate of decrease of intensity of radiation with thickness of the absorbing
medium.
k’= molar absorption coefficient and its value depends upon the nature of the absorbing
substance.
I = intensity of radiation after passing through a thickness x, of the medium.
c = conc. of the solution in moles/litre.
42. Alternative expression :
On combining the two laws, the Beer-Lambert Law
can be formulated as below :
log I/Iₒ= ε.c.b = A
where
Iₒ = Intensity of incident light
I = Intensity of transmitted light
ε= molar extinction coefficient (or molar absorptivity)
c = Concentration of solution in moles/litre
b = Path length of the sample (usually 1 cm)
A = Absorbance
Limitations of Beer Lambert Law
This law is not obeyed:
(i) When different forms of the absorbing molecules
are in equilibrium as in keto-enol tautomers.
(ii) When fluorescent compounds are present.
(iii) When solute and solvent form complexes through
some sort of association.
43.
44.
45.
46.
47.
48.
49. Electronic Transitions
According to the molecular orbital theory, when a molecule is excited by the
absorption of
energy (ultraviolet or visible light), its electrons are promoted from a bonding to an
antibonding orbital
Three types of electrons
• Sigma electrons
• Pie electrons
• Non bonding electrons
Sigma Electrons: These electrons are involved in saturated (single bond) sigma
bonds. These are the lowest energy occupying orbitals
Pi Electrons: These electrons are involved in unsaturated (double or triple bond)
hydrocarbons. These lie at higher energy levels.
Non Bonding Electrons: These electrons are involved in lone pair or non bonding
orbital. These lie at higher energy level
51. σ-σ* Transition
σ-σ* transition takes place when σ electron is promoted to σ*
orbital
It is a high energy process since σ bonds are, in general, very
strong.
The organic compounds in which all the valence shell electrons
are involved in the formation of
sigma bonds. Absorption occurs near 150 mμ or 150nm
σ-σ* transition is considered in a saturated hydrocarbons :
i.e Alkanes, Methane (CH₄)
52. n-σ* Transition
This type of transition takes place in saturated compounds containing
one hetero atom with unshared pair of electrons (n electrons).
Some compounds undergoing this type of transitions are saturated halides,
alcohols, ethers, aldehydes, ketones, amines etc.
Such transitions require comparatively less energy than that required for σ-
σ* transitions. In saturated alkyl halides, the energy required for such a
transition decreases with the increase in the size of the halogen atom (or
decrease in the electronegativity of the atom).Absorption occurs at the
wavelength of 150-250nm.
53. π-π* Transition
This type of transition occurs in the unsaturated centers of the molecule; i.e.
in compounds containing double or triple bonds and also in aromatics. The
excitation of π electron requires smaller energy and hence, transition of this
type occurs at longer wavelength.
A π electron of a double bond is excited to π* orbital. For example, alkenes,
alkynes, carbonyl compounds, cyanides, azo compounds etc. show π-π*
transition.
This transition requires still lesser energy as compared to n-σ* transition and
therefore, absorption occurs at longer wavelengths. Absorption usually
occurs within the region of ordinary ultra-violet spectrophotometer.
54. n-π* Transition
In this type of transition, an electron of unshared electron pair on hetero atom gets
excited to π* antibonding orbital. This type of transition requires least amount of energy
out of all the transitions discussed and hence occurs at longer wavelengths.
Saturated aldehydes show both the types of transitions, i.e., low energy n-π* and
high energy π-π*. In simple cases, it is quite easy to tell whether the transition is n-π* or
π-π* since the extinction coefficient for the former is quite low as compared to that of
the latter.
Thus, in saturated carbonyl compounds, two types of transitions take
place which can be classed as :
(a) High energy transitions
(i) n-σ * (intense)
(ii) π-π* (intense)
(b) Low energy transitions
(i) n-π* (weak)–R*band.
55. Depending upon the symmetry and the value of extension
coefficient maximum(∈max), the transitions*** can be classed as :
(a) Allowed Transitions
The transitions with values of (extinction coefficient)∈max, more than 10⁴ are
usually called allowed transitions. They generally arise due to π-π*
transitions.
(b) Forbidden Transitions
The forbidden transition is a result of the excitation of one electron from the
lone pair present on the heteroatom to an antibonding π* orbital is the
result of forbidden transition.
The values of ∈max for forbidden transition are generally below 10⁴
56.
57.
58.
59.
60.
61. (b) Hypsochromic shift or effect.
It is an effect by virtue of which the absorption maximum is shifted towards shorter wavelength. The
absorption shifted towards shorter wavelength is called Blue shift or hypsochromic shift
62. Instrumentation
Instruments for making molecular absorption measurements in the UV, visible, and near-
IR regions are produced by dozens of companies. There are hundreds of instrument
makes and models from which to choose. Some are simple and inexpensive (a few
hundred dollars); others are complex, computer controlled, scanning instruments costing
$30,000 or more. The simpler instruments are often useful only in the visible region for
quantitative measurements at a single wavelength. The more complex instruments can
provide spectral scanning at selectable resolution, measurements in the UV as well as the
visible regions, compensation for source intensity fluctuations, and several other features.
features.
Instrument Components
Instruments for measuring the absorption of UV, visible, and near-IR radiation are made
up of one or more (1) sources, (2) wavelength selectors, (3) sample containers, (4)
radiation transducers, and (5) signal processors and readout devices. We will, however,
consider briefly the characteristics for the region of 190 to 3000 nm.
63. Sources
For the purposes of molecular absorption measurements, a continuum source is required whose radiant
power does not change sharply over a considerable range of wavelengths.
Deuterium and Hydrogen Lamps
A continuum spectrum in the UV region is produced by electrical excitation of deuterium or hydrogen at
low pressure. The mechanism by which a continuum spectrum is produced involves initial formation of an
excited molecular species followed by dissociation of the excited molecule to give two atomic species plus
a UV photon.
The reactions for deuterium are
64.
65.
66.
67.
68. Tungsten Filament Lamps.
The most common source of visible and near-IR radiation is the tungsten filament lamp.
The energy distribution of this source approximates that of a blackbody (see Figure 6-22)
and is thus temperature dependent. In most absorption instruments, the operating
filament temperature is 2870 K; the bulk of the energy is thus emitted in the IR region. A
tungsten filament lamp is useful for the wavelength region between 350 and 2500 nm.
Figure 13-12 shows a typical tungsten lamp and its spectrum. Absorption of radiation by
the glass envelope that houses the filament imposes the lower wavelength limit. In the
visible region, the energy output of a tungsten lamp varies approximately as the fourth
power of the operating voltage. Precise voltage control is therefore required for a stable
radiation source. Electronic voltage regulators or feedback controlled power supplies are
usually needed to obtain the required stability.
69.
70. Tungsten-halogen lamps, also called quartz-halogen lamps, contain a small
quantity of iodine within a quartz envelope that houses the tungsten
filament. Quartz allows the filament to be operated at a temperature of
about 3500 K, which leads to higher intensities and extends the range of the
lamp well into the UV region. The lifetime of a tungsten-halogen lamp is
more than double that of the ordinary lamp. This added life results from the
reaction of the iodine with gaseous tungsten that forms by sublimation and
ordinarily limits the life of the filament; the product is the volatile WI2. When
molecules of this compound strike the filament, decomposition occurs,
which redeposits tungsten. Tungsten-halogen lamps are significantly more
efficient and extend the output wavelength range well into the UV. For these
reasons, they are found in many modern spectroscopic instruments.
71.
72.
73.
74.
75.
76.
77.
78.
79.
80.
81.
82.
83.
84.
85. Grating
Dispersion of UV, visible, and IR radiation can be brought about by directing a
polychromatic beam through a transmission grating or onto the surface of a reflection
grating; the latter is by far the more common type. Replica gratings, which are used in
most monochromators, are manufactured from a master grating. A master grating
consists of a hard, optically flat, polished surface that has a large number of parallel and
closely spaced grooves, made with a diamond tool. A magnified cross-sectional view of a
few typical grooves is shown in Figure 7-21. A grating for the UV and visible region
typically has from 300 to 2000 grooves/mm, with 1200 to 1400 being most common. For
the IR region, gratings typically have 10 to 200 grooves/mm; for spectrophotometers
designed for the most widely used IR range of 5 to 15 μm, a grating with about 100
grooves/mm is suitable. The construction of a good master grating is tedious, time-
consuming, and expensive because the grooves must be of identical size, exactly parallel,
and equally spaced over the length of the grating (3 to 10 cm). Replica gratings are
formed from a master grating by a liquid-resin casting process that preserves virtually
perfectly the optical accuracy of the original master grating on a clear resin surface. This
surface is usually made reflective by a coating of aluminum, or sometimes gold or
platinum.
86.
87. Sample Containers
In common with the other optical elements of an absorption instrument, the cells, or
cuvettes, that hold the sample and solvent must be constructed of a material that passes
radiation in the spectral region of interest. Quartz or fused silica is required for work in
the UV region (below 350 nm). Both of these substances are transparent throughout the
visible and near-IR regions to about 3 µm. Silicate glasses can be used in the region
between 350 and 2000 nm. Plastic containers are also used in the visible region.
The best cells minimize reflection losses by having windows
that are perfectly normal to the direction of the beam. The
most common path length for studies in the UV and visible
regions is 1 cm. Matched, calibrated cells of this size are
available from several commercial sources. Other path lengths,
from 0.1 cm (and shorter) to 10 cm, can also be purchased.
Transparent spacers for shortening the path length of 1-cm cells
to 0.1 cm are also available.
88. Cylindrical cells are sometimes used in the UV and visible regions because
they are inexpensive. Special care must be taken to reproduce the position
of the cell with respect to the beam; otherwise, variations in path length and
reflection losses at the curved surfaces can cause significant errors. The
quality of absorbance data depends critically on the way the cells are used
and maintained.
Fingerprints, grease, or other deposits on the walls markedly alter the
transmission characteristics of a cell. Thus, it is essential to clean cells
thoroughly before and after use. The surface of the windows must not be
touched during handling. Matched cells should never be dried by heating in
an oven or over a flame—such treatment may cause physical damage or a
change in path length. The cells should be regularly calibrated against each
other with an absorbing solution.
89. Radiation Transducers
The detectors for early spectroscopic instruments were the human eye or a photographic plate or film.
Transducers that convert radiant energy into an electrical signal have almost totally replaced these
detection devices. We will confine our discussion to modern transducers.
Types of Radiation Transducers
There are two general types of radiation transducers. One type responds to photons, the other to heat. All
photon transducers (also called photoelectric or quantum detectors) have an active surface that absorbs
radiation. In some types, the absorbed energy causes emission of electrons and the production of a
photocurrent. In others, the radiation promotes electrons into conduction bands; detection here is based
on the resulting enhanced conductivity (photoconduction). Photon transducers are used largely for
measurement of UV, visible, and near-IR radiation. When they are applied to radiation much longer than 3
μm in wavelength, these transducers must be cooled to dry-ice or liquid-nitrogen temperatures to avoid
interference from thermal background noise. Photoelectric transducers produce an electrical signal
resulting from a series of individual events (absorption of single photons), the probability of which can be
described statistically. In contrast, thermal transducers, which are widely used for the detection of IR
radiation, respond to the average power of the incident radiation. The distinction between photon and
heat transducers is important because shot noise often limits the behavior of photon transducers and
thermal noise frequently limits thermal transducers. As shown in Section 5B-2, the indeterminate errors
associated with the two types of transducers are fundamentally different.
90. Photon Transducers
Several types of photon transducers are available, including (1) photovoltaic
cells, in which the radiant energy generates a current at the interface of a
semiconductor layer and a metal; (2) phototubes, in which radiation causes
emission of electrons from a photosensitive solid surface; (3) photomultiplier
photomultiplier tubes, which contain a photoemissive surface as well as
several additional surfaces that emit a cascade of electrons when struck by
electrons from the photosensitive area; (4) photoconductivity transducers in
which absorption of radiation by a semiconductor produces electrons and
holes, thus leading to enhanced conductivity; (5) silicon photodiodes, in
which photons cause the formation of electron-hole pairs and a current
across a reverse-biased pn junction; and (6) charge-transfer transducers, in
which the charges developed in a silicon crystal as a result of absorption of
photons are collected and measured
91. Barrier-Layer Photovoltaic Cells
The photovoltaic cell is a simple device that is used for detecting and
measuring radiation in the visible region. The typical cell has a maximum
sensitivity at about 550 nm. The response falls off to about 10% of the
maximum at 350 and 750 nm. Its range is similar to that of the human eye.
The photovoltaic cell consists of a flat copper or iron electrode on which is
deposited a layer of semiconducting material, such as selenium (see Figure
7-28). The outer surface of the semiconductor is coated with a thin
transparent metallic film of gold or silver, which serves as the second, or
collector, electrode.
92.
93.
94. Vacuum Phototubes
A second type of photoelectric device is the vacuum phototube, which consists of a
semicylindrical cathode and a wire anode sealed inside an evacuated transparent
envelope as shown in Figure 7-29. The concave surface of the electrode supports a layer
of photoemissive material that tends to emit electrons when it is irradiated. When a
voltage is applied across the electrodes, the emitted electrons flow to the wire anode
generating a photocurrent that is generally about one tenth as great as that associated
with a photovoltaic cell for a given radiant intensity. In contrast, however, amplification is
easily accomplished because the phototube has a high electrical resistance The number
of electrons ejected from a photoemissive surface is directly proportional to the radiant
power of the beam that strikes that surface. As the voltage applied across the two
electrodes of the tube is increased, the fraction of the emitted electrons that reaches the
anode rapidly increases until the saturation voltage is achieved. At this point, essentially
all of the electrons are collected at the anode. The current then becomes independent of
voltage and directly proportional to the radiant power. Phototubes are usually operated
at a voltage of about 90 V, which is well within the saturation region. Photoemissive
surfaces fall into four categories: highly sensitive, red sensitive, UV sensitive, and flat
response
95.
96. Photomultiplier Tubes
For the measurement of low radiant powers, the photomultiplier tube (PMT) offers advantages over an
ordinary phototube. Figure 7-31 is a schematic of such a device. The photocathode surface is similar in
composition to the surfaces of the phototubes and it emits electrons when exposed to radiation. The tube
also contains additional electrodes (nine in Figure 7-31) called dynodes. Dynode D1 is maintained at a
voltage approximately 90 V more positive than the cathode, and electrons are accelerated toward it as a
result. Each photoelectron that strikes the dynode causes emission of several additional electrons. These
electrons, in turn, are accelerated toward dynode D2, which is ,90 V more positive than dynode D1. Again,
several electrons are emitted for each electron that strikes the surface. By the time this process has been
repeated nine times, 106 to 107 electrons have been formed for each incident photon. This cascade of
electrons is finally collected at the anode and the resulting current is then converted to voltage and
measured. Photomultipliers are highly sensitive to UV and visible radiation. In addition, they have
extremely fast response times. Often, the sensitivity of an instrument with a photomultiplier is limited by its
its dark current. Because thermal emission is the major source of dark-current electrons, the performance
of a photomultiplier can be enhanced by cooling. In fact, thermal dark currents can be virtually eliminated
by cooling the detector to 230°C. Transducer housings, which can be cooled by circulation of an
appropriate coolant, are available commercially
97. PMTs are limited to measuring low-power radiation because intense light causes irreversible damage to
the photoelectric surface. For this reason, the device is always housed in a light-tight compartment and
care is taken to eliminate the possibility of its being exposed even momentarily to daylight or other strong
light while powered. With appropriate external circuitry, PMTs can be used to detect the arrival of
individual photons at the photocathode. Photomultipliers are also available with microchannel plates
instead of conventional dynodes. These devices are often called image intensifiers. The microchannel plate
consists of a large number of glass capillaries bundled in parallel in the form of a thin disk. When a
primary electron strikes the inner wall of a channel, secondary electrons are emitted. These are accelerated
by an electric field applied across the plate and again strike the walls of the channel, giving rise to
additional secondary electrons. This process is repeated multiple times along the channel producing a
large number of electrons at the anode. Microchannel plate PMTs are used in low-level imaging
applications, in techniques requiring very fast response, and in low light-level applications detecting
individual photons (photon counting). The microchannel plate voltage can also be switched on and off
rapidly to provide gating for applications that require time resolution (fluorescence lifetime
measurements, laser-induced breakdown spectroscopy, and others). Microchannel plate PMTs are also
available with multiple anodes to enable simultaneous two-dimensional detection. Microchannel plate
transducers are also used in mass spectrometry.
98.
99.
100. Photodiode Arrays
In a PDA, the individual photosensitive elements are small silicon photodiodes, each of
which consists of a reverse-biased pn junction. The individual photodiodes are part of a
large-scale integrated circuit formed on a single silicon chip. Figure 7-33 shows the
geometry of the surface region of a few of the transducer elements. Each element
consists of a diffused p-type bar in an n-type silicon substrate to give a surface region
that consists of a series of side-by-side elements or pixels. Pixels are often spaced 25 μm
apart and have heights of 0.5 to 2.5 mm (Figure 7-33b). Square pixels with dimensions as
small as 14 by 14 μm are available. Radiation that is incident on these elements creates
charges in both the p and n regions. The positive charges are collected and stored in the
p-type bars for subsequent integration (the charges formed in the n-regions divide
themselves proportionally between the two adjacent p-regions). The number of
transducer elements in a chip ranges from 64 to 4096, with 1024 being the most widely
used.
101.
102.
103.
104.
105.
106.
107.
108.
109. SPECTROPHOTOMETER
A spectrophotometer is a device which detects the percentage transmittance of light
radiation when light of certain intensity and frequency range is passed through the
sample. Thus, the instrument compares the intensity of the transmitted light with that of
the incident light.
SPECTROPHOTOMETRY
Spectrophotometry is a standard and inexpensive technique to measure light absorption
or the amount of chemicals in a solution. It uses a light beam which passes through the
sample, and each compound in the solution absorbs or transmits light over a certain
wavelength.
TYPES OF SPECTROPHOTOMETER
1. Single beam spectrophotometer
2. Double beam spectrophotometer
111. FIGURE 13-13
Here a single-beam instrument is shown. Radiation from the filter or
monochromator
passes through either the reference cell or the sample cell before striking the
photodetector.
112.
113. Monochromators
A monochromator is a device that uses an entrance slit to define the area of the source
viewed and an exit slit to isolate a single wavelength band. Spectral scanning can be
achieved by transmitting different wavelength bands one at a time through the exit slit.
Monochromators for UV, visible, and IR radiation are all similar in mechanical
construction in the sense that they use slits, lenses, mirrors, windows, and gratings or
prisms. The materials from which these components are fabricated depend on the
wavelength region of intended use.
118. Here a double-beam Instrument is shown. Here, radiation from the filter or monochromator is split
into two beams that simultaneously pass through the reference and sample cells before striking two
matched photodetectors.
119. Here, the beam is alternately sent through reference and sample cells before striking a single
photodetector. Only a matter of milliseconds separate the beams as they pass through the two cells.
120.
121.
122.
123.
124. Applications of U-V Visible Molecular absorption
spectrometry
• The compounds that are centro symmetric (having center of symmetry) are UV active compounds
i.e Sis isomers are centro symmetric compounds
• The compounds that are not Centro symmetric (do not have center of symmetry) are UV inactive compounds
i.e Trans isomers do not have center of symmetry
125.
126. Figure 14-1 Ultraviolet absorption
spectra for 1,2,4,5-tetrazine. In (a),
the spectrum is shown in the gas
phase, where many lines due to
electronic, vibrational, and
rotational
transitions can be seen. In a
nonpolar
solvent (b), the electronic
transitions
can be observed, but the
vibrational
and rotational structure has been
lost. In a polar solvent (c)the
strong
intermolecular forces cause the
electronic peaks to blend, giving
only
a single smooth absorption band.
127.
128.
129. Saturated organic compounds containing such heteroatoms as oxygen, nitrogen, sulfur, or halogens have nonbonding electrons that can be excited by
radiation in the range of 170 to 250 nm. Table 14-2 lists a few examples of such compounds. Some of these compounds, such as alcohols and ethers, are
common solvents, so their absorption in this region prevents measuring absorption of analytes dissolved in these compounds at wavelengths shorter
than 180 to 200 nm. Occasionally, absorption in this region is used for determining halogen and sulfur-bearing compounds.
130.
131.
132.
133.
134. Qualitative Applications of Ultraviolet Visible Absorption
Spectroscopy
Spectrophotometric measurements with UV radiation are useful for detecting
chromophoric groups Because large parts of even the most complex organic molecules
are transparent to radiation longer than 180 nm, the appearance of one or more peaks in
the region from 200 to 400 nm is clear indication of the presence of unsaturated groups
or of atoms such as sulfur or halogens. Often, the identity of the absorbing groups can
be determined by comparing the spectrum of an analyte with those of simple molecules
containing various chromophoric groups.4 Usually, however, UV spectra do not have
enough fine structure to permit an analyte to be identified unambiguously. Thus, UV
qualitative data must be supplemented with other physical or chemical evidence such as
infrared, nuclear magnetic resonance, and mass spectra as well as solubility and melting-
and boiling-point information.
135. Solvents
UV spectra for qualitative analysis are usually measured using dilute solutions of the
analyte. For volatile compounds, however, gas-phase spectra are often more useful than
liquid-phase or solution spectra Gas-phase spectra can often be obtained by allowing a
drop or two of the pure liquid to evaporate and equilibrate with the atmosphere in a
stoppered cuvette
If a solvent is used, consideration must be given not only to its transparency, but also to
its possible effects on the absorbing system. Quite generally, polar solvents such as
water, alcohols, esters, and ketones tend to obliterate spectral fine structure arising from
vibrational effects. Spectra similar to gas-phase spectra (see Figure 14-6) are more likely
to be observed in nonpolar solvents such as hydrocarbons. In addition, the positions of
absorption maxima are influenced by the nature of the solvent. As a rule, the same
solvent must be used when comparing absorption spectra for identification purposes.
136.
137. Table 14-3 lists some common
solvents and the approximate
wavelength below which they
cannot be used because of
absorption. These
wavelengths,
called the cutoff wavelengths,
depend strongly on the purity
of the solvent. Common
solvents for UV spectro-
photometry include water,
95% ethanol, cyclohexane,
and
1,4-dioxane. For the visible
region, any colorless solvent
is suitable.
138. The Effect of Slit Width
The effect on solution spectra is illustrated for reduced cytochrome c in Figure 14-7. The
plots show that peak heights and separation are distorted at wider bandwidths. Because
of this, spectra for qualitative applications should be measured with minimum slit widths.
139. Detection of Functional Groups
Even though it may not provide the unambiguous identification of an organic
compound, an absorption spectrum in the visible and the UV regions is nevertheless
useful for detecting the presence of certain functional groups that act as chromophores.
For example, a weak absorption band in the region of 280 to 290 nm, which is displaced
toward shorter wavelengths with increased solvent polarity, strongly indicates the
presence of a carbonyl group. Such a shift is termed a hypsochromic, or blue, shift. A
weak absorption band at about 260 nm with indications of vibrational fine structure
constitutes evidence for the existence of an aromatic ring. Confirmation of the presence
of an aromatic amine or a phenolic structure may be obtained by comparing the effects
of pH on the spectra of solutions containing the sample with those shown in Table 14-4
for phenol and aniline.
140. All three of the characteristic bands for benzene are strongly affected by ring
substitution; the effects on the two longer-wavelength bands are of particular interest
because they can be studied with ordinary spectrophotometric equipment. Table 14-4
illustrates the effects of some common ring substituents. By definition, an auxochrome is
a functional group that does not itself absorb in the UV region but has the effect of
shifting chromophore peaks to longer wavelengths as well as increasing their intensities.
Such a shift to longer wavelengths is called a bathochromic, or red, shift. Note in Table
14-4 that -OH and -NH2 have an auxochromic effect on the benzene chromophore,
particularly with respect to the B band. Auxochromic substituents have at least one pair
of n electrons capable of interacting with the π electrons of the ring. This interaction
apparently has the effect of stabilizing the π* state, thereby lowering its energy, and
increasing the wavelength of the corresponding band. Note that the auxochromic effect
is more pronounced for the phenolate anion than for phenol itself, probably because the
anion has an extra pair of unshared electrons to contribute to the interaction. With
aniline, on the other hand, the nonbonding electrons are lost by formation of the
anilinium cation, and the auxochromic effect disappears.
141.
142.
143. Applications to Absorbing Species
A number of inorganic species also absorb UV-visible radiation and are thus susceptible
to direct determination We have noted that many ions of the transition metals are
colored in solution and can thus be determined by spectrophotometric measurement. In
addition, a number of other species show characteristic absorption bands, including
nitrite, nitrate, and chromate ions, the oxides of nitrogen, the elemental halogens, and
ozone.
Applications to Nonabsorbing Species
Numerous reagents react selectively with nonabsorbing species to yield products that
absorb strongly in the UV or visible regions. The successful application of such reagents
to quantitative analysis usually requires that the color-forming reaction be forced to near
completion. If the amount of product is limited by the analyte, the absorbance of the
product is proportional to
the analyte concentration. Kinetic methods are often based on the rate of formation of
an absorbing product
144. Color-forming reagents are frequently used as well for the determination of absorbing
species, such as transition-metal ions. The molar absorptivity of the product is frequently
orders of
magnitude greater than that of the species before reaction. A host of complexing agents
are used to determine inorganic species. Typical inorganic reagents include thiocyanate
ion
for iron, cobalt, and molybdenum; hydrogen peroxide for titanium, vanadium, and
chromium; and iodide ion for bismuth, palladium, and tellurium. Of even more
importance are organic chelating agents that form stable, colored complexes with
cations. Common examples include diethyldithiocarbamate for the determination of
copper, diphenylthiocarbazone for lead, 1,10-phenanthrolene for iron, and
dimethylglyoxime for nickel. In the application of the last reaction to the photometric
determination of nickel, an aqueous solution of the cation is extracted with a solution of
the chelating agent in an immiscible organic liquid. The absorbance of the resulting
bright red organic layer serves as a measure of the concentration of the metal.
145. Selection of Wavelength
For highest sensitivity, spectrophotometric absorbance measurements are ordinarily
made at a wavelength corresponding to an absorption maximum because the change in
absorbance per unit of concentration is greatest at this point. In addition, the absorbance
is nearly constant with wavelength at an absorption maximum, which minimizes
deviations from Beer’s law due to polychromatic radiation. Finally, small uncertainties
that arise from failing to reproduce precisely the wavelength setting of the instrument
have less influence at an absorption maximum
Variables That Influence Absorbance
Common variables that influence the absorption spectrum of a substance include the
nature of the solvent, the pH of the solution, the temperature, high electrolyte
concentrations, and the presence of interfering substances. The effects of these variables
must be known and conditions for the analysis must be chosen such that the absorbance
will not be materially influenced by small, uncontrolled variations in their magnitudes.
146. Cleaning and Handling of Cells
Accurate spectrophotometric analysis requires the use of good-quality, matched cells.
These should be regularly calibrated against one another to detect differences that can
result from scratches, etching, and wear. It is equally important to use proper cell-
cleaning and drying techniques. Erickson and Surles¹⁰ recommend the following cleaning
sequence for the outside windows of cells. Prior to measurement, the cell surfaces should
be cleaned with a lens paper soaked in spectrograde methanol. While wiping, it is best to
wear gloves or to hold the paper with a hemostat. The methanol is then allowed to
evaporate, leaving the cell surfaces free of contaminants. Erickson and Surles showed
that this method was superior to the usual procedure of wiping the cell surfaces with a
dry lens paper, which can leave lint and a film on the surface.
147. Determining the Relationship between Absorbance and Concentration
The method of external standards is most often used to establish the absorbance versus
concentration relationship. After deciding on the conditions for the analysis, the
calibration curve is prepared from a series of standard solutions that bracket the
concentration range expected for the samples. Seldom, if ever, is it safe to assume
adherence to Beer’s law and use only a single standard to determine the molar
absorptivity. Because molar absorptivities are dependent on many environmental factors,
determinations should never be based on a literature value of absorptivity. Ideally,
calibration standards should approximate the composition of the samples to be analyzed
not only with respect to the analyte concentration but also with regard to the
concentrations of the other species in the sample matrix. This can minimize the effects of
various components of the sample on the measured absorbance. For example, the
absorbance of many colored complexes of metal ions is decreased to a varying degree in
the presence of sulfate and phosphate ions because these anions can form colorless
complexes with metal ions.
148. The desired reaction is often less complete as a consequence, and
lowered absorbances are the result. The matrix effect of sulfate
and phosphate can often be counteracted by introducing into the
standards amounts of the two species that approximate the
amounts found in the samples. Unfortunately, matrix matching is
often impossible or quite difficult when complex materials such as
soils, minerals, and tissues are being analyzed. When this is the
case, the standard-addition method is often helpful in
counteracting matrix effects that affect the slope of the calibration
curve. However, the standard-addition method does not
compensate for extraneous absorbing species unless they are
present at the same concentration in the blank solution.