SPECTROPHOTOMETRY
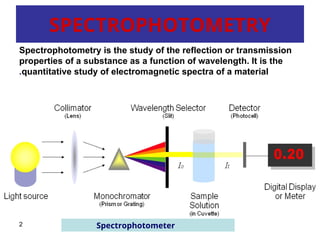
Spectrophotometry is thestudy of the reflection or transmission
properties of a substance as a function of wavelength. It is the
quantitative study of electromagnetic spectra of a material
.
2 Spectrophotometer
3.
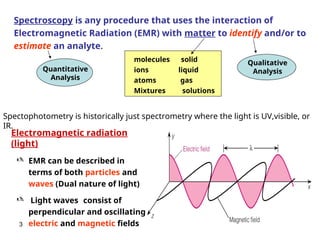
Spectroscopy is anyprocedure that uses the interaction of
Electromagnetic Radiation (EMR) with matter to identify and/or to
estimate an analyte.
3
Qualitative
Analysis
Quantitative
Analysis
Electromagnetic radiation
(light)
molecules solid
ions liquid
atoms gas
Mixtures solutions
EMR can be described in
terms of both particles and
waves (Dual nature of light)
Light waves consist of
perpendicular and oscillating
electric and magnetic fields
Spectophotometry is historically just spectrometry where the light is UV,visible, or
IR.
4.
4
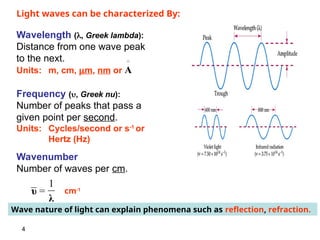
Wavelength (, Greeklambda):
Distance from one wave peak
to the next.
Units: m, cm, m, nm or
Frequency (, Greek nu):
Number of peaks that pass a
given point per second.
Units: Cycles/second or s-1
or
Hertz (Hz)
Wavenumber
Number of waves per cm.
A
λ
υ
1
=
Light waves can be characterized By:
cm-1
Wave nature of light can explain phenomena such as reflection, refraction.
5.
5
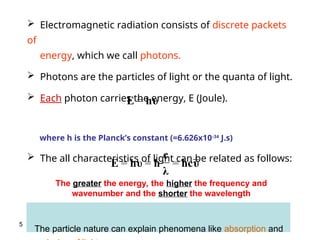
Electromagnetic radiationconsists of discrete packets
of
energy, which we call photons.
Photons are the particles of light or the quanta of light.
Each photon carries the energy, E (Joule).
where h is the Planck’s constant (=6.626x10⁻³⁴
J.s)
The all characteristics of light can be related as follows:
The particle nature can explain phenomena like absorption and
υ
hc
λ
c
h
υ
h
E =
=
=
υ
h
E =
The greater the energy, the higher the frequency and
wavenumber and the shorter the wavelength
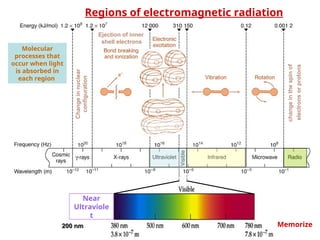
Regions of electromagneticradiation
Change
in
nuclear
configuration
Ejection of inner
shell electrons
change
in
the
spin
of
electrons
or
protons
Molecular
processes that
occur when light
is absorbed in
each region
Near
Ultraviole
t
200 nm
200 nm Memorize
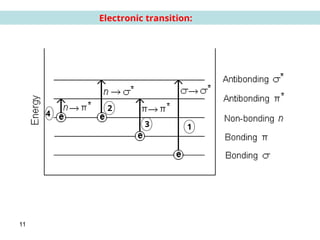
8.
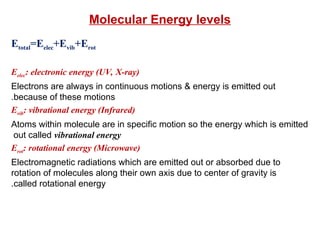
Molecular Energy levels
Etotal=Eelec+Evib+Erot
Eelec:electronic energy (UV, X-ray)
Electrons are always in continuous motions & energy is emitted out
because of these motions
.
Evib: vibrational energy (Infrared)
Atoms within molecule are in specific motion so the energy which is emitted
out called vibrational energy
Erot: rotational energy (Microwave)
Electromagnetic radiations which are emitted out or absorbed due to
rotation of molecules along their own axis due to center of gravity is
called rotational energy
.
9.
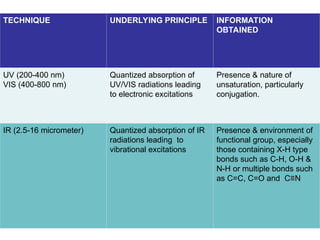
TECHNIQUE UNDERLYING PRINCIPLEINFORMATION
OBTAINED
UV (200-400 nm)
VIS (400-800 nm)
Quantized absorption of
UV/VIS radiations leading
to electronic excitations
Presence & nature of
unsaturation, particularly
conjugation.
IR (2.5-16 micrometer) Quantized absorption of IR
radiations leading to
vibrational excitations
Presence & environment of
functional group, especially
those containing X-H type
bonds such as C-H, O-H &
N-H or multiple bonds such
as C=C, C=O and C≡N
10.
10
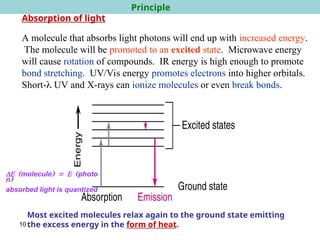
Absorption of light
Amolecule that absorbs light photons will end up with increased energy.
The molecule will be promoted to an excited state. Microwave energy
will cause rotation of compounds. IR energy is high enough to promote
bond stretching. UV/Vis energy promotes electrons into higher orbitals.
Short- UV and X-rays can ionize molecules or even break bonds.
Most excited molecules relax again to the ground state emitting
the excess energy in the form of heat.
moleculephoto
n
absorbed light is quantized
Principle
12
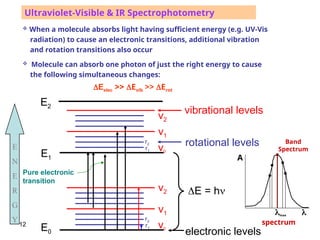
When amolecule absorbs light having sufficient energy (e.g. UV-Vis
radiation) to cause an electronic transitions, additional vibration
and rotation transitions also occur
Molecule can absorb one photon of just the right energy to cause
the following simultaneous changes:
rotational levels
vibrational levels
v2
v1
E0
E1
E = h
electronic levels
E
N
E
R
G
Y
Pure electronic
transition
r1
r2
E2
A
max
spectrum
Band
Spectrum
v1
v2
Ultraviolet-Visible & IR Spectrophotometry
v0
r1
r2
v0
Eelec >> Evib >> Erot
13.
13
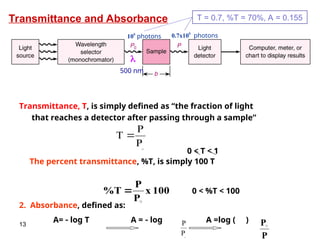
Transmittance and Absorbance
Transmittance,T, is simply defined as “the fraction of light
that reaches a detector after passing through a sample”
The percent transmittance, %T, is simply 100 T
2. Absorbance, defined as:
A= log T A = log A =log ( )
P
P
T
100
x
P
P
T
%
P
P
106
photons
500 nm
0 < T < 1
0.7x10⁶
photons
0 < %T < 100
T = 0.7, %T = 70%, A = 0.155
P
P
14.
14
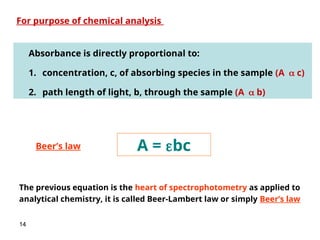
Absorbance is directlyproportional to:
1. concentration, c, of absorbing species in the sample (A c)
2. path length of light, b, through the sample (A b)
A = bc
For purpose of chemical analysis
The previous equation is the heart of spectrophotometry as applied to
analytical chemistry, it is called Beer-Lambert law or simply Beer’s law
Beer’s law
15.
15
Concentration
A
b
s
o
rb
a
n
c
e
,
A
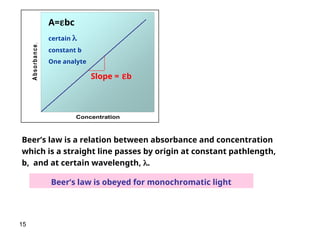
A=bc
certain
constant b
Oneanalyte
Beer’s law is a relation between absorbance and concentration
which is a straight line passes by origin at constant pathlength,
b, and at certain wavelength, .
Beer’s law is obeyed for monochromatic light
Slope = b
16.
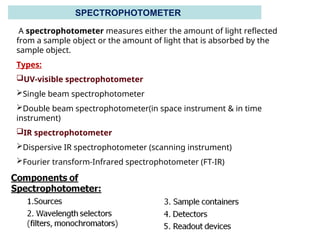
A spectrophotometer measureseither the amount of light reflected
from a sample object or the amount of light that is absorbed by the
sample object.
Types:
UV-visible spectrophotometer
Single beam spectrophotometer
Double beam spectrophotometer(in space instrument & in time
instrument)
IR spectrophotometer
Dispersive IR spectrophotometer (scanning instrument)
Fourier transform-Infrared spectrophotometer (FT-IR)
SPECTROPHOTOMETER
17.
17
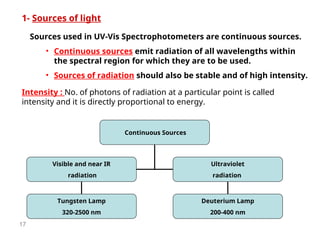
1- Sources oflight
Sources used in UV-Vis Spectrophotometers are continuous sources.
• Continuous sources emit radiation of all wavelengths within
the spectral region for which they are to be used.
• Sources of radiation should also be stable and of high intensity.
Continuous Sources
Visible and near IR
radiation
Ultraviolet
radiation
Deuterium Lamp
200-400 nm
Tungsten Lamp
320-2500 nm
Intensity : No. of photons of radiation at a particular point is called
intensity and it is directly proportional to energy.
18.
18
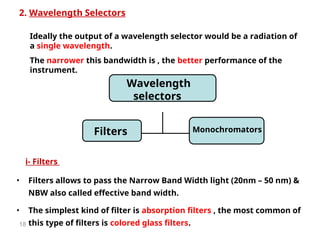
2. Wavelength Selectors
Ideallythe output of a wavelength selector would be a radiation of
a single wavelength.
The narrower this bandwidth is , the better performance of the
instrument.
Wavelength
selectors
Filters Monochromators
• Filters allows to pass the Narrow Band Width light (20nm – 50 nm) &
NBW also called effective band width.
• The simplest kind of filter is absorption filters , the most common of
this type of filters is colored glass filters.
i- Filters
19.
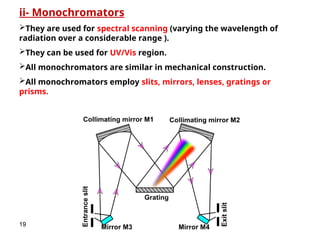
ii- Monochromators
They areused for spectral scanning (varying the wavelength of
radiation over a considerable range ).
They can be used for UV/Vis region.
All monochromators are similar in mechanical construction.
All monochromators employ slits, mirrors, lenses, gratings or
prisms.
19
20.
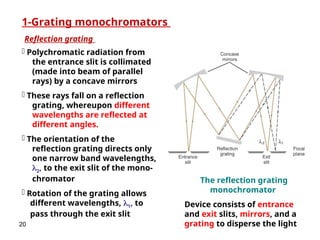
Reflection grating
1-Grating monochromators
Polychromatic radiation from
the entrance slit is collimated
(made into beam of parallel
rays) by a concave mirrors
These rays fall on a reflection
grating, whereupon different
wavelengths are reflected at
different angles.
The orientation of the
reflection grating directs only
one narrow band wavelengths,
2, to the exit slit of the mono-
chromator
Rotation of the grating allows
different wavelengths, 1, to
pass through the exit slit
The reflection grating
monochromator
Device consists of entrance
and exit slits, mirrors, and a
grating to disperse the light
20
21.
21
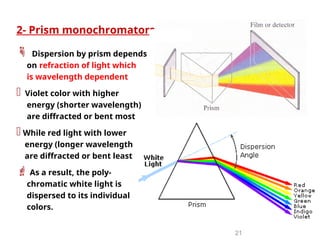
2- Prism monochromators
Dispersion by prism depends
on refraction of light which
is wavelength dependent
Violet color with higher
energy (shorter wavelength)
are diffracted or bent most
While red light with lower
energy (longer wavelength
are diffracted or bent least
As a result, the poly-
chromatic white light is
dispersed to its individual
colors.
22.
22
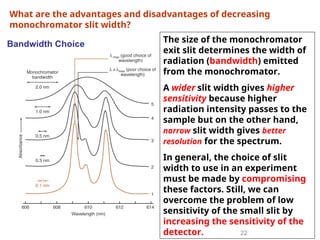
Bandwidth Choice Thesize of the monochromator
exit slit determines the width of
radiation (bandwidth) emitted
from the monochromator.
A wider slit width gives higher
sensitivity because higher
radiation intensity passes to the
sample but on the other hand,
narrow slit width gives better
resolution for the spectrum.
In general, the choice of slit
width to use in an experiment
must be made by compromising
these factors. Still, we can
overcome the problem of low
sensitivity of the small slit by
increasing the sensitivity of the
detector.
What are the advantages and disadvantages of decreasing
monochromator slit width?
23.
23
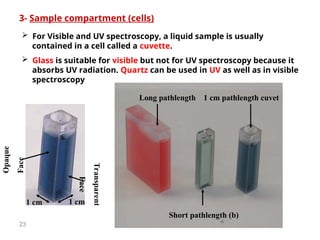
3- Sample compartment(cells)
For Visible and UV spectroscopy, a liquid sample is usually
contained in a cell called a cuvette.
Glass is suitable for visible but not for UV spectroscopy because it
absorbs UV radiation. Quartz can be used in UV as well as in visible
spectroscopy
1 cm 1 cm
Opaque
Face
Transparent
Face
Long pathlength
Short pathlength (b)
1 cm pathlength cuvet
24.
24
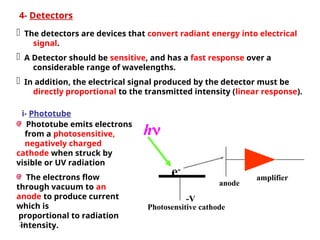
4- Detectors
Thedetectors are devices that convert radiant energy into electrical
signal.
A Detector should be sensitive, and has a fast response over a
considerable range of wavelengths.
In addition, the electrical signal produced by the detector must be
directly proportional to the transmitted intensity (linear response).
h
e-
-V
Photosensitive cathode
amplifier
i- Phototube
anode
Phototube emits electrons
from a photosensitive,
negatively charged
cathode when struck by
visible or UV radiation
The electrons flow
through vacuum to an
anode to produce current
which is
proportional to radiation
intensity.
25.
25
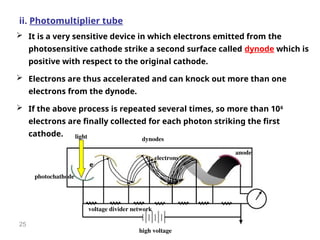
ii. Photomultiplier tube
It is a very sensitive device in which electrons emitted from the
photosensitive cathode strike a second surface called dynode which is
positive with respect to the original cathode.
Electrons are thus accelerated and can knock out more than one
electrons from the dynode.
If the above process is repeated several times, so more than 106
electrons are finally collected for each photon striking the first
cathode.
photochathode
anode
high voltage
voltage divider network
dynodes
light
electrons
e-
26.
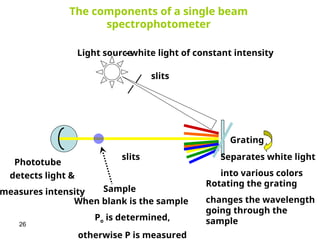
26
Light source
Grating
Rotating thegrating
changes the wavelength
going through the
sample
slits
slits
Sample
Phototube
The components of a single beam
spectrophotometer
When blank is the sample
Po is determined,
otherwise P is measured
Separates white light
into various colors
detects light &
measures intensity
- white light of constant intensity
27.
27
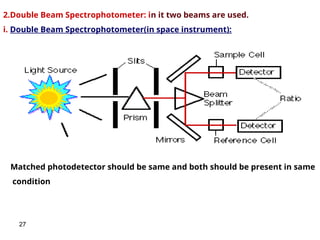
2.Double Beam Spectrophotometer:in it two beams are used.
i. Double Beam Spectrophotometer(in space instrument):
Matched photodetector should be same and both should be present in same
condition
28.
28
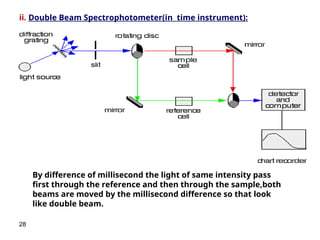
ii. Double BeamSpectrophotometer(in time instrument):
By difference of millisecond the light of same intensity pass
first through the reference and then through the sample,both
beams are moved by the millisecond difference so that look
like double beam.
29.
29
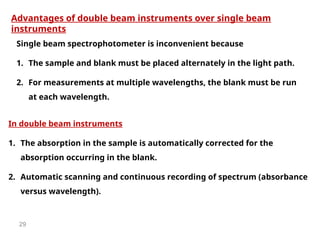
Advantages of doublebeam instruments over single beam
instruments
Single beam spectrophotometer is inconvenient because
1. The sample and blank must be placed alternately in the light path.
2. For measurements at multiple wavelengths, the blank must be run
at each wavelength.
In double beam instruments
1. The absorption in the sample is automatically corrected for the
absorption occurring in the blank.
2. Automatic scanning and continuous recording of spectrum (absorbance
versus wavelength).
30.
30
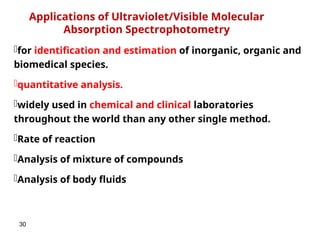
Applications of Ultraviolet/VisibleMolecular
Absorption Spectrophotometry
for identification and estimation of inorganic, organic and
biomedical species.
quantitative analysis.
widely used in chemical and clinical laboratories
throughout the world than any other single method.
Rate of reaction
Analysis of mixture of compounds
Analysis of body fluids
31.
31
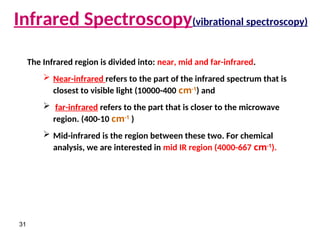
Infrared Spectroscopy(vibrational spectroscopy)
TheInfrared region is divided into: near, mid and far-infrared.
Near-infrared refers to the part of the infrared spectrum that is
closest to visible light (10000-400 cm-1
) and
far-infrared refers to the part that is closer to the microwave
region. (400-10 cm-1
)
Mid-infrared is the region between these two. For chemical
analysis, we are interested in mid IR region (4000-667 cm-1
).
32.
32
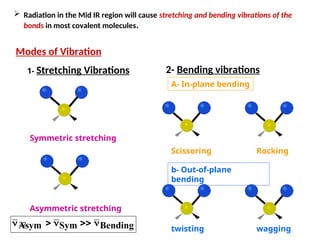
Radiation inthe Mid IR region will cause stretching and bending vibrations of the
bonds in most covalent molecules.
Symmetric stretching
Asymmetric stretching
1- Stretching Vibrations
Modes of Vibration
2- Bending vibrations
A- In-plane bending
Scissoring Rocking
twisting wagging
b- Out-of-plane
bending
Bending
Sym
Asym
33.
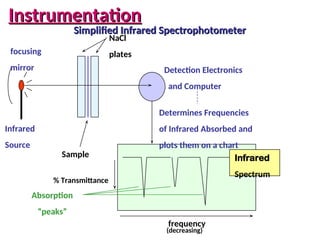
Detection Electronics
and Computer
Infrared
Source
DeterminesFrequencies
of Infrared Absorbed and
plots them on a chart
Sample
Simplified Infrared Spectrophotometer
Simplified Infrared Spectrophotometer
NaCl
plates
Absorption
“peaks”
Infrared
Spectrum
frequency
% Transmittance
(decreasing)
focusing
mirror
Instrumentation
Instrumentation
34.
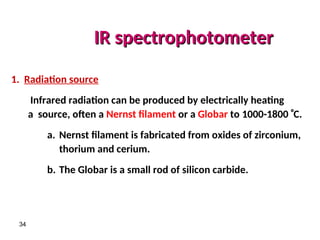
IR spectrophotometer
IR spectrophotometer
34
1.Radiation source
Infrared radiation can be produced by electrically heating
a source, often a Nernst filament or a Globar to 1000-1800 C.
a. Nernst filament is fabricated from oxides of zirconium,
thorium and cerium.
b. The Globar is a small rod of silicon carbide.
35.
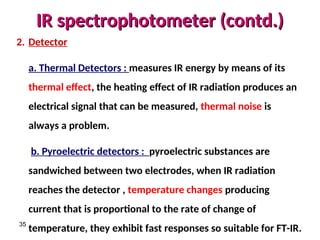
IR spectrophotometer (contd.)
IRspectrophotometer (contd.)
35
2. Detector
a. Thermal Detectors : measures IR energy by means of its
thermal effect, the heating effect of IR radiation produces an
electrical signal that can be measured, thermal noise is
always a problem.
b. Pyroelectric detectors : pyroelectric substances are
sandwiched between two electrodes, when IR radiation
reaches the detector , temperature changes producing
current that is proportional to the rate of change of
temperature, they exhibit fast responses so suitable for FT-IR.
36.
36
• Types
• DispersionSpectrometers (older technique)
• Fourier Transform Infrared (FT-IR) Spectrometers
(Modern technique)
• Nearly all IR spectrometers, nowadays, are of the
FT type.
Infrared Instrumentation
Infrared Instrumentation
37.
37
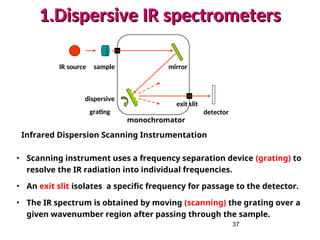
1.Dispersive IR spectrometers
1.DispersiveIR spectrometers
Infrared Dispersion Scanning Instrumentation
• Scanning instrument uses a frequency separation device (grating) to
resolve the IR radiation into individual frequencies.
• An exit slit isolates a specific frequency for passage to the detector.
• The IR spectrum is obtained by moving (scanning) the grating over a
given wavenumber region after passing through the sample.
IR source sample
detector
dispersive
grating
mirror
monochromator
exit slit
38.
38
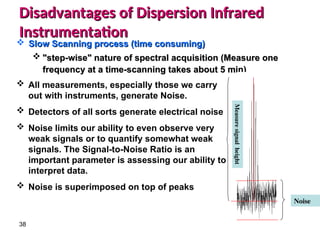
Slow Scanningprocess (time consuming)
Slow Scanning process (time consuming)
"step-wise" nature of spectral acquisition (Measure one
"step-wise" nature of spectral acquisition (Measure one
frequency at a time-scanning takes about 5 min)
frequency at a time-scanning takes about 5 min)
Disadvantages of Dispersion Infrared
Disadvantages of Dispersion Infrared
Instrumentation
Instrumentation
Noise
Measure
signal
height
All measurements, especially those we carry
out with instruments, generate Noise.
Detectors of all sorts generate electrical noise
Noise limits our ability to even observe very
weak signals or to quantify somewhat weak
signals. The Signal-to-Noise Ratio is an
important parameter is assessing our ability to
interpret data.
Noise is superimposed on top of peaks
39.
39
Fourier TransformInfrared (FT-IR) spectrometry was developed
in order to overcome the limitations encountered with dispersive
instruments mainly the slow scanning process.
2.Fourier Transform IR
2.Fourier Transform IR
A solution was developed which employed a very simple
optical device called an interferometer. The interferometer
produces a unique type of signal which has all of the infrared
frequencies “encoded” into it. The signal can be measured
very quickly, usually on the order of one second or so.
40.
40
FTIR systems
FTIR systems
1.Mechanical operation
• Encode (modulate) the spectral information using a
Michelson Interferometer.
2. Mathematical operation
• Computer processing of encoded information to
produces the spectrum (Decoding).
42
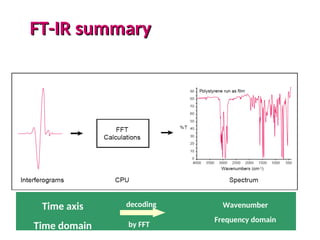
Fourier transform
Fourier transform
(MathematicalOperation)
(Mathematical Operation)
Because the analyst requires a frequency spectrum (a plot of
the intensity at each individual frequency) in order to make
an identification, the measured Interferogram signal can not
be interpreted directly. A means of “decoding” the individual
frequencies is required. This can be accomplished via a well-
known mathematical technique called the Fourier
transformation. This transformation is performed by the
computer which then presents the user with the desired
spectral information for analysis.
44
• Speed
• Sensitivityis dramatically improved with FT-IR ; detectors are
much more sensitive, the optical throughput is much higher,
higher signal to noise ratio.
• Mechanical Simplicity
• Internally Calibrated These instruments employ a He-Ne laser
as an internal wavelength calibration standard .These
instruments are self-calibrating and never need to be
calibrated by the user.
FT-IR Advantages
FT-IR Advantages
45.
45
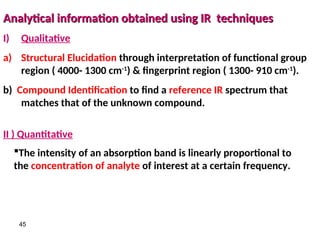
Analytical information obtainedusing IR techniques
Analytical information obtained using IR techniques
I) Qualitative
a) Structural Elucidation through interpretation of functional group
region ( 4000- 1300 cm-1
) & fingerprint region ( 1300- 910 cm-1
).
b) Compound Identification to find a reference IR spectrum that
matches that of the unknown compound.
II ) Quantitative
The intensity of an absorption band is linearly proportional to
the concentration of analyte of interest at a certain frequency.
46.
46
Applications of InfraredAnalysis
Applications of Infrared Analysis
Analysis of petroleum hydrocarbons , oil and grease content
Determination of air contaminants.
Determination of protein, starch, oil , lipids and cellulose in
agricultural products .
Pharmaceutical research.
Forensic investigations.
Polymer analysis.
Quality assurance and control.
Environmental and water quality analysis methods.
Biochemical and biomedical research.
Coatings and surfactants.
47.
47
Textbook: Principles ofInstrumental Analysis, Skoog, Holler, Nieman
Textbook: Organic spectroscopy and chromatography by M.Younas
http://www.chemguide.co.uk/analysismenu.html
http://www.wiziq.com/tutorial/91202-QUIZ-Infrared-spectroscopy
Resources and references
#15
Log 10 X = Y ------ X = 10Y
Log 1000 = 3 ------ 1000 = 103
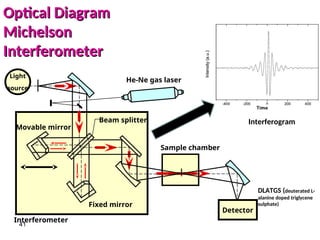
#41 Principles of FTIR
Structure of an Interferometer
Fourier spectroscopy used in FT-IR is the general term for the use of a two-beam interferometer (primarily Michelson interferometers) in spectroscopy. A Michelson interferometer consists of a half-mirror (beam splitter) and two reflecting mirrors. One of the reflecting mirrors is fixed in place (fixed mirror) and the other has a mechanism for moving parallel to the optical axis (movable mirror).
Light from the light source is collimated and directed into the interferometer, striking the beam splitter at an angle, thereby separating the light into transmitted light and reflected light. These two beams of light are each reflected by the fixed mirror and movable mirror, and then returned to the beam splitter where they are recombined into a single beam.
#46 1- Freon (1,1,2-trichloro-1,2,2-trifluoroethane ) contains no C-H bonds, and thus does not absorb IR radiation in the aforementioned 3100 to 2700 cm–1 where HC, oil and grease absorb.
2- compared to standard sample of air with known contaminants.
3- reflectance mode, each reflected band is characteristic for one of the analytes, the reflectance value is proportional to the conc.