Download to read offline

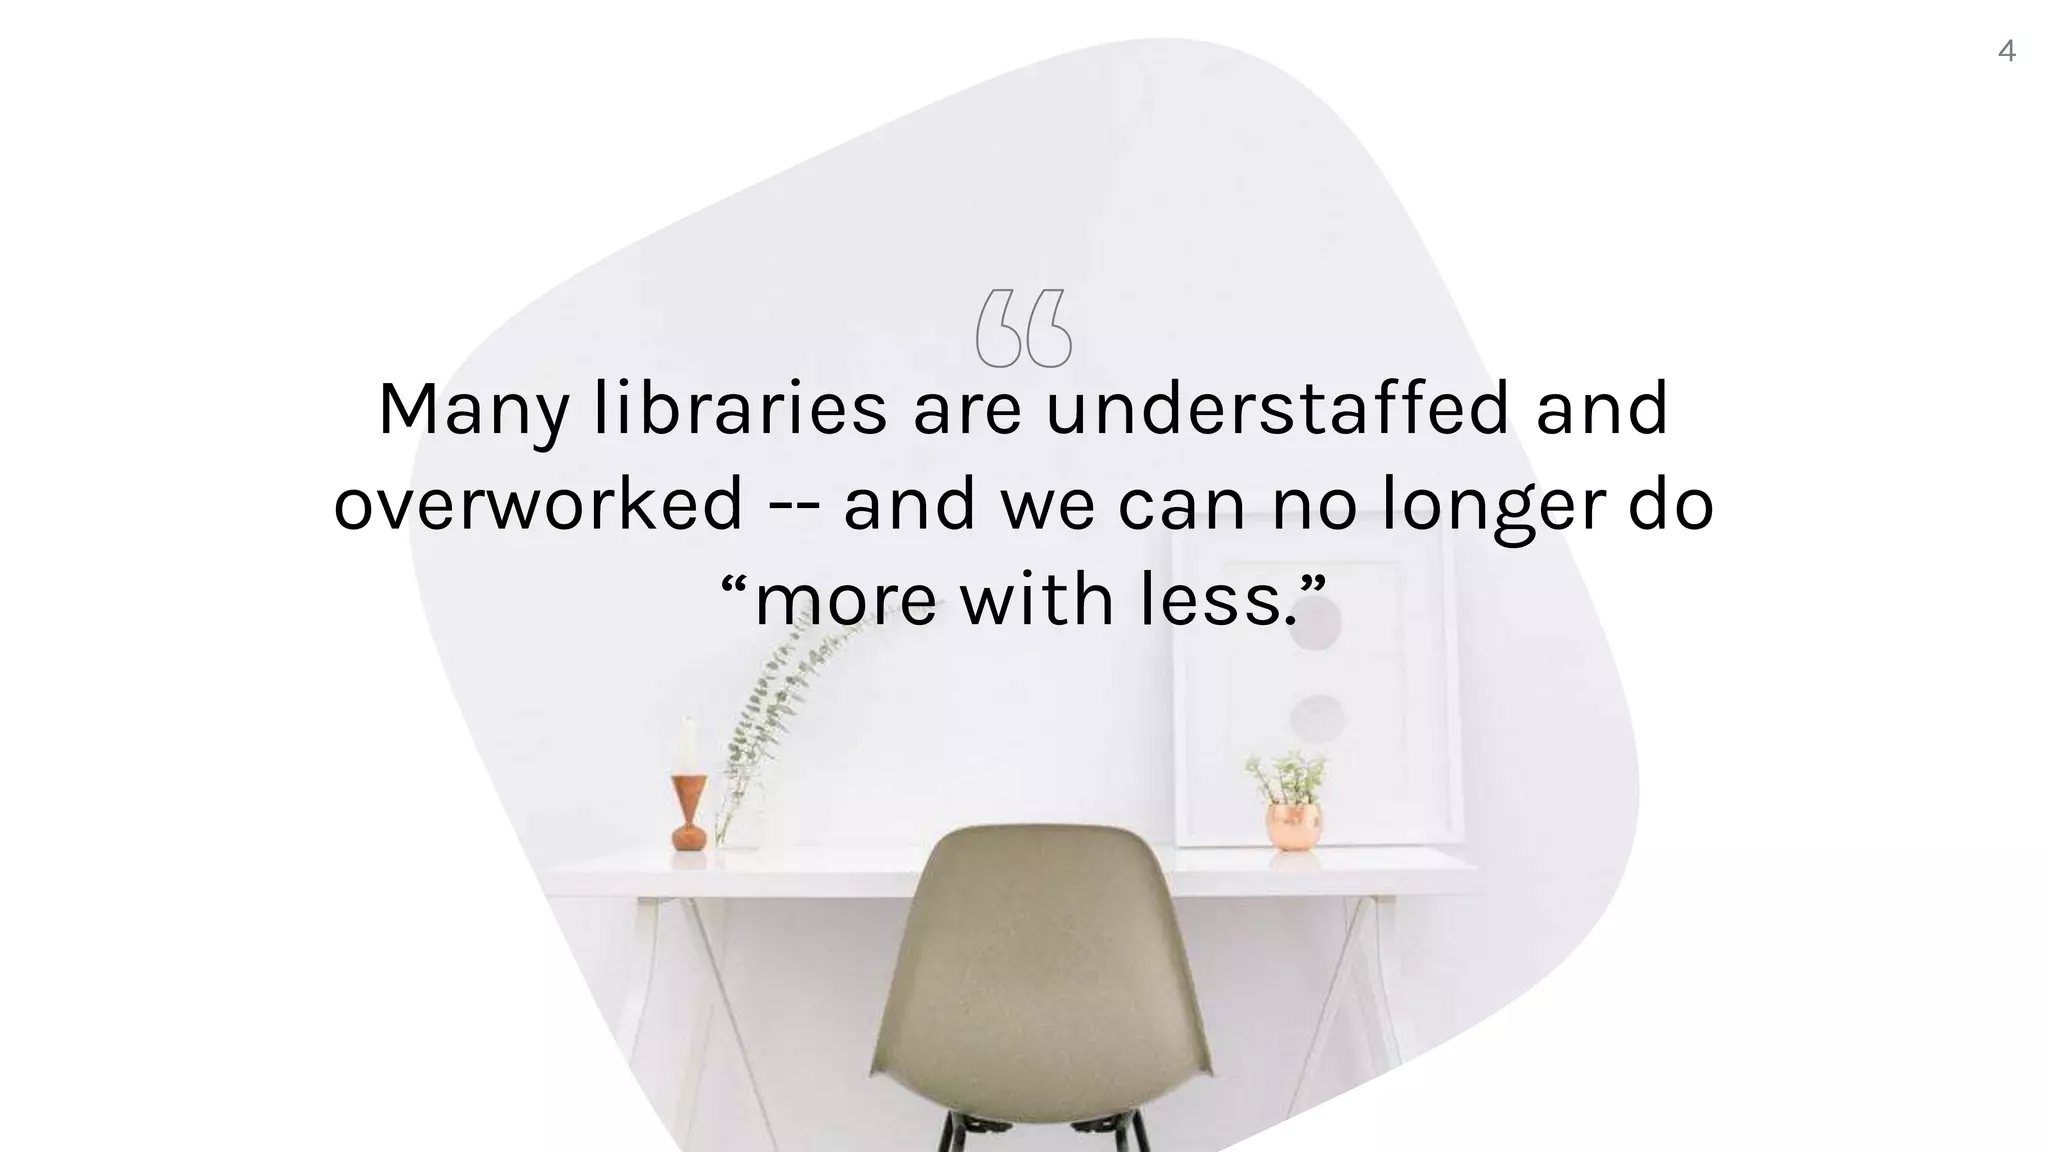
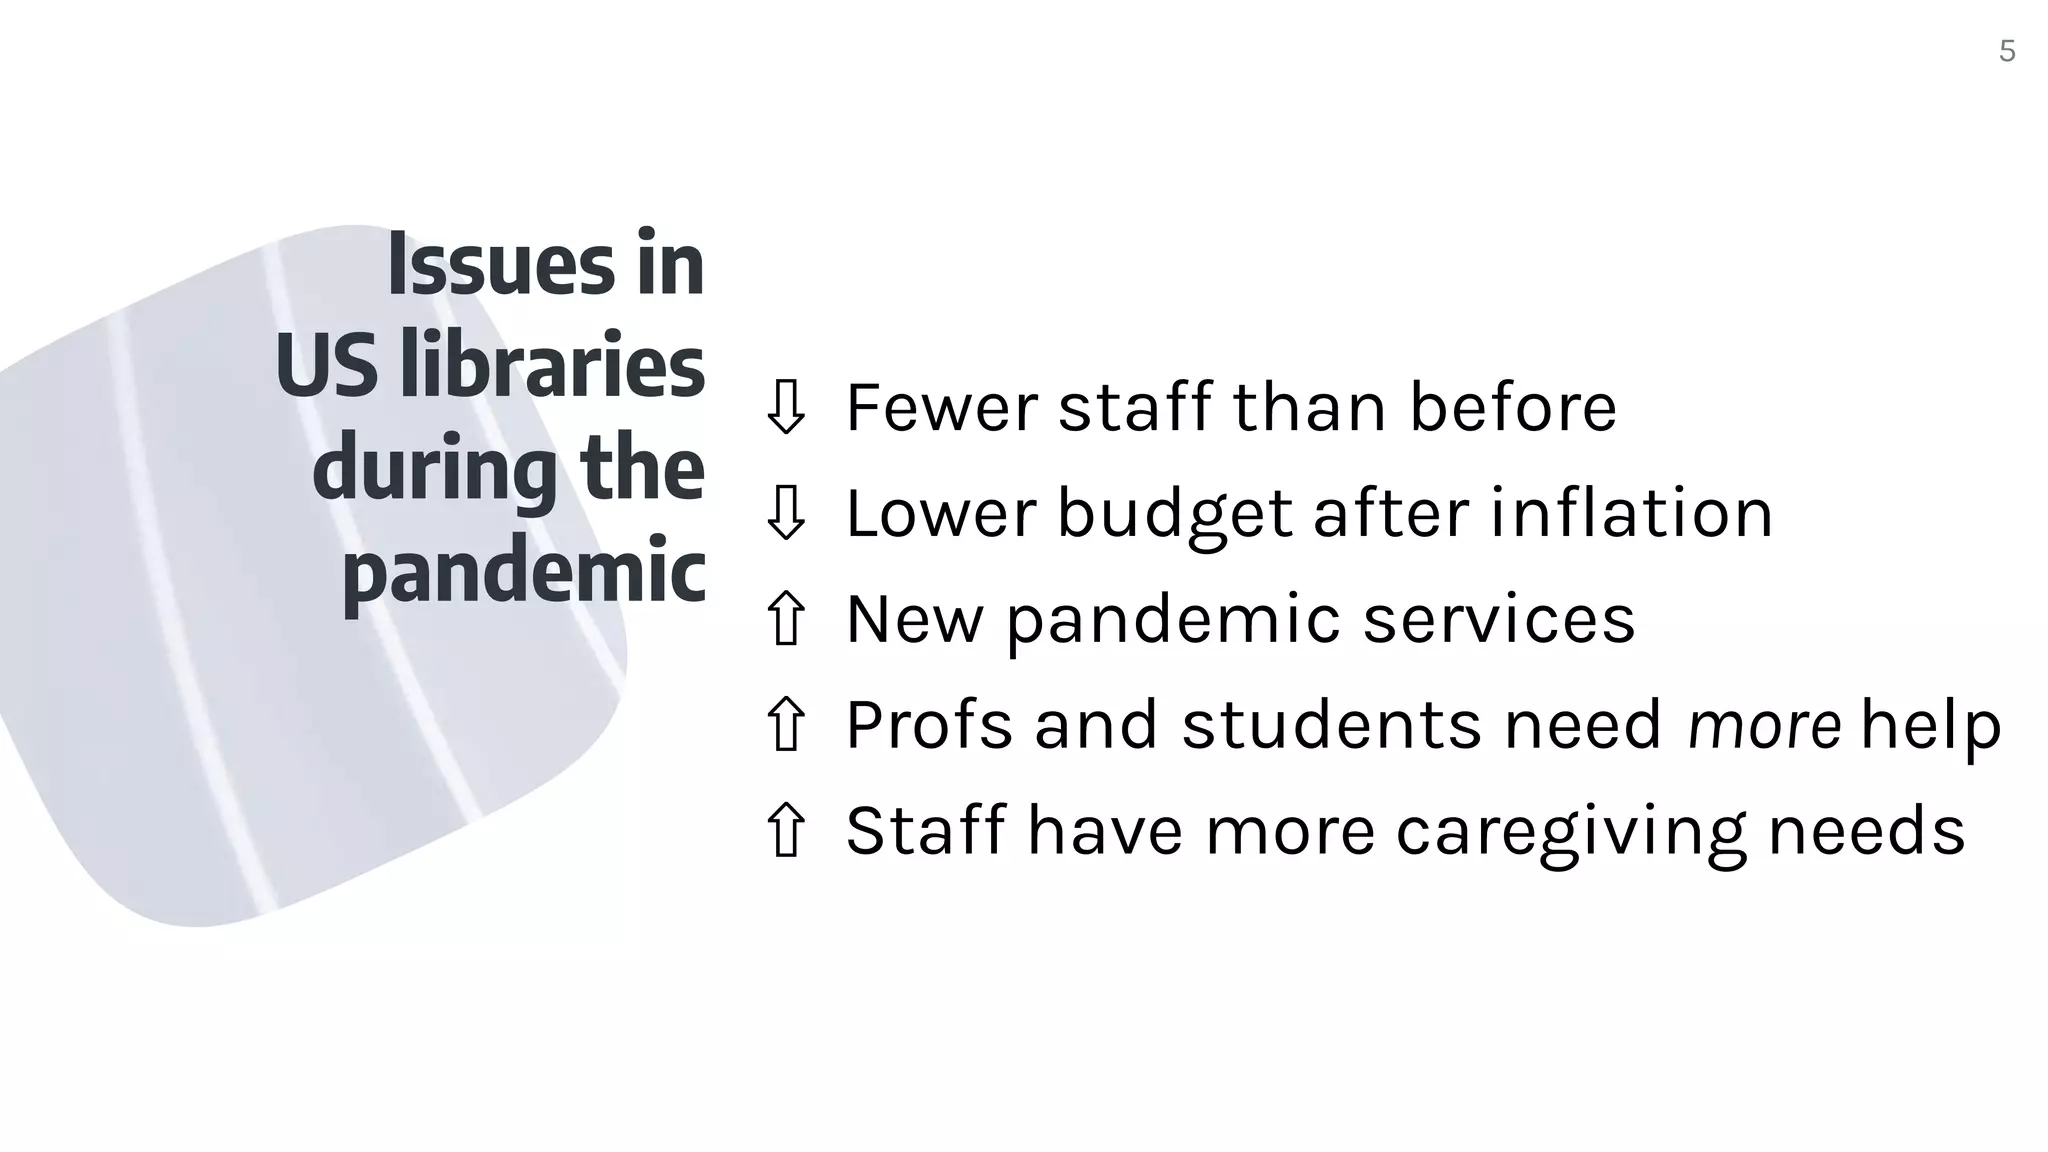

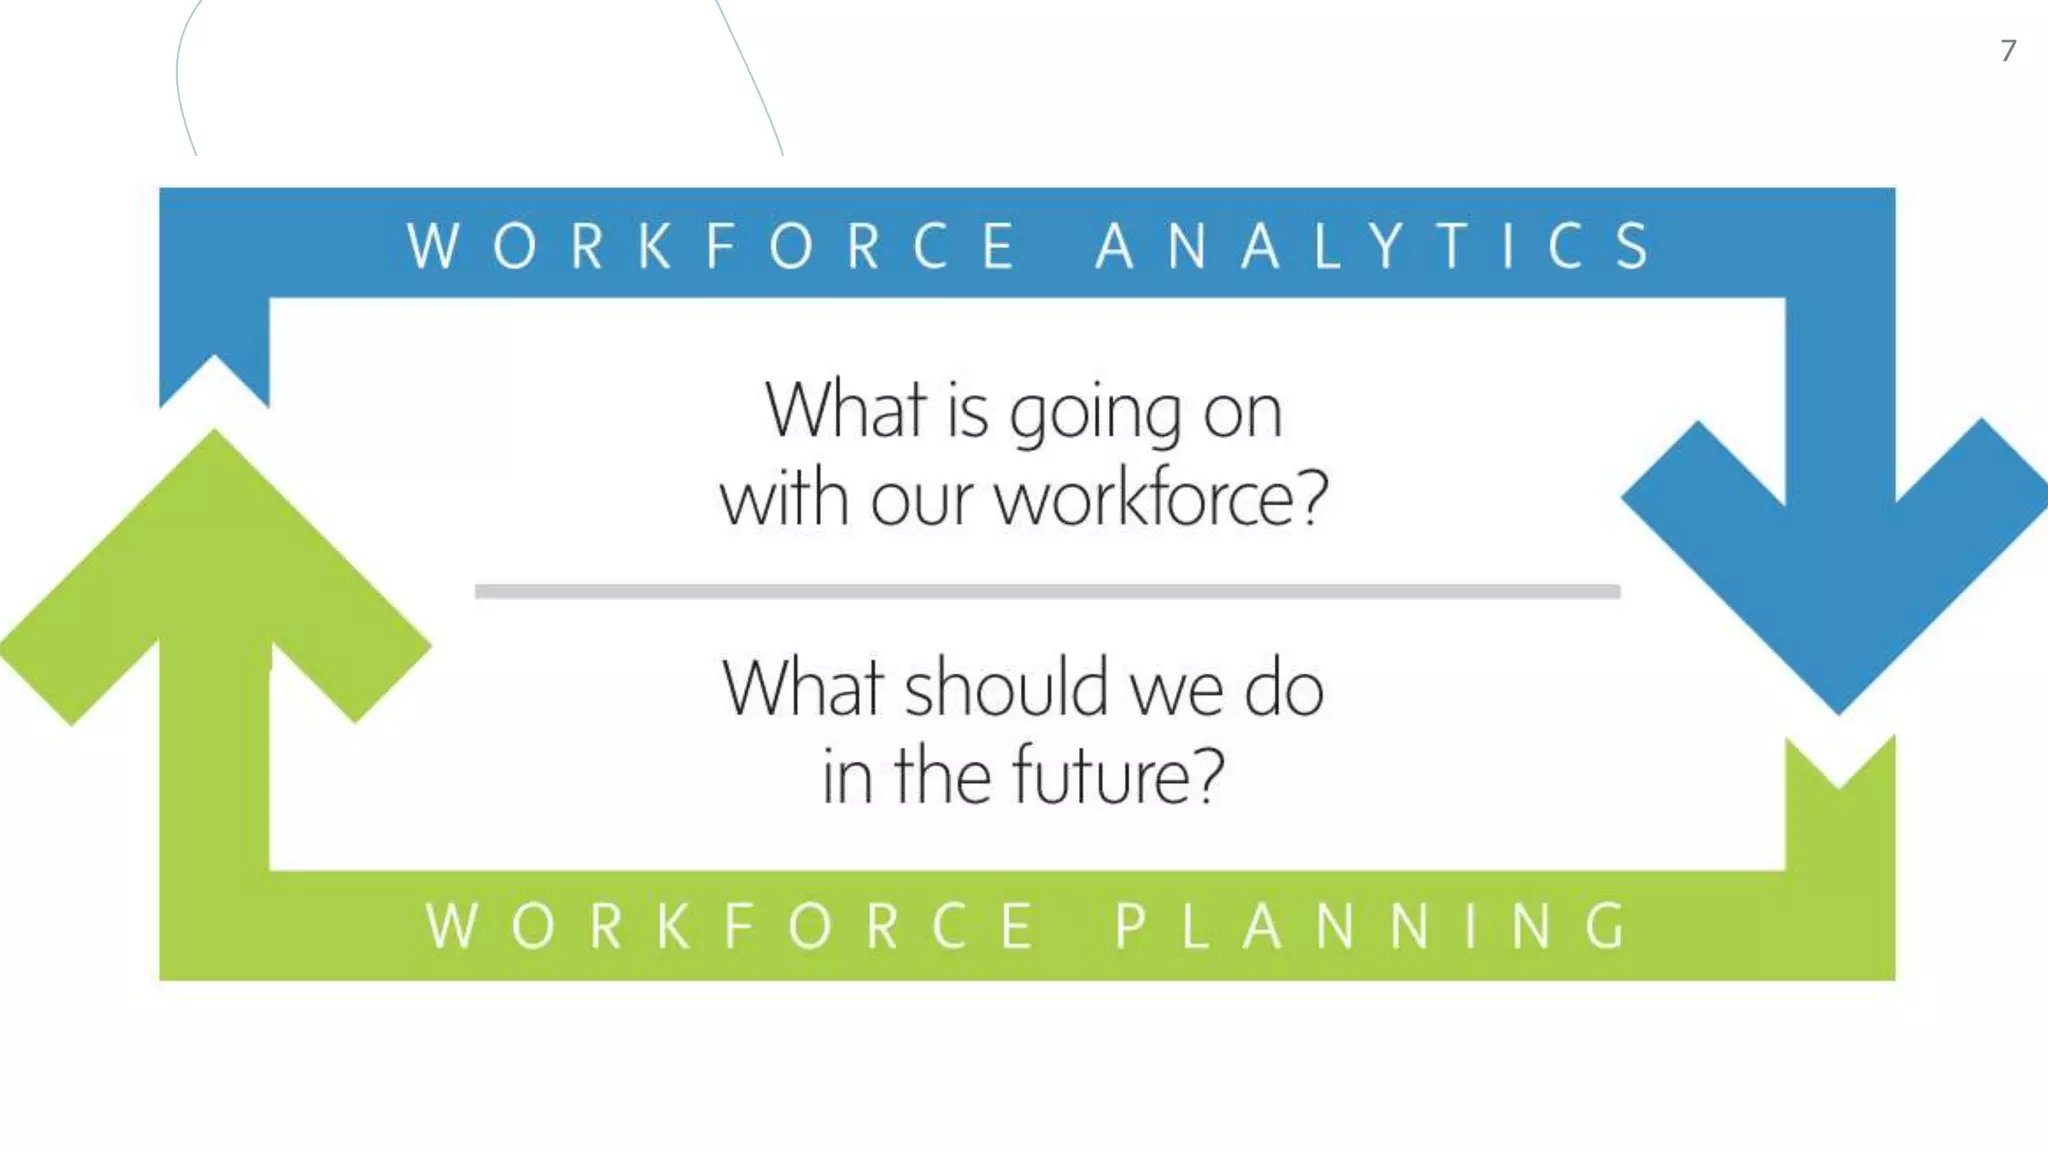
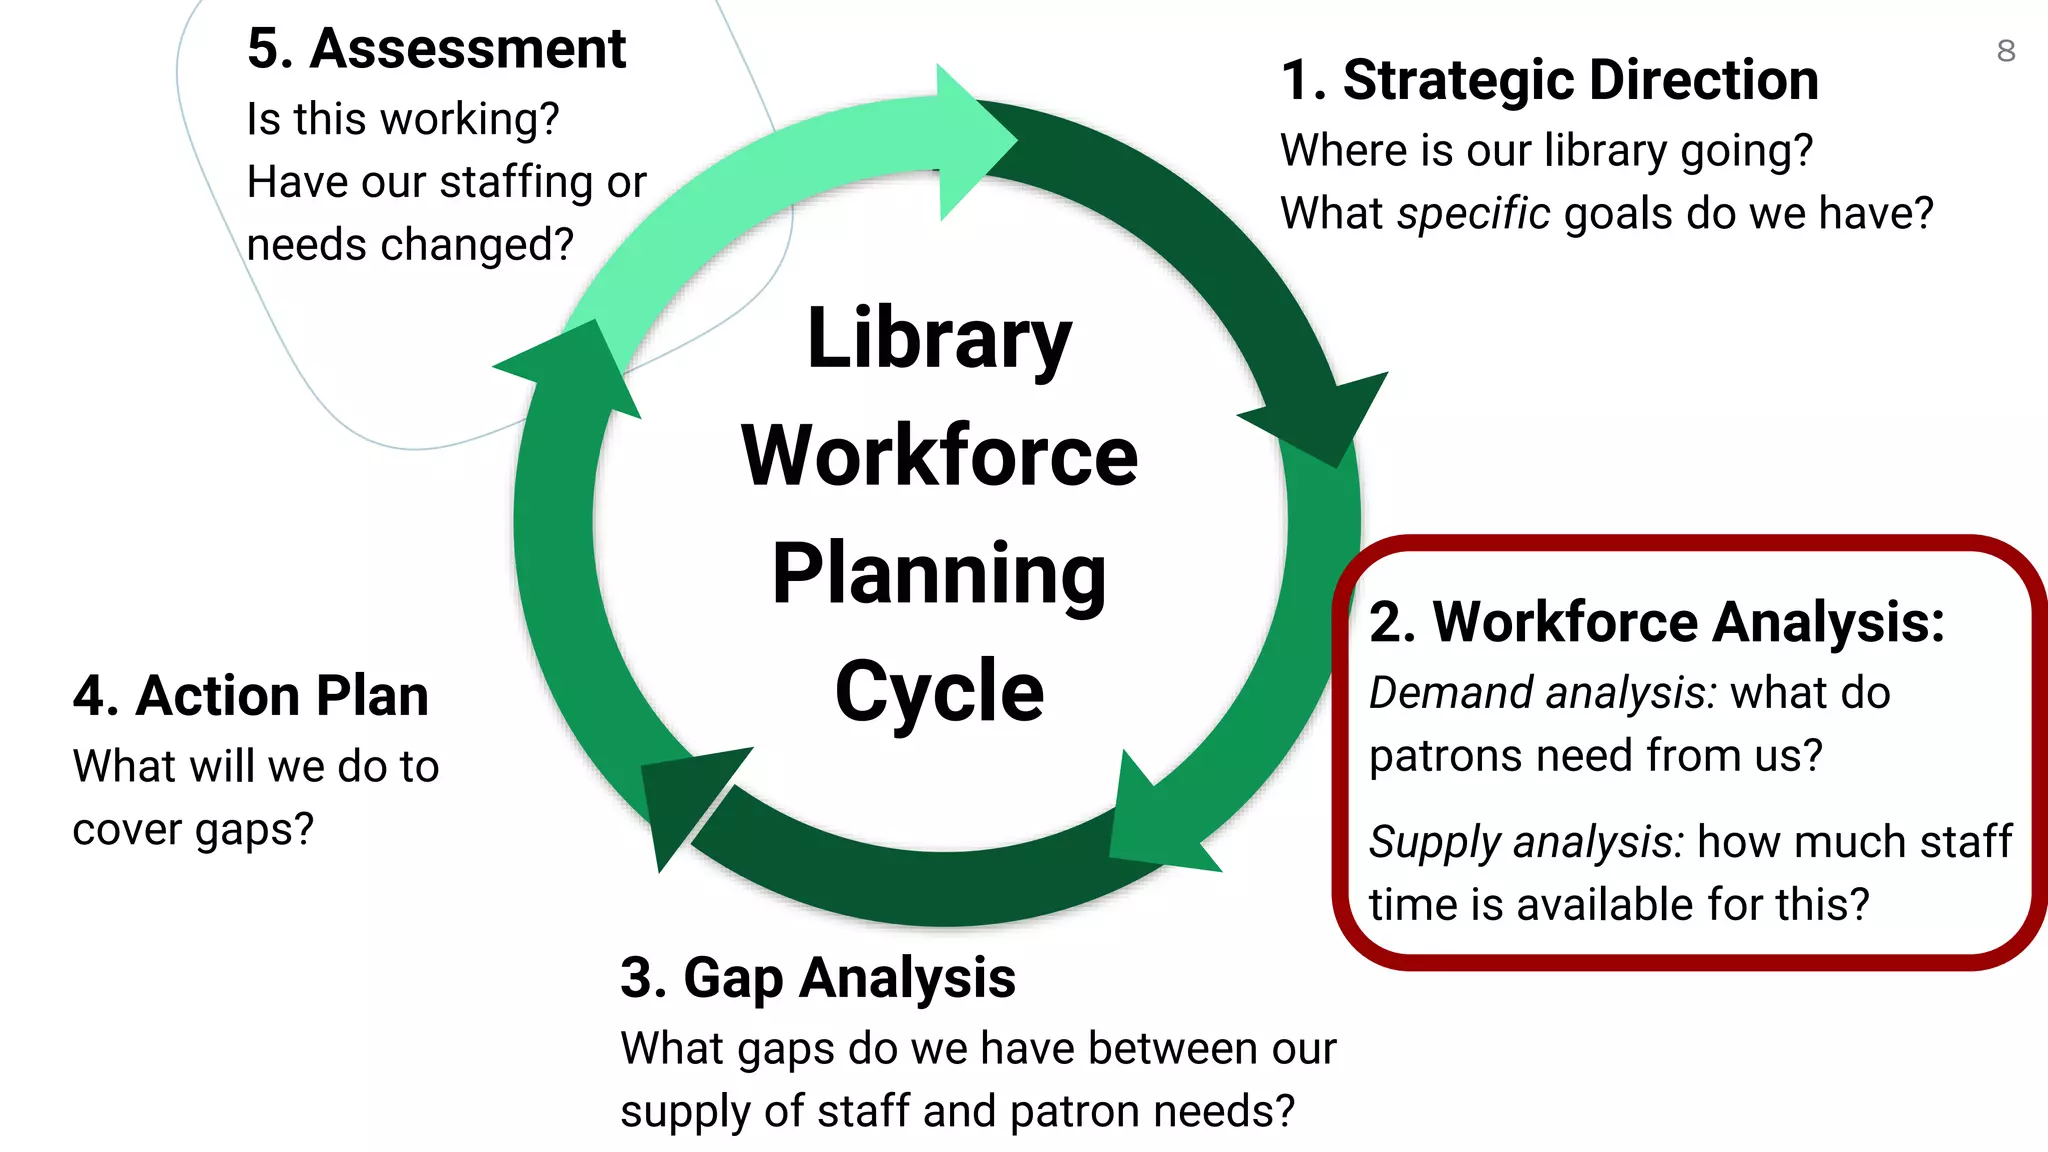
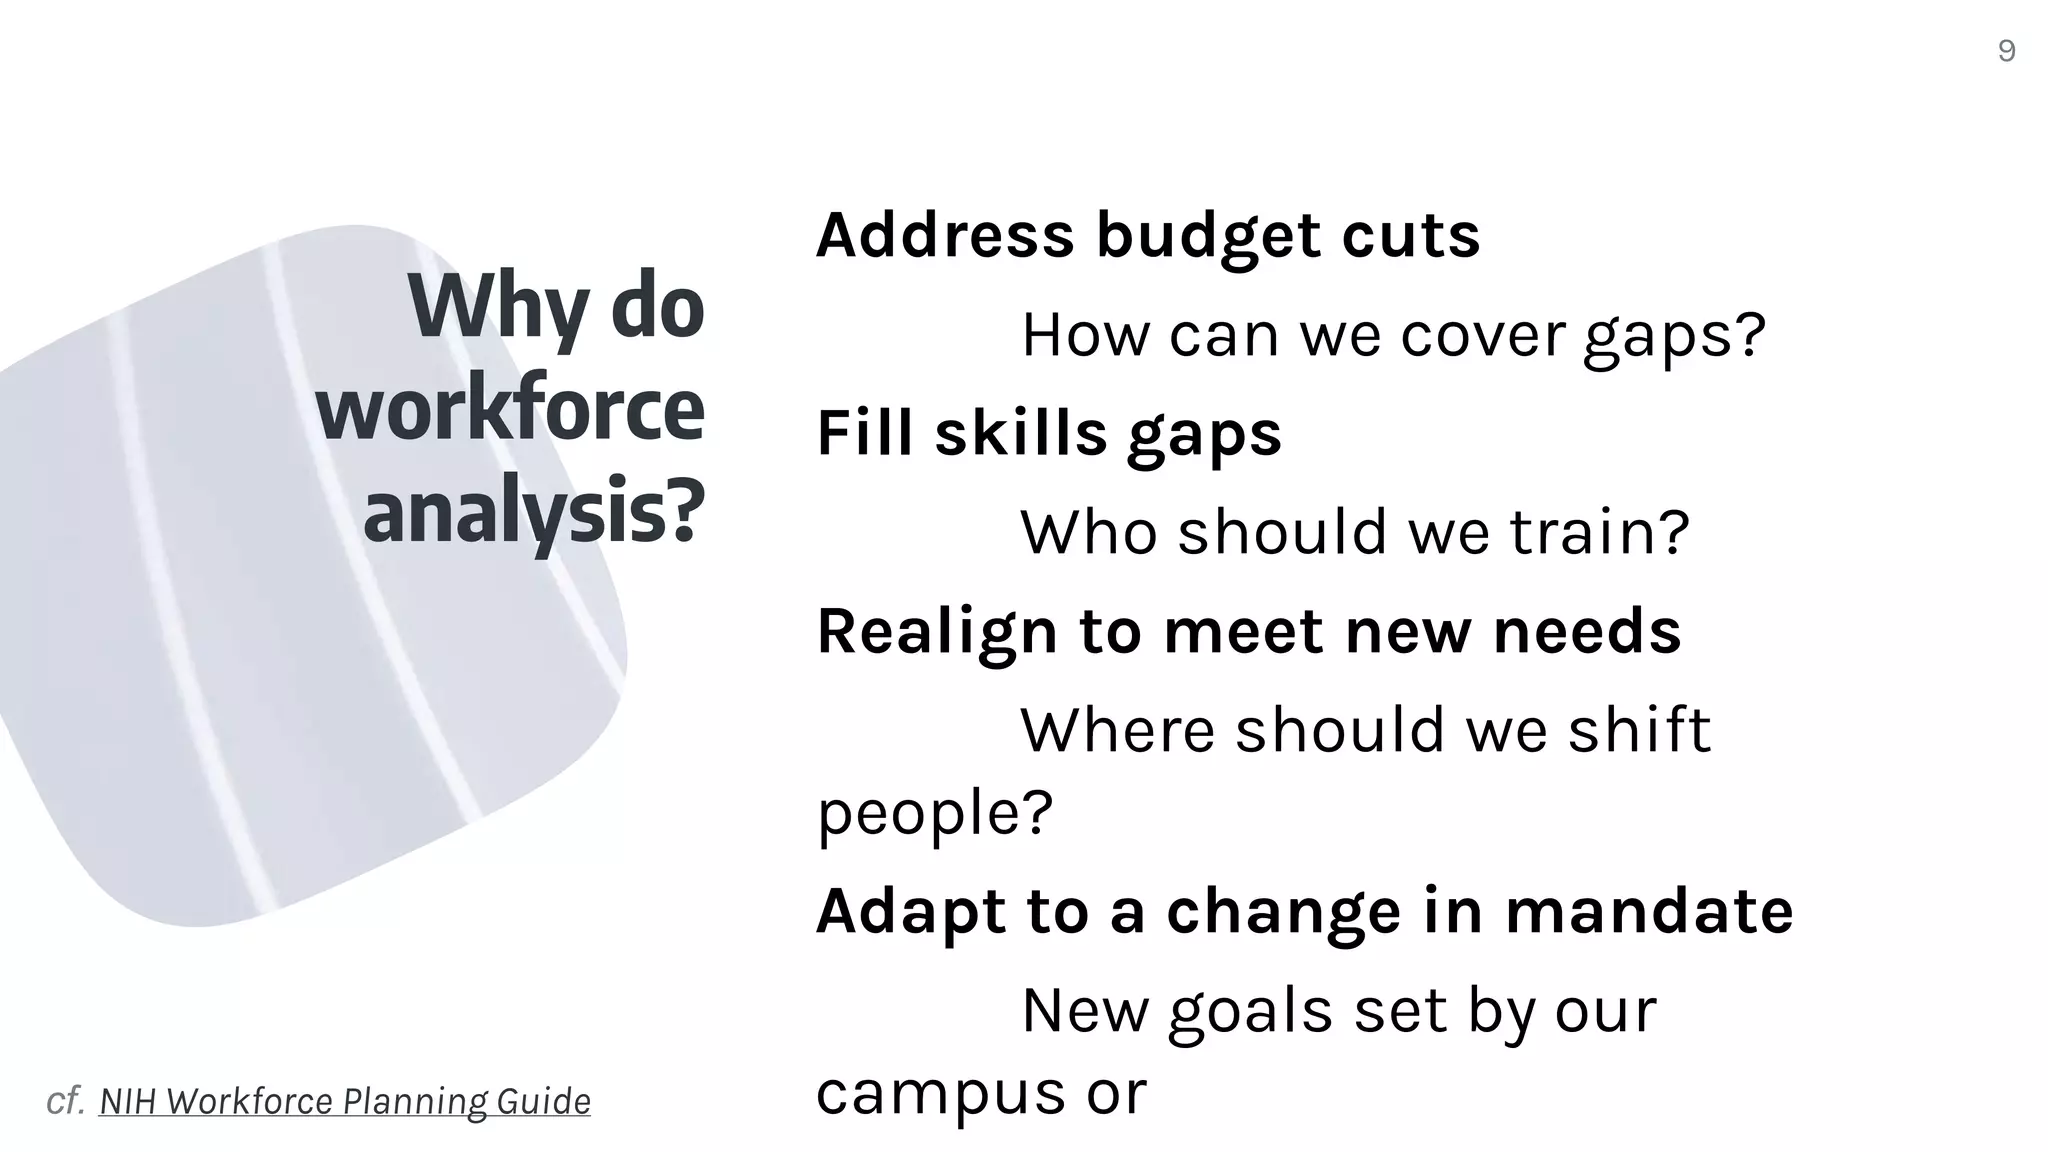


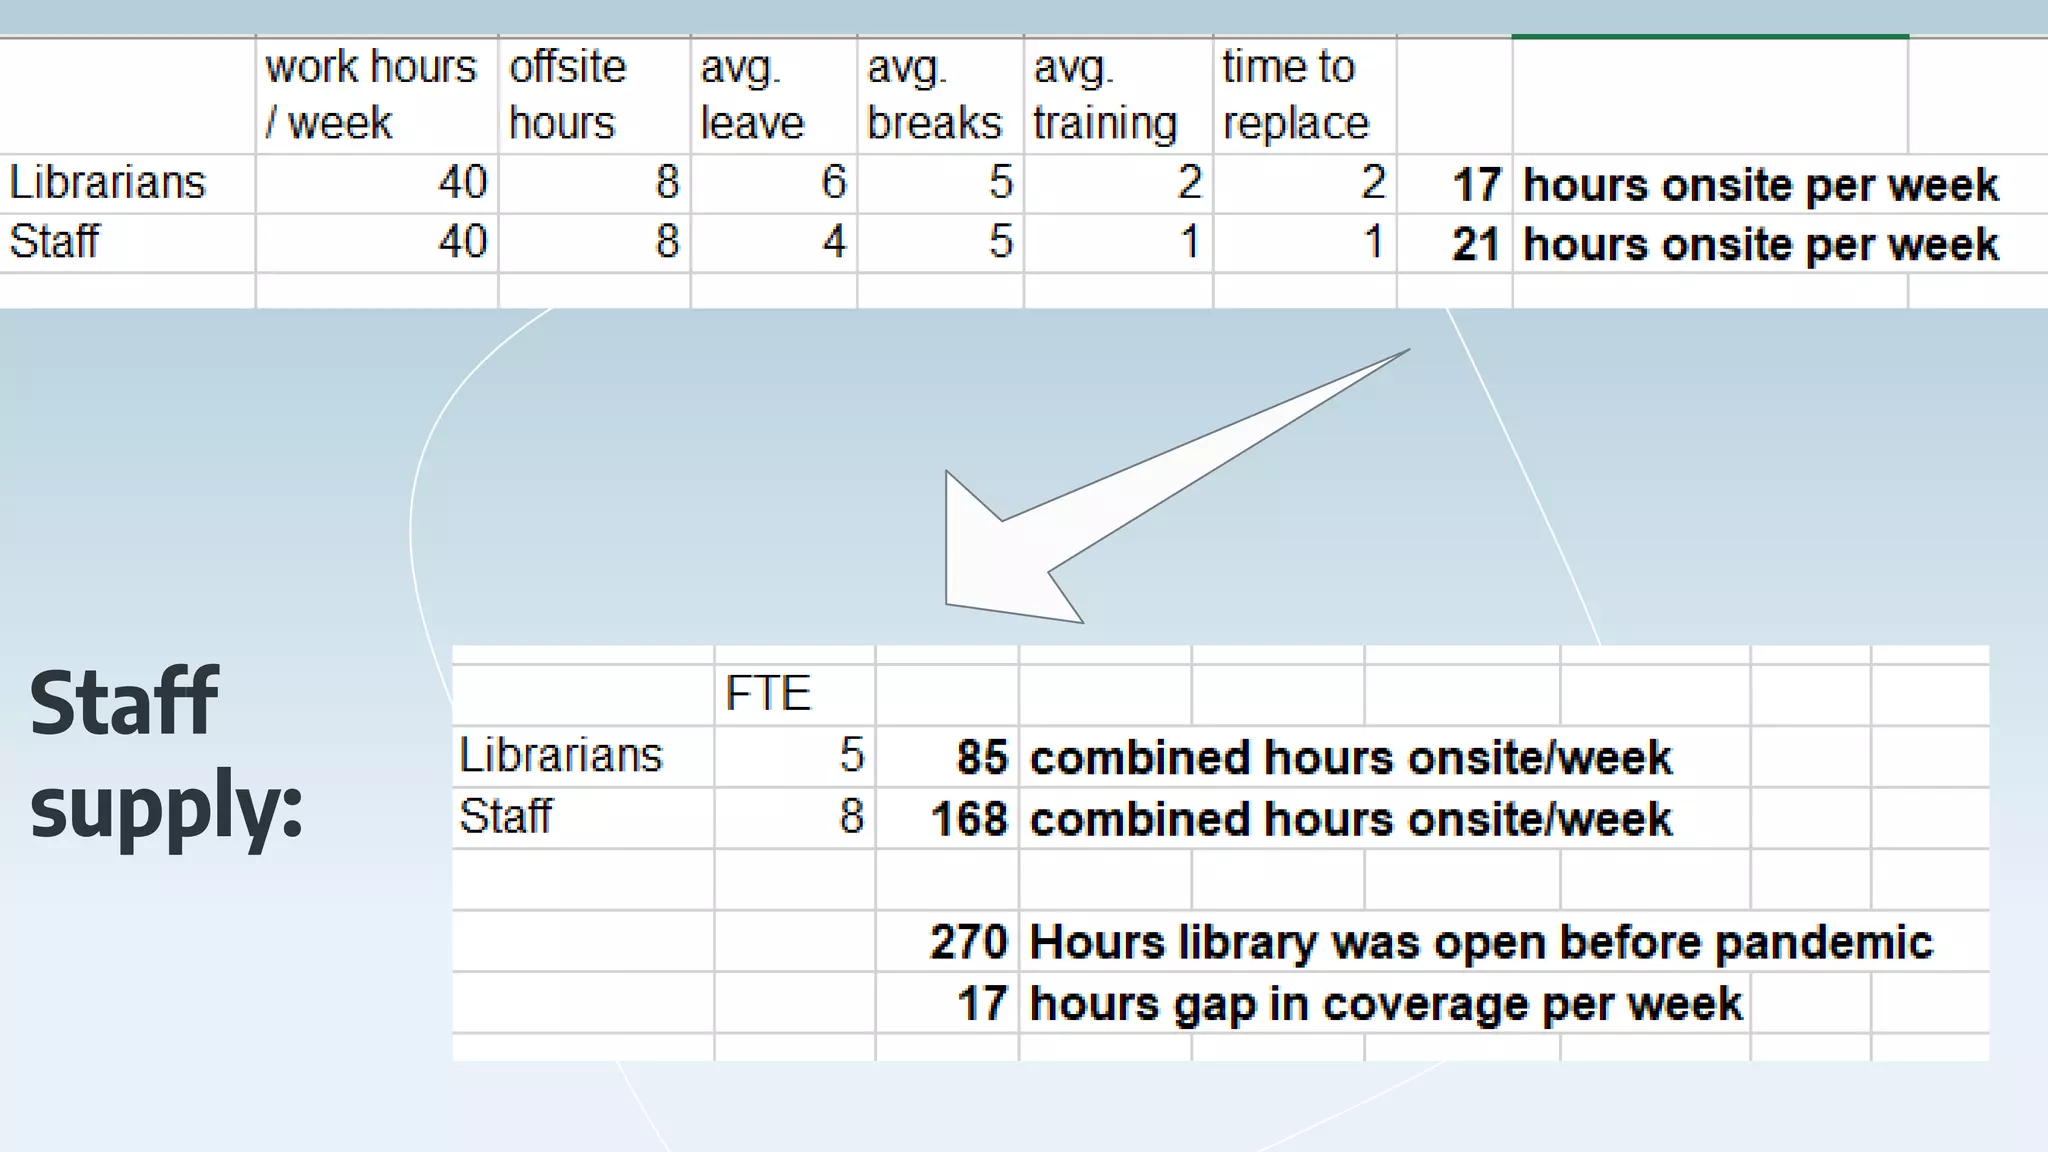
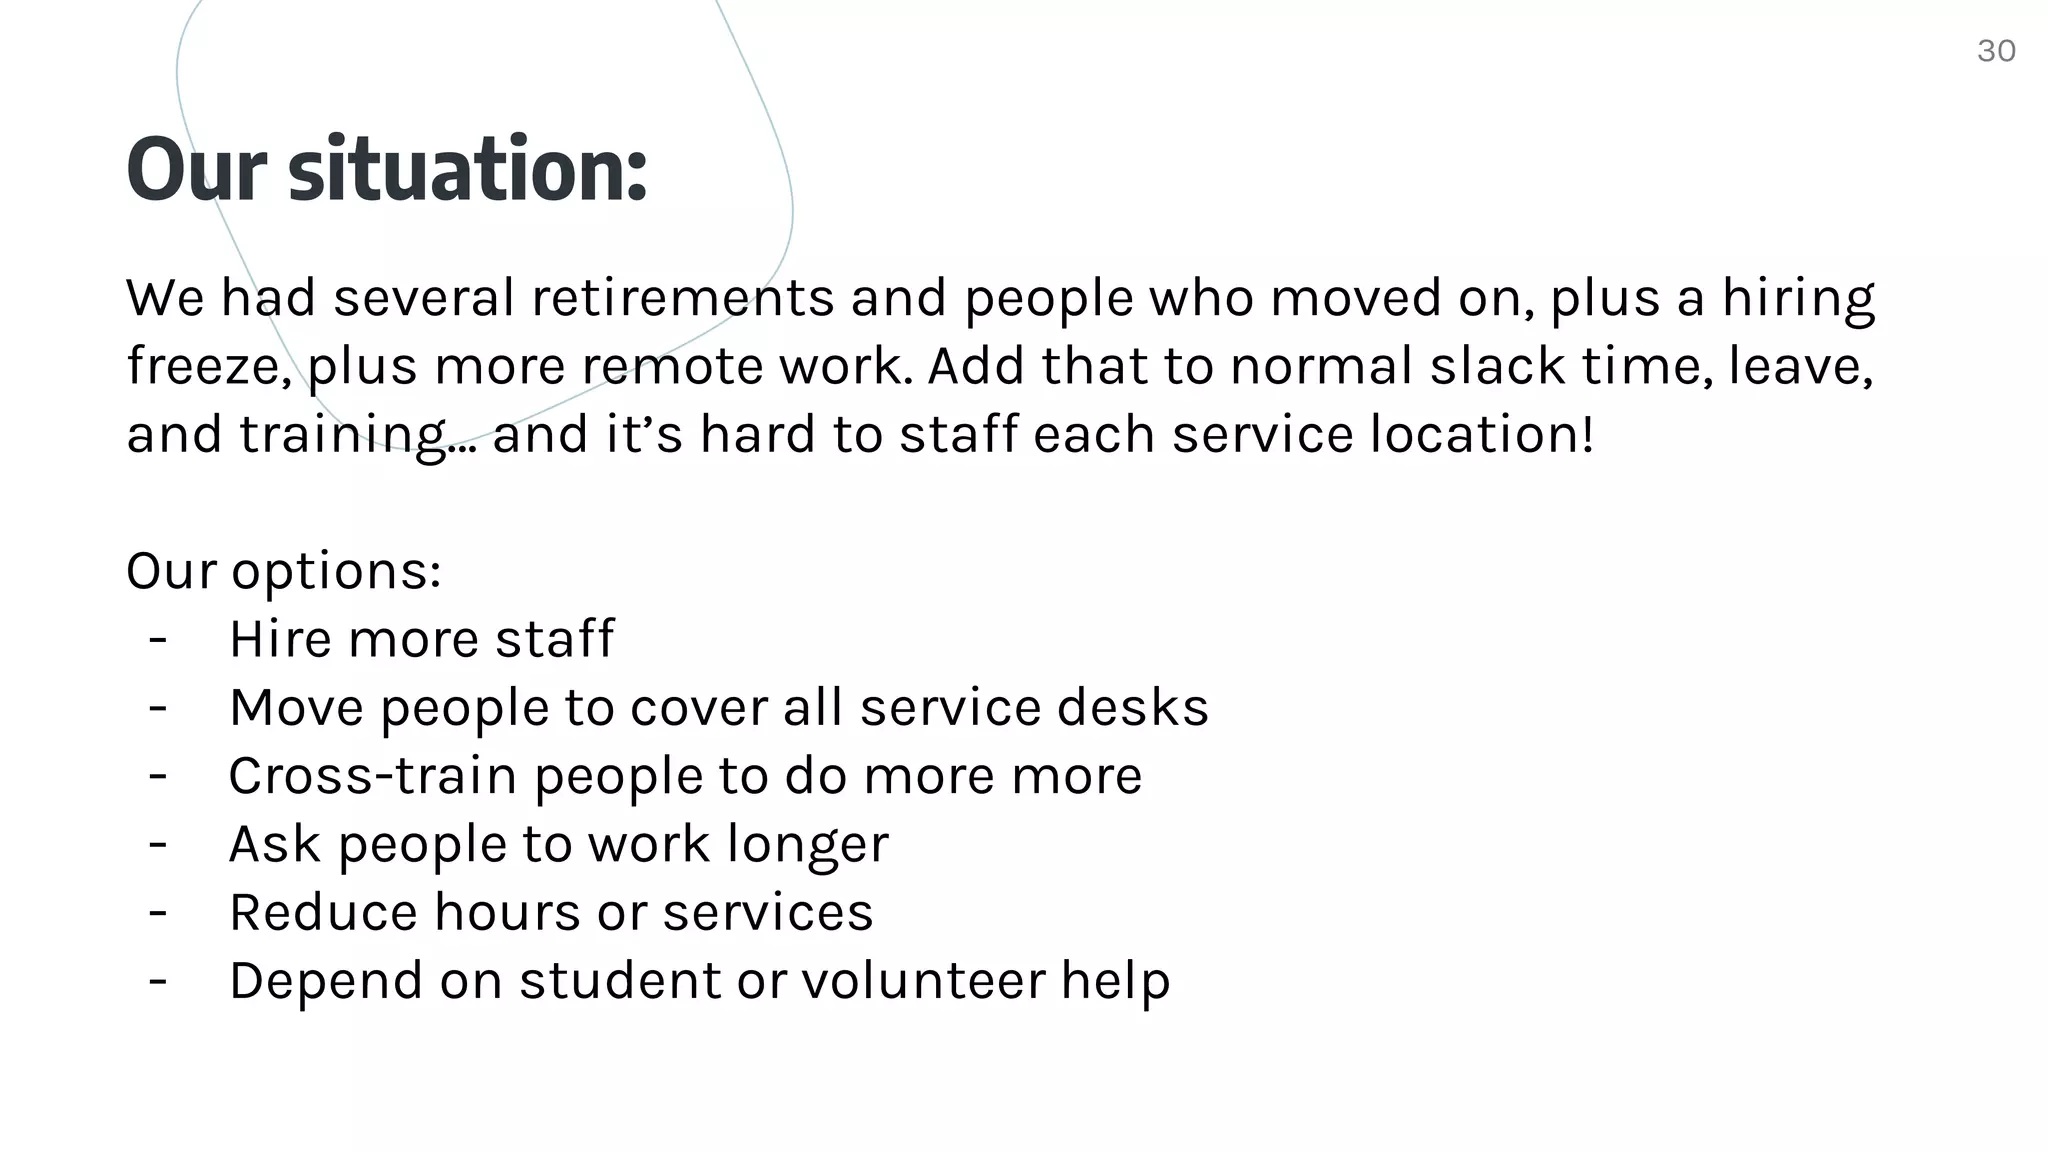
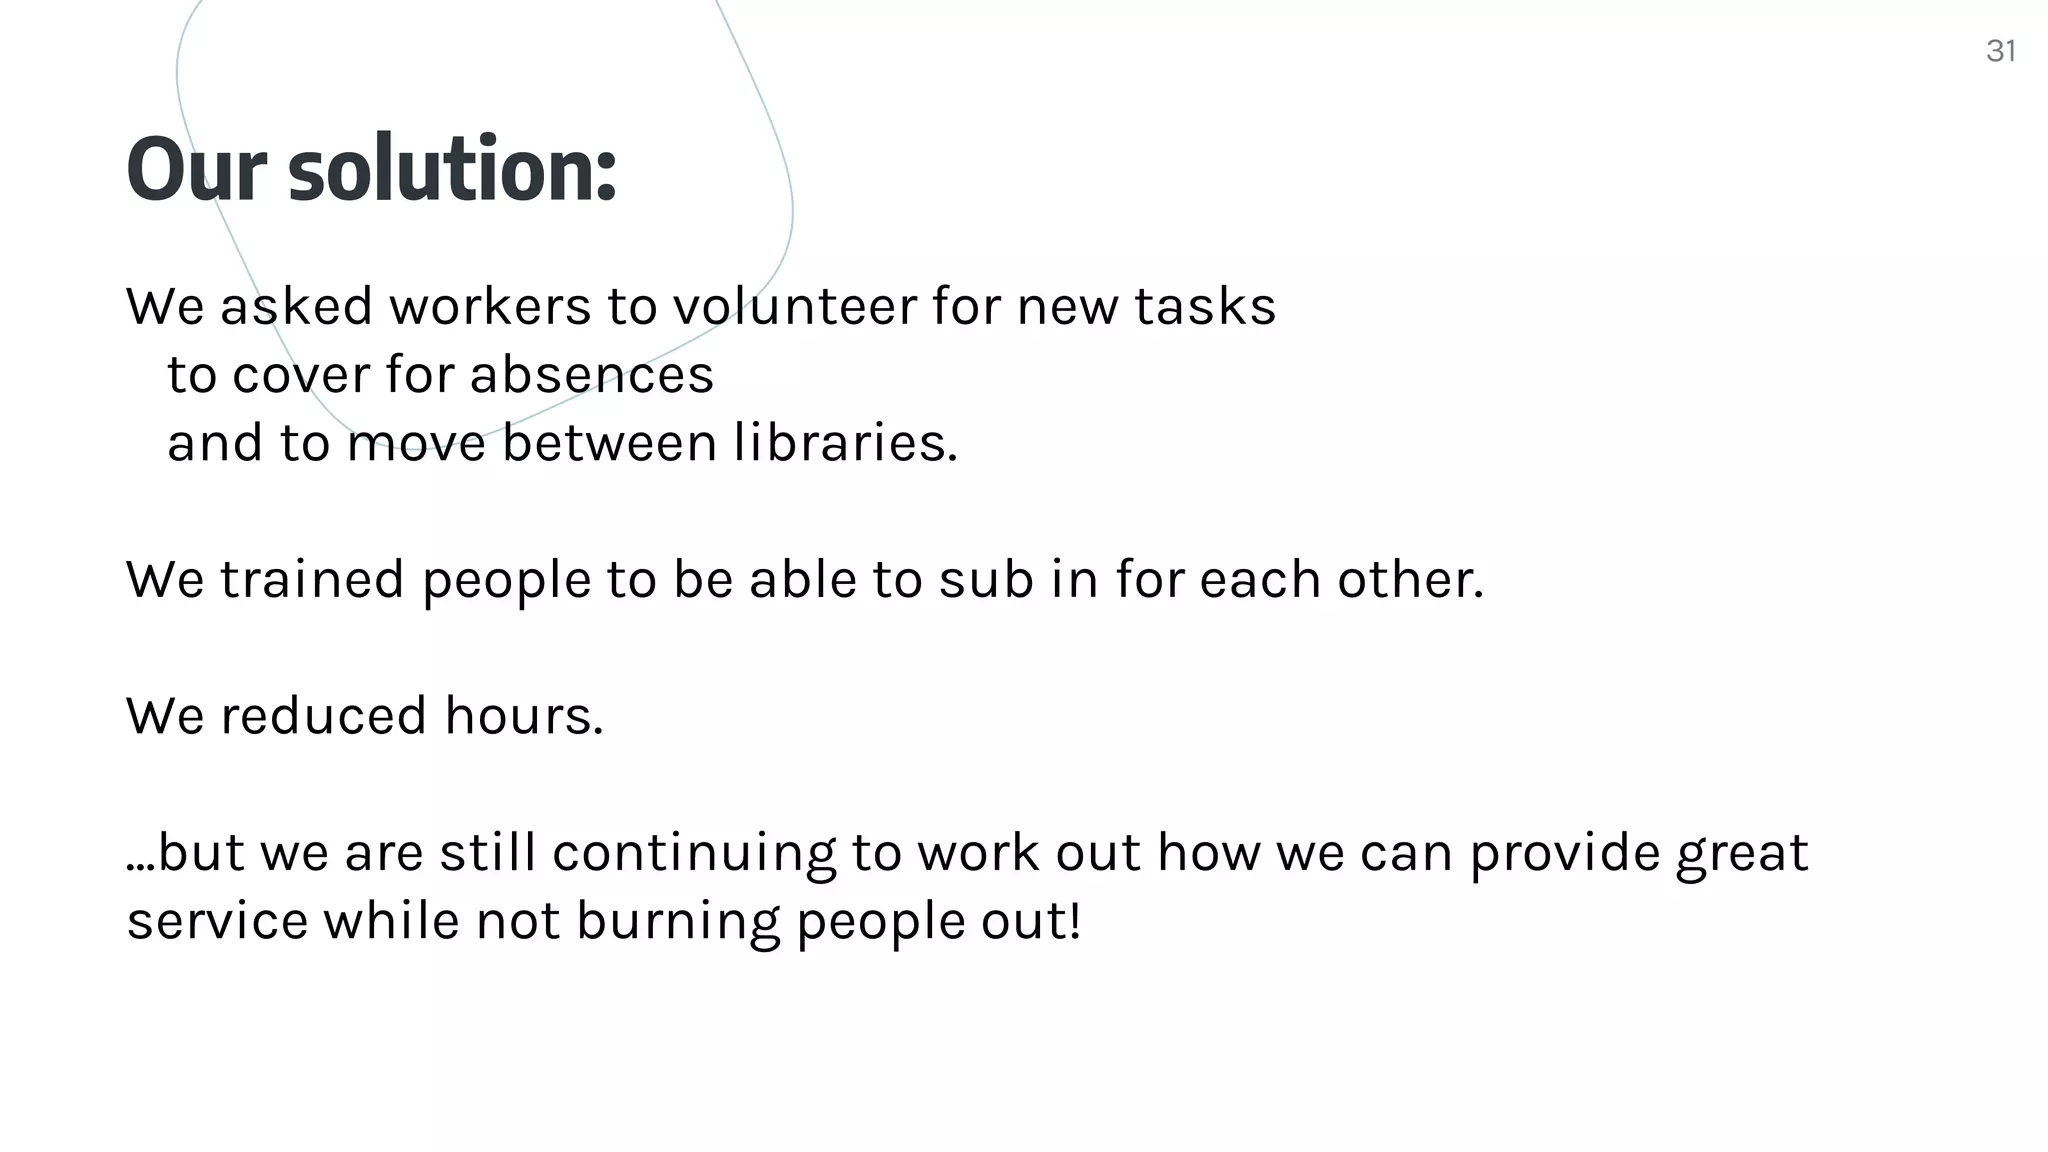


The document discusses the challenges faced by libraries during the pandemic, including understaffing and increased demands for services. It outlines a strategic approach to workforce analytics, focusing on assessing staffing needs, conducting demand and supply analysis, and creating action plans to address gaps. Strategies for optimizing staff productivity while managing workloads and reducing burnout are also emphasized.