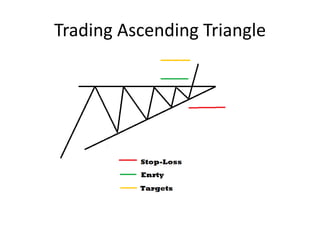
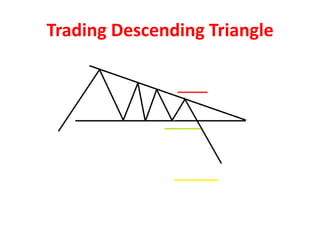
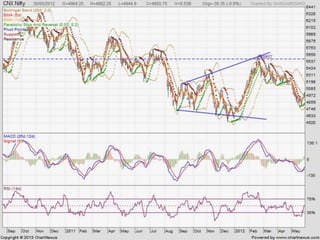
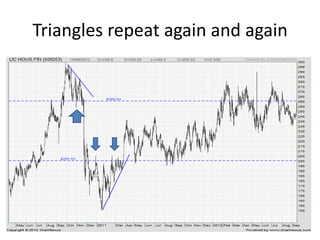
Triangles are patterns formed by converging trend lines meeting at a single point, showing indecision in the market. There are three main types: ascending, descending, and symmetrical triangles. Triangles can indicate continuation or reversal of the pre-existing trend. Volume is generally low inside the triangle and increases at the breakout. Traders watch for breakouts of the trend lines and aim to enter positions in the direction of the breakout. Stop losses are placed outside the pattern to limit risk. Patterns like triangles can provide insight into market behavior but may not always work as expected.
2. Index
• What are triangles & why they are formed?
• Types of Triangles
• How to trade triangles?
• Placing Stop-Loss
• Strategies for trading triangles
• set price targets for triangles
• EWT’s perspective of triangles
• Using indicators & triangles
• Do patterns really work?
• Sleeping Triangles (An research and findings)
3. What are Triangles?
Triangles are the patterns formed when upper
and lower price level collide (converging trend
lines) at a single point called Apex/cardle.
4. Facts about triangles
• Triangles can be best described as horizontal
trading patterns.
• As the market continues to trade in a sideways
pattern, the range of trading narrows, and the
point of the triangle is formed.
• The triangle shows losing interest in an
issue, both from the buy side as well as the sell
side: the supply line (support) diminishes to meet
the demand.
5. Contd.
• They have a tendency to repeat again and
again.
• Triangles indicates its direction before it give
you a breakout.
6. Nature of Triangle
• They consist of
Trend Line
Major Support/ Resistance
• Volumes will be low before breakout; Volumes
kick high after breakout.
• Triangle speak its direction (Bullish/Bearish)
• Price never touch the cardle/Apex.
7. When they are formed?
• After a impulse wave; Triangles are corrective
wave(As per wave)
• When market start to move sideways.
• Range bound Market; Triangles are
anticipation of breaking S/R
19. Expanding Triangles
• These Expanding triangles are the
inverse(mirror image) of Regular Triangles
• The volume in the expanding triangles
increase
• Hear trading within the triangle can be
profitable.
20.
21. Indicators and You
• MACD
• RSI
• ADX etc
• “It isn’t important which indicator is the best;
but you need to know your indicator”
• Tips: Keep an oscillator indicator and a moving
average indicator. And keep experimenting to
know more.
22. Stop-Loss
• 2% or 5% Stop Loss
• ATR
• Pivot points
And More
• Fib Levels
• Neckline
• Trend line
Before placing your stops. Keep an eye on “Risk” and “Volatility”
23. Premature Breakouts
• They are the violation of Support/Resistance
and Trend-line.
• They stand as a road map for traders.
24. What we can understand from a with
Premature breakouts?
– We can predict the breakout( Bullish/ Bearish)
• TIP: Stay away from the stock if the stock is showing
violation in both upper and lower levels. Look for
breakout for trading; They are the only reliable source
33. Why we think in Patterns?
• Your pattern is based on our decision
• Your decision is based on your thinking
• Your thinking is based on your recognition.