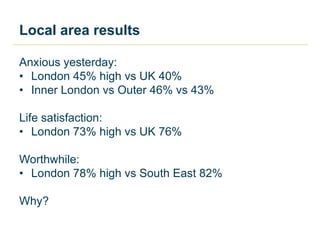
Download to read offline
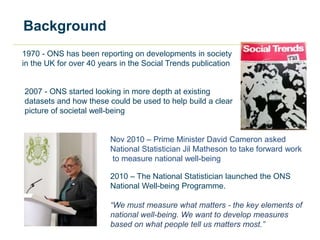
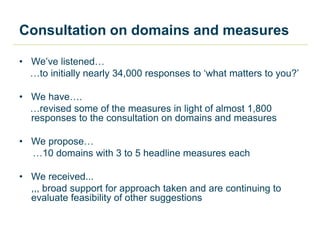
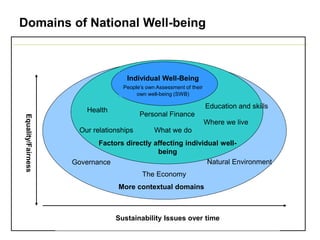
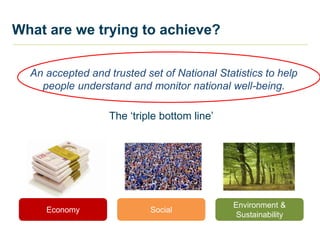
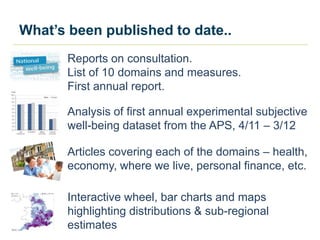
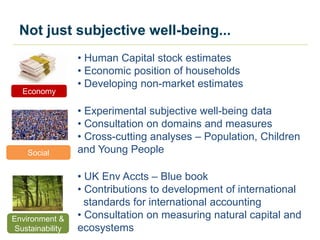
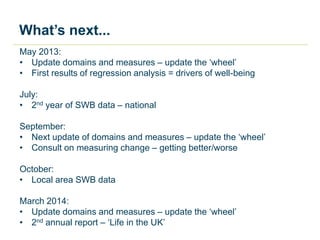
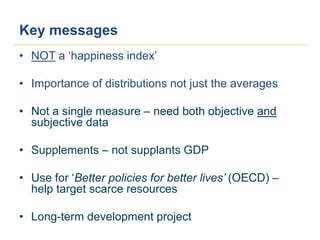

The UK Office for National Statistics has launched a National Well-being Programme to measure national well-being beyond traditional economic indicators like GDP. The programme aims to establish an accepted set of national statistics on well-being across ten domains, including health, relationships, education, and the environment. So far, the programme has conducted public consultations, published initial annual reports, and added questions to household surveys on life satisfaction, feelings of worthwhileness, happiness and anxiety. Future work includes further developing measures, analyzing drivers of well-being, and providing local area well-being data. The goal is to better understand and monitor societal progress over time.


