Download as PDF, PPTX

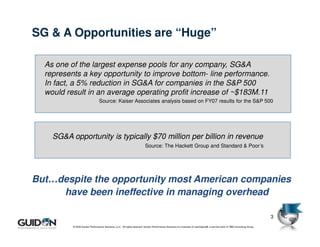
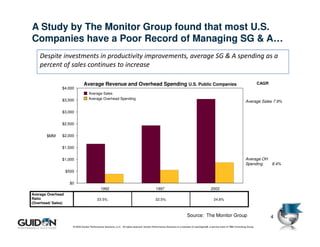
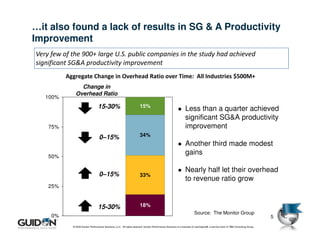
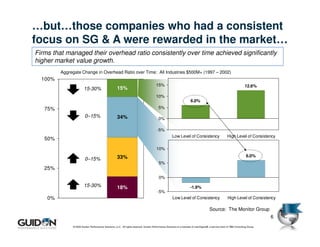
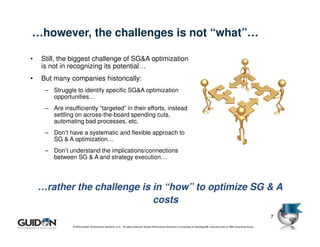
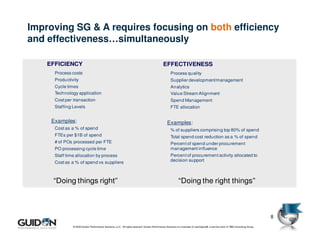
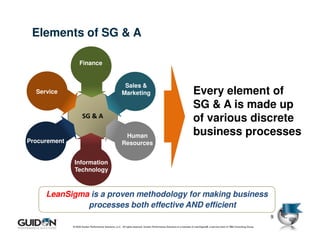
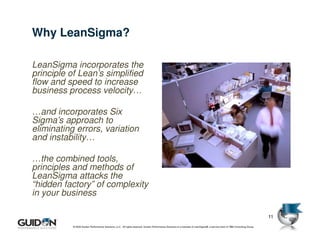
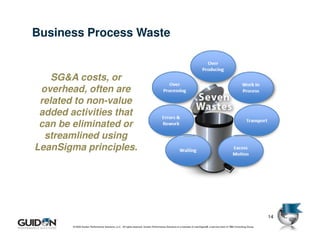
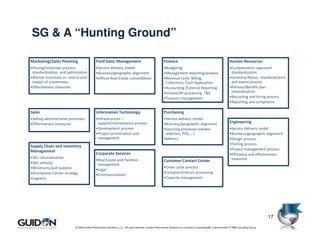
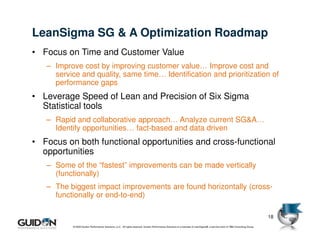
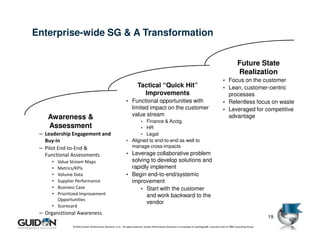
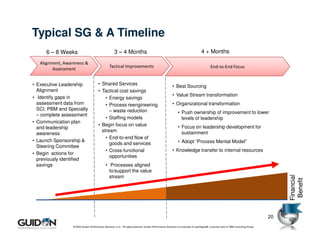
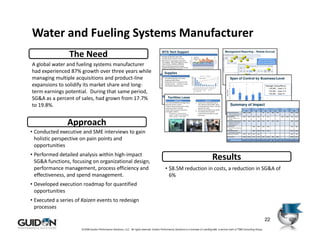

The document discusses the importance of optimizing Selling, General and Administrative (SG&A) expenses to improve a company's bottom line, highlighting that even small reductions can lead to significant profit increases. It emphasizes that many American companies have struggled with effective SG&A management despite recognizing its potential, often resorting to ineffective across-the-board cuts instead of targeted approaches. Utilizing LeanSigma methodologies, which combine lean principles and six sigma techniques, can enhance efficiency and effectiveness in SG&A processes, ultimately driving competitive advantages and improving operational outcomes.