US Energy Consumption by State as of 2005
•
0 likes•208 views

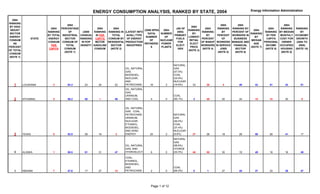
The document analyzes and ranks US states based on various energy consumption metrics from 2004. It provides data on each state's ranking for industrial energy consumption as a percentage of total, total energy consumption per capita, primary fuels used for electricity generation, and rankings for economic and demographic factors like median income and age. Louisiana had the highest percentage of energy consumption by the industrial sector, while Wyoming had the second highest consumption per capita. States relied primarily on coal, natural gas, and nuclear power for electricity generation.

Recommended
More Related Content
Viewers also liked
Viewers also liked (9)
Similar to US Energy Consumption by State as of 2005
Similar to US Energy Consumption by State as of 2005 (20)
More from Bruce LaCour
More from Bruce LaCour (20)
Recently uploaded
Recently uploaded (20)
US Energy Consumption by State as of 2005
- 1. ENERGY CONSUMPTION ANALYSIS, RANKED BY STATE, 2004 Energy Information Administration 2004 RANKING BY HIGH INDUST SECTOR ENERGY CONSUM AS PERCENT OF TOTAL CONSUM (NOTE 1) STATE 2004 RANKING BY TOTAL ENERGY CONSUM PER CAPITA 2004 PERCENTAGE OF INDUSTRIAL SECTOR CONSUM OF TOTAL CONSUM (NOTE 1) (2000 CENSUS) RANKING IN POP DENSITY 2004 RANKING IN PER CAPITA MOTOR GASOLINE CONSUM 2004 RANKING IN TOTAL CONSUM BY RESIDENTAL SECTOR (NOTE 2) (LATEST INFO AVAIL) TYPE OF ENERGY PRODUCTION INDUSTRIES (2006 NPRA DATA) NUMBER OF REFINERIE S 2004 NUMBER OF NUCLEAR POWER PLANTS (AS OF 2005) PRIMARY FUELS FOR ELECT GEN 2004 RANKING BY LOWEST RETAIL ELECT PRICE (NOTE 3) 2004 RANKING BY PERCENT OF MANUF WORKERS (NOTE 4) 2004 RANKING BY PERCENT OF WORKERS IN SERVICE JOBS (NOTE 5) 2004 RANKING BY PERCENT OF WORKERS IN BUSINESS MANAGE AND FINANCIAL SECTOR (NOTE 6) 2004 RANKING BY MEDIAN AGE (NOTE 7) 2004 RANKING BY PER CAPITA PERSONAL INCOME (NOTE 8) 2004 RANKING BY MEDIAN MONTHLY COST FOR OWNER OCCUPIED HOUSING (NOTE 9) RANKING BY ECONOMY GROWTH (2004 TO 2005) (NOTE 10) 1 LOUISIANA 3 63.3 23 24 22 OIL, NATURAL GAS, BIODIESEL, NUCLEAR, AND PETROCHEM 18 2 NATURAL GAS (47.0%) COAL (24.9%) NUCLEAR (16.9%) 33 38 4 49 42 51 43 51 2 WYOMING 2 56.2 50 1 49 OIL, NATURAL GAS, URANIUM, AND COAL 5 0 COAL (95.1%) 3 48 20 24 10 15 30 9 3 TEXAS 5 53.5 29 16 2 OIL, NATURAL GAS, COAL, PETROCHEM, URANIUM, NUCLEAR, ETHANOL, BIODIESEL, AND WIND ENERGY 25 2 NATURAL GAS (49.4%) COAL (37.4%) NUCLEAR (9.6%) 37 28 18 29 50 28 41 17 4 ALASKA 1 50.5 51 31 47 OIL, NATURAL GAS, AND HYDROELECT 6 0 NATURAL GAS (56.6%) HYDROE (22.3%) 46 50 35 19 49 18 16 49 5 INDIANA 7 47.6 17 27 13 COAL, ETHANOL, BIODIESEL, AND PETROCHEM 2 0 COAL (94.2%) 5 1 27 45 37 33 38 47 Page 1 of 12
- 2. ENERGY CONSUMPTION ANALYSIS, RANKED BY STATE, 2004 Energy Information Administration 2004 RANKING BY HIGH INDUST SECTOR ENERGY CONSUM AS PERCENT OF TOTAL CONSUM (NOTE 1) STATE 2004 RANKING BY TOTAL ENERGY CONSUM PER CAPITA 2004 PERCENTAGE OF INDUSTRIAL SECTOR CONSUM OF TOTAL CONSUM (NOTE 1) (2000 CENSUS) RANKING IN POP DENSITY 2004 RANKING IN PER CAPITA MOTOR GASOLINE CONSUM 2004 RANKING IN TOTAL CONSUM BY RESIDENTAL SECTOR (NOTE 2) (LATEST INFO AVAIL) TYPE OF ENERGY PRODUCTION INDUSTRIES (2006 NPRA DATA) NUMBER OF REFINERIE S 2004 NUMBER OF NUCLEAR POWER PLANTS (AS OF 2005) PRIMARY FUELS FOR ELECT GEN 2004 RANKING BY LOWEST RETAIL ELECT PRICE (NOTE 3) 2004 RANKING BY PERCENT OF MANUF WORKERS (NOTE 4) 2004 RANKING BY PERCENT OF WORKERS IN SERVICE JOBS (NOTE 5) 2004 RANKING BY PERCENT OF WORKERS IN BUSINESS MANAGE AND FINANCIAL SECTOR (NOTE 6) 2004 RANKING BY MEDIAN AGE (NOTE 7) 2004 RANKING BY PER CAPITA PERSONAL INCOME (NOTE 8) 2004 RANKING BY MEDIAN MONTHLY COST FOR OWNER OCCUPIED HOUSING (NOTE 9) RANKING BY ECONOMY GROWTH (2004 TO 2005) (NOTE 10) 6 NORTH DAKOTA 4 46.7 48 8 45 OIL, ETHANOL, SYNFUELS, WIND POWER, AND HYDROELECT 1 0 COAL (94.8%) 7 42 16 7 9 35 48 13 7 ALABAMA 6 46.3 27 17 21 BIODIESEL, HYDROELECT , COAL, OIL, NUCLEAR, AND PETROCHEM 4 3 COAL (56.6%) NUCLEAR (23.0%) NATURAL GAS (10.1%) 12 12 46 48 21 42 46 28 8 WEST VIRGINIA 9 44.1 30 41 34 COAL AND PETROCHEM 1 0 COAL (97.6%) 4 33 8 51 3 48 49 27 9 ARKANSAS 13 41.7 35 21 32 HYDROELECT , NATURAL GAS, BIODIESEL, NUCLEAR, AND PETROCHEM 2 1 COAL (48.2%) NUCLEAR (28.6%) NATURAL GAS (12.6%) 9 5 24 47 27 49 51 32 10 IOWA 15 41.2 34 7 30 ETHANOL, BIODIESEL, NUCLEAR, AND WIND ENERGY 0 1 COAL (77.6%) NUCLEAR (10.3%) 18 8 45 26 11 29 44 40 11 SOUTH CAROLINA 14 38.6 22 3 24 BIODIESEL, NUCLEAR, AND HYDROELECT 0 4 NUCLEAR (51.8%) COAL (38.7%) 15 9 32 44 26 44 35 25 Page 2 of 12
- 3. ENERGY CONSUMPTION ANALYSIS, RANKED BY STATE, 2004 Energy Information Administration 2004 RANKING BY HIGH INDUST SECTOR ENERGY CONSUM AS PERCENT OF TOTAL CONSUM (NOTE 1) STATE 2004 RANKING BY TOTAL ENERGY CONSUM PER CAPITA 2004 PERCENTAGE OF INDUSTRIAL SECTOR CONSUM OF TOTAL CONSUM (NOTE 1) (2000 CENSUS) RANKING IN POP DENSITY 2004 RANKING IN PER CAPITA MOTOR GASOLINE CONSUM 2004 RANKING IN TOTAL CONSUM BY RESIDENTAL SECTOR (NOTE 2) (LATEST INFO AVAIL) TYPE OF ENERGY PRODUCTION INDUSTRIES (2006 NPRA DATA) NUMBER OF REFINERIE S 2004 NUMBER OF NUCLEAR POWER PLANTS (AS OF 2005) PRIMARY FUELS FOR ELECT GEN 2004 RANKING BY LOWEST RETAIL ELECT PRICE (NOTE 3) 2004 RANKING BY PERCENT OF MANUF WORKERS (NOTE 4) 2004 RANKING BY PERCENT OF WORKERS IN SERVICE JOBS (NOTE 5) 2004 RANKING BY PERCENT OF WORKERS IN BUSINESS MANAGE AND FINANCIAL SECTOR (NOTE 6) 2004 RANKING BY MEDIAN AGE (NOTE 7) 2004 RANKING BY PER CAPITA PERSONAL INCOME (NOTE 8) 2004 RANKING BY MEDIAN MONTHLY COST FOR OWNER OCCUPIED HOUSING (NOTE 9) RANKING BY ECONOMY GROWTH (2004 TO 2005) (NOTE 10) 12 IDAHO 23 38.0 45 34 39 HYDROELECT 0 0 HYDROE (78.9%) NATURAL GAS (14.3%) 2 21 16 33 45 45 29 4 13 MONTANA 10 37.9 49 12 43 OIL, NATURAL GAS, COAL, WIND POWER, AND HYDROELECT 4 0 COAL (63.8%) HYDROE (34.3%) 19 47 5 28 4 40 31 8 14 KENTUCKY 8 37.5 24 20 25 COAL, BIODIESEL, ETHANOL, AND HYROELECT 2 0 COAL (91.1%) 1 7 34 46 19 43 42 33 15 OKLAHOMA 11 37.3 36 2 28 OIL, NATURAL GAS, PETROCHEM, BIODIESEL, HYDROELECT , AND WIND ENERGY 5 0 COAL (53.0%) NATURAL GAS (41.6%) 22 24 10 39 33 41 47 30 16 MISSISSIPPI 12 37.3 33 6 31 OIL, NATURAL GAS, BIODIESEL, NUCLEAR AND PETROCHEM 4 1 COAL (36.9%) NATURAL GAS (34.1%) NUCLEAR (22.4%) 30 9 12 50 41 50 50 46 Page 3 of 12
- 4. ENERGY CONSUMPTION ANALYSIS, RANKED BY STATE, 2004 Energy Information Administration 2004 RANKING BY HIGH INDUST SECTOR ENERGY CONSUM AS PERCENT OF TOTAL CONSUM (NOTE 1) STATE 2004 RANKING BY TOTAL ENERGY CONSUM PER CAPITA 2004 PERCENTAGE OF INDUSTRIAL SECTOR CONSUM OF TOTAL CONSUM (NOTE 1) (2000 CENSUS) RANKING IN POP DENSITY 2004 RANKING IN PER CAPITA MOTOR GASOLINE CONSUM 2004 RANKING IN TOTAL CONSUM BY RESIDENTAL SECTOR (NOTE 2) (LATEST INFO AVAIL) TYPE OF ENERGY PRODUCTION INDUSTRIES (2006 NPRA DATA) NUMBER OF REFINERIE S 2004 NUMBER OF NUCLEAR POWER PLANTS (AS OF 2005) PRIMARY FUELS FOR ELECT GEN 2004 RANKING BY LOWEST RETAIL ELECT PRICE (NOTE 3) 2004 RANKING BY PERCENT OF MANUF WORKERS (NOTE 4) 2004 RANKING BY PERCENT OF WORKERS IN SERVICE JOBS (NOTE 5) 2004 RANKING BY PERCENT OF WORKERS IN BUSINESS MANAGE AND FINANCIAL SECTOR (NOTE 6) 2004 RANKING BY MEDIAN AGE (NOTE 7) 2004 RANKING BY PER CAPITA PERSONAL INCOME (NOTE 8) 2004 RANKING BY MEDIAN MONTHLY COST FOR OWNER OCCUPIED HOUSING (NOTE 9) RANKING BY ECONOMY GROWTH (2004 TO 2005) (NOTE 10) 17 KANSAS 16 36.9 41 22 33 OIL, NATURAL GAS, NUCLEAR, COAL, ETHANOL, BIODIESEL, GEOTHERM, AND WIND ENERGY 3 1 COAL (75.2%) NUCLEAR (19.2%) 17 23 29 23 38 26 40 19 18 WISCONSIN 28 36.6 25 37 19 NUCLEAR BIODIESEL, AND ETHANOL 1 2 COAL (67.4%) NUCLEAR (16.0%) NATURAL GAS (10.3%) 25 3 44 32 17 21 26 39 19 DELAWARE 19 35.8 8 14 44 BIODIESEL AND PETROCHEM 1 0 COAL (59.4%) NATURAL GAS (19.6%) FUEL OIL (15.0%) 36 29 47 14 16 12 18 45 20 TENNESSEE 17 33.8 20 9 14 NUCLEAR, BIODIESEL, ETHANOL, AND HYDROELECT 1 2 COAL (61.0%) NUCLEAR (28.6%) HYDROE (9.6%) 13 4 39 41 23 36 37 42 Page 4 of 12
- 5. ENERGY CONSUMPTION ANALYSIS, RANKED BY STATE, 2004 Energy Information Administration 2004 RANKING BY HIGH INDUST SECTOR ENERGY CONSUM AS PERCENT OF TOTAL CONSUM (NOTE 1) STATE 2004 RANKING BY TOTAL ENERGY CONSUM PER CAPITA 2004 PERCENTAGE OF INDUSTRIAL SECTOR CONSUM OF TOTAL CONSUM (NOTE 1) (2000 CENSUS) RANKING IN POP DENSITY 2004 RANKING IN PER CAPITA MOTOR GASOLINE CONSUM 2004 RANKING IN TOTAL CONSUM BY RESIDENTAL SECTOR (NOTE 2) (LATEST INFO AVAIL) TYPE OF ENERGY PRODUCTION INDUSTRIES (2006 NPRA DATA) NUMBER OF REFINERIE S 2004 NUMBER OF NUCLEAR POWER PLANTS (AS OF 2005) PRIMARY FUELS FOR ELECT GEN 2004 RANKING BY LOWEST RETAIL ELECT PRICE (NOTE 3) 2004 RANKING BY PERCENT OF MANUF WORKERS (NOTE 4) 2004 RANKING BY PERCENT OF WORKERS IN SERVICE JOBS (NOTE 5) 2004 RANKING BY PERCENT OF WORKERS IN BUSINESS MANAGE AND FINANCIAL SECTOR (NOTE 6) 2004 RANKING BY MEDIAN AGE (NOTE 7) 2004 RANKING BY PER CAPITA PERSONAL INCOME (NOTE 8) 2004 RANKING BY MEDIAN MONTHLY COST FOR OWNER OCCUPIED HOUSING (NOTE 9) RANKING BY ECONOMY GROWTH (2004 TO 2005) (NOTE 10) 21 OHIO 25 33.8 10 36 7 COAL, BIODIESEL, ETHANOL, NUCLEAR AND PETROCHEM 4 2 COAL (87.2%) NUCLEAR (9.4%) 26 6 19 35 18 27 28 48 22 NEW MEXICO 21 33.4 46 23 40 OIL, NATURAL GAS, URANIUM, AND WIND ENERGY 3 0 COAL (85.2%) NATURAL GAS (11.9%) 31 46 3 40 35 47 36 12 23 PENNSLYLVANNIA 30 32.5 11 47 5 NUCLEAR, OIL, BIODIESEL, AND COAL 5 5 COAL (55.5%) NUCLEAR (35.0%) 38 14 32 34 5 19 34 36 24 MAINE 20 32.1 39 4 38 WOOD AND HYDROELECT 0 0 NATURAL GAS (44.6%) HYDROE (21.7%) RENEW (21.6%) 41 30 11 42 1 32 25 43 25 ILLINOIS 34 31.6 12 46 6 NUCLEAR, ETHANOL, BIODIESEL, COAL, AND PETROCHEM 4 6 NUCLEAR (48.0%) COAL (47.7%) 24 16 27 18 40 16 19 35 26 NEBRASKA 18 31.5 43 30 37 NUCLEAR, BIODIESEL, ETHANOL, HYDROELECT , AND WIND ENERGY 0 2 COAL (66.2%) NUCLEAR (28.0%) 6 36 25 10 34 23 39 41 Page 5 of 12
- 6. ENERGY CONSUMPTION ANALYSIS, RANKED BY STATE, 2004 Energy Information Administration 2004 RANKING BY HIGH INDUST SECTOR ENERGY CONSUM AS PERCENT OF TOTAL CONSUM (NOTE 1) STATE 2004 RANKING BY TOTAL ENERGY CONSUM PER CAPITA 2004 PERCENTAGE OF INDUSTRIAL SECTOR CONSUM OF TOTAL CONSUM (NOTE 1) (2000 CENSUS) RANKING IN POP DENSITY 2004 RANKING IN PER CAPITA MOTOR GASOLINE CONSUM 2004 RANKING IN TOTAL CONSUM BY RESIDENTAL SECTOR (NOTE 2) (LATEST INFO AVAIL) TYPE OF ENERGY PRODUCTION INDUSTRIES (2006 NPRA DATA) NUMBER OF REFINERIE S 2004 NUMBER OF NUCLEAR POWER PLANTS (AS OF 2005) PRIMARY FUELS FOR ELECT GEN 2004 RANKING BY LOWEST RETAIL ELECT PRICE (NOTE 3) 2004 RANKING BY PERCENT OF MANUF WORKERS (NOTE 4) 2004 RANKING BY PERCENT OF WORKERS IN SERVICE JOBS (NOTE 5) 2004 RANKING BY PERCENT OF WORKERS IN BUSINESS MANAGE AND FINANCIAL SECTOR (NOTE 6) 2004 RANKING BY MEDIAN AGE (NOTE 7) 2004 RANKING BY PER CAPITA PERSONAL INCOME (NOTE 8) 2004 RANKING BY MEDIAN MONTHLY COST FOR OWNER OCCUPIED HOUSING (NOTE 9) RANKING BY ECONOMY GROWTH (2004 TO 2005) (NOTE 10) 27 GEORGIA 24 30.6 19 15 9 BIODIESEL AND NUCLEAR 1 2 COAL (63.8%) NUCLEAR (23.1%) 23 18 48 17 48 34 27 11 28 MINNESOTA 22 30.6 32 18 20 BIODIESEL, ETHANOL, AND NUCLEAR 2 2 COAL (62.1%) NUCLEAR (24.2%) 17 13 42 11 31 10 15 44 29 UTAH 36 28.7 42 32 36 OIL, NATURAL GAS, URANIUM, COAL, AND GEOTHERM 5 0 COAL (94.2%) 8 32 49 36 51 46 20 6 30 MICHIGAN 35 28.3 16 29 8 NUCLEAR, ETHANOL, BIODIESEL, AND WOOD 1 3 COAL (57.8%) NUCLEAR (27.0%) NATURAL GAS (11.2%) 27 2 14 38 30 25 24 50 31 WASHINGTON 31 27.9 26 43 16 NUCLEAR, HYDROELECT , BIODIESEL, AND PETROCHEM 5 2 HYDROE (70.7%) COAL (10.3%) NATURAL GAS (8.4%) 10 31 26 16 32 17 12 21 32 OREGON 37 27.5 40 44 29 ETHANOL, BIODIESEL, AND HYDROELECT 1 0 HYDROE (62.7%) NATURAL GAS (26.7%) 14 17 23 31 28 30 14 5 Page 6 of 12
- 7. ENERGY CONSUMPTION ANALYSIS, RANKED BY STATE, 2004 Energy Information Administration 2004 RANKING BY HIGH INDUST SECTOR ENERGY CONSUM AS PERCENT OF TOTAL CONSUM (NOTE 1) STATE 2004 RANKING BY TOTAL ENERGY CONSUM PER CAPITA 2004 PERCENTAGE OF INDUSTRIAL SECTOR CONSUM OF TOTAL CONSUM (NOTE 1) (2000 CENSUS) RANKING IN POP DENSITY 2004 RANKING IN PER CAPITA MOTOR GASOLINE CONSUM 2004 RANKING IN TOTAL CONSUM BY RESIDENTAL SECTOR (NOTE 2) (LATEST INFO AVAIL) TYPE OF ENERGY PRODUCTION INDUSTRIES (2006 NPRA DATA) NUMBER OF REFINERIE S 2004 NUMBER OF NUCLEAR POWER PLANTS (AS OF 2005) PRIMARY FUELS FOR ELECT GEN 2004 RANKING BY LOWEST RETAIL ELECT PRICE (NOTE 3) 2004 RANKING BY PERCENT OF MANUF WORKERS (NOTE 4) 2004 RANKING BY PERCENT OF WORKERS IN SERVICE JOBS (NOTE 5) 2004 RANKING BY PERCENT OF WORKERS IN BUSINESS MANAGE AND FINANCIAL SECTOR (NOTE 6) 2004 RANKING BY MEDIAN AGE (NOTE 7) 2004 RANKING BY PER CAPITA PERSONAL INCOME (NOTE 8) 2004 RANKING BY MEDIAN MONTHLY COST FOR OWNER OCCUPIED HOUSING (NOTE 9) RANKING BY ECONOMY GROWTH (2004 TO 2005) (NOTE 10) 33 COLORADO 39 26.9 38 41 26 OIL, NATURAL GAS, ETHANOL, BIODIESEL, URANIUM, AND COAL 2 0 COAL (71.7%) NATURAL GAS (24.0%) 29 40 37 5 44 9 11 18 34 NEVADA 40 26.8 44 49 35 BIODIESEL, HYDROELECT , URANIUM AND GEOTHERM 1 0 NATURAL GAS (46.6%) COAL (45.7%) 40 45 1 42 43 13 13 2 35 NORTH CAROLINA 33 26.6 18 25 10 BIODIESEL, NUCLEAR, AND HYDROELECT 0 3 COAL (60.5%) NUCLEAR (30.8%) 28 11 31 37 35 38 32 20 36 CALIFORNIA 49 24.6 12 45 1 OIL, PETROCHEM, HYDROELECT , ETHANOL, BIODIESEL, NUCLEAR, AND GEOTHERM 21 2 NATURAL GAS (46.7%) HYROE (19.8%) NUCLEAR (18.1%) 49 27 21 13 47 11 1 16 37 MARYLAND 41 24.1 6 38 18 BIODIESEL AND NUCLEAR 0 1 COAL (55.7%) NUCLEAR (27.9%) 32 44 41 3 25 5 10 22 Page 7 of 12
- 8. ENERGY CONSUMPTION ANALYSIS, RANKED BY STATE, 2004 Energy Information Administration 2004 RANKING BY HIGH INDUST SECTOR ENERGY CONSUM AS PERCENT OF TOTAL CONSUM (NOTE 1) STATE 2004 RANKING BY TOTAL ENERGY CONSUM PER CAPITA 2004 PERCENTAGE OF INDUSTRIAL SECTOR CONSUM OF TOTAL CONSUM (NOTE 1) (2000 CENSUS) RANKING IN POP DENSITY 2004 RANKING IN PER CAPITA MOTOR GASOLINE CONSUM 2004 RANKING IN TOTAL CONSUM BY RESIDENTAL SECTOR (NOTE 2) (LATEST INFO AVAIL) TYPE OF ENERGY PRODUCTION INDUSTRIES (2006 NPRA DATA) NUMBER OF REFINERIE S 2004 NUMBER OF NUCLEAR POWER PLANTS (AS OF 2005) PRIMARY FUELS FOR ELECT GEN 2004 RANKING BY LOWEST RETAIL ELECT PRICE (NOTE 3) 2004 RANKING BY PERCENT OF MANUF WORKERS (NOTE 4) 2004 RANKING BY PERCENT OF WORKERS IN SERVICE JOBS (NOTE 5) 2004 RANKING BY PERCENT OF WORKERS IN BUSINESS MANAGE AND FINANCIAL SECTOR (NOTE 6) 2004 RANKING BY MEDIAN AGE (NOTE 7) 2004 RANKING BY PER CAPITA PERSONAL INCOME (NOTE 8) 2004 RANKING BY MEDIAN MONTHLY COST FOR OWNER OCCUPIED HOUSING (NOTE 9) RANKING BY ECONOMY GROWTH (2004 TO 2005) (NOTE 10) 38 SOUTH DAKOTA 27 24.0 47 5 46 BIODIESEL, ETHANOL, WIND ENERGY, AND HYDROELECT 0 0 HYDROE (47.2%) COAL (46.0%) 20 37 17 9 29 37 45 24 39 VIRGINIA 26 23.1 15 19 12 BIODIESEL, NUCLEAR, COAL, AND HYDROELECT 0 2 COAL (44.9%) NUCLEAR (35.4%) NATURAL GAS (10.5%) 21 35 50 4 24 8 17 7 40 HAWAII 45 21.4 14 50 51 BIODIESEL AND ETHANOL 2 0 FUEL OIL (78.8%) COAL (14.2%) 51 49 2 25 12 20 2 10 41 MISSOURI 32 21.1 28 10 15 NUCLEAR, HYDROELECT , BIODIESEL, AND ETHANOL 0 1 COAL (85.3%) NUCLEAR (8.8%) 11 21 22 30 22 31 33 34 42 VERMONT 42 18.6 31 11 48 NUCLEAR AND HYDROELECT 0 1 NUCLEAR (71.2%) HYDROE (21.2%) 47 25 30 15 2 24 21 29 43 NEW JERSEY 38 18.4 2 28 11 BIODIESEL, NUCLEAR, AND PETROCHEM 6 3 NUCLEAR (51.8%) NATURAL GAS (25.1%) COAL (19.2%) 43 34 43 6 15 4 5 37 Page 8 of 12
- 9. ENERGY CONSUMPTION ANALYSIS, RANKED BY STATE, 2004 Energy Information Administration 2004 RANKING BY HIGH INDUST SECTOR ENERGY CONSUM AS PERCENT OF TOTAL CONSUM (NOTE 1) STATE 2004 RANKING BY TOTAL ENERGY CONSUM PER CAPITA 2004 PERCENTAGE OF INDUSTRIAL SECTOR CONSUM OF TOTAL CONSUM (NOTE 1) (2000 CENSUS) RANKING IN POP DENSITY 2004 RANKING IN PER CAPITA MOTOR GASOLINE CONSUM 2004 RANKING IN TOTAL CONSUM BY RESIDENTAL SECTOR (NOTE 2) (LATEST INFO AVAIL) TYPE OF ENERGY PRODUCTION INDUSTRIES (2006 NPRA DATA) NUMBER OF REFINERIE S 2004 NUMBER OF NUCLEAR POWER PLANTS (AS OF 2005) PRIMARY FUELS FOR ELECT GEN 2004 RANKING BY LOWEST RETAIL ELECT PRICE (NOTE 3) 2004 RANKING BY PERCENT OF MANUF WORKERS (NOTE 4) 2004 RANKING BY PERCENT OF WORKERS IN SERVICE JOBS (NOTE 5) 2004 RANKING BY PERCENT OF WORKERS IN BUSINESS MANAGE AND FINANCIAL SECTOR (NOTE 6) 2004 RANKING BY MEDIAN AGE (NOTE 7) 2004 RANKING BY PER CAPITA PERSONAL INCOME (NOTE 8) 2004 RANKING BY MEDIAN MONTHLY COST FOR OWNER OCCUPIED HOUSING (NOTE 9) RANKING BY ECONOMY GROWTH (2004 TO 2005) (NOTE 10) 44 RHODE ISLAND 51 17.8 3 35 42 BIODIESEL 0 0 NATURAL GAS (99.0%) 45 20 13 22 13 14 6 38 45 NEW HAMPSHIRE 44 16.5 21 13 41 NUCLEAR AND HYDROELECT 0 1 NUCLEAR (38.6%) NATURAL GAS (27.7%) COAL (16.6%) 48 15 51 12 7 7 9 15 46 ARIZONA 47 16.1 37 48 23 HYDROELECT , COAL, URANIUM, AND NUCLEAR 0 1 COAL (39.6%) NATURAL GAS (28.5%) NUCLEAR (25.4%) 34 39 9 20 46 39 23 1 47 CONNECTICUT 43 13.3 5 40 27 BIODIESEL AND NUCLEAR 0 1 NUCLEAR (46.4%) NATURAL GAS (26.4%) COAL (11.9%) FUEL OIL (9.4%) 42 18 38 2 7 2 7 23 Page 9 of 12
- 10. ENERGY CONSUMPTION ANALYSIS, RANKED BY STATE, 2004 Energy Information Administration 2004 RANKING BY HIGH INDUST SECTOR ENERGY CONSUM AS PERCENT OF TOTAL CONSUM (NOTE 1) STATE 2004 RANKING BY TOTAL ENERGY CONSUM PER CAPITA 2004 PERCENTAGE OF INDUSTRIAL SECTOR CONSUM OF TOTAL CONSUM (NOTE 1) (2000 CENSUS) RANKING IN POP DENSITY 2004 RANKING IN PER CAPITA MOTOR GASOLINE CONSUM 2004 RANKING IN TOTAL CONSUM BY RESIDENTAL SECTOR (NOTE 2) (LATEST INFO AVAIL) TYPE OF ENERGY PRODUCTION INDUSTRIES (2006 NPRA DATA) NUMBER OF REFINERIE S 2004 NUMBER OF NUCLEAR POWER PLANTS (AS OF 2005) PRIMARY FUELS FOR ELECT GEN 2004 RANKING BY LOWEST RETAIL ELECT PRICE (NOTE 3) 2004 RANKING BY PERCENT OF MANUF WORKERS (NOTE 4) 2004 RANKING BY PERCENT OF WORKERS IN SERVICE JOBS (NOTE 5) 2004 RANKING BY PERCENT OF WORKERS IN BUSINESS MANAGE AND FINANCIAL SECTOR (NOTE 6) 2004 RANKING BY MEDIAN AGE (NOTE 7) 2004 RANKING BY PER CAPITA PERSONAL INCOME (NOTE 8) 2004 RANKING BY MEDIAN MONTHLY COST FOR OWNER OCCUPIED HOUSING (NOTE 9) RANKING BY ECONOMY GROWTH (2004 TO 2005) (NOTE 10) 48 MASSACHUSETTS 48 13.3 4 33 17 NUCLEAR 0 1 NATURAL GAS (42.7%) COAL (25.3%) FUEL OIL (15.0%) NUCLEAR (11.5%) 44 26 36 8 14 3 4 31 49 NEW YORK 50 12.6 7 50 4 BIODIESEL, HYDROELECT , AND NUCLEAR 0 4 NUCLEAR (28.9%) NATURAL GAS (21.7%) HYDROE (17.6%) FUEL OIL (16.4%) 50 41 7 21 20 6 8 26 50 FLORIDA 46 12.4 9 26 3 BIODIESEL AND NUCLEAR 0 2 NATURAL GAS (38.0%) COAL (28.4%) FUEL OIL (16.9%) NUCLEAR (13.1%) 39 43 6 27 6 22 22 3 51 WASHINGTON DC 29 0.2 1 51 50 "HOT AIR" 0 0 FUEL OIL (100%) 35 51 40 1 39 1 3 14 UNITED STATES AVERAGE 33.0% 31.7 148 66 12.1% 16.3% 13.6% 36.4 $33,847 $151,366 3.4% US VIRGIN ISLANDS 1 (Owned jointly by Hess Co. and PDV (Venezuela's National Oil Co.) Page 10 of 12
- 11. ENERGY CONSUMPTION ANALYSIS, RANKED BY STATE, 2004 Energy Information Administration 2004 RANKING BY HIGH INDUST SECTOR ENERGY CONSUM AS PERCENT OF TOTAL CONSUM (NOTE 1) STATE 2004 RANKING BY TOTAL ENERGY CONSUM PER CAPITA 2004 PERCENTAGE OF INDUSTRIAL SECTOR CONSUM OF TOTAL CONSUM (NOTE 1) (2000 CENSUS) RANKING IN POP DENSITY 2004 RANKING IN PER CAPITA MOTOR GASOLINE CONSUM 2004 RANKING IN TOTAL CONSUM BY RESIDENTAL SECTOR (NOTE 2) (LATEST INFO AVAIL) TYPE OF ENERGY PRODUCTION INDUSTRIES (2006 NPRA DATA) NUMBER OF REFINERIE S 2004 NUMBER OF NUCLEAR POWER PLANTS (AS OF 2005) PRIMARY FUELS FOR ELECT GEN 2004 RANKING BY LOWEST RETAIL ELECT PRICE (NOTE 3) 2004 RANKING BY PERCENT OF MANUF WORKERS (NOTE 4) 2004 RANKING BY PERCENT OF WORKERS IN SERVICE JOBS (NOTE 5) 2004 RANKING BY PERCENT OF WORKERS IN BUSINESS MANAGE AND FINANCIAL SECTOR (NOTE 6) 2004 RANKING BY MEDIAN AGE (NOTE 7) 2004 RANKING BY PER CAPITA PERSONAL INCOME (NOTE 8) 2004 RANKING BY MEDIAN MONTHLY COST FOR OWNER OCCUPIED HOUSING (NOTE 9) RANKING BY ECONOMY GROWTH (2004 TO 2005) (NOTE 10) PUERTO RICO 1 ENERGY CONSUM RANKING STATE TOTAL ENERGY (TRILLIO N BTU 2005) PER CAPITA CONSUMP RANKING 1 TEXAS 11971.4 PEOPLE + INDUSTRY 5 VERY HIGH LEVEL OF ENERGY INTENSIVE MANUFACTURING BUT ALSO A LOT OF PEOPLE 2 CALIFORNIA 8364.6 PEOPLE + INDUSTRY 49 SO CALLED ENERGY EFFICIENT STATE IS A LARGE ENERGY CONSUMER STATE DUE TO LARGE POPULATION! 3 FLORIDA 4452.5 PEOPLE 46 SO CALLED ENERGY EFFICIENT STATE IS A LARGE ENERGY CONSUMER STATE DUE TO LARGE POPULATION! 4 NEW YORK 4254.0 PEOPLE 50 SO CALLED ENERGY EFFICIENT STATE IS A LARGE ENERGY CONSUMER STATE DUE TO LARGE POPULATION! 5 PENNSYLVANIA 4049.4 PEOPLE + INDUSTRY 30 SO CALLED ENERGY EFFICIENT STATE IS A LARGE ENERGY CONSUMER STATE DUE TO LARGE POPULATION! 6 OHIO 4022.8 PEOPLE + INDUSTRY 25 7 ILLINOIS 3960.5 PEOPLE + INDUSTRY 34 SO CALLED ENERGY EFFICIENT STATE IS A LARGE ENERGY CONSUMER STATE DUE TO LARGE POPULATION! 8 LOUISIANA 3816.3 PETROCHEMICAL INDUSTRY 3 VERY HIGH LEVEL OF ENERGY INTENSIVE MANUFACTURING 9 GEORGIA 3141.1 PEOPLE + INDUSTRY 24 10 MICHIGAN 3119.4 PEOPLE + INDUSTRY 35 SO CALLED ENERGY EFFICIENT STATE IS A LARGE ENERGY CONSUMER STATE DUE TO LARGE POPULATION! NOTE 1: Highest rankings have the greatest energy consumption by the industrial sector as a percentage of total energy consumption making them the most industrialized areas in the United States. TEN LARGEST CONSUMERS OF ENERGY IN THE UNITED STATES - PEOPLE ARE THE PROBLEM, NOT INDUSTRY! MAIN REASON FOR ENERGY CONSUMPTION NOTE 2: Highest rankings have greatest energy consumption by the residental sector as a percentage of total energy consumption making them the least industrialized areas of the United States. The least industrialized areas are occupied by the least productive in the energy and manufacturing areas and are red. Industrial sector: An energy-consuming sector that consists of all facilities and equipment used for producing, processing, or assembling goods. The industrial sector encompasses the following types of activity: manufacturing (NAICS codes 31-33); agriculture, forestry, fishing and hunting (NAICS code 11); mining, including oil and gas extraction (NAICS code 21); and construction (NAICS code 23). Overall energy use in this sector is largely for process heat and cooling and powering machinery, with lesser amounts used for facility heating, air conditioning, and lighting. Fossil fuels are also used as raw material inputs to manufactured products. Note: This sector includes generators that produce electricity and/or useful thermal output primarily to support the above-mentioned industrial activities. Page 11 of 12
- 12. ENERGY CONSUMPTION ANALYSIS, RANKED BY STATE, 2004 Energy Information Administration 2004 RANKING BY HIGH INDUST SECTOR ENERGY CONSUM AS PERCENT OF TOTAL CONSUM (NOTE 1) STATE 2004 RANKING BY TOTAL ENERGY CONSUM PER CAPITA 2004 PERCENTAGE OF INDUSTRIAL SECTOR CONSUM OF TOTAL CONSUM (NOTE 1) (2000 CENSUS) RANKING IN POP DENSITY 2004 RANKING IN PER CAPITA MOTOR GASOLINE CONSUM 2004 RANKING IN TOTAL CONSUM BY RESIDENTAL SECTOR (NOTE 2) (LATEST INFO AVAIL) TYPE OF ENERGY PRODUCTION INDUSTRIES (2006 NPRA DATA) NUMBER OF REFINERIE S 2004 NUMBER OF NUCLEAR POWER PLANTS (AS OF 2005) PRIMARY FUELS FOR ELECT GEN 2004 RANKING BY LOWEST RETAIL ELECT PRICE (NOTE 3) 2004 RANKING BY PERCENT OF MANUF WORKERS (NOTE 4) 2004 RANKING BY PERCENT OF WORKERS IN SERVICE JOBS (NOTE 5) 2004 RANKING BY PERCENT OF WORKERS IN BUSINESS MANAGE AND FINANCIAL SECTOR (NOTE 6) 2004 RANKING BY MEDIAN AGE (NOTE 7) 2004 RANKING BY PER CAPITA PERSONAL INCOME (NOTE 8) 2004 RANKING BY MEDIAN MONTHLY COST FOR OWNER OCCUPIED HOUSING (NOTE 9) RANKING BY ECONOMY GROWTH (2004 TO 2005) (NOTE 10) NOTE 5: 2004 American Community Survey: Highest rankings have highest percentage of service workers. Service workers generally do not produce any products; therefore, highest rankings are red. BLUE = ABOVE AVERAGE ENERGY USE EFFICIENCY STATISTIC (TOP 15) RED = BELOW AVERAGE ENERGY USE EFFICIENCY STATISTIC (LOWEST 15) ORANGE = MATT SIMMONS NEW ENGLAND STATES WITH LITTLE OR NO FOSSIL FUEL ENERGY RESOURCES + HAWAII VIOLET = MATT SIMMONS ENERGY PARASITE STATES + DISTRICT OF COLUMBIA (Revised based on % industrial sector consumption data) DARK BLUE = ENERGY EFFICIENT STATE WITH LITTLE OR NO FOSSIL FUEL RESOURCES BUT NOT CONSUMING ALOT OF GASOLINE OR NATURAL GAS ON A PER CAPITA BASIS NOTE 10: 2004 Census Bureau data. Highest rankings have the highest economic growth rates. These areas are the areas generally people are moving to and are the areas where energy consumption is increasing, usually residential energy consumption. The highest rankings are red. NOTE 4: 2004 American Community Survey : Highest rankings have the highest percentage of manufacturing workers. Manufacturing workers produce chemicals, energy resources, food, and products in general: therefore, highest rankings are blue. NOTE 6: 2004 American Community Survey: Highest rankings have highest percentage of business, management, and financial sector workers. These workers generally produce few products; therefore, highest rankings are red. NOTE 9: 2004 Census Bureau data. Highest rankings have the highest median monthly cost for owner-occupied housing. Those areas are ususally the areas with highest population density, highest electricity cost, highest per capita income, the highest median age populations, and usually the least amount industrial activity; therefore, the highest rankings are red. NOTE 3: Highest rankings have the lowest retail electricity prices. Highest ranks usually mean that the cost of producing the electricity is lower than the average; therefore, highest rankings are blue. NOTE 7: 2004 Census Bureau data. Highest rankings have the highest median age. Older workers are less productive than younger workers; therefore, highest rankings are red. NOTE 8: 2004 Census Bureau data. Highest rankings have the highest per capital personal income. Those areas with the highest personal per capita income are usually the areas that personally consume the largest amounts of energy; therfore, the highest rankings are red. Page 12 of 12