The monthly tabulation and prediction from the U.S. Energy Information Administration on production and activity in the largest 7 U.S. shale plays. This month's report features a first since the report was begun: natural gas production in the mighty Marcellus Shale declined from the previous month. Only the Utica Shale saw an increase in natural gas production from the previous month.
The monthly report from the U.S. Energy Information Administration that tracks oil and natural gas production by the top 7 U.S. shale plays. This month's report shows total gas and oil production from shale plays continues to decline, except for that in the Marcellus and Utica Shale.
Monthly report issued by the U.S. Energy Information Administration that tabulates production for both oil and gas by major shale region in the U.S. The April report shows, for the first time, U.S. shale plays producing less oil and natural gas in May than they did in April.
The document is a report from the U.S. Energy Information Administration analyzing oil and natural gas production from seven regions in the U.S. It provides data on production levels, changes in production from new and existing wells, and rig counts for each region from 2007-2015. The regions - Bakken, Eagle Ford, Haynesville, Marcellus, Niobrara, Permian, and Utica - accounted for 95% of domestic oil production growth and all domestic natural gas production growth from 2011-2013.
The monthly tabulation and prediction from the U.S. Energy Information Administration on production and activity in the largest 7 U.S. shale plays. All 7 shale plays will experience a decrease in natural gas production from the previous month due to low commodity prices.
The U.S. Energy Information Administration's monthly Drilling Productivity Report for January 2015. The report shows expected production for shale oil and gas for the country's 7 largest shale plays. As in previous months, the Marcellus and Utica regions continue to expand their production rapidly.
A monthly report from the U.S. Energy Information Administration that uses recent data on the total number of drilling rigs in operation along with estimates of drilling productivity and estimated changes in production from existing oil and natural gas wells to provide estimated changes in oil and natural gas production for six key fields.
The document is a report from the U.S. Energy Information Administration analyzing drilling productivity in seven major oil and gas regions in the United States. It contains production data from January 2014 to January 2015 on metrics like oil and gas output, new-well production, and legacy production for regions like the Bakken, Eagle Ford, Haynesville, Marcellus, Niobrara, Permian and Utica shale plays. Tables and charts show changes in output levels month-to-month and year-over-year for each region.
The monthly tabulation and prediction from the U.S. Energy Information Administration on production and activity in the largest 7 U.S. shale plays. All 7 shale plays will experience a decrease in natural gas production from the previous month due to low commodity prices.
The Drilling Productivity Report (DPR) for February 2015, published by the U.S. Energy Information Administration. The monthly DPR shows how productive the top seven US shale plays are for both oil and natural gas.
The monthly report from the U.S. Energy Information Administration showing production of oil and gas broken out by the 7 major commercially active shale plays in the U.S.
The monthly Drilling Productivity Report for April 2014 from the U.S. Energy Information Administration (EIA). The April report shows the Marcellus Shale average daily production continues to climb--and in May will come very close to 15 billion cubic feet per day of production (14.77 Bcf/d).
The monthly tabulation and prediction from the U.S. Energy Information Administration on production and activity in the largest 7 U.S. shale plays. All 7 shale plays will experience a decrease in natural gas production from the previous month due to low commodity prices.
The monthly Drilling Productivity Report issued by the U.S. Energy Information Administration--for July 2014. This report shows once again the Marcellus continues to increase production--up 28% from a year earlier. The Marcellus now accounts for 16% of all US natgas production.
The monthly tabulation and prediction from the U.S. Energy Information Administration on production and activity in the largest 7 U.S. shale plays. All 7 shale plays will experience a decrease in natural gas production from the previous month due to low commodity prices.
The monthly Drilling Productivity Report from the U.S. Energy Information Administration for August 2014. This edition of the DPR includes, for the first time, the Utica Shale.
The monthly tabulation and prediction from the U.S. Energy Information Administration on production and activity in the largest 7 U.S. shale plays. All 7 shale plays will experience a decrease in natural gas production from the previous month due to low commodity prices.
The document is a report from the U.S. Energy Information Administration analyzing oil and natural gas production from seven U.S. regions. It finds that these seven regions accounted for 92% of domestic oil production growth and all domestic natural gas production growth from 2011-2014. For each region, it provides data on historical and current production levels of oil and natural gas, as well as indicators of expected monthly changes for February 2016.
The monthly Drilling Productivity Report from the U.S. Energy Information Administration issued Sept 8, 2014. The latest report shows that the Marcellus Shale is due to produce more than 18 billion cubic feet of natural gas per day in October--an astonishing number--making the Marcellus the most productive shale field in the world. The Utica Shale continues to rapidly expand its natgas production as well.
The monthly tabulation and prediction from the U.S. Energy Information Administration on production and activity in the largest 7 U.S. shale plays. All 7 shale plays will experience a decrease in natural gas production from the previous month due to low commodity prices.
The document is a report from the U.S. Energy Information Administration analyzing oil and natural gas production from seven regions in the United States. It provides data on production levels, changes in production from existing and new wells, and rig counts for each region from November 2014 to November 2015. The regions accounted for 92% of domestic oil production growth and all domestic natural gas production growth from 2011 to 2014.
The document is a report from the U.S. Energy Information Administration analyzing oil and natural gas production from six regions in the U.S. It provides data on production levels, new well productivity, and legacy production for the Bakken, Eagle Ford, Haynesville, Marcellus, Niobrara and Permian regions. The report indicates that production increased in most regions from March to April 2014, with the largest increases seen in the Eagle Ford region for natural gas.
A list of the fees paid by individual drillers as an "impact fee" (equivalent of a severance tax) during 2014 by drillers in Pennsylvania. In 2014 drillers paid $223.5 million in impact fees.
New "research" by anti-drilling researchers at Johns Hopkins University that purports to show a connection between fracked shale wells in PA and an increase in radon in PA homes. Johns Hopkins Bloomberg School of Public Health researchers rather simplistically say that levels of radon in PA homes have been going up since 2004--when the first Marcellus Shale well was drilled in the state. They also say prior to 2004 levels of radon in PA homes was pretty much steady-state--that it did not increase. Since the "big thing" that's happened over the past decade is a lot of Marcellus drilling, voila, must be those nasty frackers are the source.
USGS Report: Water Quality in Mon River Basin Shows No Harm from Marcellus Sh...Marcellus Drilling News
A report by the U.S. Geological Survey titled "Water Quality of Groundwater and Stream Base Flow in the Marcellus Shale Gas Field of the Monongahela River Basin, West Virginia". The report compares water samples taken before shale fracking in WV and then again recently. When comparing the samples, the USGS has found fracking hasn't affected water quality--at all.
The monthly tabulation and prediction from the U.S. Energy Information Administration on production and activity in the largest 7 U.S. shale plays. All 7 shale plays will experience a decrease in natural gas production from the previous month due to low commodity prices.
The Drilling Productivity Report (DPR) for February 2015, published by the U.S. Energy Information Administration. The monthly DPR shows how productive the top seven US shale plays are for both oil and natural gas.
The monthly report from the U.S. Energy Information Administration showing production of oil and gas broken out by the 7 major commercially active shale plays in the U.S.
The monthly Drilling Productivity Report for April 2014 from the U.S. Energy Information Administration (EIA). The April report shows the Marcellus Shale average daily production continues to climb--and in May will come very close to 15 billion cubic feet per day of production (14.77 Bcf/d).
The monthly tabulation and prediction from the U.S. Energy Information Administration on production and activity in the largest 7 U.S. shale plays. All 7 shale plays will experience a decrease in natural gas production from the previous month due to low commodity prices.
The monthly Drilling Productivity Report issued by the U.S. Energy Information Administration--for July 2014. This report shows once again the Marcellus continues to increase production--up 28% from a year earlier. The Marcellus now accounts for 16% of all US natgas production.
The monthly tabulation and prediction from the U.S. Energy Information Administration on production and activity in the largest 7 U.S. shale plays. All 7 shale plays will experience a decrease in natural gas production from the previous month due to low commodity prices.
The monthly Drilling Productivity Report from the U.S. Energy Information Administration for August 2014. This edition of the DPR includes, for the first time, the Utica Shale.
The monthly tabulation and prediction from the U.S. Energy Information Administration on production and activity in the largest 7 U.S. shale plays. All 7 shale plays will experience a decrease in natural gas production from the previous month due to low commodity prices.
The document is a report from the U.S. Energy Information Administration analyzing oil and natural gas production from seven U.S. regions. It finds that these seven regions accounted for 92% of domestic oil production growth and all domestic natural gas production growth from 2011-2014. For each region, it provides data on historical and current production levels of oil and natural gas, as well as indicators of expected monthly changes for February 2016.
The monthly Drilling Productivity Report from the U.S. Energy Information Administration issued Sept 8, 2014. The latest report shows that the Marcellus Shale is due to produce more than 18 billion cubic feet of natural gas per day in October--an astonishing number--making the Marcellus the most productive shale field in the world. The Utica Shale continues to rapidly expand its natgas production as well.
The monthly tabulation and prediction from the U.S. Energy Information Administration on production and activity in the largest 7 U.S. shale plays. All 7 shale plays will experience a decrease in natural gas production from the previous month due to low commodity prices.
The document is a report from the U.S. Energy Information Administration analyzing oil and natural gas production from seven regions in the United States. It provides data on production levels, changes in production from existing and new wells, and rig counts for each region from November 2014 to November 2015. The regions accounted for 92% of domestic oil production growth and all domestic natural gas production growth from 2011 to 2014.
The document is a report from the U.S. Energy Information Administration analyzing oil and natural gas production from six regions in the U.S. It provides data on production levels, new well productivity, and legacy production for the Bakken, Eagle Ford, Haynesville, Marcellus, Niobrara and Permian regions. The report indicates that production increased in most regions from March to April 2014, with the largest increases seen in the Eagle Ford region for natural gas.
A list of the fees paid by individual drillers as an "impact fee" (equivalent of a severance tax) during 2014 by drillers in Pennsylvania. In 2014 drillers paid $223.5 million in impact fees.
New "research" by anti-drilling researchers at Johns Hopkins University that purports to show a connection between fracked shale wells in PA and an increase in radon in PA homes. Johns Hopkins Bloomberg School of Public Health researchers rather simplistically say that levels of radon in PA homes have been going up since 2004--when the first Marcellus Shale well was drilled in the state. They also say prior to 2004 levels of radon in PA homes was pretty much steady-state--that it did not increase. Since the "big thing" that's happened over the past decade is a lot of Marcellus drilling, voila, must be those nasty frackers are the source.
USGS Report: Water Quality in Mon River Basin Shows No Harm from Marcellus Sh...Marcellus Drilling News
A report by the U.S. Geological Survey titled "Water Quality of Groundwater and Stream Base Flow in the Marcellus Shale Gas Field of the Monongahela River Basin, West Virginia". The report compares water samples taken before shale fracking in WV and then again recently. When comparing the samples, the USGS has found fracking hasn't affected water quality--at all.
Antero is one of the largest drillers in the Marcellus/Utica region. This presentation highlights and summarizes their northeast operations. The company now owns, as of Jan 2015, 542,000 net acres of leases in the northeast.
EPA Study of Northeast PA Water Wells Potentially Affected by Fracking - May ...Marcellus Drilling News
A study published as part of the years-long investigation by the federal EPA into whether or not fracking done near fresh water sources negatively harms those sources. The short answer found by the EPA is: No, fracking doesn't pollute water wells.
The newest PowerPoint slidedeck from MHR detailing results from 2014 and plans for 2015. MHR is focused almost totally on the Marcellus and Utica Shale, with very small operations also in the Bakken Shale region.
This document shows disbursement amounts from Marcellus Legacy funds and 60% funds to counties and municipalities in Pennsylvania for 2014. Allegheny County municipalities received over $1.5 million, while Armstrong County municipalities received over $500,000 and $65,000 from the respective funding sources. The table lists each municipality along with the amounts received from each fund and a total disbursement amount.
Report: Marcellus Shale Gas Development and Impacts on Pennsylvania Schools a...Marcellus Drilling News
The Center for Rural Pennsylvania, a bipartisan, bicameral legislative agency that serves as a resource for rural policy within the Pennsylvania General Assembly, has just published the third report in a series of studies commissioned on the Marcellus Shale and its impact on the state. Titled "Marcellus Shale Gas Development and Impacts on Pennsylvania Schools and Education", the report looks at whether or not the rapid development of shale drilling in the state has stressed local schools in areas with the most Marcellus Shale drilling. It was feared that with an influx of workers, and potentially families, local schools would see a spike in enrollment. The report says that hasn't happened. There was also a concern about dropout rates--perhaps kids leaving school early to work in the gas fields. That hasn't happened either. In fact, if anything, the Marcellus has contributed more money to the coffers of local schools. No negative impacts, lots of positive impacts from northeast shale drilling.
The document is a report from the U.S. Energy Information Administration analyzing drilling productivity in seven major oil and gas regions in the United States. It provides data on oil and gas production, rig counts, and changes in production from existing and new wells for each region from 2007 to the present. The regions accounted for 95% of domestic oil production growth and all domestic natural gas production growth from 2011-2013.
Dr. Dev Kambhampati | EIA Nat Gas Drilling Productivity Report, July 2014Dr Dev Kambhampati
The document is a report from the U.S. Energy Information Administration analyzing oil and natural gas production from six key regions in the U.S. It provides data on production, new well productivity, and legacy production for the Bakken, Eagle Ford, Haynesville, Marcellus, Niobrara and Permian regions for August 2013 and August 2014. The report indicates that these six regions accounted for 95% of domestic oil production growth and all domestic natural gas production growth from 2011 to 2013.
The monthly tabulation and prediction from the U.S. Energy Information Administration on production and activity in the largest 7 U.S. shale plays. All 7 shale plays will experience a decrease in natural gas production from the previous month due to low commodity prices.
Monthly report from the U.S. Energy Information Administration that shows total oil and gas output from the country's seven most actively drilled shale plays. This latest report shows that the Marcellus continues to dominate, producing more than twice the output (in natural gas) of any other shale play. Fully 37% of all natgas being produced by U.S. shale plays comes from the Marcellus.
The document is a report from the U.S. Energy Information Administration analyzing oil and gas production from seven regions in the U.S. It includes charts and tables showing historical and projected production levels of oil and gas from each region from 2008 to 2017, as well as metrics like the average production per rig. The regions - Bakken, Eagle Ford, Haynesville, Marcellus, Niobrara, Permian, and Utica - accounted for 92% of domestic oil production growth and all domestic natural gas production growth from 2011-2014.
The monthly tabulation and prediction from the U.S. Energy Information Administration on production and activity in the largest 7 U.S. shale plays. All 7 shale plays will experience a decrease in natural gas production from the previous month due to low commodity prices.
The monthly Drilling Productivity Report from the EIA that shows, by major shale basin, the productivity for both new and existing wells--for both oil and gas. This month's report shows that the Marcellus will officially blow by 16 billion cubic feet per day of production in December.
The Drilling Productivity Report uses recent data on the total number of drilling rigs in operation along with estimates of drilling productivity and estimated changes in production from existing oil and natural gas wells to provide estimated changes in oil and natural gas production for six key fields. EIA's approach does not distinguish between oil-directed rigs and gas-directed rigs because once a well is completed it may produce both oil and gas; more than half of the wells produce both.
The very first Drilling Productivity Report (DRP) issued by the U.S. Energy Information Administation. The report, using charts and graphs, shows how efficient (or not) rigs are at drilling, and how productive (or not) wells are, by region/shale play. Among the very important metrics tracked is the decline rate of newly drilled wells–how quickly the gas and oil flowing out of shale wells peters out. This first report shows the Marcellus Shale has (astonishingly) hit 12 billion cubic feet per day of natural gas production.
A monthly report on how productive (or effective) drilling in six major U.S. shale plays has been over the previous 30 days. This is the report for November 2013.
The document summarizes five key facts about the recovery of US shale oil production:
1) Rig counts have increased by 90% since bottoming out in May 2016 and are up 30% year-over-year, signaling increased drilling and production capacity.
2) While decline rates remain steep, production profiles have increased substantially due to technological advances, meaning aggregate supply will be stronger.
3) Preliminary data shows that net new shale supply turned positive in December 2016 for the first time since March 2015, recovering just 7 months after rig counts increased.
4) Increased drilling activity is supported by a large stock of drilled but uncompleted wells, demonstrating the recovery and expansion of the shale sector.
5)
Quarterly legislative action update: Marcellus and Utica shale region (4Q16)Marcellus Drilling News
A quarterly update from the legal beagles at global law firm Norton Rose Fulbright. A quarterly legislative action update for the second quarter of 2016 looking at previously laws acted upon, and new laws introduced, affecting the oil and gas industry in Pennsylvania, Ohio and West Virginia.
An update from Spectra Energy on their proposed $3 billion project to connect four existing pipeline systems to flow more Marcellus/Utica gas to New England. In short, Spectra has put the project on pause until mid-2017 while it attempts to get new customers signed.
A letter from Rover Pipeline to the Federal Energy Regulatory Commission requesting the agency issue the final certificate that will allow Rover to begin tree-clearing and construction of the 511-mile pipeline through Pennsylvania, West Virginia, Ohio and Michigan. If the certificate is delayed beyond the end of 2016, it will delay the project an extra year due to tree-clearing restrictions (to accommodate federally-protected bats).
DOE Order Granting Elba Island LNG Right to Export to Non-FTA CountriesMarcellus Drilling News
An order issued by the U.S. Dept. of Energy that allows the Elba Island LNG export facility to export LNG to countries with no free trade agreement with the U.S. Countries like Japan and India have no FTA with our country (i.e. friendly countries)--so this is good news indeed. Although the facility would have operated by sending LNG to FTA countries, this order opens the market much wider.
A study released in December 2016 by the London School of Economics, titled "On the Comparative Advantage of U.S. Manufacturing: Evidence from the Shale Gas Revolution." While America has enough shale gas to export plenty of it, exporting it is not as economic as exporting oil due to the elaborate processes to liquefy and regassify natural gas--therefore a lot of the gas stays right here at home, making the U.S. one of (if not the) cheapest places on the planet to establish manufacturing plants, especially for manufacturers that use natural gas and NGLs (natural gas liquids). Therefore, manufacturing, especially in the petrochemical sector, is ramping back up in the U.S. For every two jobs created by fracking, another one job is created in the manufacturing sector.
Letter From 24 States Asking Trump & Congress to Withdraw the Unlawful Clean ...Marcellus Drilling News
A letter from the attorneys general from 24 of the states opposed to the Obama Clean Power Plan to President-Elect Trump, RINO Senate Majority Leader Mitch McConnel and RINO House Speaker Paul Ryan. The letter asks Trump to dump the CPP on Day One when he takes office, and asks Congress to adopt legislation to prevent the EPA from such an egregious overreach ever again.
Report: New U.S. Power Costs: by County, with Environmental ExternalitiesMarcellus Drilling News
Natural gas and wind are the lowest-cost technology options for new electricity generation across much of the U.S. when cost, public health impacts and environmental effects are considered. So says this new research paper released by The University of Texas at Austin. Researchers assessed multiple generation technologies including coal, natural gas, solar, wind and nuclear. Their findings are depicted in a series of maps illustrating the cost of each generation technology on a county-by-county basis throughout the U.S.
Annual report issued by the U.S. Energy Information Administration showing oil and natural gas proved reserves, in this case for 2015. These reports are issued almost a year after the period for which they report. This report shows proved reserves for natural gas dropped by 64.5 trillion cubic feet (Tcf), or 16.6%. U.S. crude oil and lease condensate proved reserves also decreased--from 39.9 billion barrels to 35.2 billion barrels (down 11.8%) in 2015. Proved reserves are calculated on a number of factors, including price.
Velocys is the manufacturer of gas-to-liquids (GTL) plants that convert natural gas (a hyrdocarbon) into other hydrocarbons, like diesel fuel, gasoline, and even waxes. This PowerPoint presentation lays out the Velocys plan to get the company growing. GTL plants have not (so far) taken off in the U.S. Velocys hopes to change that. They specialize in small GTL plants.
PA DEP Revised Permit for Natural Gas Compression Stations, Processing Plants...Marcellus Drilling News
In January 2016, Gov. Wolf announced the DEP would revise its current general permit (GP-5) to update the permitting requirements for sources at natural gas compression, processing, and transmission facilities. This is the revised GP-5.
PA DEP Permit for Unconventional NatGas Well Site Operations and Remote Piggi...Marcellus Drilling News
In January 2016, PA Gov. Wolf announced the Dept. of Environmental Protection would develop a general permit for sources at new or modified unconventional well sites and remote pigging stations (GP-5A). This is the proposed permit.
Onerous new regulations for the Pennsylvania Marcellus Shale industry proposed by the state Dept. of Environmental Protection. The new regs will, according to the DEP, help PA reduce so-called fugitive methane emissions and some types of air pollution (VOCs). This is liberal Gov. Tom Wolf's way of addressing mythical man-made global warming.
The monthly Short-Term Energy Outlook (STEO) from the U.S. Energy Information Administration for December 2016. This issue makes a couple of key points re natural gas: (1) EIA predicts that natural gas production in the U.S. for 2016 will see a healthy decline over 2015 levels--1.3 billion cubic feet per day (Bcf/d) less in 2016. That's the first annual production decline since 2005! (2) The EIA predicts the average price for natural gas at the benchmark Henry Hub will climb from $2.49/Mcf (thousand cubic feet) in 2016 to a whopping $3.27/Mcf in 2017. Why the jump? Growing domestic natural gas consumption, along with higher pipeline exports to Mexico and liquefied natural gas exports.
This document provides an overview of the natural gas market in the Northeast United States, including New England, New York, New Jersey, and Pennsylvania. It details statistics on gas customers, consumption, infrastructure like pipelines and storage, and production. A key point is that the development of the Marcellus Shale in Pennsylvania has significantly increased domestic gas production in the region and reduced its reliance on other supply basins and imports.
The Pennsylvania Public Utility Commission responded to each point raised in a draft copy of the PA Auditor General's audit of how Act 13 impact fee money, raised from Marcellus Shale drillers, gets spent by local municipalities. The PUC says it's not their job to monitor how the money gets spent, only in how much is raised and distributed.
Pennsylvania Public Utility Commission Act 13/Impact Fees Audit by PA Auditor...Marcellus Drilling News
A biased look at how 60% of impact fees raised from PA's shale drilling are spent, by the anti-drilling PA Auditor General. He chose to ignore an audit of 40% of the impact fees, which go to Harrisburg and disappear into the black hole of Harrisburg spending. The Auditor General claims, without basis in fact, that up to 24% of the funds are spent on items not allowed under the Act 13 law.
The final report from the Pennsylvania Dept. of Environmental Protection that finds, after several years of testing, no elevated levels of radiation from acid mine drainage coming from the Clyde Mine, flowing into Ten Mile Creek. Radical anti-drillers tried to smear the Marcellus industry with false claims of illegal wastewater dumping into the mine, with further claims of elevated radiation levels in the creek. After years of testing, the DEP found those allegations to be false.
FERC Order Denying Stay of Kinder Morgan's Broad Run Expansion ProjectMarcellus Drilling News
The Federal Energy Regulatory Commission denied a request to stay the authorization of Tennessee Gas Pipeline Company's Broad Run Expansion Project. The Commission found that the intervenors requesting the stay did not demonstrate they would suffer irreparable harm if the project proceeded. Specifically, the Commission determined that the environmental impacts to forest and a nearby animal rehabilitation center would be insignificant. Additionally, conditioning authorization on future permits did not improperly encroach on state authority. Therefore, justice did not require granting a stay.
Sixth Circuit Court of Appeals Decision in Harper v Muskingum Watershed Conse...Marcellus Drilling News
Anti-drilling landowners (backed by Food & Water Watch) claimed the Muskingum Watershed Conservancy District had violated the deed to the land it owns by leasing that land for Utica Shale drilling. The Sixth Circuit dismissed the case. The anti-drillers lost.
An astonishing, first-of-its-kind, report by the NYT assessing damage in Ukraine. Even if the war ends tomorrow, in many places there will be nothing to go back to.
El Puerto de Algeciras continúa un año más como el más eficiente del continente europeo y vuelve a situarse en el “top ten” mundial, según el informe The Container Port Performance Index 2023 (CPPI), elaborado por el Banco Mundial y la consultora S&P Global.
El informe CPPI utiliza dos enfoques metodológicos diferentes para calcular la clasificación del índice: uno administrativo o técnico y otro estadístico, basado en análisis factorial (FA). Según los autores, esta dualidad pretende asegurar una clasificación que refleje con precisión el rendimiento real del puerto, a la vez que sea estadísticamente sólida. En esta edición del informe CPPI 2023, se han empleado los mismos enfoques metodológicos y se ha aplicado un método de agregación de clasificaciones para combinar los resultados de ambos enfoques y obtener una clasificación agregada.
Acolyte Episodes review (TV series) The Acolyte. Learn about the influence of the program on the Star Wars world, as well as new characters and story twists.
Essential Tools for Modern PR Business .pptxPragencyuk
Discover the essential tools and strategies for modern PR business success. Learn how to craft compelling news releases, leverage press release sites and news wires, stay updated with PR news, and integrate effective PR practices to enhance your brand's visibility and credibility. Elevate your PR efforts with our comprehensive guide.
Here is Gabe Whitley's response to my defamation lawsuit for him calling me a rapist and perjurer in court documents.
You have to read it to believe it, but after you read it, you won't believe it. And I included eight examples of defamatory statements/
U.S. EIA's Drilling Productivity Report - June 2015
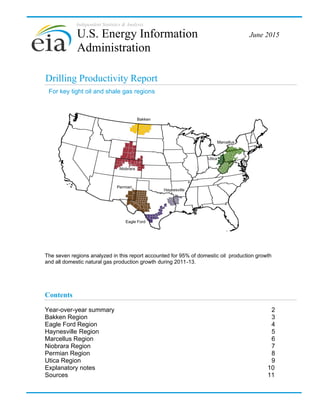
1. Independent Statistics & Analysis
Drilling Productivity Report
The seven regions analyzed in this report accounted for 95% of domestic oil production growth
and all domestic natural gas production growth during 2011-13.
June 2015
For key tight oil and shale gas regions
U.S. Energy Information
Administration
Contents
Year-over-year summary 2
Bakken Region 3
Eagle Ford Region 4
Haynesville Region 5
Marcellus Region 6
Niobrara Region 7
Permian Region 8
Utica Region 9
Explanatory notes 10
Sources 11
Bakken
Marcellus
Niobrara
Haynesville
Eagle Ford
Permian
Utica
2. U. S. Energy Information Administration | Drilling Productivity Report
0
400
800
1,200
1,600
2,000
2,400
2,800
Bakken Eagle Ford Haynesville Marcellus Niobrara Permian Utica
July-2014 July-2015
Oil production
thousand barrels/day
0
3,000
6,000
9,000
12,000
15,000
18,000
Bakken Eagle Ford Haynesville Marcellus Niobrara Permian Utica
July-2014 July-2015
Natural gas production
million cubic feet/day
0
250
500
750
1,000
1,250
1,500
Bakken Eagle Ford Haynesville Marcellus Niobrara Permian Utica
July-2014 July-2015
New-well oil production per rig
barrels/day
0
1,000
2,000
3,000
4,000
5,000
6,000
7,000
8,000
9,000
Bakken Eagle Ford Haynesville Marcellus Niobrara Permian Utica
July-2014 July-2015
New-well gas production per rig
thousand cubic feet/day
(700)
(600)
(500)
(400)
(300)
(200)
(100)
0
Bakken Eagle Ford Haynesville Marcellus Niobrara Permian Utica
July-2014 July-2015
Legacy gas production change
million cubic feet/day
(150)
(125)
(100)
(75)
(50)
(25)
0
Bakken Eagle Ford Haynesville Marcellus Niobrara Permian Utica
July-2014 July-2015
Legacy oil production change
thousand barrels/day
drilling data through May
projected production through July
June 2015
Drilling Productivity Report
Year-over-year summary
-60
-40
-20
0
20
40
60
Bakken Eagle Ford Haynesville Marcellus Niobrara Permian Utica
July-2014 July-2015
thousand barrels/day
Indicated monthly change in oil production (Jul vs. Jun)
-150
-100
-50
0
50
100
150
200
250
300
350
Bakken Eagle Ford Haynesville Marcellus Niobrara Permian Utica
July-2014 July-2015
million cubic feet/day
Indicated monthly change in gas production (Jul vs. Jun)
2
3. U. S. Energy Information Administration | Drilling Productivity Report
0
200
400
600
800
1,000
1,200
1,400
2007 2008 2009 2010 2011 2012 2013 2014 2015
Oil production
thousand barrels/day
Bakken Region
-50
0
50
100
Jun
1,266
Mbbl/d
Production
from
new wells
Legacy
production
change
Net
change
Jul
1,237
Mbbl/d
thousand barrels/day
Bakken Region
+51 -80 -29
Indicated change in oil production (Jul vs. Jun)
-50
0
50
100
Jun
1,499
MMcf/d
Production
from
new wells
Legacy
production
change
Net
change
Jul
1,471
MMcf/d
Indicated change in natural gas production (Jul vs. Jun)
million cubic feet/day
Bakken Region
+50 -78 -28
0
50
100
150
200
250
0
100
200
300
400
500
600
2007 2008 2009 2010 2011 2012 2013 2014 2015
new-well oil production per rig
rig count
New-well oil production per rig
barrels/day
Bakken Region
Rig count
rigs
(90)
(80)
(70)
(60)
(50)
(40)
(30)
(20)
(10)
0
2007 2008 2009 2010 2011 2012 2013 2014 2015
Legacy oil production change
thousand barrels/day
Bakken Region
(90)
(80)
(70)
(60)
(50)
(40)
(30)
(20)
(10)
0
2007 2008 2009 2010 2011 2012 2013 2014 2015
Legacy gas production change
million cubic feet/day
Bakken RegionBakken Region
0
1,000
2,000
3,000
4,000
5,000
6,000
7,000
2007 2008 2009 2010 2011 2012 2013 2014 2015
Bakken Region
Natural gas production
million cubic feet/day
0
50
100
150
200
250
0
600
1,200
1,800
2,400
3,000
3,600
2007 2008 2009 2010 2011 2012 2013 2014 2015
new-well gas production per rig
rig count
New-well gas production per rig
thousand cubic feet/day
Bakken Region
Rig count
rigs
drilling data through May
projected production through July
June 2015
Drilling Productivity Report
Monthly
additions
from one
average rig
July
barrels/day
June
barrels/day
month over month
Oil
+23
Gas
thousand cubic feet/day
month over month
+11
Bakken Region
million cubic feet/day
month over month
631July
thousand cubic feet/day
June 620
654
631
thousand barrels/day
month over month
Oil -29 Gas -28
3
4. U. S. Energy Information Administration | Drilling Productivity Report
0
300
600
900
1,200
1,500
1,800
2007 2008 2009 2010 2011 2012 2013 2014 2015
Oil production
thousand barrels/day
Eagle Ford Region
-100
-50
0
50
100
150
Jun
1,643
Mbbl/d
Production
from
new wells
Legacy
production
change
Net
change
Jul
1,594
Mbbl/d
thousand barrels/day
Eagle Ford Region
+90 -139 -49
Indicated change in oil production (Jul vs. Jun)
-200
-100
0
100
200
300
Jun
7,252
MMcf/d
Production
from
new wells
Legacy
production
change
Net
change
Jul
7,144
MMcf/d
Indicated change in natural gas production (Jul vs. Jun)
million cubic feet/day
Eagle Ford Region
+242 -350 -108
0
50
100
150
200
250
300
350
0
100
200
300
400
500
600
700
2007 2008 2009 2010 2011 2012 2013 2014 2015
new-well oil production per rig
rig count
New-well oil production per rig
barrels/day
Eagle Ford Region
Rig count
rigs
(160)
(140)
(120)
(100)
(80)
(60)
(40)
(20)
0
2007 2008 2009 2010 2011 2012 2013 2014 2015
Legacy oil production change
thousand barrels/day
Eagle Ford Region
(400)
(350)
(300)
(250)
(200)
(150)
(100)
(50)
0
2007 2008 2009 2010 2011 2012 2013 2014 2015
Legacy gas production change
million cubic feet/day
Eagle Ford RegionEagle Ford Region
0
2,000
4,000
6,000
8,000
10,000
2007 2008 2009 2010 2011 2012 2013 2014 2015
Eagle Ford Region
Natural gas production
million cubic feet/day
0
50
100
150
200
250
300
350
0
600
1,200
1,800
2,400
3,000
3,600
4,200
2007 2008 2009 2010 2011 2012 2013 2014 2015
new-well gas production per rig
rig count
New-well gas production per rig
thousand cubic feet/day
Eagle Ford Region
Rig count
rigs
drilling data through May
projected production through July
June 2015
Drilling Productivity Report
Monthly
additions
from one
average rig
July
barrels/day
June
barrels/day
month over month
Oil
+22
Gas
thousand cubic feet/day
month over month
+43
Eagle Ford Region
million cubic feet/day
month over month
1,993July
thousand cubic feet/day
June 1,950
741
719
thousand barrels/day
month over month
Oil -49 Gas -108
4
5. U. S. Energy Information Administration | Drilling Productivity Report
barrels/day
0
400
800
1,200
1,600
2,000
2007 2008 2009 2010 2011 2012 2013 2014 2015
Oil production
thousand barrels/day
Haynesville Region
-1.0
0.0
1.0
2.0
Jun
59
Mbbl/d
Production
from
new wells
Legacy
production
change
Net
change
Jul
59
Mbbl/d
thousand barrels/day
Haynesville Region
+1 -1 0
Indicated change in oil production (Jul vs. Jun)
-150
-50
50
150
250
Jun
7,028
MMcf/d
Production
from
new wells
Legacy
production
change
Net
change
Jul
7,002
MMcf/d
Indicated change in natural gas production (Jul vs. Jun)
million cubic feet/day
Haynesville Region
+172 -198 -26
0
50
100
150
200
250
300
0
200
400
600
800
1,000
2007 2008 2009 2010 2011 2012 2013 2014 2015
new-well oil production per rig
rig count
New-well oil production per rig
barrels/day
Haynesville Region
Rig count
rigs
(3)
(2)
(1)
0
2007 2008 2009 2010 2011 2012 2013 2014 2015
Legacy oil production change
thousand barrels/day
Haynesville Region
(600)
(500)
(400)
(300)
(200)
(100)
0
2007 2008 2009 2010 2011 2012 2013 2014 2015
Legacy gas production change
million cubic feet/day
Haynesville RegionHaynesville Region
0
2,000
4,000
6,000
8,000
10,000
12,000
2007 2008 2009 2010 2011 2012 2013 2014 2015
Haynesville Region
Natural gas production
million cubic feet/day
0
50
100
150
200
250
300
0
1,000
2,000
3,000
4,000
5,000
6,000
7,000
2007 2008 2009 2010 2011 2012 2013 2014 2015
new-well gas production per rig
rig count
New-well gas production per rig
thousand cubic feet/day
Haynesville Region
Rig count
rigs
drilling data through May
projected production through July
June 2015
Drilling Productivity Report
Monthly
additions
from one
average rig
July
June
barrels/day
month over month
Oil
0
Gas
thousand cubic feet/day
month over month
+34
Haynesville Region
million cubic feet/day
month over month
5,981July
thousand cubic feet/day
June 5,947
28
28
thousand barrels/day
month over month
Oil 0 Gas -26
5
6. U. S. Energy Information Administration | Drilling Productivity Report
Marcellus Region
0
500
1,000
1,500
2,000
2,500
3,000
2007 2008 2009 2010 2011 2012 2013 2014 2015
Oil production
thousand barrels/day
Marcellus Region
-1.0
0.0
1.0
2.0
3.0
4.0
Jun
57
Mbbl/d
Production
from
new wells
Legacy
production
change
Net
change
Jul
57
Mbbl/d
thousand barrels/day
Marcellus Region
+3 -3 0
Indicated change in oil production (Jul vs. Jun)
-200
0
200
400
600
800
Jun
16,522
MMcf/d
Production
from
new wells
Legacy
production
change
Net
change
Jul
16,494
MMcf/d
Indicated change in natural gas production (Jul vs. Jun)
million cubic feet/day
Marcellus Region
+646 -674 -28
0
30
60
90
120
150
0
300
600
900
1,200
1,500
2007 2008 2009 2010 2011 2012 2013 2014 2015
new-well oil production per rig
rig count
New-well oil production per rig
barrels/day
Marcellus Region
Rig count
rigs
(4)
(3)
(2)
(1)
0
2007 2008 2009 2010 2011 2012 2013 2014 2015
Legacy oil production change
thousand barrels/day
Marcellus Region
(800)
(700)
(600)
(500)
(400)
(300)
(200)
(100)
0
2007 2008 2009 2010 2011 2012 2013 2014 2015
Legacy gas production change
million cubic feet/day
Marcellus RegionMarcellus Region
0
2,000
4,000
6,000
8,000
10,000
12,000
14,000
16,000
18,000
2007 2008 2009 2010 2011 2012 2013 2014 2015
Marcellus Region
Natural gas production
million cubic feet/day
0
30
60
90
120
150
0
1,500
3,000
4,500
6,000
7,500
9,000
2007 2008 2009 2010 2011 2012 2013 2014 2015
new-well gas production per rig
rig count
New-well gas production per rig
thousand cubic feet/day
Marcellus Region
Rig count
rigs
drilling data through May
projected production through July
June 2015
Drilling Productivity Report
Monthly
additions
from one
average rig
July
barrels/day
June
barrels/day
month over month
Oil
+1
Gas
thousand cubic feet/day
month over month
+46
million cubic feet/day
month over month
8,276July
thousand cubic feet/day
June 8,230
39
38
thousand barrels/day
month over month
Oil 0 Gas -28
6
7. U. S. Energy Information Administration | Drilling Productivity Report
0
200
400
600
800
1,000
2007 2008 2009 2010 2011 2012 2013 2014 2015
Oil production
thousand barrels/day
Niobrara Region
-20
-10
0
10
20
30
Jun
431
Mbbl/d
Production
from
new wells
Legacy
production
change
Net
change
Jul
414
Mbbl/d
thousand barrels/day
Niobrara Region
+25 -42 -17
Indicated change in oil production (Jul vs. Jun)
-100
-50
0
50
100
150
Jun
4,611
MMcf/d
Production
from
new wells
Legacy
production
change
Net
change
Jul
4,558
MMcf/d
Indicated change in natural gas production (Jul vs. Jun)
million cubic feet/day
Niobrara Region
+95 -148 -53
0
20
40
60
80
100
120
140
0
100
200
300
400
500
600
2007 2008 2009 2010 2011 2012 2013 2014 2015
new-well oil production per rig
rig count
New-well oil production per rig
barrels/day
Niobrara Region
Rig count
rigs
(45)
(40)
(35)
(30)
(25)
(20)
(15)
(10)
(5)
0
2007 2008 2009 2010 2011 2012 2013 2014 2015
Legacy oil production change
thousand barrels/day
Niobrara Region
(160)
(140)
(120)
(100)
(80)
(60)
(40)
(20)
0
2007 2008 2009 2010 2011 2012 2013 2014 2015
Legacy gas production change
million cubic feet/day
Niobrara RegionNiobrara Region
0
1,000
2,000
3,000
4,000
5,000
6,000
2007 2008 2009 2010 2011 2012 2013 2014 2015
Niobrara Region
Natural gas production
million cubic feet/day
0
20
40
60
80
100
120
140
0
600
1,200
1,800
2,400
3,000
3,600
2007 2008 2009 2010 2011 2012 2013 2014 2015
new-well gas production per rig
rig count
New-well gas production per rig
thousand cubic feet/day
Niobrara Region
Rig count
rigs
drilling data through May
projected production through July
June 2015
Drilling Productivity Report
Monthly
additions
from one
average rig
July
barrels/day
June
barrels/day
month over month
Oil
+13
Gas
thousand cubic feet/day
month over month
+38
Niobrara Region
million cubic feet/day
month over month
1,922July
thousand cubic feet/day
June 1,884
510
497
thousand barrels/day
month over month
Oil -17 Gas -53
7
8. U. S. Energy Information Administration | Drilling Productivity Report
0
200
400
600
800
1,000
1,200
1,400
1,600
1,800
2,000
2,200
2007 2008 2009 2010 2011 2012 2013 2014 2015
Oil production
thousand barrels/day
Permian Region
0
25
50
75
100
Jun
2,056
Mbbl/d
Production
from
new wells
Legacy
production
change
Net
change
Jul
2,059
Mbbl/d
thousand barrels/day
Permian Region
+74 -71 +3
Indicated change in oil production (Jul vs. Jun)
-50
0
50
100
150
200
Jun
6,436
MMcf/d
Production
from
new wells
Legacy
production
change
Net
change
Jul
6,416
MMcf/d
Indicated change in natural gas production (Jul vs. Jun)
million cubic feet/day
Permian Region
+133 -153 -20
0
100
200
300
400
500
600
0
50
100
150
200
250
300
350
2007 2008 2009 2010 2011 2012 2013 2014 2015
new-well oil production per rig
rig count
New-well oil production per rig
barrels/day
Permian Region
Rig count
rigs
(80)
(70)
(60)
(50)
(40)
(30)
(20)
(10)
0
2007 2008 2009 2010 2011 2012 2013 2014 2015
Legacy oil production change
thousand barrels/day
Permian Region
(180)
(160)
(140)
(120)
(100)
(80)
(60)
(40)
(20)
0
2007 2008 2009 2010 2011 2012 2013 2014 2015
Legacy gas production change
million cubic feet/day
Permian RegionPermian Region
0
2,000
4,000
6,000
8,000
10,000
12,000
2007 2008 2009 2010 2011 2012 2013 2014 2015
Permian Region
Natural gas production
million cubic feet/day
0
100
200
300
400
500
600
0
300
600
900
1,200
1,500
1,800
2,100
2007 2008 2009 2010 2011 2012 2013 2014 2015
new-well gas production per rig
rig count
New-well gas production per rig
thousand cubic feet/day
Permian Region
Rig count
rigs
drilling data through May
projected production through July
June 2015
Drilling Productivity Report
Monthly
additions
from one
average rig
July
barrels/day
June
barrels/day
month over month
Oil
+19
Gas
thousand cubic feet/day
month over month
+27
Permian Region
million cubic feet/day
month over month
570July
thousand cubic feet/day
June 543
315
296
thousand barrels/day
month over month
Oil +3 Gas -20
8
9. U. S. Energy Information Administration | Drilling Productivity Report
Utica Region
0
100
200
300
400
500
2007 2008 2009 2010 2011 2012 2013 2014 2015
Oil production
thousand barrels/day
Utica Region
0.0
2.0
4.0
6.0
Jun
65
Mbbl/d
Production
from
new wells
Legacy
production
change
Net
change
Jul
66
Mbbl/d
thousand barrels/day
Utica Region
+3 -2 +1
Indicated change in oil production (Jul vs. Jun)
0
25
50
75
100
Jun
2,519
MMcf/d
Production
from
new wells
Legacy
production
change
Net
change
Jul
2,561
MMcf/d
Indicated change in natural gas production (Jul vs. Jun)
million cubic feet/day
Utica Region
+87 -45 +42
0
5
10
15
20
25
30
35
0
200
400
600
800
1,000
1,200
2007 2008 2009 2010 2011 2012 2013 2014 2015
new-well oil production per rig
rig count
New-well oil production per rig
barrels/day
Utica Region
Rig count
rigs
(3)
(2)
(1)
0
2007 2008 2009 2010 2011 2012 2013 2014 2015
Legacy oil production change
thousand barrels/day
Utica Region
(50)
(40)
(30)
(20)
(10)
0
10
2007 2008 2009 2010 2011 2012 2013 2014 2015
Legacy gas production change
million cubic feet/day
Utica RegionUtica Region
0
500
1,000
1,500
2,000
2,500
3,000
2007 2008 2009 2010 2011 2012 2013 2014 2015
Utica Region
Natural gas production
million cubic feet/day
0
5
10
15
20
25
30
35
0
1,200
2,400
3,600
4,800
6,000
7,200
2007 2008 2009 2010 2011 2012 2013 2014 2015
new-well gas production per rig
rig count
New-well gas production per rig
thousand cubic feet/day
Utica Region
Rig count
rigs
drilling data through May
projected production through July
June 2015
Drilling Productivity Report
Monthly
additions
from one
average rig
July
barrels/day
June
barrels/day
month over month
Oil
+9
Gas
thousand cubic feet/day
month over month
+255
million cubic feet/day
month over month
6,905July
thousand cubic feet/day
June 6,650
262
253
thousand barrels/day
month over month
Oil +1 Gas +42
9
10. U. S. Energy Information Administration | Drilling Productivity Report
June 2015Explanatory notes
Drilling Productivity Report
The Drilling Productivity Report uses recent data on the total number of drilling rigs in operation along
with estimates of drilling productivity and estimated changes in production from existing oil and natural
gas wells to provide estimated changes in oil1 and natural gas2 production for seven key regions. EIA’s
approach does not distinguish between oil-directed rigs and gas-directed rigs because once a well is
completed it may produce both oil and gas; more than half of the wells do that.
Monthly additions from one average rig
Monthly additions from one average rig represent EIA’s estimate of an average rig’s3 contribution to
production of oil and natural gas from new wells.4 The estimation of new-well production per rig uses
several months of recent historical data on total production from new wells for each field divided by the
region's monthly rig count, lagged by two months.5 Current- and next-month values are listed on the top
header. The month-over-month change is listed alongside, with +/- signs and color-coded arrows to
highlight the growth or decline in oil (brown) or natural gas (blue).
New-well oil/gas production per rig
Charts present historical estimated monthly additions from one average rig coupled with the number of
total drilling rigs as reported by Baker Hughes.
Legacy oil and natural gas production change
Charts present EIA’s estimates of total oil and gas production changes from all the wells other than the
new wells. The trend is dominated by the well depletion rates, but other circumstances can influence the
direction of the change. For example, well freeze-offs or hurricanes can cause production to significantly
decline in any given month, resulting in a production increase the next month when production simply
returns to normal levels.
Projected change in monthly oil/gas production
Charts present the combined effects of new-well production and changes to legacy production. Total
new-well production is offset by the anticipated change in legacy production to derive the net change in
production. The estimated change in production does not reflect external circumstances that can affect
the actual rates, such as infrastructure constraints, bad weather, or shut-ins based on environmental or
economic issues.
Oil/gas production
Charts present all oil and natural gas production from both new and legacy wells since 2007. This
production is based on all wells reported to the state oil and gas agencies. Where state data are not
immediately available, EIA estimates the production based on estimated changes in new-well oil/gas
production and the corresponding legacy change.
Footnotes:
1. Oil production represents both crude and condensate production from all formations in the region. Production is
not limited to tight formations. The regions are defined by all selected counties, which include areas outside of
tight oil formations.
2. Gas production represents gross (before processing) gas production from all formations in the region.
Production is not limited to shale formations. The regions are defined by all selected counties, which include
areas outside of shale formations.
3. The monthly average rig count used in this report is calculated from weekly data on total oil and gas rigs
reported by Baker Hughes.
4. A new well is defined as one that began producing for the first time in the previous month. Each well belongs to
the new-well category for only one month. Reworked and recompleted wells are excluded from the calculation.
5. Rig count data lag production data because EIA has observed that the best predictor of the number of new
wells beginning production in a given month is the count of rigs in operation two months earlier.
10
11. U. S. Energy Information Administration | Drilling Productivity Report
June 2015Sources
Drilling Productivity Report
The data used in the preparation of this report come from the following sources. EIA is solely
responsible for the analysis, calculations, and conclusions.
Drilling Info (http://www.drillinginfo.com) Source of production, permit, and spud data for counties
associated with this report. Source of real-time rig location to estimate new wells spudded and completed
throughout the United States.
Baker Hughes (http://www.bakerhughes.com) Source of rig and well counts by county, state, and basin.
North Dakota Oil and Gas Division (https://www.dmr.nd.gov/oilgas) Source of well production, permit,
and completion data in the counties associated with this report in North Dakota
Railroad Commission of Texas (http://www.rrc.state.tx.us) Source of well production, permit, and
completion data in the counties associated with this report in Texas
Pennsylvania Department of Environmental Protection
(https://www.paoilandgasreporting.state.pa.us/publicreports/Modules/Welcome/Welcome.aspx) Source
of well production, permit, and completion data in the counties associated with this report in
Pennsylvania
West Virginia Department of Environmental Protection (http://www.dep.wv.gov/oil-and-
gas/Pages/default.aspx) Source of well production, permit, and completion data in the counties
associated with this report in West Virginia
Colorado Oil and Gas Conservation Commission (http://cogcc.state.co.us) Source of well production,
permit, and completion data in the counties associated with this report in Colorado
Wyoming Oil and Conservation Commission (http://wogcc.state.wy.us) Source of well production,
permit, and completion data in the counties associated with this report in Wyoming
Louisiana Department of Natural Resources (http://dnr.louisiana.gov) Source of well production,
permit, and completion data in the counties associated with this report in Louisiana
Ohio Department of Natural Resources (http://oilandgas.ohiodnr.gov) Source of well production,
permit, and completion data in the counties associated with this report in Ohio
11