EIA Drilling Productivity Report Analysis
•
0 likes•645 views

The document is a report from the U.S. Energy Information Administration analyzing oil and natural gas production from seven U.S. regions. It finds that these seven regions accounted for 92% of domestic oil production growth and all domestic natural gas production growth from 2011-2014. For each region, it provides data on historical and current production levels of oil and natural gas, as well as indicators of expected monthly changes for February 2016.

Recommended
Recommended
More Related Content
What's hot
What's hot (20)
Viewers also liked
Viewers also liked (13)
Similar to EIA Drilling Productivity Report Analysis
Similar to EIA Drilling Productivity Report Analysis (11)
More from Marcellus Drilling News
More from Marcellus Drilling News (20)
Recently uploaded
Recently uploaded (20)
EIA Drilling Productivity Report Analysis
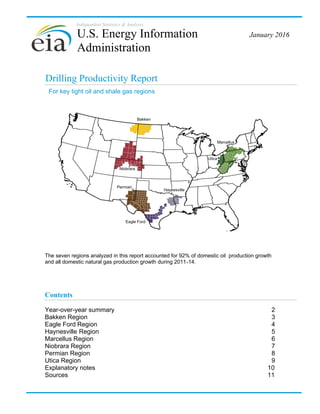
- 1. Independent Statistics & Analysis Drilling Productivity Report The seven regions analyzed in this report accounted for 92% of domestic oil production growth and all domestic natural gas production growth during 2011-14. January 2016 For key tight oil and shale gas regions U.S. Energy Information Administration Contents Year-over-year summary 2 Bakken Region 3 Eagle Ford Region 4 Haynesville Region 5 Marcellus Region 6 Niobrara Region 7 Permian Region 8 Utica Region 9 Explanatory notes 10 Sources 11 Bakken Marcellus Niobrara Haynesville Eagle Ford Permian Utica
- 2. U. S. Energy Information Administration | Drilling Productivity Report 0 400 800 1,200 1,600 2,000 2,400 2,800 Bakken Eagle Ford Haynesville Marcellus Niobrara Permian Utica February-2015 February-2016 Oil production thousand barrels/day 0 3,000 6,000 9,000 12,000 15,000 18,000 Bakken Eagle Ford Haynesville Marcellus Niobrara Permian Utica February-2015 February-2016 Natural gas production million cubic feet/day 0 250 500 750 1,000 1,250 1,500 Bakken Eagle Ford Haynesville Marcellus Niobrara Permian Utica February-2015 February-2016 New-well oil production per rig barrels/day 0 1,000 2,000 3,000 4,000 5,000 6,000 7,000 8,000 9,000 Bakken Eagle Ford Haynesville Marcellus Niobrara Permian Utica February-2015 February-2016 New-well gas production per rig thousand cubic feet/day (700) (600) (500) (400) (300) (200) (100) 0 Bakken Eagle Ford Haynesville Marcellus Niobrara Permian Utica February-2015 February-2016 Legacy gas production change million cubic feet/day (150) (125) (100) (75) (50) (25) 0 Bakken Eagle Ford Haynesville Marcellus Niobrara Permian Utica February-2015 February-2016 Legacy oil production change thousand barrels/day drilling data through December projected production through February January 2016 Drilling Productivity Report Year-over-year summary -100 -50 0 50 100 150 Bakken Eagle Ford Haynesville Marcellus Niobrara Permian Utica February-2015 February-2016 thousand barrels/day Indicated monthly change in oil production (Feb vs. Jan) -250 -200 -150 -100 -50 0 50 100 150 200 250 Bakken Eagle Ford Haynesville Marcellus Niobrara Permian Utica February-2015 February-2016 million cubic feet/day Indicated monthly change in gas production (Feb vs. Jan) 2
- 3. U. S. Energy Information Administration | Drilling Productivity Report 0 200 400 600 800 1,000 1,200 1,400 2007 2008 2009 2010 2011 2012 2013 2014 2015 2016 Oil production thousand barrels/day Bakken Region -50 0 50 100 Jan 1,122 Mbbl/d Production from new wells Legacy production change Net change Feb 1,098 Mbbl/d thousand barrels/day Bakken Region +40 -64 -24 Indicated change in oil production (Feb vs. Jan) -50 0 50 100 Jan 1,580 MMcf/d Production from new wells Legacy production change Net change Feb 1,556 MMcf/d Indicated change in natural gas production (Feb vs. Jan) million cubic feet/day Bakken Region +51 -75 -24 0 50 100 150 200 250 0 100 200 300 400 500 600 700 800 2007 2008 2009 2010 2011 2012 2013 2014 2015 2016 new-well oil production per rig rig count New-well oil production per rig barrels/day Bakken Region Rig count rigs (70) (60) (50) (40) (30) (20) (10) 0 2007 2008 2009 2010 2011 2012 2013 2014 2015 2016 Legacy oil production change thousand barrels/day Bakken Region (80) (70) (60) (50) (40) (30) (20) (10) 0 2007 2008 2009 2010 2011 2012 2013 2014 2015 2016 Legacy gas production change million cubic feet/day Bakken RegionBakken Region 0 1,000 2,000 3,000 4,000 5,000 6,000 7,000 8,000 2007 2008 2009 2010 2011 2012 2013 2014 2015 2016 Bakken Region Natural gas production million cubic feet/day 0 50 100 150 200 250 0 600 1,200 1,800 2,400 3,000 3,600 4,200 4,800 2007 2008 2009 2010 2011 2012 2013 2014 2015 2016 new-well gas production per rig rig count New-well gas production per rig thousand cubic feet/day Bakken Region Rig count rigs drilling data through December projected production through February January 2016 Drilling Productivity Report Monthly additions from one average rig February barrels/day January barrels/day month over month Oil +5 Gas thousand cubic feet/day month over month +20 Bakken Region million cubic feet/day month over month 918February thousand cubic feet/day January 898 724 719 thousand barrels/day month over month Oil -24 Gas -24 3
- 4. U. S. Energy Information Administration | Drilling Productivity Report 0 300 600 900 1,200 1,500 1,800 2007 2008 2009 2010 2011 2012 2013 2014 2015 2016 Oil production thousand barrels/day Eagle Ford Region -100 -50 0 50 100 150 Jan 1,217 Mbbl/d Production from new wells Legacy production change Net change Feb 1,145 Mbbl/d thousand barrels/day Eagle Ford Region +69 -141 -72 Indicated change in oil production (Feb vs. Jan) -200 -100 0 100 200 300 Jan 6,597 MMcf/d Production from new wells Legacy production change Net change Feb 6,457 MMcf/d Indicated change in natural gas production (Feb vs. Jan) million cubic feet/day Eagle Ford Region +236 -376 -140 0 50 100 150 200 250 300 350 0 100 200 300 400 500 600 700 800 2007 2008 2009 2010 2011 2012 2013 2014 2015 2016 new-well oil production per rig rig count New-well oil production per rig barrels/day Eagle Ford Region Rig count rigs (160) (140) (120) (100) (80) (60) (40) (20) 0 2007 2008 2009 2010 2011 2012 2013 2014 2015 2016 Legacy oil production change thousand barrels/day Eagle Ford Region (400) (350) (300) (250) (200) (150) (100) (50) 0 2007 2008 2009 2010 2011 2012 2013 2014 2015 2016 Legacy gas production change million cubic feet/day Eagle Ford RegionEagle Ford Region 0 2,000 4,000 6,000 8,000 10,000 2007 2008 2009 2010 2011 2012 2013 2014 2015 2016 Eagle Ford Region Natural gas production million cubic feet/day 0 50 100 150 200 250 300 350 0 600 1,200 1,800 2,400 3,000 3,600 4,200 4,800 2007 2008 2009 2010 2011 2012 2013 2014 2015 2016 new-well gas production per rig rig count New-well gas production per rig thousand cubic feet/day Eagle Ford Region Rig count rigs drilling data through December projected production through February January 2016 Drilling Productivity Report Monthly additions from one average rig February barrels/day January barrels/day month over month Oil +9 Gas thousand cubic feet/day month over month +49 Eagle Ford Region million cubic feet/day month over month 2,750February thousand cubic feet/day January 2,701 804 795 thousand barrels/day month over month Oil -72 Gas -140 4
- 5. U. S. Energy Information Administration | Drilling Productivity Report barrels/day 0 400 800 1,200 1,600 2,000 2007 2008 2009 2010 2011 2012 2013 2014 2015 2016 Oil production thousand barrels/day Haynesville Region -1.0 0.0 1.0 2.0 Jan 52 Mbbl/d Production from new wells Legacy production change Net change Feb 51 Mbbl/d thousand barrels/day Haynesville Region +1 -2 -1 Indicated change in oil production (Feb vs. Jan) -150 -50 50 150 250 Jan 6,210 MMcf/d Production from new wells Legacy production change Net change Feb 6,226 MMcf/d Indicated change in natural gas production (Feb vs. Jan) million cubic feet/day Haynesville Region +178 -162 +16 0 50 100 150 200 250 300 0 200 400 600 800 1,000 2007 2008 2009 2010 2011 2012 2013 2014 2015 2016 new-well oil production per rig rig count New-well oil production per rig barrels/day Haynesville Region Rig count rigs (3) (2) (1) 0 2007 2008 2009 2010 2011 2012 2013 2014 2015 2016 Legacy oil production change thousand barrels/day Haynesville Region (600) (500) (400) (300) (200) (100) 0 2007 2008 2009 2010 2011 2012 2013 2014 2015 2016 Legacy gas production change million cubic feet/day Haynesville RegionHaynesville Region 0 2,000 4,000 6,000 8,000 10,000 12,000 2007 2008 2009 2010 2011 2012 2013 2014 2015 2016 Haynesville Region Natural gas production million cubic feet/day 0 50 100 150 200 250 300 0 1,000 2,000 3,000 4,000 5,000 6,000 2007 2008 2009 2010 2011 2012 2013 2014 2015 2016 new-well gas production per rig rig count New-well gas production per rig thousand cubic feet/day Haynesville Region Rig count rigs drilling data through December projected production through February January 2016 Drilling Productivity Report Monthly additions from one average rig February January barrels/day month over month Oil 0 Gas thousand cubic feet/day month over month +75 Haynesville Region million cubic feet/day month over month 5,465February thousand cubic feet/day January 5,390 28 28 thousand barrels/day month over month Oil -1 Gas +16 5
- 6. U. S. Energy Information Administration | Drilling Productivity Report Marcellus Region 0 500 1,000 1,500 2,000 2,500 3,000 2007 2008 2009 2010 2011 2012 2013 2014 2015 2016 Oil production thousand barrels/day Marcellus Region -2.0 -1.0 0.0 1.0 2.0 3.0 4.0 Jan 50 Mbbl/d Production from new wells Legacy production change Net change Feb 48 Mbbl/d thousand barrels/day Marcellus Region +3 -5 -2 Indicated change in oil production (Feb vs. Jan) -400 -200 0 200 400 600 Jan 15,447 MMcf/d Production from new wells Legacy production change Net change Feb 15,222 MMcf/d Indicated change in natural gas production (Feb vs. Jan) million cubic feet/day Marcellus Region +384 -609 -225 0 30 60 90 120 150 0 300 600 900 1,200 1,500 2007 2008 2009 2010 2011 2012 2013 2014 2015 2016 new-well oil production per rig rig count New-well oil production per rig barrels/day Marcellus Region Rig count rigs (5) (4) (3) (2) (1) 0 2007 2008 2009 2010 2011 2012 2013 2014 2015 2016 Legacy oil production change thousand barrels/day Marcellus Region (700) (600) (500) (400) (300) (200) (100) 0 2007 2008 2009 2010 2011 2012 2013 2014 2015 2016 Legacy gas production change million cubic feet/day Marcellus RegionMarcellus Region 0 2,000 4,000 6,000 8,000 10,000 12,000 14,000 16,000 18,000 2007 2008 2009 2010 2011 2012 2013 2014 2015 2016 Marcellus Region Natural gas production million cubic feet/day 0 30 60 90 120 150 0 1,500 3,000 4,500 6,000 7,500 9,000 2007 2008 2009 2010 2011 2012 2013 2014 2015 2016 new-well gas production per rig rig count New-well gas production per rig thousand cubic feet/day Marcellus Region Rig count rigs drilling data through December projected production through February January 2016 Drilling Productivity Report Monthly additions from one average rig February barrels/day January barrels/day month over month Oil +1 Gas thousand cubic feet/day month over month +133 million cubic feet/day month over month 9,050February thousand cubic feet/day January 8,917 64 63 thousand barrels/day month over month Oil -2 Gas -225 6
- 7. U. S. Energy Information Administration | Drilling Productivity Report 0 200 400 600 800 1,000 2007 2008 2009 2010 2011 2012 2013 2014 2015 2016 Oil production thousand barrels/day Niobrara Region -30 -20 -10 0 10 20 30 Jan 394 Mbbl/d Production from new wells Legacy production change Net change Feb 371 Mbbl/d thousand barrels/day Niobrara Region +22 -45 -23 Indicated change in oil production (Feb vs. Jan) -100 -50 0 50 100 150 Jan 4,174 MMcf/d Production from new wells Legacy production change Net change Feb 4,098 MMcf/d Indicated change in natural gas production (Feb vs. Jan) million cubic feet/day Niobrara Region +68 -144 -76 0 20 40 60 80 100 120 140 0 100 200 300 400 500 600 700 800 2007 2008 2009 2010 2011 2012 2013 2014 2015 2016 new-well oil production per rig rig count New-well oil production per rig barrels/day Niobrara Region Rig count rigs (50) (40) (30) (20) (10) 0 2007 2008 2009 2010 2011 2012 2013 2014 2015 2016 Legacy oil production change thousand barrels/day Niobrara Region (180) (150) (120) (90) (60) (30) 0 2007 2008 2009 2010 2011 2012 2013 2014 2015 2016 Legacy gas production change million cubic feet/day Niobrara RegionNiobrara Region 0 1,000 2,000 3,000 4,000 5,000 6,000 2007 2008 2009 2010 2011 2012 2013 2014 2015 2016 Niobrara Region Natural gas production million cubic feet/day 0 20 40 60 80 100 120 140 0 600 1,200 1,800 2,400 3,000 3,600 4,200 4,800 2007 2008 2009 2010 2011 2012 2013 2014 2015 2016 new-well gas production per rig rig count New-well gas production per rig thousand cubic feet/day Niobrara Region Rig count rigs drilling data through December projected production through February January 2016 Drilling Productivity Report Monthly additions from one average rig February barrels/day January barrels/day month over month Oil +16 Gas thousand cubic feet/day month over month +50 Niobrara Region million cubic feet/day month over month 2,269February thousand cubic feet/day January 2,219 726 710 thousand barrels/day month over month Oil -23 Gas -76 7
- 8. U. S. Energy Information Administration | Drilling Productivity Report 0 200 400 600 800 1,000 1,200 1,400 1,600 1,800 2,000 2,200 2007 2008 2009 2010 2011 2012 2013 2014 2015 2016 Oil production thousand barrels/day Permian Region 0 25 50 75 100 Jan 2,035 Mbbl/d Production from new wells Legacy production change Net change Feb 2,040 Mbbl/d thousand barrels/day Permian Region +89 -84 +5 Indicated change in oil production (Feb vs. Jan) 0 50 100 150 200 Jan 6,913 MMcf/d Production from new wells Legacy production change Net change Feb 6,914 MMcf/d Indicated change in natural gas production (Feb vs. Jan) million cubic feet/day Permian Region +170 -169 +1 0 100 200 300 400 500 600 0 100 200 300 400 500 2007 2008 2009 2010 2011 2012 2013 2014 2015 2016 new-well oil production per rig rig count New-well oil production per rig barrels/day Permian Region Rig count rigs (90) (80) (70) (60) (50) (40) (30) (20) (10) 0 2007 2008 2009 2010 2011 2012 2013 2014 2015 2016 Legacy oil production change thousand barrels/day Permian Region (180) (160) (140) (120) (100) (80) (60) (40) (20) 0 2007 2008 2009 2010 2011 2012 2013 2014 2015 2016 Legacy gas production change million cubic feet/day Permian RegionPermian Region 0 2,000 4,000 6,000 8,000 10,000 12,000 2007 2008 2009 2010 2011 2012 2013 2014 2015 2016 Permian Region Natural gas production million cubic feet/day 0 100 200 300 400 500 600 0 500 1,000 1,500 2,000 2,500 3,000 2007 2008 2009 2010 2011 2012 2013 2014 2015 2016 new-well gas production per rig rig count New-well gas production per rig thousand cubic feet/day Permian Region Rig count rigs drilling data through December projected production through February January 2016 Drilling Productivity Report Monthly additions from one average rig February barrels/day January barrels/day month over month Oil +2 Gas thousand cubic feet/day month over month +6 Permian Region million cubic feet/day month over month 803February thousand cubic feet/day January 797 418 416 thousand barrels/day month over month Oil +5 Gas +1 8
- 9. U. S. Energy Information Administration | Drilling Productivity Report Utica Region 0 100 200 300 400 500 2007 2008 2009 2010 2011 2012 2013 2014 2015 2016 Oil production thousand barrels/day Utica Region 0.0 2.0 4.0 6.0 Jan 78 Mbbl/d Production from new wells Legacy production change Net change Feb 79 Mbbl/d thousand barrels/day Utica Region +5 -4 +1 Indicated change in oil production (Feb vs. Jan) 0 25 50 75 100 125 Jan 3,206 MMcf/d Production from new wells Legacy production change Net change Feb 3,249 MMcf/d Indicated change in natural gas production (Feb vs. Jan) million cubic feet/day Utica Region +105 -62 +43 0 5 10 15 20 25 30 35 40 45 50 0 200 400 600 800 1,000 1,200 1,400 2007 2008 2009 2010 2011 2012 2013 2014 2015 2016 new-well oil production per rig rig count New-well oil production per rig barrels/day Utica Region Rig count rigs (5) (4) (3) (2) (1) 0 2007 2008 2009 2010 2011 2012 2013 2014 2015 2016 Legacy oil production change thousand barrels/day Utica Region (70) (60) (50) (40) (30) (20) (10) 0 2007 2008 2009 2010 2011 2012 2013 2014 2015 2016 Legacy gas production change million cubic feet/day Utica RegionUtica Region 0 500 1,000 1,500 2,000 2,500 3,000 2007 2008 2009 2010 2011 2012 2013 2014 2015 2016 Utica Region Natural gas production million cubic feet/day 0 5 10 15 20 25 30 35 40 45 50 0 1,200 2,400 3,600 4,800 6,000 7,200 8,400 2007 2008 2009 2010 2011 2012 2013 2014 2015 2016 new-well gas production per rig rig count New-well gas production per rig thousand cubic feet/day Utica Region Rig count rigs drilling data through December projected production through February January 2016 Drilling Productivity Report Monthly additions from one average rig February barrels/day January barrels/day month over month Oil +12 Gas thousand cubic feet/day month over month +200 million cubic feet/day month over month 6,711February thousand cubic feet/day January 6,511 294 282 thousand barrels/day month over month Oil +1 Gas +43 9
- 10. U. S. Energy Information Administration | Drilling Productivity Report January 2016Explanatory notes Drilling Productivity Report The Drilling Productivity Report uses recent data on the total number of drilling rigs in operation along with estimates of drilling productivity and estimated changes in production from existing oil and natural gas wells to provide estimated changes in oil1 and natural gas2 production for seven key regions. EIA’s approach does not distinguish between oil-directed rigs and gas-directed rigs because once a well is completed it may produce both oil and gas; more than half of the wells do that. Monthly additions from one average rig Monthly additions from one average rig represent EIA’s estimate of an average rig’s3 contribution to production of oil and natural gas from new wells.4 The estimation of new-well production per rig uses several months of recent historical data on total production from new wells for each field divided by the region's monthly rig count, lagged by two months.5 Current- and next-month values are listed on the top header. The month-over-month change is listed alongside, with +/- signs and color-coded arrows to highlight the growth or decline in oil (brown) or natural gas (blue). New-well oil/gas production per rig Charts present historical estimated monthly additions from one average rig coupled with the number of total drilling rigs as reported by Baker Hughes. Legacy oil and natural gas production change Charts present EIA’s estimates of total oil and gas production changes from all the wells other than the new wells. The trend is dominated by the well depletion rates, but other circumstances can influence the direction of the change. For example, well freeze-offs or hurricanes can cause production to significantly decline in any given month, resulting in a production increase the next month when production simply returns to normal levels. Projected change in monthly oil/gas production Charts present the combined effects of new-well production and changes to legacy production. Total new-well production is offset by the anticipated change in legacy production to derive the net change in production. The estimated change in production does not reflect external circumstances that can affect the actual rates, such as infrastructure constraints, bad weather, or shut-ins based on environmental or economic issues. Oil/gas production Charts present all oil and natural gas production from both new and legacy wells since 2007. This production is based on all wells reported to the state oil and gas agencies. Where state data are not immediately available, EIA estimates the production based on estimated changes in new-well oil/gas production and the corresponding legacy change. Footnotes: 1. Oil production represents both crude and condensate production from all formations in the region. Production is not limited to tight formations. The regions are defined by all selected counties, which include areas outside of tight oil formations. 2. Gas production represents gross (before processing) gas production from all formations in the region. Production is not limited to shale formations. The regions are defined by all selected counties, which include areas outside of shale formations. 3. The monthly average rig count used in this report is calculated from weekly data on total oil and gas rigs reported by Baker Hughes. 4. A new well is defined as one that began producing for the first time in the previous month. Each well belongs to the new-well category for only one month. Reworked and recompleted wells are excluded from the calculation. 5. Rig count data lag production data because EIA has observed that the best predictor of the number of new wells beginning production in a given month is the count of rigs in operation two months earlier. 10
- 11. U. S. Energy Information Administration | Drilling Productivity Report January 2016Sources Drilling Productivity Report The data used in the preparation of this report come from the following sources. EIA is solely responsible for the analysis, calculations, and conclusions. Drilling Info (http://www.drillinginfo.com) Source of production, permit, and spud data for counties associated with this report. Source of real-time rig location to estimate new wells spudded and completed throughout the United States. Baker Hughes (http://www.bakerhughes.com) Source of rig and well counts by county, state, and basin. North Dakota Oil and Gas Division (https://www.dmr.nd.gov/oilgas) Source of well production, permit, and completion data in the counties associated with this report in North Dakota Railroad Commission of Texas (http://www.rrc.state.tx.us) Source of well production, permit, and completion data in the counties associated with this report in Texas Pennsylvania Department of Environmental Protection (https://www.paoilandgasreporting.state.pa.us/publicreports/Modules/Welcome/Welcome.aspx) Source of well production, permit, and completion data in the counties associated with this report in Pennsylvania West Virginia Department of Environmental Protection (http://www.dep.wv.gov/oil-and- gas/Pages/default.aspx) Source of well production, permit, and completion data in the counties associated with this report in West Virginia Colorado Oil and Gas Conservation Commission (http://cogcc.state.co.us) Source of well production, permit, and completion data in the counties associated with this report in Colorado Wyoming Oil and Conservation Commission (http://wogcc.state.wy.us) Source of well production, permit, and completion data in the counties associated with this report in Wyoming Louisiana Department of Natural Resources (http://dnr.louisiana.gov) Source of well production, permit, and completion data in the counties associated with this report in Louisiana Ohio Department of Natural Resources (http://oilandgas.ohiodnr.gov) Source of well production, permit, and completion data in the counties associated with this report in Ohio 11