SlideShare a Scribd company logo
1 of 10
Download to read offline
Independent Statistics & Analysis
Drilling Productivity Report
The six regions analyzed in this report accounted for 95% of domestic oil production growth and
all domestic natural gas production growth during 2011-13.
June 2014
For key tight oil and shale gas regions
U.S. Energy Information
Administration
Contents
Year-over-year summary 2
Bakken 3
Eagle Ford 4
Haynesville 5
Marcellus 6
Niobrara 7
Permian 8
Explanatory notes 9
Sources 10
Bakken
Marcellus
Niobrara
Haynesville
Eagle Ford
Permian
U. S. Energy Information Administration | Drilling Productivity Report
0
400
800
1,200
1,600
2,000
2,400
Bakken Eagle Ford Haynesville Marcellus Niobrara Permian
July-2013 July-2014
Oil production
thousand barrels/day
0
2,000
4,000
6,000
8,000
10,000
12,000
14,000
16,000
Bakken Eagle Ford Haynesville Marcellus Niobrara Permian
July-2013 July-2014
Natural gas production
million cubic feet/day
0
250
500
750
1,000
1,250
Bakken Eagle Ford Haynesville Marcellus Niobrara Permian
July-2013 July-2014
New-well oil production per rig
barrels/day
0
1,000
2,000
3,000
4,000
5,000
6,000
7,000
Bakken Eagle Ford Haynesville Marcellus Niobrara Permian
July-2013 July-2014
New-well gas production per rig
thousand cubic feet/day
(700)
(600)
(500)
(400)
(300)
(200)
(100)
0
Bakken Eagle Ford Haynesville Marcellus Niobrara Permian
July-2013 July-2014
Legacy gas production change
million cubic feet/day
(125)
(100)
(75)
(50)
(25)
0
Bakken Eagle Ford Haynesville Marcellus Niobrara Permian
July-2013 July-2014
Legacy oil production change
thousand barrels/day
drilling data through May projected
production through July
June 2014
Drilling Productivity Report
Year-over-year summary
-10
0
10
20
30
40
50
60
Bakken Eagle Ford Haynesville Marcellus Niobrara Permian
July-2013 July-2014
thousand barrels/day
Indicated monthly change in oil production (Jul vs. Jun)
-300
-200
-100
0
100
200
300
400
500
Bakken Eagle Ford Haynesville Marcellus Niobrara Permian
July-2013 July-2014
million cubic feet/day
Indicated monthly change in gas production (Jul vs. Jun)
2
U. S. Energy Information Administration | Drilling Productivity Report
0
200
400
600
800
1,000
1,200
2007 2008 2009 2010 2011 2012 2013 2014
Oil production
thousand barrels/day
Bakken
0
50
100
Jun
1,074
Mbbl/d
Production
from
new wells
Legacy
production
change
Net
change
Jul
1,094
Mbbl/d
thousand barrels/day
Bakken
+92 -72 +20
Indicated change in oil production (Jul vs. Jun)
0
50
100
Jun
1,262
MMcf/d
Production
from
new wells
Legacy
production
change
Net
change
Jul
1,285
MMcf/d
Indicated change in natural gas production (Jul vs. Jun)
million cubic feet/day
Bakken
+93 -70 +23
0
50
100
150
200
250
0
100
200
300
400
500
600
2007 2008 2009 2010 2011 2012 2013 2014
new-well oil production per rig
rig count
New-well oil production per rig
barrels/day
Bakken
Rig count
rigs
(80)
(70)
(60)
(50)
(40)
(30)
(20)
(10)
0
2007 2008 2009 2010 2011 2012 2013 2014
Legacy oil production change
thousand barrels/day
Bakken
(80)
(70)
(60)
(50)
(40)
(30)
(20)
(10)
0
2007 2008 2009 2010 2011 2012 2013 2014
Legacy gas production change
million cubic feet/day
BakkenBakken
0
1,000
2,000
3,000
4,000
5,000
6,000
7,000
2007 2008 2009 2010 2011 2012 2013 2014
Bakken
Natural gas production
million cubic feet/day
0
50
100
150
200
250
0
600
1,200
1,800
2,400
3,000
3,600
2007 2008 2009 2010 2011 2012 2013 2014
new-well gas production per rig
rig count
New-well gas production per rig
thousand cubic feet/day
Bakken
Rig count
rigs
drilling data through May projected
production through July
June 2014
Drilling Productivity Report
Monthly
additions
from one
average rig
July
barrels/day
June
barrels/day
month over month
Oil
+5
Gas
thousand cubic feet/day
month over month
+6
Bakken
million cubic feet/day
month over month
518July
thousand cubic feet/day
June 512
510
505
thousand barrels/day
month over month
Oil +20 Gas +23
3
U. S. Energy Information Administration | Drilling Productivity Report
0
200
400
600
800
1,000
1,200
1,400
1,600
2007 2008 2009 2010 2011 2012 2013 2014
Oil production
thousand barrels/day
Eagle Ford
0
50
100
150
Jun
1,405
Mbbl/d
Production
from
new wells
Legacy
production
change
Net
change
Jul
1,429
Mbbl/d
thousand barrels/day
Eagle Ford
+138 -114 +24
Indicated change in oil production (Jul vs. Jun)
0
100
200
300
400
Jun
7,023
MMcf/d
Production
from
new wells
Legacy
production
change
Net
change
Jul
7,126
MMcf/d
Indicated change in natural gas production (Jul vs. Jun)
million cubic feet/day
Eagle Ford
+371 -268 +103
0
50
100
150
200
250
300
350
0
100
200
300
400
500
600
2007 2008 2009 2010 2011 2012 2013 2014
new-well oil production per rig
rig count
New-well oil production per rig
barrels/day
Eagle Ford
Rig count
rigs
(120)
(100)
(80)
(60)
(40)
(20)
0
2007 2008 2009 2010 2011 2012 2013 2014
Legacy oil production change
thousand barrels/day
Eagle Ford
(300)
(250)
(200)
(150)
(100)
(50)
0
2007 2008 2009 2010 2011 2012 2013 2014
Legacy gas production change
million cubic feet/day
Eagle FordEagle Ford
0
1,000
2,000
3,000
4,000
5,000
6,000
7,000
2007 2008 2009 2010 2011 2012 2013 2014
Eagle Ford
Natural gas production
million cubic feet/day
0
50
100
150
200
250
300
350
0
600
1,200
1,800
2,400
3,000
3,600
2007 2008 2009 2010 2011 2012 2013 2014
new-well gas production per rig
rig count
New-well gas production per rig
thousand cubic feet/day
Eagle Ford
Rig count
rigs
drilling data through May projected
production through July
June 2014
Drilling Productivity Report
Monthly
additions
from one
average rig
July
barrels/day
June
barrels/day
month over month
Oil
+5
Gas
thousand cubic feet/day
month over month
+6
Eagle Ford
million cubic feet/day
month over month
1,294July
thousand cubic feet/day
June 1,288
479
474
thousand barrels/day
month over month
Oil +24 Gas +103
4
U. S. Energy Information Administration | Drilling Productivity Report
barrels/day
0
400
800
1,200
1,600
2,000
2007 2008 2009 2010 2011 2012 2013 2014
Oil production
thousand barrels/day
Haynesville
0.0
1.0
2.0
3.0
Jun
54
Mbbl/d
Production
from
new wells
Legacy
production
change
Net
change
Jul
54
Mbbl/d
thousand barrels/day
Haynesville
+1 -1 +0
Indicated change in oil production (Jul vs. Jun)
-150
-50
50
150
250
350
Jun
6,871
MMcf/d
Production
from
new wells
Legacy
production
change
Net
change
Jul
6,890
MMcf/d
Indicated change in natural gas production (Jul vs. Jun)
million cubic feet/day
Haynesville
+281 -262 +19
0
50
100
150
200
250
300
0
200
400
600
800
1,000
2007 2008 2009 2010 2011 2012 2013 2014
new-well oil production per rig
rig count
New-well oil production per rig
barrels/day
Haynesville
Rig count
rigs
(3)
(2)
(1)
0
2007 2008 2009 2010 2011 2012 2013 2014
Legacy oil production change
thousand barrels/day
Haynesville
(600)
(500)
(400)
(300)
(200)
(100)
0
2007 2008 2009 2010 2011 2012 2013 2014
Legacy gas production change
million cubic feet/day
HaynesvilleHaynesville
0
2,000
4,000
6,000
8,000
10,000
12,000
2007 2008 2009 2010 2011 2012 2013 2014
Haynesville
Natural gas production
million cubic feet/day
0
50
100
150
200
250
300
0
1,000
2,000
3,000
4,000
5,000
6,000
2007 2008 2009 2010 2011 2012 2013 2014
new-well gas production per rig
rig count
New-well gas production per rig
thousand cubic feet/day
Haynesville
Rig count
rigs
drilling data through May projected
production through July
June 2014
Drilling Productivity Report
Monthly
additions
from one
average rig
July
June
barrels/day
month over month
Oil
0
Gas
thousand cubic feet/day
month over month
+96
Haynesville
million cubic feet/day
month over month
5,411July
thousand cubic feet/day
June 5,315
23
23
thousand barrels/day
month over month
Oil +0 Gas +19
5
U. S. Energy Information Administration | Drilling Productivity Report
Marcellus
0
400
800
1,200
1,600
2,000
2007 2008 2009 2010 2011 2012 2013 2014
Oil production
thousand barrels/day
Marcellus
0.0
1.0
2.0
3.0
4.0
Jun
42
Mbbl/d
Production
from
new wells
Legacy
production
change
Net
change
Jul
43
Mbbl/d
thousand barrels/day
Marcellus
+3 -2 +1
Indicated change in oil production (Jul vs. Jun)
0
200
400
600
Jun
14,695
MMcf/d
Production
from
new wells
Legacy
production
change
Net
change
Jul
14,975
MMcf/d
Indicated change in natural gas production (Jul vs. Jun)
million cubic feet/day
Marcellus
+663 -383 +280
0
20
40
60
80
100
120
140
160
0
200
400
600
800
1,000
1,200
2007 2008 2009 2010 2011 2012 2013 2014
new-well oil production per rig
rig count
New-well oil production per rig
barrels/day
Marcellus
Rig count
rigs
(3)
(2)
(1)
0
2007 2008 2009 2010 2011 2012 2013 2014
Legacy oil production change
thousand barrels/day
Marcellus
(500)
(400)
(300)
(200)
(100)
0
2007 2008 2009 2010 2011 2012 2013 2014
Legacy gas production change
million cubic feet/day
MarcellusMarcellus
0
2,000
4,000
6,000
8,000
10,000
12,000
14,000
16,000
2007 2008 2009 2010 2011 2012 2013 2014
Marcellus
Natural gas production
million cubic feet/day
0
20
40
60
80
100
120
140
160
0
1,200
2,400
3,600
4,800
6,000
7,200
2007 2008 2009 2010 2011 2012 2013 2014
new-well gas production per rig
rig count
New-well gas production per rig
thousand cubic feet/day
Marcellus
Rig count
rigs
drilling data through May projected
production through July
June 2014
Drilling Productivity Report
Monthly
additions
from one
average rig
July
barrels/day
June
barrels/day
month over month
Oil
0
Gas
thousandcubic feet/day
month over month
+38
million cubic feet/day
month over month
6,555July
thousand cubic feet/day
June 6,517
30
30
thousand barrels/day
month over month
Oil +1 Gas +280
6
U. S. Energy Information Administration | Drilling Productivity Report
0
200
400
600
800
1,000
2007 2008 2009 2010 2011 2012 2013 2014
Oil production
thousand barrels/day
Niobrara
0
10
20
30
40
Jun
318
Mbbl/d
Production
from
new wells
Legacy
production
change
Net
change
Jul
321
Mbbl/d
thousand barrels/day
Niobrara
+35 -32 +3
Indicated change in oil production (Jul vs. Jun)
0
50
100
150
200
Jun
4,422
MMcf/d
Production
from
new wells
Legacy
production
change
Net
change
Jul
4,441
MMcf/d
Indicated change in natural gas production (Jul vs. Jun)
million cubic feet/day
Niobrara
+152 -133 +19
0
20
40
60
80
100
120
140
0
100
200
300
400
500
600
2007 2008 2009 2010 2011 2012 2013 2014
new-well oil production per rig
rig count
New-well oil production per rig
barrels/day
Niobrara
Rig count
rigs
(35)
(30)
(25)
(20)
(15)
(10)
(5)
0
2007 2008 2009 2010 2011 2012 2013 2014
Legacy oil production change
thousand barrels/day
Niobrara
(160)
(140)
(120)
(100)
(80)
(60)
(40)
(20)
0
2007 2008 2009 2010 2011 2012 2013 2014
Legacy gas production change
million cubic feet/day
NiobraraNiobrara
0
1,000
2,000
3,000
4,000
5,000
6,000
2007 2008 2009 2010 2011 2012 2013 2014
Niobrara
Natural gas production
million cubic feet/day
0
20
40
60
80
100
120
140
0
600
1,200
1,800
2,400
3,000
3,600
2007 2008 2009 2010 2011 2012 2013 2014
new-well gas production per rig
rig count
New-well gas production per rig
thousand cubic feet/day
Niobrara
Rig count
rigs
drilling data through May projected
production through July
June 2014
Drilling Productivity Report
Monthly
additions
from one
average rig
July
barrels/day
June
barrels/day
month over month
Oil
+8
Gas
thousand cubic feet/day
month over month
+27
Niobrara
million cubic feet/day
month over month
1,621July
thousand cubic feet/day
June 1,594
370
362
thousand barrels/day
month over month
Oil +3 Gas +19
7
U. S. Energy Information Administration | Drilling Productivity Report
0
200
400
600
800
1,000
1,200
1,400
1,600
1,800
2007 2008 2009 2010 2011 2012 2013 2014
Oil production
thousand barrels/day
Permian
0
20
40
60
80
Jun
1,543
Mbbl/d
Production
from
new wells
Legacy
production
change
Net
change
Jul
1,566
Mbbl/d
thousand barrels/day
Permian
+73 -50 +23
Indicated change in oil production (Jul vs. Jun)
0
30
60
90
120
150
180
Jun
5,568
MMcf/d
Production
from
new wells
Legacy
production
change
Net
change
Jul
5,623
MMcf/d
Indicated change in natural gas production (Jul vs. Jun)
million cubic feet/day
Permian
+162 -107 +55
0
100
200
300
400
500
600
0
100
200
300
400
500
600
2007 2008 2009 2010 2011 2012 2013 2014
new-well oil production per rig
rig count
New-well oil production per rig
barrels/day
Permian
Rig count
rigs
(60)
(50)
(40)
(30)
(20)
(10)
0
2007 2008 2009 2010 2011 2012 2013 2014
Legacy oil production change
thousand barrels/day
Permian
(140)
(120)
(100)
(80)
(60)
(40)
(20)
0
2007 2008 2009 2010 2011 2012 2013 2014
Legacy gas production change
million cubic feet/day
PermianPermian
0
1,000
2,000
3,000
4,000
5,000
6,000
7,000
8,000
2007 2008 2009 2010 2011 2012 2013 2014
Permian
Natural gas production
million cubic feet/day
0
100
200
300
400
500
600
0
600
1,200
1,800
2,400
3,000
3,600
2007 2008 2009 2010 2011 2012 2013 2014
new-well gas production per rig
rig count
New-well gas production per rig
thousand cubic feet/day
Permian
Rig count
rigs
drilling data through May projected
production through July
June 2014
Drilling Productivity Report
Monthly
additions
from one
average rig
July
barrels/day
June
barrels/day
month over month
Oil
+2
Gas
thousand cubic feet/day
month over month
+3
Permian
million cubic feet/day
month over month
298July
thousand cubic feet/day
June 295
134
132
thousand barrels/day
month over month
Oil +23 Gas +55
8
U. S. Energy Information Administration | Drilling Productivity Report
June 2014Explanatory notes
Drilling Productivity Report
The Drilling Productivity Report uses recent data on the total number of drilling rigs in operation along
with estimates of drilling productivity and estimated changes in production from existing oil and natural
gas wells to provide estimated changes in oil1 and natural gas2 production for six key regions. EIA’s
approach does not distinguish between oil-directed rigs and gas-directed rigs because once a well is
completed it may produce both oil and gas; more than half of the wells do that.
Monthly additions from one average rig
Monthly additions from one average rig represent EIA’s estimate of an average rig’s3 contribution to
production of oil and natural gas from new wells.4 The estimation of new-well production per rig uses
several months of recent historical data on total production from new wells for each field divided by the
region's monthly rig count, lagged by two months.5 Current- and next-month values are listed on the top
header. The month-over-month change is listed alongside, with +/- signs and color-coded arrows to
highlight the growth or decline in oil (brown) or natural gas (blue).
New-well oil/gas production per rig
Charts present historical estimated monthly additions from one average rig coupled with the number of
total drilling rigs as reported by Baker Hughes.
Legacy oil and natural gas production change
Charts present EIA’s estimates of total oil and gas production changes from all the wells other than the
new wells. The trend is dominated by the well depletion rates, but other circumstances can influence the
direction of the change. For example, well freeze-offs or hurricanes can cause production to significantly
decline in any given month, resulting in a production increase the next month when production simply
returns to normal levels.
Projected change in monthly oil/gas production
Charts present the combined effects of new-well production and changes to legacy production. Total
new-well production is offset by the anticipated change in legacy production to derive the net change in
production. The estimated change in production does not reflect external circumstances that can affect
the actual rates, such as infrastructure constraints, bad weather, or shut-ins based on environmental or
economic issues.
Oil/gas production
Charts present all oil and natural gas production from both new and legacy wells since 2007. This
production is based on all wells reported to the state oil and gas agencies. Where state data are not
immediately available, EIA estimates the production based on estimated changes in new-well oil/gas
production and the corresponding legacy change.
Footnotes:
1. Oil production represents both crude and condensate production from all formations in the region. Production is
not limited to tight formations. The regions are defined by all selected counties, which include areas outside of
tight oil formations.
2. Gas production represents gross (before processing) gas production from all formations in the region.
Production is not limited to shale formations. The regions are defined by all selected counties, which include
areas outside of shale formations.
3. The monthly average rig count used in this report is calculated from weekly data on total oil and gas rigs
reported by Baker Hughes.
4. A new well is defined as one that began producing for the first time in the previous month. Each well belongs to
the new-well category for only one month. Reworked and recompleted wells are excluded from the calculation.
5. Rig count data lag production data because EIA has observed that the best predictor of the number of new
wells beginning production in a given month is the count of rigs in operation two months earlier. 9
U. S. Energy Information Administration | Drilling Productivity Report
June 2014Sources
Drilling Productivity Report
The data used in the preparation of this report come from the following sources. EIA is solely
responsible for the analysis, calculations, and conclusions.
Drilling Info (http://www.drillinginfo.com) Source of production, permit, and spud data for counties
associated with this report. Source of real-time rig location to estimate new wells spudded and completed
throughout the United States.
Baker Hughes (http://www.bakerhughes.com) Source of rig and well counts by county, state, and basin.
North Dakota Oil and Gas Division (https://www.dmr.nd.gov/oilgas) Source of well production, permit,
and completion data in the counties associated with this report in North Dakota
Railroad Commission of Texas (http://www.rrc.state.tx.us) Source of well production, permit, and
completion data in the counties associated with this report in Texas
Pennsylvania Department of Environmental Protection
(https://www.paoilandgasreporting.state.pa.us/publicreports/Modules/Welcome/Welcome.aspx) Source
of well production, permit, and completion data in the counties associated with this report in
Pennsylvania
West Virginia Department of Environmental Protection (http://www.dep.wv.gov/oil-and-
gas/Pages/default.aspx) Source of well production, permit, and completion data in the counties
associated with this report in West Virginia
Colorado Oil and Gas Conservation Commission (http://cogcc.state.co.us) Source of well production,
permit, and completion data in the counties associated with this report in Colorado
Wyoming Oil and Conservation Commission (http://wogcc.state.wy.us ) Source of well production,
permit, and completion data in the counties associated with this report in Wyoming
Louisiana Department of Natural Resources (http://dnr.louisiana.gov) Source of well production,
permit, and completion data in the counties associated with this report in Louisiana
10

More Related Content

What's hot

U.S. EIA's Drilling Productivity Report - May 2016
U.S. EIA's Drilling Productivity Report - May 2016U.S. EIA's Drilling Productivity Report - May 2016
U.S. EIA's Drilling Productivity Report - May 2016Marcellus Drilling News
 
EIA Drilling Productivity Report - Dec 2014
EIA Drilling Productivity Report - Dec 2014EIA Drilling Productivity Report - Dec 2014
EIA Drilling Productivity Report - Dec 2014Marcellus Drilling News
 
U.S. EIA's Drilling Productivity Report - June 2016
U.S. EIA's Drilling Productivity Report - June 2016U.S. EIA's Drilling Productivity Report - June 2016
U.S. EIA's Drilling Productivity Report - June 2016Marcellus Drilling News
 
EIA Drilling Productivity Report - January 2015
EIA Drilling Productivity Report - January 2015EIA Drilling Productivity Report - January 2015
EIA Drilling Productivity Report - January 2015Marcellus Drilling News
 
U.S. EIA's Drilling Productivity Report - July 2016
U.S. EIA's Drilling Productivity Report - July 2016U.S. EIA's Drilling Productivity Report - July 2016
U.S. EIA's Drilling Productivity Report - July 2016Marcellus Drilling News
 
EIA Drilling Productivity Report - October 2014
EIA Drilling Productivity Report - October 2014EIA Drilling Productivity Report - October 2014
EIA Drilling Productivity Report - October 2014Marcellus Drilling News
 
U.S. EIA's Drilling Productivity Report - August 2016
U.S. EIA's Drilling Productivity Report - August 2016U.S. EIA's Drilling Productivity Report - August 2016
U.S. EIA's Drilling Productivity Report - August 2016Marcellus Drilling News
 
US EIA Drilling Productivity Report - April 2015
US EIA Drilling Productivity Report - April 2015US EIA Drilling Productivity Report - April 2015
US EIA Drilling Productivity Report - April 2015Marcellus Drilling News
 
U.S. EIA's Drilling Productivity Report - August 2015
U.S. EIA's Drilling Productivity Report - August 2015U.S. EIA's Drilling Productivity Report - August 2015
U.S. EIA's Drilling Productivity Report - August 2015Marcellus Drilling News
 
U.S. EIA's Drilling Productivity Report - April 2016
U.S. EIA's Drilling Productivity Report - April 2016U.S. EIA's Drilling Productivity Report - April 2016
U.S. EIA's Drilling Productivity Report - April 2016Marcellus Drilling News
 
U.S. EIA's Drilling Productivity Report - December 2015
U.S. EIA's Drilling Productivity Report - December 2015U.S. EIA's Drilling Productivity Report - December 2015
U.S. EIA's Drilling Productivity Report - December 2015Marcellus Drilling News
 
U.S. EIA's Drilling Productivity Report - September 2015
U.S. EIA's Drilling Productivity Report - September 2015U.S. EIA's Drilling Productivity Report - September 2015
U.S. EIA's Drilling Productivity Report - September 2015Marcellus Drilling News
 
U.S. EIA's Drilling Productivity Report - September 2016
U.S. EIA's Drilling Productivity Report - September 2016U.S. EIA's Drilling Productivity Report - September 2016
U.S. EIA's Drilling Productivity Report - September 2016Marcellus Drilling News
 
U.S. EIA's Drilling Productivity Report - January 2016
U.S. EIA's Drilling Productivity Report - January 2016U.S. EIA's Drilling Productivity Report - January 2016
U.S. EIA's Drilling Productivity Report - January 2016Marcellus Drilling News
 
U.S. EIA's Drilling Productivity Report - February 2016
U.S. EIA's Drilling Productivity Report - February 2016U.S. EIA's Drilling Productivity Report - February 2016
U.S. EIA's Drilling Productivity Report - February 2016Marcellus Drilling News
 
U.S. EIA's Drilling Productivity Report - October 2015
U.S. EIA's Drilling Productivity Report - October 2015U.S. EIA's Drilling Productivity Report - October 2015
U.S. EIA's Drilling Productivity Report - October 2015Marcellus Drilling News
 
EIA Drilling Productivity Report - November 2014
EIA Drilling Productivity Report - November 2014EIA Drilling Productivity Report - November 2014
EIA Drilling Productivity Report - November 2014Marcellus Drilling News
 
EIA Drilling Productivity Report - February 2015
EIA Drilling Productivity Report - February 2015EIA Drilling Productivity Report - February 2015
EIA Drilling Productivity Report - February 2015Marcellus Drilling News
 

What's hot (18)

U.S. EIA's Drilling Productivity Report - May 2016
U.S. EIA's Drilling Productivity Report - May 2016U.S. EIA's Drilling Productivity Report - May 2016
U.S. EIA's Drilling Productivity Report - May 2016
 
EIA Drilling Productivity Report - Dec 2014
EIA Drilling Productivity Report - Dec 2014EIA Drilling Productivity Report - Dec 2014
EIA Drilling Productivity Report - Dec 2014
 
U.S. EIA's Drilling Productivity Report - June 2016
U.S. EIA's Drilling Productivity Report - June 2016U.S. EIA's Drilling Productivity Report - June 2016
U.S. EIA's Drilling Productivity Report - June 2016
 
EIA Drilling Productivity Report - January 2015
EIA Drilling Productivity Report - January 2015EIA Drilling Productivity Report - January 2015
EIA Drilling Productivity Report - January 2015
 
U.S. EIA's Drilling Productivity Report - July 2016
U.S. EIA's Drilling Productivity Report - July 2016U.S. EIA's Drilling Productivity Report - July 2016
U.S. EIA's Drilling Productivity Report - July 2016
 
EIA Drilling Productivity Report - October 2014
EIA Drilling Productivity Report - October 2014EIA Drilling Productivity Report - October 2014
EIA Drilling Productivity Report - October 2014
 
U.S. EIA's Drilling Productivity Report - August 2016
U.S. EIA's Drilling Productivity Report - August 2016U.S. EIA's Drilling Productivity Report - August 2016
U.S. EIA's Drilling Productivity Report - August 2016
 
US EIA Drilling Productivity Report - April 2015
US EIA Drilling Productivity Report - April 2015US EIA Drilling Productivity Report - April 2015
US EIA Drilling Productivity Report - April 2015
 
U.S. EIA's Drilling Productivity Report - August 2015
U.S. EIA's Drilling Productivity Report - August 2015U.S. EIA's Drilling Productivity Report - August 2015
U.S. EIA's Drilling Productivity Report - August 2015
 
U.S. EIA's Drilling Productivity Report - April 2016
U.S. EIA's Drilling Productivity Report - April 2016U.S. EIA's Drilling Productivity Report - April 2016
U.S. EIA's Drilling Productivity Report - April 2016
 
U.S. EIA's Drilling Productivity Report - December 2015
U.S. EIA's Drilling Productivity Report - December 2015U.S. EIA's Drilling Productivity Report - December 2015
U.S. EIA's Drilling Productivity Report - December 2015
 
U.S. EIA's Drilling Productivity Report - September 2015
U.S. EIA's Drilling Productivity Report - September 2015U.S. EIA's Drilling Productivity Report - September 2015
U.S. EIA's Drilling Productivity Report - September 2015
 
U.S. EIA's Drilling Productivity Report - September 2016
U.S. EIA's Drilling Productivity Report - September 2016U.S. EIA's Drilling Productivity Report - September 2016
U.S. EIA's Drilling Productivity Report - September 2016
 
U.S. EIA's Drilling Productivity Report - January 2016
U.S. EIA's Drilling Productivity Report - January 2016U.S. EIA's Drilling Productivity Report - January 2016
U.S. EIA's Drilling Productivity Report - January 2016
 
U.S. EIA's Drilling Productivity Report - February 2016
U.S. EIA's Drilling Productivity Report - February 2016U.S. EIA's Drilling Productivity Report - February 2016
U.S. EIA's Drilling Productivity Report - February 2016
 
U.S. EIA's Drilling Productivity Report - October 2015
U.S. EIA's Drilling Productivity Report - October 2015U.S. EIA's Drilling Productivity Report - October 2015
U.S. EIA's Drilling Productivity Report - October 2015
 
EIA Drilling Productivity Report - November 2014
EIA Drilling Productivity Report - November 2014EIA Drilling Productivity Report - November 2014
EIA Drilling Productivity Report - November 2014
 
EIA Drilling Productivity Report - February 2015
EIA Drilling Productivity Report - February 2015EIA Drilling Productivity Report - February 2015
EIA Drilling Productivity Report - February 2015
 

Viewers also liked

List of Economic Development Projects in Eastern Ohio Related to Utica Shale
List of Economic Development Projects in Eastern Ohio Related to Utica ShaleList of Economic Development Projects in Eastern Ohio Related to Utica Shale
List of Economic Development Projects in Eastern Ohio Related to Utica ShaleMarcellus Drilling News
 
Letter from Radical Environmental Groups to NY Gov. Andrew Cuomo Asking Him t...
Letter from Radical Environmental Groups to NY Gov. Andrew Cuomo Asking Him t...Letter from Radical Environmental Groups to NY Gov. Andrew Cuomo Asking Him t...
Letter from Radical Environmental Groups to NY Gov. Andrew Cuomo Asking Him t...Marcellus Drilling News
 
Chesapeake Investor Presentation for the Howard Weil Annual Energy Conference
Chesapeake Investor Presentation for the Howard Weil Annual Energy ConferenceChesapeake Investor Presentation for the Howard Weil Annual Energy Conference
Chesapeake Investor Presentation for the Howard Weil Annual Energy ConferenceMarcellus Drilling News
 
EIA Research into Economic Effects of Exporting LNG
EIA Research into Economic Effects of Exporting LNGEIA Research into Economic Effects of Exporting LNG
EIA Research into Economic Effects of Exporting LNGMarcellus Drilling News
 
University of Michigan Poll of NY & PA on Fracking
University of Michigan Poll of NY & PA on FrackingUniversity of Michigan Poll of NY & PA on Fracking
University of Michigan Poll of NY & PA on FrackingMarcellus Drilling News
 
Marcellus and Utica Shale Databook 2014 – Sample Pages for Vol. 1
Marcellus and Utica Shale Databook 2014 – Sample Pages for Vol. 1Marcellus and Utica Shale Databook 2014 – Sample Pages for Vol. 1
Marcellus and Utica Shale Databook 2014 – Sample Pages for Vol. 1Marcellus Drilling News
 
Letter from Dr. Larry Cathles to Gov. Andrew Cuomo Urging End to Moratorium o...
Letter from Dr. Larry Cathles to Gov. Andrew Cuomo Urging End to Moratorium o...Letter from Dr. Larry Cathles to Gov. Andrew Cuomo Urging End to Moratorium o...
Letter from Dr. Larry Cathles to Gov. Andrew Cuomo Urging End to Moratorium o...Marcellus Drilling News
 
Commonwealth Act 13 Final Ruling on 4 Provisions - July 2014
Commonwealth Act 13 Final Ruling on 4 Provisions - July 2014Commonwealth Act 13 Final Ruling on 4 Provisions - July 2014
Commonwealth Act 13 Final Ruling on 4 Provisions - July 2014Marcellus Drilling News
 
Final Determination of PA Office of Open Records Granting Access to Half-Bake...
Final Determination of PA Office of Open Records Granting Access to Half-Bake...Final Determination of PA Office of Open Records Granting Access to Half-Bake...
Final Determination of PA Office of Open Records Granting Access to Half-Bake...Marcellus Drilling News
 
Marist College Poll on Hydrofracking in New York State
Marist College Poll on Hydrofracking in New York StateMarist College Poll on Hydrofracking in New York State
Marist College Poll on Hydrofracking in New York StateMarcellus Drilling News
 
Magnum Hunter Resources Investor Presentation - July 2014
Magnum Hunter Resources Investor Presentation - July 2014Magnum Hunter Resources Investor Presentation - July 2014
Magnum Hunter Resources Investor Presentation - July 2014Marcellus Drilling News
 
Lease Transfer Document between SWEPI and American Energy - Utica for Guernse...
Lease Transfer Document between SWEPI and American Energy - Utica for Guernse...Lease Transfer Document between SWEPI and American Energy - Utica for Guernse...
Lease Transfer Document between SWEPI and American Energy - Utica for Guernse...Marcellus Drilling News
 
GAO Report: EPA Oversight of Injection Wells
GAO Report: EPA Oversight of Injection WellsGAO Report: EPA Oversight of Injection Wells
GAO Report: EPA Oversight of Injection WellsMarcellus Drilling News
 
Maryland Risk Assessment of Shale Drilling & Fracking
Maryland Risk Assessment of Shale Drilling & FrackingMaryland Risk Assessment of Shale Drilling & Fracking
Maryland Risk Assessment of Shale Drilling & FrackingMarcellus Drilling News
 
Confessions of a Frac Engineer - Mike Vincent
Confessions of a Frac Engineer - Mike VincentConfessions of a Frac Engineer - Mike Vincent
Confessions of a Frac Engineer - Mike VincentMarcellus Drilling News
 

Viewers also liked (16)

List of Economic Development Projects in Eastern Ohio Related to Utica Shale
List of Economic Development Projects in Eastern Ohio Related to Utica ShaleList of Economic Development Projects in Eastern Ohio Related to Utica Shale
List of Economic Development Projects in Eastern Ohio Related to Utica Shale
 
Letter from Radical Environmental Groups to NY Gov. Andrew Cuomo Asking Him t...
Letter from Radical Environmental Groups to NY Gov. Andrew Cuomo Asking Him t...Letter from Radical Environmental Groups to NY Gov. Andrew Cuomo Asking Him t...
Letter from Radical Environmental Groups to NY Gov. Andrew Cuomo Asking Him t...
 
Chesapeake Investor Presentation for the Howard Weil Annual Energy Conference
Chesapeake Investor Presentation for the Howard Weil Annual Energy ConferenceChesapeake Investor Presentation for the Howard Weil Annual Energy Conference
Chesapeake Investor Presentation for the Howard Weil Annual Energy Conference
 
EIA Research into Economic Effects of Exporting LNG
EIA Research into Economic Effects of Exporting LNGEIA Research into Economic Effects of Exporting LNG
EIA Research into Economic Effects of Exporting LNG
 
University of Michigan Poll of NY & PA on Fracking
University of Michigan Poll of NY & PA on FrackingUniversity of Michigan Poll of NY & PA on Fracking
University of Michigan Poll of NY & PA on Fracking
 
Marcellus and Utica Shale Databook 2014 – Sample Pages for Vol. 1
Marcellus and Utica Shale Databook 2014 – Sample Pages for Vol. 1Marcellus and Utica Shale Databook 2014 – Sample Pages for Vol. 1
Marcellus and Utica Shale Databook 2014 – Sample Pages for Vol. 1
 
Letter from Dr. Larry Cathles to Gov. Andrew Cuomo Urging End to Moratorium o...
Letter from Dr. Larry Cathles to Gov. Andrew Cuomo Urging End to Moratorium o...Letter from Dr. Larry Cathles to Gov. Andrew Cuomo Urging End to Moratorium o...
Letter from Dr. Larry Cathles to Gov. Andrew Cuomo Urging End to Moratorium o...
 
Commonwealth Act 13 Final Ruling on 4 Provisions - July 2014
Commonwealth Act 13 Final Ruling on 4 Provisions - July 2014Commonwealth Act 13 Final Ruling on 4 Provisions - July 2014
Commonwealth Act 13 Final Ruling on 4 Provisions - July 2014
 
Final Determination of PA Office of Open Records Granting Access to Half-Bake...
Final Determination of PA Office of Open Records Granting Access to Half-Bake...Final Determination of PA Office of Open Records Granting Access to Half-Bake...
Final Determination of PA Office of Open Records Granting Access to Half-Bake...
 
Marist College Poll on Hydrofracking in New York State
Marist College Poll on Hydrofracking in New York StateMarist College Poll on Hydrofracking in New York State
Marist College Poll on Hydrofracking in New York State
 
Magnum Hunter Resources Investor Presentation - July 2014
Magnum Hunter Resources Investor Presentation - July 2014Magnum Hunter Resources Investor Presentation - July 2014
Magnum Hunter Resources Investor Presentation - July 2014
 
EPA Letter to Chesapeake Energy
EPA Letter to Chesapeake EnergyEPA Letter to Chesapeake Energy
EPA Letter to Chesapeake Energy
 
Lease Transfer Document between SWEPI and American Energy - Utica for Guernse...
Lease Transfer Document between SWEPI and American Energy - Utica for Guernse...Lease Transfer Document between SWEPI and American Energy - Utica for Guernse...
Lease Transfer Document between SWEPI and American Energy - Utica for Guernse...
 
GAO Report: EPA Oversight of Injection Wells
GAO Report: EPA Oversight of Injection WellsGAO Report: EPA Oversight of Injection Wells
GAO Report: EPA Oversight of Injection Wells
 
Maryland Risk Assessment of Shale Drilling & Fracking
Maryland Risk Assessment of Shale Drilling & FrackingMaryland Risk Assessment of Shale Drilling & Fracking
Maryland Risk Assessment of Shale Drilling & Fracking
 
Confessions of a Frac Engineer - Mike Vincent
Confessions of a Frac Engineer - Mike VincentConfessions of a Frac Engineer - Mike Vincent
Confessions of a Frac Engineer - Mike Vincent
 

Similar to US EIA Drilling Productivity Report - June 2014

Dr. Dev Kambhampati | EIA Nat Gas Drilling Productivity Report, July 2014
Dr. Dev Kambhampati | EIA Nat Gas Drilling Productivity Report, July 2014Dr. Dev Kambhampati | EIA Nat Gas Drilling Productivity Report, July 2014
Dr. Dev Kambhampati | EIA Nat Gas Drilling Productivity Report, July 2014Dr Dev Kambhampati
 
Shale Oil and Gas USA 2014 - 2015
Shale Oil and Gas  USA 2014 - 2015Shale Oil and Gas  USA 2014 - 2015
Shale Oil and Gas USA 2014 - 2015Dmitry Tseitlin
 
EIA Drilling Productivity Report - Mar 2015
EIA Drilling Productivity Report - Mar 2015EIA Drilling Productivity Report - Mar 2015
EIA Drilling Productivity Report - Mar 2015Marcellus Drilling News
 
U.S. EIA's Drilling Productivity Report - November 2015
U.S. EIA's Drilling Productivity Report - November 2015U.S. EIA's Drilling Productivity Report - November 2015
U.S. EIA's Drilling Productivity Report - November 2015Marcellus Drilling News
 
U.S. EIA's Drilling Productivity Report - March 2016
U.S. EIA's Drilling Productivity Report - March 2016U.S. EIA's Drilling Productivity Report - March 2016
U.S. EIA's Drilling Productivity Report - March 2016Marcellus Drilling News
 
U.S. EIA's Drilling Productivity Report - November 2016
U.S. EIA's Drilling Productivity Report - November 2016U.S. EIA's Drilling Productivity Report - November 2016
U.S. EIA's Drilling Productivity Report - November 2016Marcellus Drilling News
 
U.S. EIA's Drilling Productivity Report - December 2015
U.S. EIA's Drilling Productivity Report - December 2015U.S. EIA's Drilling Productivity Report - December 2015
U.S. EIA's Drilling Productivity Report - December 2015Marcellus Drilling News
 
U.S. EIA's Drilling Productivity Report - October 2016
U.S. EIA's Drilling Productivity Report - October 2016U.S. EIA's Drilling Productivity Report - October 2016
U.S. EIA's Drilling Productivity Report - October 2016Marcellus Drilling News
 
EIA's Monthly Drilling Productiviy Report - Dec 2013
EIA's Monthly Drilling Productiviy Report - Dec 2013EIA's Monthly Drilling Productiviy Report - Dec 2013
EIA's Monthly Drilling Productiviy Report - Dec 2013Marcellus Drilling News
 
EIA Drilling Productivity Report - Oct 2013
EIA Drilling Productivity Report - Oct 2013EIA Drilling Productivity Report - Oct 2013
EIA Drilling Productivity Report - Oct 2013Marcellus Drilling News
 
EIA Drilling Productivity Report Nov 2013
EIA Drilling Productivity Report Nov 2013EIA Drilling Productivity Report Nov 2013
EIA Drilling Productivity Report Nov 2013Marcellus Drilling News
 
Hughes brussels may 14 2013 1
Hughes brussels may 14 2013 1Hughes brussels may 14 2013 1
Hughes brussels may 14 2013 1gdecock
 

Similar to US EIA Drilling Productivity Report - June 2014 (12)

Dr. Dev Kambhampati | EIA Nat Gas Drilling Productivity Report, July 2014
Dr. Dev Kambhampati | EIA Nat Gas Drilling Productivity Report, July 2014Dr. Dev Kambhampati | EIA Nat Gas Drilling Productivity Report, July 2014
Dr. Dev Kambhampati | EIA Nat Gas Drilling Productivity Report, July 2014
 
Shale Oil and Gas USA 2014 - 2015
Shale Oil and Gas  USA 2014 - 2015Shale Oil and Gas  USA 2014 - 2015
Shale Oil and Gas USA 2014 - 2015
 
EIA Drilling Productivity Report - Mar 2015
EIA Drilling Productivity Report - Mar 2015EIA Drilling Productivity Report - Mar 2015
EIA Drilling Productivity Report - Mar 2015
 
U.S. EIA's Drilling Productivity Report - November 2015
U.S. EIA's Drilling Productivity Report - November 2015U.S. EIA's Drilling Productivity Report - November 2015
U.S. EIA's Drilling Productivity Report - November 2015
 
U.S. EIA's Drilling Productivity Report - March 2016
U.S. EIA's Drilling Productivity Report - March 2016U.S. EIA's Drilling Productivity Report - March 2016
U.S. EIA's Drilling Productivity Report - March 2016
 
U.S. EIA's Drilling Productivity Report - November 2016
U.S. EIA's Drilling Productivity Report - November 2016U.S. EIA's Drilling Productivity Report - November 2016
U.S. EIA's Drilling Productivity Report - November 2016
 
U.S. EIA's Drilling Productivity Report - December 2015
U.S. EIA's Drilling Productivity Report - December 2015U.S. EIA's Drilling Productivity Report - December 2015
U.S. EIA's Drilling Productivity Report - December 2015
 
U.S. EIA's Drilling Productivity Report - October 2016
U.S. EIA's Drilling Productivity Report - October 2016U.S. EIA's Drilling Productivity Report - October 2016
U.S. EIA's Drilling Productivity Report - October 2016
 
EIA's Monthly Drilling Productiviy Report - Dec 2013
EIA's Monthly Drilling Productiviy Report - Dec 2013EIA's Monthly Drilling Productiviy Report - Dec 2013
EIA's Monthly Drilling Productiviy Report - Dec 2013
 
EIA Drilling Productivity Report - Oct 2013
EIA Drilling Productivity Report - Oct 2013EIA Drilling Productivity Report - Oct 2013
EIA Drilling Productivity Report - Oct 2013
 
EIA Drilling Productivity Report Nov 2013
EIA Drilling Productivity Report Nov 2013EIA Drilling Productivity Report Nov 2013
EIA Drilling Productivity Report Nov 2013
 
Hughes brussels may 14 2013 1
Hughes brussels may 14 2013 1Hughes brussels may 14 2013 1
Hughes brussels may 14 2013 1
 

More from Marcellus Drilling News

Five facts about shale: it’s coming back, and coming back strong
Five facts about shale: it’s coming back, and coming back strongFive facts about shale: it’s coming back, and coming back strong
Five facts about shale: it’s coming back, and coming back strongMarcellus Drilling News
 
Quarterly legislative action update: Marcellus and Utica shale region (4Q16)
Quarterly legislative action update: Marcellus and Utica shale region (4Q16)Quarterly legislative action update: Marcellus and Utica shale region (4Q16)
Quarterly legislative action update: Marcellus and Utica shale region (4Q16)Marcellus Drilling News
 
Access Northeast Pipeline Project - Dec 2016 Update
Access Northeast Pipeline Project - Dec 2016 UpdateAccess Northeast Pipeline Project - Dec 2016 Update
Access Northeast Pipeline Project - Dec 2016 UpdateMarcellus Drilling News
 
Rover Pipeline Letter to FERC Requesting Final Certificate
Rover Pipeline Letter to FERC Requesting Final CertificateRover Pipeline Letter to FERC Requesting Final Certificate
Rover Pipeline Letter to FERC Requesting Final CertificateMarcellus Drilling News
 
DOE Order Granting Elba Island LNG Right to Export to Non-FTA Countries
DOE Order Granting Elba Island LNG Right to Export to Non-FTA CountriesDOE Order Granting Elba Island LNG Right to Export to Non-FTA Countries
DOE Order Granting Elba Island LNG Right to Export to Non-FTA CountriesMarcellus Drilling News
 
LSE Study: Fracking is Revitalizing U.S. Manufacturing
LSE Study: Fracking is Revitalizing U.S. ManufacturingLSE Study: Fracking is Revitalizing U.S. Manufacturing
LSE Study: Fracking is Revitalizing U.S. ManufacturingMarcellus Drilling News
 
Letter From 24 States Asking Trump & Congress to Withdraw the Unlawful Clean ...
Letter From 24 States Asking Trump & Congress to Withdraw the Unlawful Clean ...Letter From 24 States Asking Trump & Congress to Withdraw the Unlawful Clean ...
Letter From 24 States Asking Trump & Congress to Withdraw the Unlawful Clean ...Marcellus Drilling News
 
Report: New U.S. Power Costs: by County, with Environmental Externalities
Report: New U.S. Power Costs: by County, with Environmental ExternalitiesReport: New U.S. Power Costs: by County, with Environmental Externalities
Report: New U.S. Power Costs: by County, with Environmental ExternalitiesMarcellus Drilling News
 
U.S. Crude Oil and Natural Gas Proved Reserves, Year-end 2015
U.S. Crude Oil and Natural Gas Proved Reserves, Year-end 2015U.S. Crude Oil and Natural Gas Proved Reserves, Year-end 2015
U.S. Crude Oil and Natural Gas Proved Reserves, Year-end 2015Marcellus Drilling News
 
Velocys Plan to "Build the Business" - Gas-to-Liquids Plants
Velocys Plan to "Build the Business" - Gas-to-Liquids PlantsVelocys Plan to "Build the Business" - Gas-to-Liquids Plants
Velocys Plan to "Build the Business" - Gas-to-Liquids PlantsMarcellus Drilling News
 
PA DEP Revised Permit for Natural Gas Compression Stations, Processing Plants...
PA DEP Revised Permit for Natural Gas Compression Stations, Processing Plants...PA DEP Revised Permit for Natural Gas Compression Stations, Processing Plants...
PA DEP Revised Permit for Natural Gas Compression Stations, Processing Plants...Marcellus Drilling News
 
PA DEP Permit for Unconventional NatGas Well Site Operations and Remote Piggi...
PA DEP Permit for Unconventional NatGas Well Site Operations and Remote Piggi...PA DEP Permit for Unconventional NatGas Well Site Operations and Remote Piggi...
PA DEP Permit for Unconventional NatGas Well Site Operations and Remote Piggi...Marcellus Drilling News
 
PA DEP: Methane Reduction Strategies for Natural Gas Operations
PA DEP: Methane Reduction Strategies for Natural Gas OperationsPA DEP: Methane Reduction Strategies for Natural Gas Operations
PA DEP: Methane Reduction Strategies for Natural Gas OperationsMarcellus Drilling News
 
US EIA's December 2016 Short-Term Energy Outlook
US EIA's December 2016 Short-Term Energy OutlookUS EIA's December 2016 Short-Term Energy Outlook
US EIA's December 2016 Short-Term Energy OutlookMarcellus Drilling News
 
Northeast Gas Association's 2016 Statistical Guide
Northeast Gas Association's 2016 Statistical GuideNortheast Gas Association's 2016 Statistical Guide
Northeast Gas Association's 2016 Statistical GuideMarcellus Drilling News
 
PA PUC Responses to Auditor General's Act 13 Impact Fee Audit
PA PUC Responses to Auditor General's Act 13 Impact Fee AuditPA PUC Responses to Auditor General's Act 13 Impact Fee Audit
PA PUC Responses to Auditor General's Act 13 Impact Fee AuditMarcellus Drilling News
 
Pennsylvania Public Utility Commission Act 13/Impact Fees Audit by PA Auditor...
Pennsylvania Public Utility Commission Act 13/Impact Fees Audit by PA Auditor...Pennsylvania Public Utility Commission Act 13/Impact Fees Audit by PA Auditor...
Pennsylvania Public Utility Commission Act 13/Impact Fees Audit by PA Auditor...Marcellus Drilling News
 
Clyde Mine Discharge/Tenmile Creek Water Quality Final Report
Clyde Mine Discharge/Tenmile Creek Water Quality Final ReportClyde Mine Discharge/Tenmile Creek Water Quality Final Report
Clyde Mine Discharge/Tenmile Creek Water Quality Final ReportMarcellus Drilling News
 
FERC Order Denying Stay of Kinder Morgan's Broad Run Expansion Project
FERC Order Denying Stay of Kinder Morgan's Broad Run Expansion ProjectFERC Order Denying Stay of Kinder Morgan's Broad Run Expansion Project
FERC Order Denying Stay of Kinder Morgan's Broad Run Expansion ProjectMarcellus Drilling News
 
Sixth Circuit Court of Appeals Decision in Harper v Muskingum Watershed Conse...
Sixth Circuit Court of Appeals Decision in Harper v Muskingum Watershed Conse...Sixth Circuit Court of Appeals Decision in Harper v Muskingum Watershed Conse...
Sixth Circuit Court of Appeals Decision in Harper v Muskingum Watershed Conse...Marcellus Drilling News
 

More from Marcellus Drilling News (20)

Five facts about shale: it’s coming back, and coming back strong
Five facts about shale: it’s coming back, and coming back strongFive facts about shale: it’s coming back, and coming back strong
Five facts about shale: it’s coming back, and coming back strong
 
Quarterly legislative action update: Marcellus and Utica shale region (4Q16)
Quarterly legislative action update: Marcellus and Utica shale region (4Q16)Quarterly legislative action update: Marcellus and Utica shale region (4Q16)
Quarterly legislative action update: Marcellus and Utica shale region (4Q16)
 
Access Northeast Pipeline Project - Dec 2016 Update
Access Northeast Pipeline Project - Dec 2016 UpdateAccess Northeast Pipeline Project - Dec 2016 Update
Access Northeast Pipeline Project - Dec 2016 Update
 
Rover Pipeline Letter to FERC Requesting Final Certificate
Rover Pipeline Letter to FERC Requesting Final CertificateRover Pipeline Letter to FERC Requesting Final Certificate
Rover Pipeline Letter to FERC Requesting Final Certificate
 
DOE Order Granting Elba Island LNG Right to Export to Non-FTA Countries
DOE Order Granting Elba Island LNG Right to Export to Non-FTA CountriesDOE Order Granting Elba Island LNG Right to Export to Non-FTA Countries
DOE Order Granting Elba Island LNG Right to Export to Non-FTA Countries
 
LSE Study: Fracking is Revitalizing U.S. Manufacturing
LSE Study: Fracking is Revitalizing U.S. ManufacturingLSE Study: Fracking is Revitalizing U.S. Manufacturing
LSE Study: Fracking is Revitalizing U.S. Manufacturing
 
Letter From 24 States Asking Trump & Congress to Withdraw the Unlawful Clean ...
Letter From 24 States Asking Trump & Congress to Withdraw the Unlawful Clean ...Letter From 24 States Asking Trump & Congress to Withdraw the Unlawful Clean ...
Letter From 24 States Asking Trump & Congress to Withdraw the Unlawful Clean ...
 
Report: New U.S. Power Costs: by County, with Environmental Externalities
Report: New U.S. Power Costs: by County, with Environmental ExternalitiesReport: New U.S. Power Costs: by County, with Environmental Externalities
Report: New U.S. Power Costs: by County, with Environmental Externalities
 
U.S. Crude Oil and Natural Gas Proved Reserves, Year-end 2015
U.S. Crude Oil and Natural Gas Proved Reserves, Year-end 2015U.S. Crude Oil and Natural Gas Proved Reserves, Year-end 2015
U.S. Crude Oil and Natural Gas Proved Reserves, Year-end 2015
 
Velocys Plan to "Build the Business" - Gas-to-Liquids Plants
Velocys Plan to "Build the Business" - Gas-to-Liquids PlantsVelocys Plan to "Build the Business" - Gas-to-Liquids Plants
Velocys Plan to "Build the Business" - Gas-to-Liquids Plants
 
PA DEP Revised Permit for Natural Gas Compression Stations, Processing Plants...
PA DEP Revised Permit for Natural Gas Compression Stations, Processing Plants...PA DEP Revised Permit for Natural Gas Compression Stations, Processing Plants...
PA DEP Revised Permit for Natural Gas Compression Stations, Processing Plants...
 
PA DEP Permit for Unconventional NatGas Well Site Operations and Remote Piggi...
PA DEP Permit for Unconventional NatGas Well Site Operations and Remote Piggi...PA DEP Permit for Unconventional NatGas Well Site Operations and Remote Piggi...
PA DEP Permit for Unconventional NatGas Well Site Operations and Remote Piggi...
 
PA DEP: Methane Reduction Strategies for Natural Gas Operations
PA DEP: Methane Reduction Strategies for Natural Gas OperationsPA DEP: Methane Reduction Strategies for Natural Gas Operations
PA DEP: Methane Reduction Strategies for Natural Gas Operations
 
US EIA's December 2016 Short-Term Energy Outlook
US EIA's December 2016 Short-Term Energy OutlookUS EIA's December 2016 Short-Term Energy Outlook
US EIA's December 2016 Short-Term Energy Outlook
 
Northeast Gas Association's 2016 Statistical Guide
Northeast Gas Association's 2016 Statistical GuideNortheast Gas Association's 2016 Statistical Guide
Northeast Gas Association's 2016 Statistical Guide
 
PA PUC Responses to Auditor General's Act 13 Impact Fee Audit
PA PUC Responses to Auditor General's Act 13 Impact Fee AuditPA PUC Responses to Auditor General's Act 13 Impact Fee Audit
PA PUC Responses to Auditor General's Act 13 Impact Fee Audit
 
Pennsylvania Public Utility Commission Act 13/Impact Fees Audit by PA Auditor...
Pennsylvania Public Utility Commission Act 13/Impact Fees Audit by PA Auditor...Pennsylvania Public Utility Commission Act 13/Impact Fees Audit by PA Auditor...
Pennsylvania Public Utility Commission Act 13/Impact Fees Audit by PA Auditor...
 
Clyde Mine Discharge/Tenmile Creek Water Quality Final Report
Clyde Mine Discharge/Tenmile Creek Water Quality Final ReportClyde Mine Discharge/Tenmile Creek Water Quality Final Report
Clyde Mine Discharge/Tenmile Creek Water Quality Final Report
 
FERC Order Denying Stay of Kinder Morgan's Broad Run Expansion Project
FERC Order Denying Stay of Kinder Morgan's Broad Run Expansion ProjectFERC Order Denying Stay of Kinder Morgan's Broad Run Expansion Project
FERC Order Denying Stay of Kinder Morgan's Broad Run Expansion Project
 
Sixth Circuit Court of Appeals Decision in Harper v Muskingum Watershed Conse...
Sixth Circuit Court of Appeals Decision in Harper v Muskingum Watershed Conse...Sixth Circuit Court of Appeals Decision in Harper v Muskingum Watershed Conse...
Sixth Circuit Court of Appeals Decision in Harper v Muskingum Watershed Conse...
 

Recently uploaded

Roberts Rules Cheat Sheet for LD4 Precinct Commiteemen
Roberts Rules Cheat Sheet for LD4 Precinct CommiteemenRoberts Rules Cheat Sheet for LD4 Precinct Commiteemen
Roberts Rules Cheat Sheet for LD4 Precinct Commiteemenkfjstone13
 
College Call Girls Kolhapur Aanya 8617697112 Independent Escort Service Kolhapur
College Call Girls Kolhapur Aanya 8617697112 Independent Escort Service KolhapurCollege Call Girls Kolhapur Aanya 8617697112 Independent Escort Service Kolhapur
College Call Girls Kolhapur Aanya 8617697112 Independent Escort Service KolhapurCall girls in Ahmedabad High profile
 
25042024_First India Newspaper Jaipur.pdf
25042024_First India Newspaper Jaipur.pdf25042024_First India Newspaper Jaipur.pdf
25042024_First India Newspaper Jaipur.pdfFIRST INDIA
 
Defensa de JOH insiste que testimonio de analista de la DEA es falso y solici...
Defensa de JOH insiste que testimonio de analista de la DEA es falso y solici...Defensa de JOH insiste que testimonio de analista de la DEA es falso y solici...
Defensa de JOH insiste que testimonio de analista de la DEA es falso y solici...AlexisTorres963861
 
Brief biography of Julius Robert Oppenheimer
Brief biography of Julius Robert OppenheimerBrief biography of Julius Robert Oppenheimer
Brief biography of Julius Robert OppenheimerOmarCabrera39
 
Minto-Morley Reforms 1909 (constitution).pptx
Minto-Morley Reforms 1909 (constitution).pptxMinto-Morley Reforms 1909 (constitution).pptx
Minto-Morley Reforms 1909 (constitution).pptxAwaiskhalid96
 
2024 02 15 AZ GOP LD4 Gen Meeting Minutes_FINAL_20240228.docx
2024 02 15 AZ GOP LD4 Gen Meeting Minutes_FINAL_20240228.docx2024 02 15 AZ GOP LD4 Gen Meeting Minutes_FINAL_20240228.docx
2024 02 15 AZ GOP LD4 Gen Meeting Minutes_FINAL_20240228.docxkfjstone13
 
Lorenzo D'Emidio_Lavoro sullaNorth Korea .pptx
Lorenzo D'Emidio_Lavoro sullaNorth Korea .pptxLorenzo D'Emidio_Lavoro sullaNorth Korea .pptx
Lorenzo D'Emidio_Lavoro sullaNorth Korea .pptxlorenzodemidio01
 
Israel Palestine Conflict, The issue and historical context!
Israel Palestine Conflict, The issue and historical context!Israel Palestine Conflict, The issue and historical context!
Israel Palestine Conflict, The issue and historical context!Krish109503
 
Different Frontiers of Social Media War in Indonesia Elections 2024
Different Frontiers of Social Media War in Indonesia Elections 2024Different Frontiers of Social Media War in Indonesia Elections 2024
Different Frontiers of Social Media War in Indonesia Elections 2024Ismail Fahmi
 
2024 04 03 AZ GOP LD4 Gen Meeting Minutes FINAL.docx
2024 04 03 AZ GOP LD4 Gen Meeting Minutes FINAL.docx2024 04 03 AZ GOP LD4 Gen Meeting Minutes FINAL.docx
2024 04 03 AZ GOP LD4 Gen Meeting Minutes FINAL.docxkfjstone13
 
KAHULUGAN AT KAHALAGAHAN NG GAWAING PANSIBIKO.pptx
KAHULUGAN AT KAHALAGAHAN NG GAWAING PANSIBIKO.pptxKAHULUGAN AT KAHALAGAHAN NG GAWAING PANSIBIKO.pptx
KAHULUGAN AT KAHALAGAHAN NG GAWAING PANSIBIKO.pptxjohnandrewcarlos
 
Vashi Escorts, {Pooja 09892124323}, Vashi Call Girls
Vashi Escorts, {Pooja 09892124323}, Vashi Call GirlsVashi Escorts, {Pooja 09892124323}, Vashi Call Girls
Vashi Escorts, {Pooja 09892124323}, Vashi Call GirlsPooja Nehwal
 
Nurturing Families, Empowering Lives: TDP's Vision for Family Welfare in Andh...
Nurturing Families, Empowering Lives: TDP's Vision for Family Welfare in Andh...Nurturing Families, Empowering Lives: TDP's Vision for Family Welfare in Andh...
Nurturing Families, Empowering Lives: TDP's Vision for Family Welfare in Andh...narsireddynannuri1
 
AP Election Survey 2024: TDP-Janasena-BJP Alliance Set To Sweep Victory
AP Election Survey 2024: TDP-Janasena-BJP Alliance Set To Sweep VictoryAP Election Survey 2024: TDP-Janasena-BJP Alliance Set To Sweep Victory
AP Election Survey 2024: TDP-Janasena-BJP Alliance Set To Sweep Victoryanjanibaddipudi1
 
23042024_First India Newspaper Jaipur.pdf
23042024_First India Newspaper Jaipur.pdf23042024_First India Newspaper Jaipur.pdf
23042024_First India Newspaper Jaipur.pdfFIRST INDIA
 
Referendum Party 2024 Election Manifesto
Referendum Party 2024 Election ManifestoReferendum Party 2024 Election Manifesto
Referendum Party 2024 Election ManifestoSABC News
 
Manipur-Book-Final-2-compressed.pdfsal'rpk
Manipur-Book-Final-2-compressed.pdfsal'rpkManipur-Book-Final-2-compressed.pdfsal'rpk
Manipur-Book-Final-2-compressed.pdfsal'rpkbhavenpr
 
如何办理(BU学位证书)美国贝翰文大学毕业证学位证书
如何办理(BU学位证书)美国贝翰文大学毕业证学位证书如何办理(BU学位证书)美国贝翰文大学毕业证学位证书
如何办理(BU学位证书)美国贝翰文大学毕业证学位证书Fi L
 
How Europe Underdeveloped Africa_walter.pdf
How Europe Underdeveloped Africa_walter.pdfHow Europe Underdeveloped Africa_walter.pdf
How Europe Underdeveloped Africa_walter.pdfLorenzo Lemes
 

Recently uploaded (20)

Roberts Rules Cheat Sheet for LD4 Precinct Commiteemen
Roberts Rules Cheat Sheet for LD4 Precinct CommiteemenRoberts Rules Cheat Sheet for LD4 Precinct Commiteemen
Roberts Rules Cheat Sheet for LD4 Precinct Commiteemen
 
College Call Girls Kolhapur Aanya 8617697112 Independent Escort Service Kolhapur
College Call Girls Kolhapur Aanya 8617697112 Independent Escort Service KolhapurCollege Call Girls Kolhapur Aanya 8617697112 Independent Escort Service Kolhapur
College Call Girls Kolhapur Aanya 8617697112 Independent Escort Service Kolhapur
 
25042024_First India Newspaper Jaipur.pdf
25042024_First India Newspaper Jaipur.pdf25042024_First India Newspaper Jaipur.pdf
25042024_First India Newspaper Jaipur.pdf
 
Defensa de JOH insiste que testimonio de analista de la DEA es falso y solici...
Defensa de JOH insiste que testimonio de analista de la DEA es falso y solici...Defensa de JOH insiste que testimonio de analista de la DEA es falso y solici...
Defensa de JOH insiste que testimonio de analista de la DEA es falso y solici...
 
Brief biography of Julius Robert Oppenheimer
Brief biography of Julius Robert OppenheimerBrief biography of Julius Robert Oppenheimer
Brief biography of Julius Robert Oppenheimer
 
Minto-Morley Reforms 1909 (constitution).pptx
Minto-Morley Reforms 1909 (constitution).pptxMinto-Morley Reforms 1909 (constitution).pptx
Minto-Morley Reforms 1909 (constitution).pptx
 
2024 02 15 AZ GOP LD4 Gen Meeting Minutes_FINAL_20240228.docx
2024 02 15 AZ GOP LD4 Gen Meeting Minutes_FINAL_20240228.docx2024 02 15 AZ GOP LD4 Gen Meeting Minutes_FINAL_20240228.docx
2024 02 15 AZ GOP LD4 Gen Meeting Minutes_FINAL_20240228.docx
 
Lorenzo D'Emidio_Lavoro sullaNorth Korea .pptx
Lorenzo D'Emidio_Lavoro sullaNorth Korea .pptxLorenzo D'Emidio_Lavoro sullaNorth Korea .pptx
Lorenzo D'Emidio_Lavoro sullaNorth Korea .pptx
 
Israel Palestine Conflict, The issue and historical context!
Israel Palestine Conflict, The issue and historical context!Israel Palestine Conflict, The issue and historical context!
Israel Palestine Conflict, The issue and historical context!
 
Different Frontiers of Social Media War in Indonesia Elections 2024
Different Frontiers of Social Media War in Indonesia Elections 2024Different Frontiers of Social Media War in Indonesia Elections 2024
Different Frontiers of Social Media War in Indonesia Elections 2024
 
2024 04 03 AZ GOP LD4 Gen Meeting Minutes FINAL.docx
2024 04 03 AZ GOP LD4 Gen Meeting Minutes FINAL.docx2024 04 03 AZ GOP LD4 Gen Meeting Minutes FINAL.docx
2024 04 03 AZ GOP LD4 Gen Meeting Minutes FINAL.docx
 
KAHULUGAN AT KAHALAGAHAN NG GAWAING PANSIBIKO.pptx
KAHULUGAN AT KAHALAGAHAN NG GAWAING PANSIBIKO.pptxKAHULUGAN AT KAHALAGAHAN NG GAWAING PANSIBIKO.pptx
KAHULUGAN AT KAHALAGAHAN NG GAWAING PANSIBIKO.pptx
 
Vashi Escorts, {Pooja 09892124323}, Vashi Call Girls
Vashi Escorts, {Pooja 09892124323}, Vashi Call GirlsVashi Escorts, {Pooja 09892124323}, Vashi Call Girls
Vashi Escorts, {Pooja 09892124323}, Vashi Call Girls
 
Nurturing Families, Empowering Lives: TDP's Vision for Family Welfare in Andh...
Nurturing Families, Empowering Lives: TDP's Vision for Family Welfare in Andh...Nurturing Families, Empowering Lives: TDP's Vision for Family Welfare in Andh...
Nurturing Families, Empowering Lives: TDP's Vision for Family Welfare in Andh...
 
AP Election Survey 2024: TDP-Janasena-BJP Alliance Set To Sweep Victory
AP Election Survey 2024: TDP-Janasena-BJP Alliance Set To Sweep VictoryAP Election Survey 2024: TDP-Janasena-BJP Alliance Set To Sweep Victory
AP Election Survey 2024: TDP-Janasena-BJP Alliance Set To Sweep Victory
 
23042024_First India Newspaper Jaipur.pdf
23042024_First India Newspaper Jaipur.pdf23042024_First India Newspaper Jaipur.pdf
23042024_First India Newspaper Jaipur.pdf
 
Referendum Party 2024 Election Manifesto
Referendum Party 2024 Election ManifestoReferendum Party 2024 Election Manifesto
Referendum Party 2024 Election Manifesto
 
Manipur-Book-Final-2-compressed.pdfsal'rpk
Manipur-Book-Final-2-compressed.pdfsal'rpkManipur-Book-Final-2-compressed.pdfsal'rpk
Manipur-Book-Final-2-compressed.pdfsal'rpk
 
如何办理(BU学位证书)美国贝翰文大学毕业证学位证书
如何办理(BU学位证书)美国贝翰文大学毕业证学位证书如何办理(BU学位证书)美国贝翰文大学毕业证学位证书
如何办理(BU学位证书)美国贝翰文大学毕业证学位证书
 
How Europe Underdeveloped Africa_walter.pdf
How Europe Underdeveloped Africa_walter.pdfHow Europe Underdeveloped Africa_walter.pdf
How Europe Underdeveloped Africa_walter.pdf
 

US EIA Drilling Productivity Report - June 2014

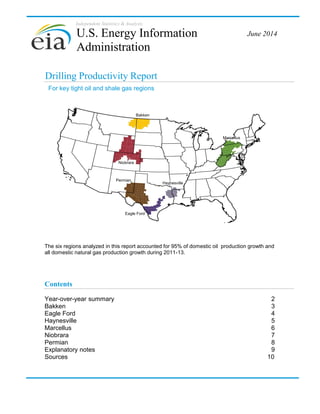
  • 1. Independent Statistics & Analysis Drilling Productivity Report The six regions analyzed in this report accounted for 95% of domestic oil production growth and all domestic natural gas production growth during 2011-13. June 2014 For key tight oil and shale gas regions U.S. Energy Information Administration Contents Year-over-year summary 2 Bakken 3 Eagle Ford 4 Haynesville 5 Marcellus 6 Niobrara 7 Permian 8 Explanatory notes 9 Sources 10 Bakken Marcellus Niobrara Haynesville Eagle Ford Permian
  • 2. U. S. Energy Information Administration | Drilling Productivity Report 0 400 800 1,200 1,600 2,000 2,400 Bakken Eagle Ford Haynesville Marcellus Niobrara Permian July-2013 July-2014 Oil production thousand barrels/day 0 2,000 4,000 6,000 8,000 10,000 12,000 14,000 16,000 Bakken Eagle Ford Haynesville Marcellus Niobrara Permian July-2013 July-2014 Natural gas production million cubic feet/day 0 250 500 750 1,000 1,250 Bakken Eagle Ford Haynesville Marcellus Niobrara Permian July-2013 July-2014 New-well oil production per rig barrels/day 0 1,000 2,000 3,000 4,000 5,000 6,000 7,000 Bakken Eagle Ford Haynesville Marcellus Niobrara Permian July-2013 July-2014 New-well gas production per rig thousand cubic feet/day (700) (600) (500) (400) (300) (200) (100) 0 Bakken Eagle Ford Haynesville Marcellus Niobrara Permian July-2013 July-2014 Legacy gas production change million cubic feet/day (125) (100) (75) (50) (25) 0 Bakken Eagle Ford Haynesville Marcellus Niobrara Permian July-2013 July-2014 Legacy oil production change thousand barrels/day drilling data through May projected production through July June 2014 Drilling Productivity Report Year-over-year summary -10 0 10 20 30 40 50 60 Bakken Eagle Ford Haynesville Marcellus Niobrara Permian July-2013 July-2014 thousand barrels/day Indicated monthly change in oil production (Jul vs. Jun) -300 -200 -100 0 100 200 300 400 500 Bakken Eagle Ford Haynesville Marcellus Niobrara Permian July-2013 July-2014 million cubic feet/day Indicated monthly change in gas production (Jul vs. Jun) 2
  • 3. U. S. Energy Information Administration | Drilling Productivity Report 0 200 400 600 800 1,000 1,200 2007 2008 2009 2010 2011 2012 2013 2014 Oil production thousand barrels/day Bakken 0 50 100 Jun 1,074 Mbbl/d Production from new wells Legacy production change Net change Jul 1,094 Mbbl/d thousand barrels/day Bakken +92 -72 +20 Indicated change in oil production (Jul vs. Jun) 0 50 100 Jun 1,262 MMcf/d Production from new wells Legacy production change Net change Jul 1,285 MMcf/d Indicated change in natural gas production (Jul vs. Jun) million cubic feet/day Bakken +93 -70 +23 0 50 100 150 200 250 0 100 200 300 400 500 600 2007 2008 2009 2010 2011 2012 2013 2014 new-well oil production per rig rig count New-well oil production per rig barrels/day Bakken Rig count rigs (80) (70) (60) (50) (40) (30) (20) (10) 0 2007 2008 2009 2010 2011 2012 2013 2014 Legacy oil production change thousand barrels/day Bakken (80) (70) (60) (50) (40) (30) (20) (10) 0 2007 2008 2009 2010 2011 2012 2013 2014 Legacy gas production change million cubic feet/day BakkenBakken 0 1,000 2,000 3,000 4,000 5,000 6,000 7,000 2007 2008 2009 2010 2011 2012 2013 2014 Bakken Natural gas production million cubic feet/day 0 50 100 150 200 250 0 600 1,200 1,800 2,400 3,000 3,600 2007 2008 2009 2010 2011 2012 2013 2014 new-well gas production per rig rig count New-well gas production per rig thousand cubic feet/day Bakken Rig count rigs drilling data through May projected production through July June 2014 Drilling Productivity Report Monthly additions from one average rig July barrels/day June barrels/day month over month Oil +5 Gas thousand cubic feet/day month over month +6 Bakken million cubic feet/day month over month 518July thousand cubic feet/day June 512 510 505 thousand barrels/day month over month Oil +20 Gas +23 3
  • 4. U. S. Energy Information Administration | Drilling Productivity Report 0 200 400 600 800 1,000 1,200 1,400 1,600 2007 2008 2009 2010 2011 2012 2013 2014 Oil production thousand barrels/day Eagle Ford 0 50 100 150 Jun 1,405 Mbbl/d Production from new wells Legacy production change Net change Jul 1,429 Mbbl/d thousand barrels/day Eagle Ford +138 -114 +24 Indicated change in oil production (Jul vs. Jun) 0 100 200 300 400 Jun 7,023 MMcf/d Production from new wells Legacy production change Net change Jul 7,126 MMcf/d Indicated change in natural gas production (Jul vs. Jun) million cubic feet/day Eagle Ford +371 -268 +103 0 50 100 150 200 250 300 350 0 100 200 300 400 500 600 2007 2008 2009 2010 2011 2012 2013 2014 new-well oil production per rig rig count New-well oil production per rig barrels/day Eagle Ford Rig count rigs (120) (100) (80) (60) (40) (20) 0 2007 2008 2009 2010 2011 2012 2013 2014 Legacy oil production change thousand barrels/day Eagle Ford (300) (250) (200) (150) (100) (50) 0 2007 2008 2009 2010 2011 2012 2013 2014 Legacy gas production change million cubic feet/day Eagle FordEagle Ford 0 1,000 2,000 3,000 4,000 5,000 6,000 7,000 2007 2008 2009 2010 2011 2012 2013 2014 Eagle Ford Natural gas production million cubic feet/day 0 50 100 150 200 250 300 350 0 600 1,200 1,800 2,400 3,000 3,600 2007 2008 2009 2010 2011 2012 2013 2014 new-well gas production per rig rig count New-well gas production per rig thousand cubic feet/day Eagle Ford Rig count rigs drilling data through May projected production through July June 2014 Drilling Productivity Report Monthly additions from one average rig July barrels/day June barrels/day month over month Oil +5 Gas thousand cubic feet/day month over month +6 Eagle Ford million cubic feet/day month over month 1,294July thousand cubic feet/day June 1,288 479 474 thousand barrels/day month over month Oil +24 Gas +103 4
  • 5. U. S. Energy Information Administration | Drilling Productivity Report barrels/day 0 400 800 1,200 1,600 2,000 2007 2008 2009 2010 2011 2012 2013 2014 Oil production thousand barrels/day Haynesville 0.0 1.0 2.0 3.0 Jun 54 Mbbl/d Production from new wells Legacy production change Net change Jul 54 Mbbl/d thousand barrels/day Haynesville +1 -1 +0 Indicated change in oil production (Jul vs. Jun) -150 -50 50 150 250 350 Jun 6,871 MMcf/d Production from new wells Legacy production change Net change Jul 6,890 MMcf/d Indicated change in natural gas production (Jul vs. Jun) million cubic feet/day Haynesville +281 -262 +19 0 50 100 150 200 250 300 0 200 400 600 800 1,000 2007 2008 2009 2010 2011 2012 2013 2014 new-well oil production per rig rig count New-well oil production per rig barrels/day Haynesville Rig count rigs (3) (2) (1) 0 2007 2008 2009 2010 2011 2012 2013 2014 Legacy oil production change thousand barrels/day Haynesville (600) (500) (400) (300) (200) (100) 0 2007 2008 2009 2010 2011 2012 2013 2014 Legacy gas production change million cubic feet/day HaynesvilleHaynesville 0 2,000 4,000 6,000 8,000 10,000 12,000 2007 2008 2009 2010 2011 2012 2013 2014 Haynesville Natural gas production million cubic feet/day 0 50 100 150 200 250 300 0 1,000 2,000 3,000 4,000 5,000 6,000 2007 2008 2009 2010 2011 2012 2013 2014 new-well gas production per rig rig count New-well gas production per rig thousand cubic feet/day Haynesville Rig count rigs drilling data through May projected production through July June 2014 Drilling Productivity Report Monthly additions from one average rig July June barrels/day month over month Oil 0 Gas thousand cubic feet/day month over month +96 Haynesville million cubic feet/day month over month 5,411July thousand cubic feet/day June 5,315 23 23 thousand barrels/day month over month Oil +0 Gas +19 5
  • 6. U. S. Energy Information Administration | Drilling Productivity Report Marcellus 0 400 800 1,200 1,600 2,000 2007 2008 2009 2010 2011 2012 2013 2014 Oil production thousand barrels/day Marcellus 0.0 1.0 2.0 3.0 4.0 Jun 42 Mbbl/d Production from new wells Legacy production change Net change Jul 43 Mbbl/d thousand barrels/day Marcellus +3 -2 +1 Indicated change in oil production (Jul vs. Jun) 0 200 400 600 Jun 14,695 MMcf/d Production from new wells Legacy production change Net change Jul 14,975 MMcf/d Indicated change in natural gas production (Jul vs. Jun) million cubic feet/day Marcellus +663 -383 +280 0 20 40 60 80 100 120 140 160 0 200 400 600 800 1,000 1,200 2007 2008 2009 2010 2011 2012 2013 2014 new-well oil production per rig rig count New-well oil production per rig barrels/day Marcellus Rig count rigs (3) (2) (1) 0 2007 2008 2009 2010 2011 2012 2013 2014 Legacy oil production change thousand barrels/day Marcellus (500) (400) (300) (200) (100) 0 2007 2008 2009 2010 2011 2012 2013 2014 Legacy gas production change million cubic feet/day MarcellusMarcellus 0 2,000 4,000 6,000 8,000 10,000 12,000 14,000 16,000 2007 2008 2009 2010 2011 2012 2013 2014 Marcellus Natural gas production million cubic feet/day 0 20 40 60 80 100 120 140 160 0 1,200 2,400 3,600 4,800 6,000 7,200 2007 2008 2009 2010 2011 2012 2013 2014 new-well gas production per rig rig count New-well gas production per rig thousand cubic feet/day Marcellus Rig count rigs drilling data through May projected production through July June 2014 Drilling Productivity Report Monthly additions from one average rig July barrels/day June barrels/day month over month Oil 0 Gas thousandcubic feet/day month over month +38 million cubic feet/day month over month 6,555July thousand cubic feet/day June 6,517 30 30 thousand barrels/day month over month Oil +1 Gas +280 6
  • 7. U. S. Energy Information Administration | Drilling Productivity Report 0 200 400 600 800 1,000 2007 2008 2009 2010 2011 2012 2013 2014 Oil production thousand barrels/day Niobrara 0 10 20 30 40 Jun 318 Mbbl/d Production from new wells Legacy production change Net change Jul 321 Mbbl/d thousand barrels/day Niobrara +35 -32 +3 Indicated change in oil production (Jul vs. Jun) 0 50 100 150 200 Jun 4,422 MMcf/d Production from new wells Legacy production change Net change Jul 4,441 MMcf/d Indicated change in natural gas production (Jul vs. Jun) million cubic feet/day Niobrara +152 -133 +19 0 20 40 60 80 100 120 140 0 100 200 300 400 500 600 2007 2008 2009 2010 2011 2012 2013 2014 new-well oil production per rig rig count New-well oil production per rig barrels/day Niobrara Rig count rigs (35) (30) (25) (20) (15) (10) (5) 0 2007 2008 2009 2010 2011 2012 2013 2014 Legacy oil production change thousand barrels/day Niobrara (160) (140) (120) (100) (80) (60) (40) (20) 0 2007 2008 2009 2010 2011 2012 2013 2014 Legacy gas production change million cubic feet/day NiobraraNiobrara 0 1,000 2,000 3,000 4,000 5,000 6,000 2007 2008 2009 2010 2011 2012 2013 2014 Niobrara Natural gas production million cubic feet/day 0 20 40 60 80 100 120 140 0 600 1,200 1,800 2,400 3,000 3,600 2007 2008 2009 2010 2011 2012 2013 2014 new-well gas production per rig rig count New-well gas production per rig thousand cubic feet/day Niobrara Rig count rigs drilling data through May projected production through July June 2014 Drilling Productivity Report Monthly additions from one average rig July barrels/day June barrels/day month over month Oil +8 Gas thousand cubic feet/day month over month +27 Niobrara million cubic feet/day month over month 1,621July thousand cubic feet/day June 1,594 370 362 thousand barrels/day month over month Oil +3 Gas +19 7
  • 8. U. S. Energy Information Administration | Drilling Productivity Report 0 200 400 600 800 1,000 1,200 1,400 1,600 1,800 2007 2008 2009 2010 2011 2012 2013 2014 Oil production thousand barrels/day Permian 0 20 40 60 80 Jun 1,543 Mbbl/d Production from new wells Legacy production change Net change Jul 1,566 Mbbl/d thousand barrels/day Permian +73 -50 +23 Indicated change in oil production (Jul vs. Jun) 0 30 60 90 120 150 180 Jun 5,568 MMcf/d Production from new wells Legacy production change Net change Jul 5,623 MMcf/d Indicated change in natural gas production (Jul vs. Jun) million cubic feet/day Permian +162 -107 +55 0 100 200 300 400 500 600 0 100 200 300 400 500 600 2007 2008 2009 2010 2011 2012 2013 2014 new-well oil production per rig rig count New-well oil production per rig barrels/day Permian Rig count rigs (60) (50) (40) (30) (20) (10) 0 2007 2008 2009 2010 2011 2012 2013 2014 Legacy oil production change thousand barrels/day Permian (140) (120) (100) (80) (60) (40) (20) 0 2007 2008 2009 2010 2011 2012 2013 2014 Legacy gas production change million cubic feet/day PermianPermian 0 1,000 2,000 3,000 4,000 5,000 6,000 7,000 8,000 2007 2008 2009 2010 2011 2012 2013 2014 Permian Natural gas production million cubic feet/day 0 100 200 300 400 500 600 0 600 1,200 1,800 2,400 3,000 3,600 2007 2008 2009 2010 2011 2012 2013 2014 new-well gas production per rig rig count New-well gas production per rig thousand cubic feet/day Permian Rig count rigs drilling data through May projected production through July June 2014 Drilling Productivity Report Monthly additions from one average rig July barrels/day June barrels/day month over month Oil +2 Gas thousand cubic feet/day month over month +3 Permian million cubic feet/day month over month 298July thousand cubic feet/day June 295 134 132 thousand barrels/day month over month Oil +23 Gas +55 8
  • 9. U. S. Energy Information Administration | Drilling Productivity Report June 2014Explanatory notes Drilling Productivity Report The Drilling Productivity Report uses recent data on the total number of drilling rigs in operation along with estimates of drilling productivity and estimated changes in production from existing oil and natural gas wells to provide estimated changes in oil1 and natural gas2 production for six key regions. EIA’s approach does not distinguish between oil-directed rigs and gas-directed rigs because once a well is completed it may produce both oil and gas; more than half of the wells do that. Monthly additions from one average rig Monthly additions from one average rig represent EIA’s estimate of an average rig’s3 contribution to production of oil and natural gas from new wells.4 The estimation of new-well production per rig uses several months of recent historical data on total production from new wells for each field divided by the region's monthly rig count, lagged by two months.5 Current- and next-month values are listed on the top header. The month-over-month change is listed alongside, with +/- signs and color-coded arrows to highlight the growth or decline in oil (brown) or natural gas (blue). New-well oil/gas production per rig Charts present historical estimated monthly additions from one average rig coupled with the number of total drilling rigs as reported by Baker Hughes. Legacy oil and natural gas production change Charts present EIA’s estimates of total oil and gas production changes from all the wells other than the new wells. The trend is dominated by the well depletion rates, but other circumstances can influence the direction of the change. For example, well freeze-offs or hurricanes can cause production to significantly decline in any given month, resulting in a production increase the next month when production simply returns to normal levels. Projected change in monthly oil/gas production Charts present the combined effects of new-well production and changes to legacy production. Total new-well production is offset by the anticipated change in legacy production to derive the net change in production. The estimated change in production does not reflect external circumstances that can affect the actual rates, such as infrastructure constraints, bad weather, or shut-ins based on environmental or economic issues. Oil/gas production Charts present all oil and natural gas production from both new and legacy wells since 2007. This production is based on all wells reported to the state oil and gas agencies. Where state data are not immediately available, EIA estimates the production based on estimated changes in new-well oil/gas production and the corresponding legacy change. Footnotes: 1. Oil production represents both crude and condensate production from all formations in the region. Production is not limited to tight formations. The regions are defined by all selected counties, which include areas outside of tight oil formations. 2. Gas production represents gross (before processing) gas production from all formations in the region. Production is not limited to shale formations. The regions are defined by all selected counties, which include areas outside of shale formations. 3. The monthly average rig count used in this report is calculated from weekly data on total oil and gas rigs reported by Baker Hughes. 4. A new well is defined as one that began producing for the first time in the previous month. Each well belongs to the new-well category for only one month. Reworked and recompleted wells are excluded from the calculation. 5. Rig count data lag production data because EIA has observed that the best predictor of the number of new wells beginning production in a given month is the count of rigs in operation two months earlier. 9
  • 10. U. S. Energy Information Administration | Drilling Productivity Report June 2014Sources Drilling Productivity Report The data used in the preparation of this report come from the following sources. EIA is solely responsible for the analysis, calculations, and conclusions. Drilling Info (http://www.drillinginfo.com) Source of production, permit, and spud data for counties associated with this report. Source of real-time rig location to estimate new wells spudded and completed throughout the United States. Baker Hughes (http://www.bakerhughes.com) Source of rig and well counts by county, state, and basin. North Dakota Oil and Gas Division (https://www.dmr.nd.gov/oilgas) Source of well production, permit, and completion data in the counties associated with this report in North Dakota Railroad Commission of Texas (http://www.rrc.state.tx.us) Source of well production, permit, and completion data in the counties associated with this report in Texas Pennsylvania Department of Environmental Protection (https://www.paoilandgasreporting.state.pa.us/publicreports/Modules/Welcome/Welcome.aspx) Source of well production, permit, and completion data in the counties associated with this report in Pennsylvania West Virginia Department of Environmental Protection (http://www.dep.wv.gov/oil-and- gas/Pages/default.aspx) Source of well production, permit, and completion data in the counties associated with this report in West Virginia Colorado Oil and Gas Conservation Commission (http://cogcc.state.co.us) Source of well production, permit, and completion data in the counties associated with this report in Colorado Wyoming Oil and Conservation Commission (http://wogcc.state.wy.us ) Source of well production, permit, and completion data in the counties associated with this report in Wyoming Louisiana Department of Natural Resources (http://dnr.louisiana.gov) Source of well production, permit, and completion data in the counties associated with this report in Louisiana 10