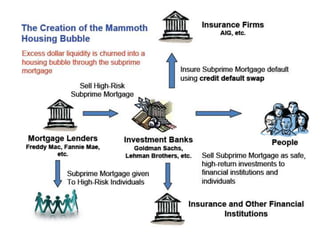
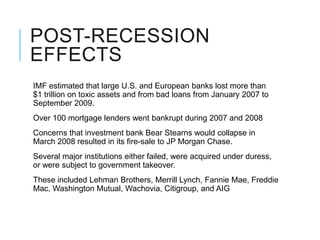
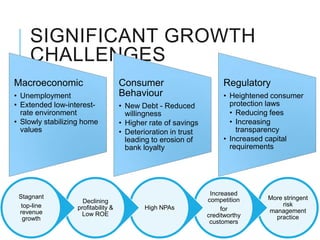
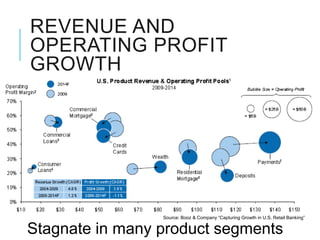
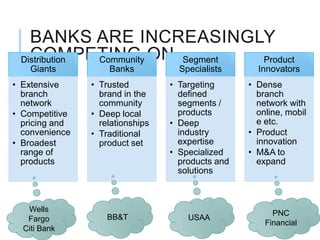
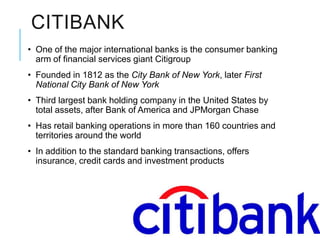
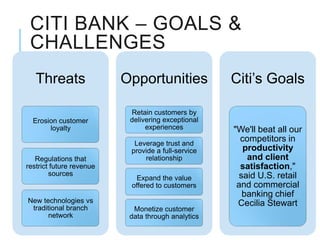
Presented by:
             Megha Bhalla – 11FN-063
             Rohil Mantri – 11FN-059
US BANKING   Prince Gupta – 11IB-044
             Abhijeet Datta – 11FN-002
    SYSTEM   Saurabh Bakshi - 11IB-052
             Saurabh Bansal - 11IB-053
             Sanket Mavlankar – 11FN-
             060
AGENDA
   History of US Banking and Regulations

    Market Size of US Banking industry

         Effects of Recession 2008

   Challenges and Outlook of US Banking

             About City Bank

          City Bank Performance

            City Bank Analysis
EFFECT OF THE 1930S
BANKING CRISIS
       Federal Deposit Insurance Corporation (FDIC) is created to insure
       deposits in banks. This helps to restore confidence in the banking
                                    system.


     Securities and Exchange Commission (SEC) is created to regulate the
                             securities industry.


     Banking and Securities Operations must be separated. Many banks
     gambled in the stock market and lost money during the stock market
                             collapse of 1929.


     Banks are not allowed to operate nor own banks outside of their state
            jurisdiction.This was to protect against systematic risk.


                        Start of Investment Banking Era
BANKING REGULATION banks
                             • Commercial
                                                                          that accept deposits
                                                                          required to obtain
                                                                          FDIC insurance and to
                                                                          have a primary federal
                                                                          regulator
                                            FDIC(nonmemb
                                            er state banks)             • Credit unions
                                                                          supervised by
                                                                          the National Credit
Regulation


              State
                                Federal
                                                                          UnionAdministration
                             Reserve(memb
                               ers state                                • The Federal Financial
                                banks)
                                                                          Institutions
                                                     Comptroller of       Examination
                Federal                             Currency(National
                                                         Banks)           Council(FFIEC)
                                                                          establishes uniform
                                                                          principles, standards,
    addresses privacy, disclosure, fraud prevention, anti-                and report forms for
  money laundering, anti-terrorism, anti-usury lending, and               the other agencies.
   the promotion of lending to lower-income populations.
REGULATORY BODIES

      • conduct the nation's monetary policy, supervise and
        regulate banking institutions, maintain the stability of the
        financial system and provide financial services
        to depository institutions, the U.S. government, and
        foreign official institutions


      • Provides deposit insurance, which guarantees the safety
        of deposits in member banks, up to $250,000
        per depositor per bank


      • serves to charter, regulate, and supervise all national
        banks and the federal branches and agencies of foreign
        banks in the United States
BASEL NORMS


             Basel-I      Basel-II      Basel-II.5   Basel-
                                                     III
http://www.pwc.lu/en/risk-management/docs/pwc-basel-III-a-risk-management-
perspective.pdf
TIMELINE
AN OVERVIEW OF BASEL-III
US Banking Industry


•The total size of US Banks with respect to the assets they hold is as shown.
US BANKING INDUSTRY
     TOP 10 US BANKS
US Banking Industry


It illustrates the striking increase in banking industry capitalization in
recent years, due to the issuance of new seasoned equity by many firms,
as well as in retained earnings.
This measure of industry capitalization reached 11.5 percent in 2012:Q2,
compared with a low of 6.2 percent in 2008:Q4.
THE 2008 SUBPRIME
MORTGAGE CRISIS
Led to the collapse of the United States housing bubble.
Failure or collapse of many of the United States' largest
financial institutions: Bear Stearns, Fannie Mae, Freddie
Mac, Lehman Brothers and AIG
Contributed to a global financial crisis, even as oil and food
prices soared
Crisis in the automobile industry
The government responded with an unprecedented $700
billion bank bailout and $787 billion fiscal stimulus package.
POST-RECESSION
EFFECTS
IMF estimated that large U.S. and European banks lost more than
$1 trillion on toxic assets and from bad loans from January 2007 to
September 2009.
Over 100 mortgage lenders went bankrupt during 2007 and 2008
Concerns that investment bank Bear Stearns would collapse in
March 2008 resulted in its fire-sale to JP Morgan Chase.
Several major institutions either failed, were acquired under duress,
or were subject to government takeover.
These included Lehman Brothers, Merrill Lynch, Fannie Mae, Freddie
Mac, Washington Mutual, Wachovia, Citigroup, and AIG
SIGNIFICANT GROWTH
     CHALLENGES
Macroeconomic                       Consumer                        Regulatory
• Unemployment                      Behaviour                       • Heightened consumer
• Extended low-interest-            • New Debt - Reduced              protection laws
  rate environment                    willingness                     • Reducing fees
• Slowly stabilizing home           • Higher rate of savings          • Increasing
  values                            • Deterioration in trust            transparency
                                      leading to erosion of         • Increased capital
                                      bank loyalty                    requirements


                                                                Increased
 Stagnant                                                                      More stringent
                    Declining                                  competition
  top-line                                                                          risk
                  profitability &          High NPAs                for
 revenue                                                                       management
                   Low ROE                                     creditworthy
   growth                                                                        practice
                                                                customers
REVENUE AND
OPERATING PROFIT
GROWTH


                 Source: Booz & Company “Capturing Growth in U.S. Retail Banking”


Stagnate in many product segments
BANKS ARE INCREASINGLY
   COMPETING ON Segment
 Distribution Community Product
    Giants          Banks           Specialists      Innovators
• Extensive     • Trusted         • Targeting      • Dense
  branch          brand in the      defined          branch
  network         community         segments /       network with
• Competitive   • Deep local        products         online, mobil
  pricing and     relationships   • Deep             e etc.
  convenience   • Traditional       industry       • Product
• Broadest        product set       expertise        innovation
  range of                        • Specialized    • M&A to
  products                          products and     expand
                                    solutions


   Wells                                                 PNC
   Fargo            BB&T              USAA
                                                       Financial
  Citi Bank
CITIBANK
• One of the major international banks is the consumer banking
  arm of financial services giant Citigroup
• Founded in 1812 as the City Bank of New York, later First
  National City Bank of New York
• Third largest bank holding company in the United States by
  total assets, after Bank of America and JPMorgan Chase
• Has retail banking operations in more than 160 countries and
  territories around the world
• In addition to the standard banking transactions, offers
  insurance, credit cards and investment products
CITIBANK- DURING
 RECESSION
• Citi reported losing $8–11 billion from the subprime mortgage crisis in
  the United States.
• On April 11, 2007, the parent Citi announced staff cuts and relocations.
• On November 4, 2007, Charles Prince quit as the chairman and chief
  executive of Citigroup. To be replaced by United States Secretary of
  the Treasury Robert Rubin.
• In August 2008, after a three-year investigation by California's Attorney
  General Citibank was ordered to repay the $14 million that was
  removed from 53,000 customers accounts over an 11-year period from
  1992 to 2003. The money was taken under a computerized "account
  sweeping program“.
• On November 23, 2008, Citigroup was forced to seek federal financing
  to avoid a collapse. The U.S. government provided $25 billion and
  guarantees to risky assets to Citigroup in exchange for stock.
• On January 16, 2009, Citigroup splitted into Citicorp and Citi Holdings
  Inc.
• On October 19, 2011, Citigroup agreed to $285 million civil fraud
  penalty.
CITI BANK – GOALS &
 CHALLENGES
   Threats                Opportunities             Citi’s Goals

                           Retain customers by
  Erosion customer         delivering exceptional
       loyalty                  experiences         "We'll beat all our
                            Leverage trust and
                                                      competitors in
                           provide a full-service      productivity
   Regulations that            relationship             and client
restrict future revenue                               satisfaction,"
        sources                                       said U.S. retail
                            Expand the value
                           offered to customers      and commercial
                                                       banking chief
New technologies vs                                  Cecilia Stewart
 traditional branch         Monetize customer
       network             data through analytics
FINANCIAL STATEMENT of dollars
                  In millions


                         Income Statement
                2009            2010        2011
Revenue         80285           86601       78353

Operating       47822           47375       50933
Expenses
Provision for   40262           26042       12796
credit losses

Net Income      (1606)          10602       11067
INCOME STATEMENT
100000
 90000
 80000
 70000
 60000
                              Revenue
 50000
                              Op expenses
 40000
                              Net Income
 30000
 20000
 10000
     0
-10000   2009   2010   2011
INCOME STATEMENT
100000

90000

80000

70000

60000

50000                                         2009
                                              2010
40000
                                              2011
30000

20000

10000

    0

-10000   Revenue   Op expenses   Net Income
FINANCIAL STATEMENT
                                           In billions of dollars
                         Balance Sheet

                 2009             2010         2011


Total Assets     1856.6           1913.9       1873.9

Total Deposits   835.9            845          865.9

Equity           152.7            163.5        177.8

Book value per   41.50            44.55        49.74
share
BALANCE SHEET
2500


2000


1500

                            Assets
                            Deposit
1000                        Equity


 500


   0
       2009   2010   2011
FINANCIAL RATIOS
                       2009     2010     2011


Tier 1 common ratio    9.60%    10.75%   11.80%


Tier 1 capital ratio   11.67%   12.91%   13.55%


Total capital ratio    15.25%   16.59%   16.99%


Leverage ratio         6.87%    6.60%    7.19%


Return on common       (9.4%)   6.8%     6.3%
average equity
RATIO
               Tier 1 common ratio
14

12

10

8                                    Tier 1 common ratio
6
                                     Linear (Tier 1 common
4                                    ratio)

2

0
      2009   2010         2011
REVENUE (SEGMENT-
       WISE)
                                In millions of dollars
                2009    2010               2011
North America   23615   33625              30161


EMEA            15084   11764              12265


Latin America   12711   12751              13552


Asia            14072   14436              15219
REVENUE (SEGMENT-
WISE)
35000
30000
25000
20000
15000
                                              2009
 10000                                        2010
  5000                                        2011

        0

             North
                      EMEA
            America           Latin
                                       Asia
                             America
CAMELS FOR CITI BANK
• The financial soundness indicators for the banking sector can be
  grouped according to six key areas of potential vulnerability known as
  CAMELS.
• Capital ratio, Asset quality, Management soundness, Earnings and
  profitability, Liquidity and Sensitivity.
   A. Capital Ratio
                              2011               2010
    Tier 1 Capital     13.55%             12.91%
    Ratio
    Total Capital      16.99%             16.59%
    Ratio
• Tier 1 Capital Ratio has improved to 13.55% from 12.91%, which is a
  positive sign for the bank
• Total Capital Ratio has improved marginally from 16.59% to 16.99%.
CAMELS FOR CITI BANK
  Asset Quality

                       2011           2010           % Change
       Net NPA’s to    7.175%         7.418%         -3.20%
       Net
       Advances
       Gross NPA       7.777%         7.911%         -1.72%
       to Total
       Gross Loans
• The level of NPAs is recognized as a critical indicator for assessing
  banks' credit risk, asset quality and efficiency in allocation of resources
  to productive sectors.
• Net NPA’s to Net Advances has declined marginally which is a good sign
  for the bank. Although it still is at a relatively high levels of 7.175%.
• Gross NPA’s to Total Gross Loans has reduced marginally from th
  previous year which is a positive sign for the bank.
CAMELS FOR CITI BANK
  Management Efficiency

        $million     2011          2010         % Change
        Profit per   42402         39685        6.85%
        employee
        Business per 5682233       5439292      4.46%
        employee


• The profit per employee has increased by 6.85%, while the business
  per employee has increased by 4.46%.
• The bank has shown marginal growth in the total advances and total
  deposits section which clearly underlines the management efficiency.
• The number of employees have been reduced slightly, thereby
  indicating the management’s willingness to cut costs during the times
CAMELS FOR CITI BANK
  Earnings and Profitability
       $million       2011          2010          % Change
       Non-interest   0.813         0.847         -4.06%
       expenses to
       gross
       income
       ROA/ROE        0.095         0.086         10.6%
• This ratio indicates the extent to which high non-interest expenses
  weakens earnings. The ratio of 0.813 is pretty high for the bank,
  although it has declined from the previous value of 0.847.
• ROA/ROE assesses scope for earnings to offset losses relative to capital
  or loan and asset portfolio. A relatively low ratio of 9.5% indicates the
  strong earnings capability of the bank and also the efficiency with which
  it performs, although it has increased from the previous year.
CAMELS FOR CITI BANK
  Liquidity

      $million      2011          2010           % Change
      Liquid assets 0.260         0.244          6.45%
      to Total
      assets
      Liquid assets 1.577         1.463          7.79%
      to short-term
      liabilities
• These ratios assess the vulnerability of the sector to loss of access to
  market sources of funding or a run on deposits. It assesses the
  liquidity available with the bank. The bank has shown a slight
  increase in these ratios over the previous year, which is a positive
  indication for the bank.
CAMELS FOR CITI BANK
  Sensitivity

       $million       2011           2010          % Change
       Interest Rate 187433          208911        10.2%
       Hedges
       Foreign        53796          56245         -4.3%
       Exchange
       Hedges
• It indicates the sensitivity of the bank to interest rate and foreign
  exchange risk.
• The bank has hedged its risk, which indicates the willingness of the
  bank to address sensitivity.
References:

•http://www.pwc.lu/en/risk-management/docs/pwc-basel-III-a-risk-
management-perspective.pdf

•http://www.federalreserve.gov/newsevents/press/bcreg/20060224aa.htm

•Booz & Company “Capturing Growth in U.S. Retail Banking”

•http://online.wsj.com/article/BT-CO-20120207-714503.html

•www.citibank.co.in/

•en.wikipedia.org/wiki/Citibank

Us banking system citi finale

  • 1.
    Presented by: Megha Bhalla – 11FN-063 Rohil Mantri – 11FN-059 US BANKING Prince Gupta – 11IB-044 Abhijeet Datta – 11FN-002 SYSTEM Saurabh Bakshi - 11IB-052 Saurabh Bansal - 11IB-053 Sanket Mavlankar – 11FN- 060
  • 2.
    AGENDA History of US Banking and Regulations Market Size of US Banking industry Effects of Recession 2008 Challenges and Outlook of US Banking About City Bank City Bank Performance City Bank Analysis
  • 3.
    EFFECT OF THE1930S BANKING CRISIS Federal Deposit Insurance Corporation (FDIC) is created to insure deposits in banks. This helps to restore confidence in the banking system. Securities and Exchange Commission (SEC) is created to regulate the securities industry. Banking and Securities Operations must be separated. Many banks gambled in the stock market and lost money during the stock market collapse of 1929. Banks are not allowed to operate nor own banks outside of their state jurisdiction.This was to protect against systematic risk. Start of Investment Banking Era
  • 4.
    BANKING REGULATION banks • Commercial that accept deposits required to obtain FDIC insurance and to have a primary federal regulator FDIC(nonmemb er state banks) • Credit unions supervised by the National Credit Regulation State Federal UnionAdministration Reserve(memb ers state • The Federal Financial banks) Institutions Comptroller of Examination Federal Currency(National Banks) Council(FFIEC) establishes uniform principles, standards, addresses privacy, disclosure, fraud prevention, anti- and report forms for money laundering, anti-terrorism, anti-usury lending, and the other agencies. the promotion of lending to lower-income populations.
  • 5.
    REGULATORY BODIES • conduct the nation's monetary policy, supervise and regulate banking institutions, maintain the stability of the financial system and provide financial services to depository institutions, the U.S. government, and foreign official institutions • Provides deposit insurance, which guarantees the safety of deposits in member banks, up to $250,000 per depositor per bank • serves to charter, regulate, and supervise all national banks and the federal branches and agencies of foreign banks in the United States
  • 6.
    BASEL NORMS Basel-I Basel-II Basel-II.5 Basel- III http://www.pwc.lu/en/risk-management/docs/pwc-basel-III-a-risk-management- perspective.pdf
  • 7.
  • 8.
    AN OVERVIEW OFBASEL-III
  • 9.
    US Banking Industry •Thetotal size of US Banks with respect to the assets they hold is as shown.
  • 10.
    US BANKING INDUSTRY TOP 10 US BANKS
  • 11.
    US Banking Industry Itillustrates the striking increase in banking industry capitalization in recent years, due to the issuance of new seasoned equity by many firms, as well as in retained earnings. This measure of industry capitalization reached 11.5 percent in 2012:Q2, compared with a low of 6.2 percent in 2008:Q4.
  • 12.
    THE 2008 SUBPRIME MORTGAGECRISIS Led to the collapse of the United States housing bubble. Failure or collapse of many of the United States' largest financial institutions: Bear Stearns, Fannie Mae, Freddie Mac, Lehman Brothers and AIG Contributed to a global financial crisis, even as oil and food prices soared Crisis in the automobile industry The government responded with an unprecedented $700 billion bank bailout and $787 billion fiscal stimulus package.
  • 14.
    POST-RECESSION EFFECTS IMF estimated thatlarge U.S. and European banks lost more than $1 trillion on toxic assets and from bad loans from January 2007 to September 2009. Over 100 mortgage lenders went bankrupt during 2007 and 2008 Concerns that investment bank Bear Stearns would collapse in March 2008 resulted in its fire-sale to JP Morgan Chase. Several major institutions either failed, were acquired under duress, or were subject to government takeover. These included Lehman Brothers, Merrill Lynch, Fannie Mae, Freddie Mac, Washington Mutual, Wachovia, Citigroup, and AIG
  • 15.
    SIGNIFICANT GROWTH CHALLENGES Macroeconomic Consumer Regulatory • Unemployment Behaviour • Heightened consumer • Extended low-interest- • New Debt - Reduced protection laws rate environment willingness • Reducing fees • Slowly stabilizing home • Higher rate of savings • Increasing values • Deterioration in trust transparency leading to erosion of • Increased capital bank loyalty requirements Increased Stagnant More stringent Declining competition top-line risk profitability & High NPAs for revenue management Low ROE creditworthy growth practice customers
  • 16.
    REVENUE AND OPERATING PROFIT GROWTH Source: Booz & Company “Capturing Growth in U.S. Retail Banking” Stagnate in many product segments
  • 17.
    BANKS ARE INCREASINGLY COMPETING ON Segment Distribution Community Product Giants Banks Specialists Innovators • Extensive • Trusted • Targeting • Dense branch brand in the defined branch network community segments / network with • Competitive • Deep local products online, mobil pricing and relationships • Deep e etc. convenience • Traditional industry • Product • Broadest product set expertise innovation range of • Specialized • M&A to products products and expand solutions Wells PNC Fargo BB&T USAA Financial Citi Bank
  • 18.
    CITIBANK • One ofthe major international banks is the consumer banking arm of financial services giant Citigroup • Founded in 1812 as the City Bank of New York, later First National City Bank of New York • Third largest bank holding company in the United States by total assets, after Bank of America and JPMorgan Chase • Has retail banking operations in more than 160 countries and territories around the world • In addition to the standard banking transactions, offers insurance, credit cards and investment products
  • 19.
    CITIBANK- DURING RECESSION •Citi reported losing $8–11 billion from the subprime mortgage crisis in the United States. • On April 11, 2007, the parent Citi announced staff cuts and relocations. • On November 4, 2007, Charles Prince quit as the chairman and chief executive of Citigroup. To be replaced by United States Secretary of the Treasury Robert Rubin. • In August 2008, after a three-year investigation by California's Attorney General Citibank was ordered to repay the $14 million that was removed from 53,000 customers accounts over an 11-year period from 1992 to 2003. The money was taken under a computerized "account sweeping program“. • On November 23, 2008, Citigroup was forced to seek federal financing to avoid a collapse. The U.S. government provided $25 billion and guarantees to risky assets to Citigroup in exchange for stock. • On January 16, 2009, Citigroup splitted into Citicorp and Citi Holdings Inc. • On October 19, 2011, Citigroup agreed to $285 million civil fraud penalty.
  • 20.
    CITI BANK –GOALS & CHALLENGES Threats Opportunities Citi’s Goals Retain customers by Erosion customer delivering exceptional loyalty experiences "We'll beat all our Leverage trust and competitors in provide a full-service productivity Regulations that relationship and client restrict future revenue satisfaction," sources said U.S. retail Expand the value offered to customers and commercial banking chief New technologies vs Cecilia Stewart traditional branch Monetize customer network data through analytics
  • 21.
    FINANCIAL STATEMENT ofdollars In millions Income Statement 2009 2010 2011 Revenue 80285 86601 78353 Operating 47822 47375 50933 Expenses Provision for 40262 26042 12796 credit losses Net Income (1606) 10602 11067
  • 22.
    INCOME STATEMENT 100000 90000 80000 70000 60000 Revenue 50000 Op expenses 40000 Net Income 30000 20000 10000 0 -10000 2009 2010 2011
  • 23.
    INCOME STATEMENT 100000 90000 80000 70000 60000 50000 2009 2010 40000 2011 30000 20000 10000 0 -10000 Revenue Op expenses Net Income
  • 24.
    FINANCIAL STATEMENT In billions of dollars Balance Sheet 2009 2010 2011 Total Assets 1856.6 1913.9 1873.9 Total Deposits 835.9 845 865.9 Equity 152.7 163.5 177.8 Book value per 41.50 44.55 49.74 share
  • 25.
    BALANCE SHEET 2500 2000 1500 Assets Deposit 1000 Equity 500 0 2009 2010 2011
  • 26.
    FINANCIAL RATIOS 2009 2010 2011 Tier 1 common ratio 9.60% 10.75% 11.80% Tier 1 capital ratio 11.67% 12.91% 13.55% Total capital ratio 15.25% 16.59% 16.99% Leverage ratio 6.87% 6.60% 7.19% Return on common (9.4%) 6.8% 6.3% average equity
  • 27.
    RATIO Tier 1 common ratio 14 12 10 8 Tier 1 common ratio 6 Linear (Tier 1 common 4 ratio) 2 0 2009 2010 2011
  • 28.
    REVENUE (SEGMENT- WISE) In millions of dollars 2009 2010 2011 North America 23615 33625 30161 EMEA 15084 11764 12265 Latin America 12711 12751 13552 Asia 14072 14436 15219
  • 29.
    REVENUE (SEGMENT- WISE) 35000 30000 25000 20000 15000 2009 10000 2010 5000 2011 0 North EMEA America Latin Asia America
  • 30.
    CAMELS FOR CITIBANK • The financial soundness indicators for the banking sector can be grouped according to six key areas of potential vulnerability known as CAMELS. • Capital ratio, Asset quality, Management soundness, Earnings and profitability, Liquidity and Sensitivity. A. Capital Ratio 2011 2010 Tier 1 Capital 13.55% 12.91% Ratio Total Capital 16.99% 16.59% Ratio • Tier 1 Capital Ratio has improved to 13.55% from 12.91%, which is a positive sign for the bank • Total Capital Ratio has improved marginally from 16.59% to 16.99%.
  • 31.
    CAMELS FOR CITIBANK Asset Quality 2011 2010 % Change Net NPA’s to 7.175% 7.418% -3.20% Net Advances Gross NPA 7.777% 7.911% -1.72% to Total Gross Loans • The level of NPAs is recognized as a critical indicator for assessing banks' credit risk, asset quality and efficiency in allocation of resources to productive sectors. • Net NPA’s to Net Advances has declined marginally which is a good sign for the bank. Although it still is at a relatively high levels of 7.175%. • Gross NPA’s to Total Gross Loans has reduced marginally from th previous year which is a positive sign for the bank.
  • 32.
    CAMELS FOR CITIBANK Management Efficiency $million 2011 2010 % Change Profit per 42402 39685 6.85% employee Business per 5682233 5439292 4.46% employee • The profit per employee has increased by 6.85%, while the business per employee has increased by 4.46%. • The bank has shown marginal growth in the total advances and total deposits section which clearly underlines the management efficiency. • The number of employees have been reduced slightly, thereby indicating the management’s willingness to cut costs during the times
  • 33.
    CAMELS FOR CITIBANK Earnings and Profitability $million 2011 2010 % Change Non-interest 0.813 0.847 -4.06% expenses to gross income ROA/ROE 0.095 0.086 10.6% • This ratio indicates the extent to which high non-interest expenses weakens earnings. The ratio of 0.813 is pretty high for the bank, although it has declined from the previous value of 0.847. • ROA/ROE assesses scope for earnings to offset losses relative to capital or loan and asset portfolio. A relatively low ratio of 9.5% indicates the strong earnings capability of the bank and also the efficiency with which it performs, although it has increased from the previous year.
  • 34.
    CAMELS FOR CITIBANK Liquidity $million 2011 2010 % Change Liquid assets 0.260 0.244 6.45% to Total assets Liquid assets 1.577 1.463 7.79% to short-term liabilities • These ratios assess the vulnerability of the sector to loss of access to market sources of funding or a run on deposits. It assesses the liquidity available with the bank. The bank has shown a slight increase in these ratios over the previous year, which is a positive indication for the bank.
  • 35.
    CAMELS FOR CITIBANK Sensitivity $million 2011 2010 % Change Interest Rate 187433 208911 10.2% Hedges Foreign 53796 56245 -4.3% Exchange Hedges • It indicates the sensitivity of the bank to interest rate and foreign exchange risk. • The bank has hedged its risk, which indicates the willingness of the bank to address sensitivity.
  • 36.
    References: •http://www.pwc.lu/en/risk-management/docs/pwc-basel-III-a-risk- management-perspective.pdf •http://www.federalreserve.gov/newsevents/press/bcreg/20060224aa.htm •Booz & Company“Capturing Growth in U.S. Retail Banking” •http://online.wsj.com/article/BT-CO-20120207-714503.html •www.citibank.co.in/ •en.wikipedia.org/wiki/Citibank

Editor's Notes

  • #4 Shadow banks2are financial institutions that developed mainly after World War II in the UnitedStates.3 Those institutions behave as if they are banks issuing liabilities that areperceived by investors to be as safe and liquid as traditional demand deposits, andthey are less regulated than depository institutions.
  • #16 Source: Booz & Company “Capturing Growth in U.S. Retail Banking”
  • #18 Source : http://online.wsj.com/article/BT-CO-20120207-714503.html
  • #21 Experience Radar can help you:• Develop products and services that matter to customers• Figure out whom to target and how to market experience-basedofferings• Set yourself apart in an increasingly competitive environment• Connect the dots between customer value and sustainablefi nancial performance• Attain top-of-wallet status with your customers