Call Girls Service Nagpur Maya Call 7001035870 Meet With Nagpur Escorts
unum group Q305_Recon
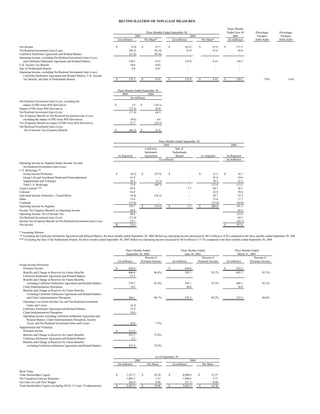
1. RECONCILIATION OF NON-GAAP MEASURES
Three Months
Three Months Ended September 30 Ended June 30 Percentage Percentage
2005 2004 2005 Variance Variance
(in millions) Per Share* (in millions) Per Share* (in millions) 3Q05/3Q04 3Q05/2Q05
Net Income $ 52.6 $ 0.17 $ 167.6 $ 0.55 $ 171.3
Net Realized Investment Gain (Loss) (46.3) (0.14) 41.8 0.14 42.6
California Settlement Agreement and Related Matters (51.6) (0.16) - - -
Operating Income, excluding Net Realized Investment Gain (Loss)
and California Settlement Agreement and Related Matters 150.5 0.47 125.8 0.41 128.7
U.K. Income Tax Benefit 10.8 0.03 - - -
Sale of Netherlands Branch 4.0 0.01 - - -
Operating Income, excluding Net Realized Investment Gain (Loss),
California Settlement Agreement and Related Matters, U.K. Income
Tax Benefit, and Sale of Netherlands Branch $ 135.7 $ 0.43 $ 125.8 $ 0.41 $ 128.7 7.9% 5.4%
Three Months Ended September 30
2005 2004
(in millions)
Net Realized Investment Gain (Loss), excluding the
impact of DIG Issue B36 Derivatives $ 1.9 $ (19.3)
Impact of DIG Issue B36 Derivatives (73.3) 83.8
Net Realized Investment Gain (Loss) (71.4) 64.5
Tax (Expense) Benefit on Net Realized Investment Gain (Loss),
excluding the impact of DIG Issue B36 Derivatives (0.6) 6.6
Tax (Expense) Benefit on impact of DIG Issue B36 Derivatives 25.7 (29.3)
Net Realized Investment Gain (Loss),
Net of Income Tax (Expense) Benefit $ (46.3) $ 41.8
Three Months Ended September 30
2005 2004
California Sale of
Settlement Netherlands
As Reported Agreement Branch As Adjusted As Reported
(in millions) (in millions)
Operating Income by Segment before Income Tax and
Net Realized Investment Gain (Loss)
U.S. Brokerage **
Group Income Protection $ (6.2) $ (37.4) $ - $ 31.2 $ 16.7
Group Life and Accidental Death and Dismemberment 41.9 - - 41.9 54.6
Supplemental and Voluntary 36.2 (3.3) - 39.5 42.2
Total U.S. Brokerage 71.9 (40.7) - 112.6 113.5
Unum Limited *** 49.8 - 5.7 44.1 38.1
Colonial 42.0 - - 42.0 39.6
Individual Income Protection - Closed Block (4.6) (34.3) - 29.7 33.2
Other 13.6 - - 13.6 11.7
Corporate (33.0) - - (33.0) (44.8)
Operating Income by Segment 139.7 $ (75.0) $ 5.7 $ 209.0 191.3
Income Tax Expense (Benefit) on Operating Income 40.8 65.5
Operating Income, Net of Income Tax 98.9 125.8
Net Realized Investment Gain (Loss) (71.4) 64.5
Income Tax (Expense) Benefit on Net Realized Investment Gain (Loss) 25.1 (22.7)
Net Income $ 52.6 $ 167.6
* Assuming Dilution
** Excluding the California Settlement Agreement and Related Matters, the three months ended September 30, 2005 Before-tax Operating Income decreased by $0.9 million or 0.8% compared to the three months ended September 30, 2004
*** Excluding the Sale of the Netherlands Branch, the three months ended September 30, 2005 Before-tax Operating Income increased by $6.0 million or 15.7% compared to the three months ended September 30, 2004.
Three Months Ended Three Months Ended Three Months Ended
September 30, 2005 June 30, 2005 March 31, 2005
Percent of Percent of Percent of
(in millions) Premium Income (in millions) Premium Income (in millions) Premium Income
Group Income Protection
Premium Income $ 626.0 $ 636.8 $ 635.4
Benefits and Change in Reserves for Future Benefits 606.0 96.8% 595.1 93.5% 605.5 95.3%
California Settlement Agreement and Related Matters 27.3 - -
Benefits and Change in Reserves for Future Benefits,
excluding California Settlement Agreement and Related Matters 578.7 92.4% 595.1 93.5% 605.5 95.3%
Claim Implementation Disruption 14.6 20.6 30.0
Benefits and Change in Reserves for Future Benefits,
excluding California Settlement Agreement and Related Matters
and Claim Implementation Disruption 564.1 90.1% 574.5 90.2% 575.5 90.6%
Operating Loss before Income Tax and Net Realized Investment
Gains and Losses (6.2)
California Settlement Agreement and Related Matters 37.4
Claim Implementation Disruption 14.6
Operating Income excluding California Settlement Agreement and
Related Matters, Claim Implementation Disruption, Income
Taxes, and Net Realized Investment Gains and Losses 45.8 7.3%
Supplemental and Voluntary
Premium Income $ 311.6
Benefits and Change in Reserves for Future Benefits 235.7 75.6%
California Settlement Agreement and Related Matters 2.3
Benefits and Change in Reserves for Future Benefits,
excluding California Settlement Agreement and Related Matters 233.4 74.9%
As of September 30
2005 2004
(in millions) Per Share (in millions) Per Share
Book Value
Total Stockholders' Equity $ 7,237.7 $ 24.29 $ 6,900.4 $ 23.27
Net Unrealized Gain on Securities 1,005.2 3.37 1,099.6 3.71
Net Gain on Cash Flow Hedges 285.0 0.96 237.3 0.80
Total Stockholders' Equity (excluding SFAS 115 and 133 adjustments) $ 5,947.5 $ 19.96 $ 5,563.5 $ 18.76