SlideShare a Scribd company logo
Unmet basic needs and health intervention effectiveness in
low-income populations
Matthew W. Kreuter a,
⁎, Amy McQueen b
, Sonia Boyum a
, Qiang Fu c
a
Washington University, School of Social Work, Campus Box 1196, 1 Brookings Dr., St. Louis, MO 63130, United States
b
Washington University, School of Medicine, Campus Box 8005, 4523 Clayton Ave., St. Louis, MO 63110, United States
c
Saint Louis University, College for Public Health and Social Justice, Salus Center Room 480, 3545 Lafayette Ave., St. Louis, MO 63104, United States
a b s t r a c ta r t i c l e i n f o
Article history:
Received 13 November 2015
Received in revised form 20 April 2016
Accepted 2 August 2016
Available online 03 August 2016
In the face of unmet basic needs, low SES adults are less likely to obtain needed preventive health services. The
study objective was to understand how these hardships may cluster and how the effectiveness of different
health-focused interventions might vary across vulnerable population sub-groups with different basic needs pro-
files. From June 2010–2012, a random sample of low-income adult callers to Missouri 2-1-1 completed a cancer
risk assessment and received up to 3 health referrals for needed services (mammography, pap testing, colonos-
copy, HPV vaccination, smoking cessation and smoke-free home policies). Participants received either a verbal
referral only (N = 365), verbal referral + tailored print reminder (N = 372), or verbal referral + navigator
(N = 353). Participants reported their unmet basic needs at baseline and contacts with health referrals at 1-
month post-intervention. We examined latent classes of unmet basic needs using SAS. Logistic regression exam-
ined the association between latent classes and contacting a health referral, by intervention condition. A 3 class
solution best fit the data. For participants with relatively more unmet needs (C2) and those with money needs
(C3), the navigator intervention was more effective than the tailored or verbal referral only conditions in leading
to health referrals contacts. For participants with fewer unmet basic needs (C1), the tailored intervention was as
effective as the navigator intervention. The distribution and nature of unmet basic needs in this sample of low-
income adults was heterogeneous, and those with the greatest needs benefitted most from a more intensive nav-
igator intervention in helping them seek needed preventive health services.
© 2016 Elsevier Inc. All rights reserved.
Keywords:
Intervention studies
Telephone navigator
Tailored print reminder
Low-income population
Cancer prevention and control
Health referrals
1. Introduction
Poverty has a negative effect on health outcomes (Fiscella and
Williams, 2004; DeFur et al., 2007; Harper and Lynch, 2007; Goldman
and Smith, 2002), even after accounting for health risk behaviors that
are more prevalent in low SES populations (Lantz et al., 2001). Although
poverty is most often measured with monetary indicators like income
and income-to-needs ratios (McDonough et al., 2005), multidimension-
al measurement approaches that consider deprivation across multiple
life domains and cumulative hardship provide a richer, more accurate
representation of poverty (DeWilde, 2004).
Among these alternative indicators are so-called “basic needs” like
adequate housing, food security, personal and neighborhood safety,
ability to pay bills and possession of essential material goods. Controlling
for income, education, and other demographic characteristics, having
greater unmet basic needs is associated with declining physical function-
ing, increased depression and mortality, and being “high cost users” of
health care services (Blazer et al., 2005; Sachs-Ericsson et al., 2006;
Blazer et al., 2007; Fitzpatrick et al., 2015).
There are 46.7 million people in poverty in the U.S. (U.S. Census
Bureau, 2015), and although there is currently no national surveillance
system for basic needs, a similar number (49 million) are classified as
food insecure (Feeding America, n.d.) and over half of those in poverty
(52%) are classified as having “severe housing cost burden”, defined as
spending N50% of their income on housing (Desmond, 2015).
There is variability in how unmet basic needs are experienced by vul-
nerable populations and the degree to which specific basic needs are as-
sociated with income-based indicators of poverty as well as health
outcomes. For example, even among those within the same income-to-
needs ratio category, the types and patterns of unmet basic needs report-
ed differ by family structure and other characteristics (Mayer and Jencks,
1989). And while some basic needs like food security and paying bills are
strongly associated with monetary definitions of poverty, other needs like
quality housing and neighborhood safety are less strongly associated
(Iceland and Bauman, 2007). Food insecurity is also strongly associated
with high cost health care utilization (Fitzpatrick et al., 2015).
Preventive Medicine 91 (2016) 70–75
⁎ Corresponding author at: Health Communication Research Lab, Brown School of
Social Work, Washington University, Campus Box 1196, 1 Brookings Dr., St. Louis, MO
63130, United States.
E-mail addresses: mkreuter@wustl.edu (M.W. Kreuter), amcqueen@dom.wustl.edu
(A. McQueen), sboyum@wustl.edu (S. Boyum), qjfu@slu.edu (Q. Fu).
http://dx.doi.org/10.1016/j.ypmed.2016.08.006
0091-7435/© 2016 Elsevier Inc. All rights reserved.
Contents lists available at ScienceDirect
Preventive Medicine
journal homepage: www.elsevier.com/locate/ypmed
Given the impact of unmet basic needs on health outcomes and the
heterogeneity of unmet basic needs experienced by low-income popu-
lations, the objective of this study was to understand how these
hardships may cluster and how the effectiveness of different health-
focused interventions might vary across vulnerable population sub-
groups with different basic needs profiles. This secondary analysis of a
unique prospective intervention study addresses both questions.
2. Methods
The Institutional Review Board at Washington University in St. Louis
approved this study. The parent study that provided the data for this
secondary analysis is registered in ClinicalTrials.gov (#NCT01027741).
2.1. Study setting
The study took place at United Way 2-1-1 Missouri, a telephone in-
formation and referral helpline that serves 99 of 114 counties in the
state and received 160,000 calls in 2013. 2-1-1 is a federally designated
dialing code (like 9-1-1 for emergency services) that links callers to
health and social services in their community (Daily, 2012). Callers are
predominantly poor and seeking help with basic needs like paying util-
ity bills and getting food (Kreuter, 2012; Thompson et al., 2016). Al-
though relatively few callers contact 2-1-1 about health services,
studies have shown that the health needs of 2-1-1 callers greatly exceed
those of the general population (Purnell et al., 2012; Kreuter et al., 2012;
Eddens et al., 2011).
2.2. Study sample and recruitment
From June 2010 to June 2012, after receiving standard service, a ran-
dom sample of callers to 2-1-1 Missouri was selected to participate in a
surveillance phase of the project by completing a brief health risk as-
sessment. Of these, 10,472 callers (58%) were eligible for the risk assess-
ment (age ≥ 18, living in Missouri, English-speaking, calling with a
service request for themselves, willing to provide date of birth and gen-
der, not currently in extreme crisis). Nearly all of these (95%; n = 9947)
were invited to take the risk assessment and 4761 (48%) completed it.
Completers with at least one prevention need (n = 3816) were invited
to participate in the trial phase of the project, a longitudinal intervention
study. Those who agreed, consented and completed a baseline assess-
ment (n = 1521; 40%) were then randomized to one of three study
groups. Participants who also completed the 1-month follow up (n =
1090; 72%) comprise the analysis sample.
Drop-out rates did not differ by study group, nor were drop-outs dif-
ferent from completers in experiencing any of the seven unmet basic
needs. They were younger (39.7 vs. 43.9 years) and more likely to be
poor (62% vs. 55% income b$10K/year), employed (29% vs. 19%) and
have a child at home (63% vs. 51%). Additional details of the study de-
sign and methods are available in a previous report (Kreuter et al.,
2012).
2.3. Risk assessment to identify prevention needs
Items from the 2008 Behavioral Risk Factor Surveillance System
were used to assess needs for mammography, Pap testing, colonoscopy,
HPV vaccination for self and daughter, smoking cessation and smoke
free home policies, recommended prevention behaviors that are avail-
able for free or low cost to low-income populations in most states. Re-
ferrals were offered to women ages 40 and older who had no
mammogram in the last year; women ages 18 and older who had no
Pap test with the last two years1
; men and women ages 50 and older
who had no colonoscopy in the last 10 years; women ages 18–26 and
those with a female child ages 9–17 years old living in their home
who had not received the HPV vaccination; current smokers; and
those without a total ban on smoking in their household. Prevention re-
ferrals were limited to three per caller consistent with standard 2-1-1
procedure.
If a caller had more than three needs, a prioritization algorithm de-
termined which health referrals he or she received. In descending
order, the priorities were: colonoscopy, mammography, HPV vaccine
for self or girl in home, Pap test, smoking cessation, and smoke free
home policy. This order was set to maximize statistical power for each
health outcome based on the expected proportion of the sample (from
lowest to highest) that would need the referral, not on the public health
importance or the strength of evidence for the recommended cancer
control measure.
2.4. Interventions
Participants were randomized to one of three intervention groups.
Of those who completed the baseline and 1 month follow up, 365
(34%) received verbal referral only, 372 (34%) received verbal
referral + tailored print reminder, and 353 (32%) received verbal
referral + navigation.
2.4.1. Verbal referral
Based on each caller's responses to the risk assessment questions, a
computer algorithm identified and prioritized their prevention needs,
which were addressed moments later by a 2-1-1 information specialist
who delivered a scripted referral (Kreuter et al., 2012). Referrals
consisted of three parts: (Fiscella and Williams, 2004) risk assessment
feedback (e.g., “You said you've never had a mammogram”); (DeFur et
al., 2007) recommended action and importance (e.g., “Once you turn 40,
getting a mammogram every 1 to 2 years is the best way to fight breast
cancer. Mammograms can find breast cancer when it's easier to treat
and cure”); and, (Harper and Lynch, 2007) offer of referral to a free or
low-cost service (e.g., “There's a good chance you can get a free mam-
mogram through a program called Show Me Healthy Women. Would
you like the phone number for that program?”). For each accepted refer-
ral, the information specialist identified the closest service provider to
the caller's residence and verbally shared the referral phone number
and/or address, information about its hours of operation, and documen-
tation that may be required to obtain services.
2.4.2. Tailored print reminder
Within one working day of receiving the verbal referral,
participants in this group were mailed a printed tailored reminder
(4-page full color booklet) of the health referral they received. The
reminder consisted of: (Fiscella and Williams, 2004) a short personal
story tailored to the problem that led the participant to call 2-1-1 and
the prevention referral to which the participant has been referred
(i.e., modeling (Lemelin et al., 2009)); (DeFur et al., 2007) an accom-
panying matched photo personalized to the participant's age, race,
and gender; (Harper and Lynch, 2007) action details providing a
clear and simple summary of information the caller would need to
access the prevention referral(s); and (Goldman and Smith, 2002)
motivation and preparation information describing why the
preventive health service was important and suggesting questions
to ask when contacting the referral. All content adhered to health
literacy and health communication best practices, and was written
at a Flesch-Kincaid 4th Grade Level. The tailored personal story
addressed up to three cancer-control needs.
2.4.3. Navigator/health coach
Navigators (called “coaches” to participants) explained each
needed preventive health service and its importance, answered
callers' questions, elicited and addressed barriers to action with a
1
Recommendations for Pap testing changed during the study period. In the first four
months of recruitment, women ages 18–26 were offered referrals if they had not Pap test
in the last year.
71M.W. Kreuter et al. / Preventive Medicine 91 (2016) 70–75
variety of strategies including arranging transportation, making
appointments, and providing verbal reminders to the participant.
Two women similar in age to the average 2-1-1 caller were given
extensive training by a counseling psychologist and a social worker
who had previously worked as a navigator. Training consisted of
mastering health content for the six focus areas, problem-solving
techniques, counseling concepts and approaches, and research
protocol and documentation. Many cycles of rehearsal and feedback
preceded the launch of the intervention, after which navigator calls
were recorded, monitored and discussed.
Participants received their first navigator call within one working
day of completing the baseline assessment and receiving the verbal
referral. The initial call introduced the navigator, explained the
navigation relationship and sought to establish rapport. Then a
flyer was mailed to the participant containing the name, picture
and contact information for their navigator. The navigator re-
contacted the participant soon after to ensure receipt of the flyer
and follow up on any issues since their initial conversation.
Telephone interactions continued for up to four months with the
number, length and frequency of calls determined by participants'
needs, interest and willingness. Either navigator or participant
could initiate a call. On average, participants engaged in three calls
with a navigator (M = 3.1, SD = 1.8), which lasted slightly longer
than five minutes each (M = 16.2 min total, SD = 31.5).
3. Measures
3.1. Unmet basic needs
The baseline survey assessed participants' perceived likelihood that
their safety, housing, food, and financial needs would be met in the
next month. These items were adapted from Segal's (Segal et al.,
1993) Personal Empowerment scale and another scale developed by
Blazer (Blazer et al., 2005). Five questions beginning with: “How likely
is it that…” included “…someone will threaten to hurt you physically
in the next month?”, “…you will have a place to stay all of next
month?”, “…you and others in your home will get enough to eat in
the next month?”, “…you will have enough money in the next month
for necessities like food, shelter and clothing?”, and “…you will have
enough money in the next month to deal with unexpected expenses?”
(1 = very unlikely to 4 = very likely). Participants were also asked to
rate the safety of their neighborhood (1 = very unsafe to 4 = very
safe) and the amount of space in their home given the number of people
living there (1 = not enough living space, 2 = about the right amount,
3 = more than enough). From these items, we created seven dichoto-
mous variables. If a need was very unlikely or unlikely to be met in
the next month, it was considered unmet (0), otherwise it was consid-
ered met (Fiscella and Williams, 2004); living in an “unsafe” or “very
unsafe” neighborhood and reporting “not enough living space” were
also considered unmet (0) basic needs.
3.2. Contacting referrals
At 1 month follow-up, participants were asked if they remembered
receiving a health referral (yes/no/don't remember). Those who re-
membered were asked if they had contacted any of the specific health
referral(s) they received (yes/no/don't remember). Those who did not
remember receiving a health referral were considered to have not
contacted any referrals.
3.3. Covariates
Participants' gender, race/ethnicity, education, marital status, in-
come, employment status and general health status were obtained at
baseline (Table 1). For ease of LCA interpretation, many variables were
dichotomized (e.g., self-rated health: very good/excellent vs good/fair/
poor).
3.4. Reasons for calling 2-1-1
For each participant, up to 3 reasons for calling 2-1-1 were recorded.
Reasons were collapsed into eight categories: utilities, rent/mortgage,
housing, food assistance, employment, home and family, health, and
other.
3.5. Data analyses
Analyses were conducted March–July 2015. Latent class analysis
(LCA) is used to find groups of cases in multivariate categorical data
(Lanza and Rhoades, 2013). We used a two-step approach for the anal-
ysis. First, we examined whether the sample was heterogeneous with
regard to participant's basic needs using a LCA. The LCA was based on
the seven dichotomous measures of unmet basic needs. PROC LCA in
SAS v9.2 was used to estimate a series of latent class models from 2 to
4 classes to identify distinct subgroups of participants with different
basic needs. Akaike Information Criterion (AIC) and the sample-size
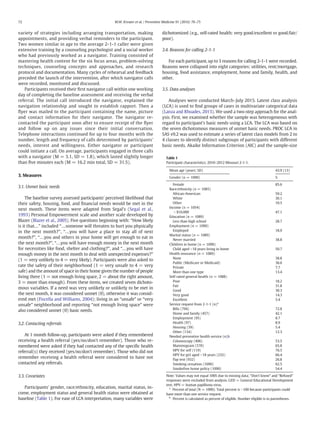
Table 1
Participant characteristics; 2010–2012 Missouri 2-1-1.
Mean age (years; SD) 43.9 (13)
Gender (n = 1090) %
Female 85.6
Race/ethnicity (n = 1085)
African-American 59.2
White 30.1
Other 10.5
Income (n = 1054)
b $10,000 47.1
Education (n = 1089)
Less than high school 28.7
Employment (n = 1090)
Employed 18.9
Marital status (n = 1089)
Never married 38.8
Children in home (n = 1090)
Child aged b18 years living in home 50.7
Health insurance (n = 1089)
None 38.8
Public (Medicare or Medicaid) 36.6
Private 7.7
More than one type 13.4
Self-rated general health (n = 1088)
Poor 18.2
Fair 31.8
Good 30.3
Very good 14.3
Excellent 5.4
Service request from 2‐1-1 (n)a
Bills (794) 72.8
Home and family (457) 42.1
Employment (95) 8.7
Health (97) 8.9
Housing (59) 5.4
Other (134) 12.3
Needed preventive health service (n)b
Colonoscopy (406) 53.5
Mammogram (570) 65.8
HPV for self (119) 76.5
HPV for girl aged b18 years (232) 66.4
Pap test (932) 26.8
Smoking cessation (1090) 62.5
Smokefree home policy (1090) 54.4
Note: Values may not equal 100% due to missing data; “Don't know” and “Refused”
responses were excluded from analysis. GED = General Educational Development
test; HPV = human papilloma virus.
a
Percent of total (N = 1090). Total percent is N100 because participants could
have more than one service request.
b
Percent is calculated as percent of eligible. Number eligible is in parentheses.
72 M.W. Kreuter et al. / Preventive Medicine 91 (2016) 70–75
adjusted Bayesian Information Criterion (BIC) were calculated. A lower
AIC or BIC value suggests a better fitting and more parsimonious model.
After determining the optimal number of latent classes based on both fit
indices and the conceptual interpretability of each class solution, the fol-
lowing covariates were added to the LCA model: gender, income, race,
age, education, employment status, having a child in the home, marital
status (never married vs. ever married), and self-rated health. Non-sig-
nificant covariates were removed from the final model. Similar to a mul-
tinomial regression model, the LCA regresses the probability of class
membership on each covariate. Beta coefficient tests for predicting la-
tent class membership by covariates and odds ratios and 95% confidence
intervals were calculated.
Second, participants were classified into one of the subgroups
resulting from the LCA and we examined descriptive statistics by class.
For each latent class separately, chi-square analyses were used to exam-
ine the association between calling a referral and study group. Then we
estimated a binary logistic regression model predicting the probability
of calling any health referral by latent class assignment, intervention
group (verbal referral only, verbal referral + tailored reminder, verbal
referral + navigation), and the interaction between the two variables.
Odds ratios (OR) and 95% confidence intervals (CI) of the interaction
are reported.
4. Results
4.1. Participant characteristics
Participant characteristics did not significantly differ across the three
intervention groups. Participant characteristics are shown in Table 1;
most participants were women, African American or White, and report-
ed very low income. Participants' mean age was 43.9 years. Most partic-
ipants had called 2-1-1 seeking help with bills (73%) and/or home and
family needs like food, clothing, and household goods (42%). Rates of
unmet cancer prevention needs varied by the percent eligible for each
service. Ten percent of the analysis sample had 4 or more needs, but
only received three referrals, consistent with 211 procedures.
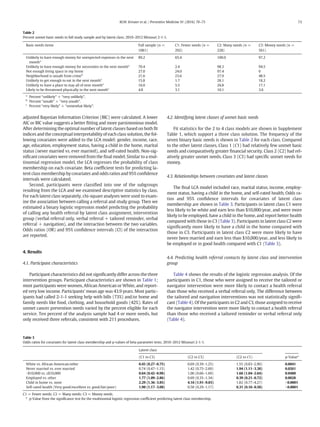
4.2. Identifying latent classes of unmet basic needs
Fit statistics for the 2 to 4 class models are shown in Supplement
Table 1, which support a three class solution. The frequency of the
seven binary basic needs is shown in Table 2 for each class. Compared
to the other latent classes, Class 1 (C1) had relatively few unmet basic
needs and comparatively greater financial security. Class 2 (C2) had rel-
atively greater unmet needs. Class 3 (C3) had specific unmet needs for
money.
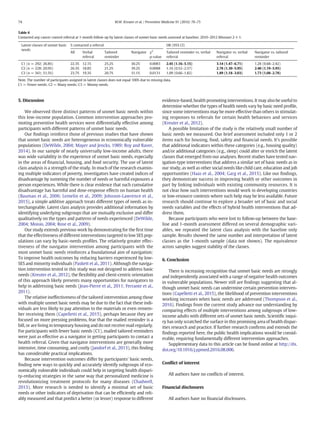
4.3. Relationships between covariates and latent classes
The final LCA model included race, marital status, income, employ-
ment status, having a child in the home, and self-rated health. Odds ra-
tios and 95% confidence intervals for covariates of latent class
membership are shown in Table 3. Participants in latent class C1 were
less likely to be white and earn less than $10,000/year, and were more
likely to be employed, have a child in the home, and report better health
compared with those in C3 (Table 3). Participants in latent class C2 were
significantly more likely to have a child in the home compared with
those in C3. Participants in latent class C2 were more likely to have
never been married and earn less than $10,000/year, and less likely to
be employed or in good health compared with C1 (Table 3).
4.4. Predicting health referral contacts by latent class and intervention
group
Table 4 shows the results of the logistic regression analysis. Of the
participants in C1, those who were assigned to receive the tailored or
navigator intervention were more likely to contact a health referral
than those who received a verbal referral only. The difference between
the tailored and navigation interventions was not statistically signifi-
cant (Table 4). Of the participants in C2 and C3, those assigned to receive
the navigator intervention were more likely to contact a health referral
than those who received a tailored reminder or verbal referral only
(Table 4).
Table 2
Percent unmet basic needs in full study sample and by latent class; 2010–2012 Missouri 2-1-1.
Basic needs items Full sample (n =
1081)
C1: Fewer needs (n =
292)
C2: Many needs (n =
228)
C3: Money needs (n =
561)
Unlikely to have enough money for unexpected expenses in the next
montha
89.2 65.4 100.0 97.2
Unlikely to have enough money for necessities in the next montha
70.4 2.4 98.3 94.5
Not enough living space in my home 27.0 24.0 97.4 0
Neighborhood is unsafe from crimeb
21.6 23.6 27.9 48.5
Unlikely to get enough to eat in the next montha
15.8 1.7 28.1 18.2
Unlikely to have a place to stay all of next montha
16.0 5.5 26.8 17.1
Likely to be threatened physically in the next monthc
4.8 3.1 10.1 3.6
a
Percent “unlikely” + “very unlikely”.
b
Percent “unsafe” + “very unsafe”.
c
Percent “very likely” + “somewhat likely”.
Table 3
Odds ratios for covariates for latent class membership and p-values of beta parameter tests; 2010–2012 Missouri 2-1-1.
Latent class
(C1 vs C3) (C2 vs C3) (C2 vs C1) p-Valuea
White vs. African American/other 0.45 (0.27–0.75) 0.69 (0.39–1.25) 1.55 (0.83–2.90) 0.0041
Never married vs. ever married 0.74 (0.47–1.15) 1.42 (0.75–2.69) 1.94 (1.11–3.38) 0.0261
b$10,000 vs. ≥$10,000 0.64 (0.42–0.98) 1.06 (0.66–1.69) 1.66 (1.04–2.64) 0.0480
Employed vs. other 1.77 (1.09–2.86) 0.69 (0.35–1.34) 0.39 (0.21–0.72) 0.0028
Child in home vs. none 2.29 (1.36–3.85) 4.16 (1.91–9.03) 1.82 (0.77–4.27) b0.0001
Self-rated health (Very good/excellent vs. good/fair/poor) 1.90 (1.17–3.08) 0.58 (0.29–1.17) 0.31 (0.16–0.58) b0.0001
C1 = Fewer needs; C2 = Many needs; C3 = Money needs.
a
p-Value from the significance test for the multinomial logistic regression coefficient predicting latent class membership.
73M.W. Kreuter et al. / Preventive Medicine 91 (2016) 70–75
5. Discussion
We observed three distinct patterns of unmet basic needs within
this low-income population. Common intervention approaches pro-
moting preventive health services were differentially effective among
participants with different patterns of unmet basic needs.
Our findings reinforce those of previous studies that have shown
that unmet basic needs are heterogeneous in economically vulnerable
populations (DeWilde, 2004; Mayer and Jencks, 1989; Roy and Raver,
2014). In our sample of nearly universally low-income adults, there
was wide variability in the experience of unmet basic needs, especially
in the areas of financial, housing, and food security. The use of latent
class analysis is a strength of the study. In much of the research examin-
ing multiple indicators of poverty, investigators have created indices of
disadvantage by summing the number of needs or harmful exposures a
person experiences. While there is clear evidence that such cumulative
disadvantage has harmful and dose-response effects on human health
(Bauman et al., 2006; Lemelin et al., 2009; Johnson-Lawrence et al.,
2015), a simple additive approach treats different types of needs as in-
terchangeable. Latent class analysis provides additional information by
identifying underlying subgroups that are mutually exclusive and differ
qualitatively on the types and patterns of needs experienced (DeWilde,
2004; Moisio, 2004; Rose et al., 2009).
Our study extends previous work by demonstrating for the first time
that the effectiveness of different interventions targeted to low SES pop-
ulations can vary by basic-needs profiles. The relatively greater effec-
tiveness of the navigator intervention among participants with the
most unmet basic needs reinforces a foundational aim of navigation:
To improve health outcomes by reducing barriers experienced by low-
SES and minority individuals (Paskett et al., 2011). Although the naviga-
tion intervention tested in this study was not designed to address basic
needs (Kreuter et al., 2012), the flexibility and client-centric orientation
of this approach likely presents many opportunities for navigators to
help in addressing basic needs (Jean-Pierre et al., 2011; Ferrante et al.,
2011).
The relative ineffectiveness of the tailored intervention among those
with multiple unmet basic needs may be due to the fact that these indi-
viduals are less likely to pay attention to the materials or even remem-
ber receiving them (Capelletti et al., 2015), perhaps because they are
focused on more pressing problems, fear that the mailed reminder is a
bill, or are living in temporary housing and do not receive mail regularly.
For participants with fewer basic needs (C1), mailed tailored reminders
were just as effective as a navigator in getting participants to contact a
health referral. Given that navigator interventions are generally more
intensive, time consuming, and costly (Jandorf et al., 2013), this finding
has considerable practical implications.
Because intervention outcomes differ by participants' basic needs,
finding new ways to quickly and accurately identify subgroups of eco-
nomically vulnerable individuals could help in targeting health dispari-
ty-reducing strategies in the same way that personalized medicine is
revolutionizing treatment protocols for many diseases (Chadwell,
2013). More research is needed to identify a minimal set of basic
needs or other indicators of deprivation that can be efficiently and reli-
ably measured and that predict a better (or lesser) response to different
evidence-based, health promoting interventions. It may also be useful to
determine whether the types of health needs vary by basic need profile,
since some interventions may be more effective than others in stimulat-
ing responses to referrals for certain health behaviors and services
(Kreuter et al., 2012).
A possible limitation of the study is the relatively small number of
basic needs we measured. Our brief assessment included only 1 or 2
items each for housing, food, safety and financial needs. It's possible
that additional indicators within these categories (e.g., housing quality)
and/or additional categories (e.g., sleep) could alter or enrich the latent
classes that emerged from our analyses. Recent studies have tested nav-
igation-type interventions that address a similar set of basic needs as in
our study, as well as other social needs like child care, education and job
opportunities (Haas et al., 2004; Garg et al., 2015). Like our findings,
they demonstrate success in improving health or other outcomes in
part by linking individuals with existing community resources. It is
not clear how such interventions would work in developing countries
or low-resource contexts where such help may be less available. Future
research should continue to explore a broader set of basic and social
needs variables and the effects of hybrid health interventions that ad-
dress them.
Because participants who were lost to follow-up between the base-
line and 1-month assessment differed on several demographic vari-
ables, we repeated the latent class analysis with the baseline only
sample. Results showed the same number and interpretation of latent
classes as the 1-month sample (data not shown). The equivalence
across samples suggest stability of the classes.
6. Conclusion
There is increasing recognition that unmet basic needs are strongly
and independently associated with a range of negative health outcomes
in vulnerable populations. Newer still are findings suggesting that al-
though unmet basic needs can undermine certain prevention interven-
tions (Capelletti et al., 2015), the likelihood of prevention interventions
working increases when basic needs are addressed (Thompson et al.,
2016). Findings from the current study advance our understanding by
comparing effects of multiple interventions among subgroups of low-
income adults with different sets of unmet basic needs. Scientific inqui-
ry has only scratched the surface in this promising area of health dispar-
ities research and practice. If further research confirms and extends the
findings reported here, the public health implications would be consid-
erable, requiring fundamentally different intervention approaches.
Supplementary data to this article can be found online at http://dx.
doi.org/10.1016/j.ypmed.2016.08.006.
Conflict of interest
All authors have no conflicts of interest.
Financial disclosures
All authors have no financial disclosures.
Table 4
Contacted any cancer control referral at 1-month follow-up by latent classes of unmet basic needs assessed at baseline; 2010–2012 Missouri 2-1-1.
Latent classes of unmet basic
needs
% contacted a referral OR (95% CI)
All Verbal
referral
Tailored
reminder
Navigator χ2
p-value
Tailored reminder vs. verbal
referral
Navigator vs. verbal
referral
Navigator vs. tailored
reminder
C1 (n = 292; 26.8%) 22.3% 12.1% 25.2% 30.2% 0.0083 2.45 (1.16–5.15) 3.14 (1.47–6.71) 1.28 (0.68–2.42)
C2 (n = 228; 20.9%) 26.3% 18.8% 21.2% 39.2% 0.0088 1.16 (0.52–2.57) 2.78 (1.30–5.95) 2.40 (1.19–5.95)
C3 (n = 561; 51.5%) 23.7% 19.3% 20.7% 31.1% 0.0131 1.09 (0.66–1.82) 1.89 (1.18–3.03) 1.73 (1.08–2.78)
Note. The number of participants assigned to latent classes does not equal 100% due to missing data.
C1 = Fewer needs; C2 = Many needs; C3 = Money needs.
74 M.W. Kreuter et al. / Preventive Medicine 91 (2016) 70–75
Acknowledgments
This study was supported by funding from the National Cancer Insti-
tute (P50-CA095815); however, the funder had no involvement with
the design, conduct, analysis or reporting of the study. We thank the
2-1-1 Information Specialists and callers who participated in this study.
References
Fiscella, K., Williams, D., 2004. Health disparities based on socioeconomic inequities: im-
plications for urban health care. Acad. Med. 79 (12), 1139–1147.
DeFur, P.L., Evans, G.W., Cohen Hubal, E.A., Kyle, A.D., Morello-Frosch, R.A., Williams, D.R.,
2007. Vulnerability as a function of individual and group resources in cumulative risk
assessment. Environ. Health Perspect. 115 (5), 817–824.
Harper, S., Lynch, J., 2007. Trends in socioeconomic inequalities in adult health behaviors
among U.S. states, 1990–2004. Public Health Rep. 122, 177–189 (March–April).
Goldman, D.P., Smith, J.P., 2002. Can patient self-management help explain the SES health
gradient? Proc. Natl. Acad. Sci. U. S. A. 99 (16), 10929–10934.
Lantz, P.M., Lynch, J.W., House JS, et al., 2001. Socioeconomic disparities in health change
in a longitudinal study of US adults: the role of health-risk behaviors. Soc. Sci. Med.
2001 (53), 29–40.
McDonough, P., Sacker, A., Wiggins, R.D., 2005. Time on my side? Life course trajectories
of poverty and health. Soc. Sci. Med. 61, 1795–1808.
DeWilde, C., 2004. The multidimentional measurement of poverty in Belgium and Britain:
a categorical approach. Soc. Indic. Res. 68, 331–369.
Blazer, D., Sachs-Ericsson, N., Hybels, C., February 2005. Perception of unmet basic needs
as a predictor of mortality among community-dwelling older adults. Am. J. Public
Health 95 (2), 299–304.
Sachs-Ericsson, N., Schatschneider, C., Blazer, D., 2006. Perception of unmet basic needs as
a predictor of physical functioning among community-dwelling older adults. J. Aging
Health. 18 (6), 852–868 December.
Blazer, D., Sachs-Ericsson, N., Hybels, C., 2007. Perception of unmet basic needs as a pre-
dictor of depressive symptoms among community-dwelling older adults. J Gerontol.
Med. Sci. 62 (2), 191–195 February.
Fitzpatrick, T., Rosella, L.C., Calzavara, A., et al., 2015. Looking beyond income and educa-
tion: socioeconomic status gradients among future high-cost users of health care.
Am. J. Prev. Med. 49 (2), 161–171.
U.S. Census Bureau, 2015. Current Population Survey. Annual Social and Economic Sup-
plement Available at https://www.census.gov/hhes/www/poverty/about/overview/,
accessed April 1, 2016 .
Feeding America 2016. Food Insecurity in the United States. Available at: http://map.
feedingamerica.org/county/2013/overall, accessed April 1, 2016.
Desmond, M., 2015. Unaffordable America: Poverty, housing and eviction. Institute for
Research on Poverty, Fast Focus No. 22-2015 March .
Mayer, S.E., Jencks, C., 1989. Poverty and the distribution of material hardship. J. Hum.
Resour. XXIV (1), 88–114.
Iceland, J., Bauman, K.J., 2007. Income poverty and material hardship: how strong is the
association? J. Socio-Econ. 36, 376–396.
Daily, L.S., 2012. Health research and surveillance potential to partner with 2-1-1. Am.
J. Prev. Med. 43 (6S5), S422–S424.
Kreuter, M.W., 2012. Reach, effectiveness, and connections: the case for partnering with
2-1-1 to eliminate health disparities. Am. J. Prev. Med. 43 (6S5), S420–S421.
Thompson, T., Kreuter, M.W., Boyum, S., 2016. Promoting health by addressing basic
needs: effect of problem resolution on contacting health referrals. Health Educ.
Behav. 43 (2), 201–207.
Purnell, J.Q., Kreuter, M.W., Eddens, K.S., et al., 2012. Cancer control needs of 2-1-1 callers
in Missouri, North Carolina, Texas, and Washington. J. Health Care Poor Underserved
23, 752–767.
Kreuter, M.W., Eddens, K.S., Alcaraz, K.I., et al., 2012. Use of cancer control referrals by 2-1-
1 callers: a randomized trial. Am. J. Prev. Med. 43 (6S5), S425–S434.
Eddens, K., Kreuter, M.W., Archer, K., 2011. Proactive screening for health needs in United
Way's 2-1-1 information and referral service. J. Soc. Serv. Res. 37 (2), 113–123.
Segal, S., Silverman, C., Temkin, T., 1993. Empowerment and self-help agency practice for
people with mental disabilities. Soc. Work 38 (6), 705–712 November.
Lanza, S.T., Rhoades, B.L., 2013. Latent class analysis: an alternative perspective on sub-
group analysis in prevention and treatment. Prev. Sci. 14, 157–168.
Roy, A.L., Raver, C.C., 2014. Are all risks equal? Early experiences of poverty-related risk
and children's functioning. J. Fam. Psychol. 28 (3), 391–400.
Bauman, L.J., Silver, E.J., Stein, R.E.K., 2006. Cumulative social disadvantage and child
health. Pediatrics 117 (4), 1321–1328.
Lemelin, E.T., Roux, A.V.D., Frankling, T.G., et al., 2009. Life-course socioeconomic positions
and subclinical atherosclerosis in the multi-ethnic study of atherosclerosis. Soc. Sci.
Med. 68, 444–451.
Johnson-Lawrence, V.J., Galea, S., Kaplan, G., 2015. Cumulative socioeconomic disadvan-
tage and cardiovasular disease mortality in the Alameda County Study 1965 to
2000. Ann. Epidemiol. 25, 65–70.
Moisio, P., 2004. A latent class application to the multidimensional measurement of pov-
erty. Qual. Quant. 38, 703–717.
Rose, R., Parish, S., Yoo, J., 2009. Measuring material hardship among the US population of
women with disabilities using latent class analysis. Soc. Indic. Res. 94, 391–415.
Paskett, E., Harrop, J., Wells, K., 2011. Patient navigation: an update on the state of the sci-
ence. CA Cancer J. Phys. 61 (4), 237–249.
Jean-Pierre, P., Hendren, S., Loader, S., et al., 2011. Understanding processes of patient
navigation to reduce disparities in cancer care: perspectives of trained navigators
from the field. J. Cancer Educ. 26 (1), 111–120.
Ferrante, J.M., Wu, J., Dicicco-Bloom, B., 2011. Strategies used and challenges faced by a
breast cancer patient navigator in an urban underserved community. J. Natl. Med.
Assoc. 103 (8), 729–734.
Capelletti, E., Kreuter, M., Boyum, S., Thompson, T., 2015. Basic needs, stress and the ef-
fects of tailored health communication in vulnerable populations. Health Educ. Res.
30 (4), 591–598.
Jandorf, L., Stossel, L.M., Cooperman, J.L., et al., 2013. Cost analysis of a patient navigation
system to increase screening colonoscopy adherence among urban minorities. Cancer
119, 612–620.
Chadwell, K., 2013. Clinical practice on the horizon: personalized medicine. Clin. Nurse
Specialist 27 (1), 36–43.
Haas, J., Phillips, K., Sonneborn, D., et al., July 2004. Variation in access to health care for
different racial/ethnic groups by the race/ethnic composition of an individual's coun-
ty of residence. Med. Care 42 (7), 707–714.
Garg, A., Toy, S., Tripodis, Y., Silverstein, M., Freeman, E., 2015. Addressing social determi-
nants of health at well child care visits: a cluster RCT. Pediatrics 135 (2), e296–e304.
75M.W. Kreuter et al. / Preventive Medicine 91 (2016) 70–75

More Related Content

What's hot

Gilliam (2011)
Gilliam (2011)Gilliam (2011)
Gilliam (2011)
aartisayal94
 
LuciousDavis1-Research Methods for Health Sciences-01-Unit9_Assignment
LuciousDavis1-Research Methods for Health Sciences-01-Unit9_AssignmentLuciousDavis1-Research Methods for Health Sciences-01-Unit9_Assignment
LuciousDavis1-Research Methods for Health Sciences-01-Unit9_AssignmentLucious Davis
 
Actionable Risk and Receptivity to Change Summary v4
Actionable Risk and Receptivity to Change Summary v4Actionable Risk and Receptivity to Change Summary v4
Actionable Risk and Receptivity to Change Summary v4Rosina Everitte
 
Healthcare seeking and sexual behaviour of clients attending the suntreso sti...
Healthcare seeking and sexual behaviour of clients attending the suntreso sti...Healthcare seeking and sexual behaviour of clients attending the suntreso sti...
Healthcare seeking and sexual behaviour of clients attending the suntreso sti...
Alexander Decker
 
Exploring the role of racial associations within life and psychiatry the diss...
Exploring the role of racial associations within life and psychiatry the diss...Exploring the role of racial associations within life and psychiatry the diss...
Exploring the role of racial associations within life and psychiatry the diss...
TÀI LIỆU NGÀNH MAY
 
DSmith_Increasing Prevention Utilization among African Americans_The 6 18 App...
DSmith_Increasing Prevention Utilization among African Americans_The 6 18 App...DSmith_Increasing Prevention Utilization among African Americans_The 6 18 App...
DSmith_Increasing Prevention Utilization among African Americans_The 6 18 App...Denise Smith
 
DSmith_Increasing Prevention Utilization among African Americans_The_6_18_App...
DSmith_Increasing Prevention Utilization among African Americans_The_6_18_App...DSmith_Increasing Prevention Utilization among African Americans_The_6_18_App...
DSmith_Increasing Prevention Utilization among African Americans_The_6_18_App...Denise Smith
 
2 project aims, values and desired outcomesyanet galanwes
2 project aims, values and desired outcomesyanet galanwes2 project aims, values and desired outcomesyanet galanwes
2 project aims, values and desired outcomesyanet galanwes
Vivan17
 
Poster Information
Poster Information Poster Information
Poster Information Javed Khanni
 
Bridging the diversity gap in Clinical Trials
Bridging the diversity gap in Clinical TrialsBridging the diversity gap in Clinical Trials
Bridging the diversity gap in Clinical TrialsNassim Azzi, MBA
 
Statistics In Public Health Practice
Statistics In Public Health PracticeStatistics In Public Health Practice
Statistics In Public Health Practice
fhardnett
 
Divina.ppt
Divina.pptDivina.ppt
NGO Collaboration with the China Ministry of Health
NGO Collaboration with the China Ministry of HealthNGO Collaboration with the China Ministry of Health
NGO Collaboration with the China Ministry of Health
Christian Connections for International Health
 
The Knowledge of and Attitude to and Beliefs about Causes and Treatments of M...
The Knowledge of and Attitude to and Beliefs about Causes and Treatments of M...The Knowledge of and Attitude to and Beliefs about Causes and Treatments of M...
The Knowledge of and Attitude to and Beliefs about Causes and Treatments of M...
Premier Publishers
 
The prevalence, patterns of usage and people's attitude towards complementary...
The prevalence, patterns of usage and people's attitude towards complementary...The prevalence, patterns of usage and people's attitude towards complementary...
The prevalence, patterns of usage and people's attitude towards complementary...
home
 
Mass Health Insurance Survey
Mass Health Insurance SurveyMass Health Insurance Survey
Mass Health Insurance SurveyDocJess
 

What's hot (20)

Gilliam (2011)
Gilliam (2011)Gilliam (2011)
Gilliam (2011)
 
LuciousDavis1-Research Methods for Health Sciences-01-Unit9_Assignment
LuciousDavis1-Research Methods for Health Sciences-01-Unit9_AssignmentLuciousDavis1-Research Methods for Health Sciences-01-Unit9_Assignment
LuciousDavis1-Research Methods for Health Sciences-01-Unit9_Assignment
 
Actionable Risk and Receptivity to Change Summary v4
Actionable Risk and Receptivity to Change Summary v4Actionable Risk and Receptivity to Change Summary v4
Actionable Risk and Receptivity to Change Summary v4
 
Healthcare seeking and sexual behaviour of clients attending the suntreso sti...
Healthcare seeking and sexual behaviour of clients attending the suntreso sti...Healthcare seeking and sexual behaviour of clients attending the suntreso sti...
Healthcare seeking and sexual behaviour of clients attending the suntreso sti...
 
258-1197-1-SM
258-1197-1-SM258-1197-1-SM
258-1197-1-SM
 
Exploring the role of racial associations within life and psychiatry the diss...
Exploring the role of racial associations within life and psychiatry the diss...Exploring the role of racial associations within life and psychiatry the diss...
Exploring the role of racial associations within life and psychiatry the diss...
 
DSmith_Increasing Prevention Utilization among African Americans_The 6 18 App...
DSmith_Increasing Prevention Utilization among African Americans_The 6 18 App...DSmith_Increasing Prevention Utilization among African Americans_The 6 18 App...
DSmith_Increasing Prevention Utilization among African Americans_The 6 18 App...
 
DSmith_Increasing Prevention Utilization among African Americans_The_6_18_App...
DSmith_Increasing Prevention Utilization among African Americans_The_6_18_App...DSmith_Increasing Prevention Utilization among African Americans_The_6_18_App...
DSmith_Increasing Prevention Utilization among African Americans_The_6_18_App...
 
2 project aims, values and desired outcomesyanet galanwes
2 project aims, values and desired outcomesyanet galanwes2 project aims, values and desired outcomesyanet galanwes
2 project aims, values and desired outcomesyanet galanwes
 
Poster Information
Poster Information Poster Information
Poster Information
 
Federal register051410
Federal register051410Federal register051410
Federal register051410
 
Bridging the diversity gap in Clinical Trials
Bridging the diversity gap in Clinical TrialsBridging the diversity gap in Clinical Trials
Bridging the diversity gap in Clinical Trials
 
Statistics In Public Health Practice
Statistics In Public Health PracticeStatistics In Public Health Practice
Statistics In Public Health Practice
 
Divina.ppt
Divina.pptDivina.ppt
Divina.ppt
 
Ajp meffectv discasemgmt
Ajp meffectv discasemgmtAjp meffectv discasemgmt
Ajp meffectv discasemgmt
 
NGO Collaboration with the China Ministry of Health
NGO Collaboration with the China Ministry of HealthNGO Collaboration with the China Ministry of Health
NGO Collaboration with the China Ministry of Health
 
The Knowledge of and Attitude to and Beliefs about Causes and Treatments of M...
The Knowledge of and Attitude to and Beliefs about Causes and Treatments of M...The Knowledge of and Attitude to and Beliefs about Causes and Treatments of M...
The Knowledge of and Attitude to and Beliefs about Causes and Treatments of M...
 
Hametz-ShenkFINALCapstone2016
Hametz-ShenkFINALCapstone2016Hametz-ShenkFINALCapstone2016
Hametz-ShenkFINALCapstone2016
 
The prevalence, patterns of usage and people's attitude towards complementary...
The prevalence, patterns of usage and people's attitude towards complementary...The prevalence, patterns of usage and people's attitude towards complementary...
The prevalence, patterns of usage and people's attitude towards complementary...
 
Mass Health Insurance Survey
Mass Health Insurance SurveyMass Health Insurance Survey
Mass Health Insurance Survey
 

Viewers also liked

Class eight bangladesh & global studies chepter 12class-4
Class eight bangladesh & global studies chepter 12class-4Class eight bangladesh & global studies chepter 12class-4
Class eight bangladesh & global studies chepter 12class-4
Abdulláh Mámun
 
Tugas 1 matematika 3
Tugas 1 matematika 3Tugas 1 matematika 3
Tugas 1 matematika 3
mizhaphisari
 
Chapter 13, lesson-4
Chapter 13, lesson-4Chapter 13, lesson-4
Chapter 13, lesson-4
Abdulláh Mámun
 
Air Caraibes Airbus A330 memo
Air Caraibes Airbus A330 memoAir Caraibes Airbus A330 memo
Air Caraibes Airbus A330 memo
Kieran Daly
 
Iso
IsoIso
LakePharma service brochure
LakePharma service brochureLakePharma service brochure
LakePharma service brochure
Jin Di, Ph.D.
 
How to-use-canva-by-ella
How to-use-canva-by-ellaHow to-use-canva-by-ella
How to-use-canva-by-ella
Eleaza Rose Devilleres
 
La suficiencia de cristo # 4
La suficiencia de cristo # 4La suficiencia de cristo # 4
La suficiencia de cristo # 4
IBE Callao
 
5 Amigos Sol Lopez Guerra
5 Amigos Sol Lopez Guerra5 Amigos Sol Lopez Guerra
5 Amigos Sol Lopez Guerra
Universidad de Buenos Aires
 
Welkegeschillen lenen zich tot mediation?
Welkegeschillen lenen zich tot mediation?Welkegeschillen lenen zich tot mediation?
Welkegeschillen lenen zich tot mediation?Willem Meuwissen
 
Herramientas digitales
Herramientas digitalesHerramientas digitales
Herramientas digitales
Eduardo Vega Verde
 
Diagramas de equilibrio en procesos metálicos
Diagramas de equilibrio en procesos metálicosDiagramas de equilibrio en procesos metálicos
Diagramas de equilibrio en procesos metálicosiesvaldehierro
 
LakePharma’s CHO-GSN Platform for Stable Cell Line Generation
LakePharma’s CHO-GSN Platform for Stable Cell Line GenerationLakePharma’s CHO-GSN Platform for Stable Cell Line Generation
LakePharma’s CHO-GSN Platform for Stable Cell Line Generation
Jin Di, Ph.D.
 
Initial Conditions
Initial ConditionsInitial Conditions
Initial Conditions
Smit Shah
 
Divergence Theorem & Maxwell’s First Equation
Divergence  Theorem & Maxwell’s  First EquationDivergence  Theorem & Maxwell’s  First Equation
Divergence Theorem & Maxwell’s First Equation
Smit Shah
 
Diamantes 500 - 10 Claves para alcanzar el éxito
Diamantes 500 - 10 Claves para alcanzar el éxitoDiamantes 500 - 10 Claves para alcanzar el éxito
Diamantes 500 - 10 Claves para alcanzar el éxito
Diamantes 500
 
Fluid Properties Density , Viscosity , Surface tension & Capillarity
Fluid Properties Density , Viscosity , Surface tension & Capillarity Fluid Properties Density , Viscosity , Surface tension & Capillarity
Fluid Properties Density , Viscosity , Surface tension & Capillarity
Smit Shah
 
AAMA Presents China's Media Landscape_2017
AAMA Presents China's Media Landscape_2017AAMA Presents China's Media Landscape_2017
AAMA Presents China's Media Landscape_2017
Norman Liang
 

Viewers also liked (20)

Class eight bangladesh & global studies chepter 12class-4
Class eight bangladesh & global studies chepter 12class-4Class eight bangladesh & global studies chepter 12class-4
Class eight bangladesh & global studies chepter 12class-4
 
Tugas 1 matematika 3
Tugas 1 matematika 3Tugas 1 matematika 3
Tugas 1 matematika 3
 
Chapter 13, lesson-4
Chapter 13, lesson-4Chapter 13, lesson-4
Chapter 13, lesson-4
 
Air Caraibes Airbus A330 memo
Air Caraibes Airbus A330 memoAir Caraibes Airbus A330 memo
Air Caraibes Airbus A330 memo
 
Iso
IsoIso
Iso
 
LakePharma service brochure
LakePharma service brochureLakePharma service brochure
LakePharma service brochure
 
How to-use-canva-by-ella
How to-use-canva-by-ellaHow to-use-canva-by-ella
How to-use-canva-by-ella
 
La suficiencia de cristo # 4
La suficiencia de cristo # 4La suficiencia de cristo # 4
La suficiencia de cristo # 4
 
Denise Targovnik
Denise TargovnikDenise Targovnik
Denise Targovnik
 
5 Amigos Sol Lopez Guerra
5 Amigos Sol Lopez Guerra5 Amigos Sol Lopez Guerra
5 Amigos Sol Lopez Guerra
 
Welkegeschillen lenen zich tot mediation?
Welkegeschillen lenen zich tot mediation?Welkegeschillen lenen zich tot mediation?
Welkegeschillen lenen zich tot mediation?
 
Herramientas digitales
Herramientas digitalesHerramientas digitales
Herramientas digitales
 
Diagramas de equilibrio en procesos metálicos
Diagramas de equilibrio en procesos metálicosDiagramas de equilibrio en procesos metálicos
Diagramas de equilibrio en procesos metálicos
 
LakePharma’s CHO-GSN Platform for Stable Cell Line Generation
LakePharma’s CHO-GSN Platform for Stable Cell Line GenerationLakePharma’s CHO-GSN Platform for Stable Cell Line Generation
LakePharma’s CHO-GSN Platform for Stable Cell Line Generation
 
Initial Conditions
Initial ConditionsInitial Conditions
Initial Conditions
 
Divergence Theorem & Maxwell’s First Equation
Divergence  Theorem & Maxwell’s  First EquationDivergence  Theorem & Maxwell’s  First Equation
Divergence Theorem & Maxwell’s First Equation
 
Diamantes 500 - 10 Claves para alcanzar el éxito
Diamantes 500 - 10 Claves para alcanzar el éxitoDiamantes 500 - 10 Claves para alcanzar el éxito
Diamantes 500 - 10 Claves para alcanzar el éxito
 
Gestion en medios escritos publicaciones
Gestion en medios escritos publicacionesGestion en medios escritos publicaciones
Gestion en medios escritos publicaciones
 
Fluid Properties Density , Viscosity , Surface tension & Capillarity
Fluid Properties Density , Viscosity , Surface tension & Capillarity Fluid Properties Density , Viscosity , Surface tension & Capillarity
Fluid Properties Density , Viscosity , Surface tension & Capillarity
 
AAMA Presents China's Media Landscape_2017
AAMA Presents China's Media Landscape_2017AAMA Presents China's Media Landscape_2017
AAMA Presents China's Media Landscape_2017
 

Similar to Unmet Basic Needs

Running head UNION COUNTY, GEORGIA .docx
Running head UNION COUNTY, GEORGIA                               .docxRunning head UNION COUNTY, GEORGIA                               .docx
Running head UNION COUNTY, GEORGIA .docx
toltonkendal
 
Frew et al 2015 - Delivering a Dose of Hope
Frew et al 2015 - Delivering a Dose of HopeFrew et al 2015 - Delivering a Dose of Hope
Frew et al 2015 - Delivering a Dose of HopeLauren Owens, MPH
 
Board of Governors Meeting, New Orleans
Board of Governors Meeting, New OrleansBoard of Governors Meeting, New Orleans
Board of Governors Meeting, New Orleans
Patient-Centered Outcomes Research Institute
 
Poster_FINAL
Poster_FINALPoster_FINAL
Poster_FINALRV Rikard
 
Effects of Community-Based Health WorkerInterventions to Imp.docx
Effects of Community-Based Health WorkerInterventions to Imp.docxEffects of Community-Based Health WorkerInterventions to Imp.docx
Effects of Community-Based Health WorkerInterventions to Imp.docx
SALU18
 
ADES Final Project 2.pdf
ADES Final Project 2.pdfADES Final Project 2.pdf
ADES Final Project 2.pdf
maddiemays
 
Neighborhood walking tours for physicians in-training
Neighborhood walking tours for physicians in-trainingNeighborhood walking tours for physicians in-training
Neighborhood walking tours for physicians in-training
https://www.facebook.com/garmentspace
 
Running head APPLICATIONS OF THE PRECEDE-PROCEED MODEL 1.docx
Running head APPLICATIONS OF THE PRECEDE-PROCEED MODEL        1.docxRunning head APPLICATIONS OF THE PRECEDE-PROCEED MODEL        1.docx
Running head APPLICATIONS OF THE PRECEDE-PROCEED MODEL 1.docx
SUBHI7
 
02 keynote address_efraintalamantes
02 keynote address_efraintalamantes02 keynote address_efraintalamantes
02 keynote address_efraintalamantes
Sea Mar Community Health Centers
 
Social and behavioral determinants lit review
Social and behavioral determinants lit reviewSocial and behavioral determinants lit review
Social and behavioral determinants lit reviewRosella Anstine
 
Module 4 DiscussionPopulation and community health are extremely.docx
Module 4 DiscussionPopulation and community health are extremely.docxModule 4 DiscussionPopulation and community health are extremely.docx
Module 4 DiscussionPopulation and community health are extremely.docx
audeleypearl
 
Running Head HEALTH NEEDS ASSESSMENT1HEALTH NEEDS ASSESSMEN.docx
Running Head HEALTH NEEDS ASSESSMENT1HEALTH NEEDS ASSESSMEN.docxRunning Head HEALTH NEEDS ASSESSMENT1HEALTH NEEDS ASSESSMEN.docx
Running Head HEALTH NEEDS ASSESSMENT1HEALTH NEEDS ASSESSMEN.docx
wlynn1
 
Exploring the Association between Maternal Health Literacy and Pediatric Heal...
Exploring the Association between Maternal Health Literacy and Pediatric Heal...Exploring the Association between Maternal Health Literacy and Pediatric Heal...
Exploring the Association between Maternal Health Literacy and Pediatric Heal...
Penn Institute for Urban Research
 
Public Health and Health Care
Public Health and Health CarePublic Health and Health Care
Public Health and Health Care
Debbie Fernando
 
Medical sociology and health service research - Journal of Health and social ...
Medical sociology and health service research - Journal of Health and social ...Medical sociology and health service research - Journal of Health and social ...
Medical sociology and health service research - Journal of Health and social ...Jorge Pacheco
 
New approaches for moving upstream how state and local health departments can...
New approaches for moving upstream how state and local health departments can...New approaches for moving upstream how state and local health departments can...
New approaches for moving upstream how state and local health departments can...
Jim Bloyd, DrPH, MPH
 
1 Literature Review Assignment STUDENT
1  Literature Review Assignment STUDENT 1  Literature Review Assignment STUDENT
1 Literature Review Assignment STUDENT
VannaJoy20
 

Similar to Unmet Basic Needs (20)

Running head UNION COUNTY, GEORGIA .docx
Running head UNION COUNTY, GEORGIA                               .docxRunning head UNION COUNTY, GEORGIA                               .docx
Running head UNION COUNTY, GEORGIA .docx
 
Frew et al 2015 - Delivering a Dose of Hope
Frew et al 2015 - Delivering a Dose of HopeFrew et al 2015 - Delivering a Dose of Hope
Frew et al 2015 - Delivering a Dose of Hope
 
Board of Governors Meeting, New Orleans
Board of Governors Meeting, New OrleansBoard of Governors Meeting, New Orleans
Board of Governors Meeting, New Orleans
 
PAPER
PAPERPAPER
PAPER
 
Poster_FINAL
Poster_FINALPoster_FINAL
Poster_FINAL
 
Effects of Community-Based Health WorkerInterventions to Imp.docx
Effects of Community-Based Health WorkerInterventions to Imp.docxEffects of Community-Based Health WorkerInterventions to Imp.docx
Effects of Community-Based Health WorkerInterventions to Imp.docx
 
ADES Final Project 2.pdf
ADES Final Project 2.pdfADES Final Project 2.pdf
ADES Final Project 2.pdf
 
Neighborhood walking tours for physicians in-training
Neighborhood walking tours for physicians in-trainingNeighborhood walking tours for physicians in-training
Neighborhood walking tours for physicians in-training
 
NIH HLResearch Proposal
NIH HLResearch ProposalNIH HLResearch Proposal
NIH HLResearch Proposal
 
Running head APPLICATIONS OF THE PRECEDE-PROCEED MODEL 1.docx
Running head APPLICATIONS OF THE PRECEDE-PROCEED MODEL        1.docxRunning head APPLICATIONS OF THE PRECEDE-PROCEED MODEL        1.docx
Running head APPLICATIONS OF THE PRECEDE-PROCEED MODEL 1.docx
 
02 keynote address_efraintalamantes
02 keynote address_efraintalamantes02 keynote address_efraintalamantes
02 keynote address_efraintalamantes
 
Social and behavioral determinants lit review
Social and behavioral determinants lit reviewSocial and behavioral determinants lit review
Social and behavioral determinants lit review
 
Aresty Poster
Aresty PosterAresty Poster
Aresty Poster
 
Module 4 DiscussionPopulation and community health are extremely.docx
Module 4 DiscussionPopulation and community health are extremely.docxModule 4 DiscussionPopulation and community health are extremely.docx
Module 4 DiscussionPopulation and community health are extremely.docx
 
Running Head HEALTH NEEDS ASSESSMENT1HEALTH NEEDS ASSESSMEN.docx
Running Head HEALTH NEEDS ASSESSMENT1HEALTH NEEDS ASSESSMEN.docxRunning Head HEALTH NEEDS ASSESSMENT1HEALTH NEEDS ASSESSMEN.docx
Running Head HEALTH NEEDS ASSESSMENT1HEALTH NEEDS ASSESSMEN.docx
 
Exploring the Association between Maternal Health Literacy and Pediatric Heal...
Exploring the Association between Maternal Health Literacy and Pediatric Heal...Exploring the Association between Maternal Health Literacy and Pediatric Heal...
Exploring the Association between Maternal Health Literacy and Pediatric Heal...
 
Public Health and Health Care
Public Health and Health CarePublic Health and Health Care
Public Health and Health Care
 
Medical sociology and health service research - Journal of Health and social ...
Medical sociology and health service research - Journal of Health and social ...Medical sociology and health service research - Journal of Health and social ...
Medical sociology and health service research - Journal of Health and social ...
 
New approaches for moving upstream how state and local health departments can...
New approaches for moving upstream how state and local health departments can...New approaches for moving upstream how state and local health departments can...
New approaches for moving upstream how state and local health departments can...
 
1 Literature Review Assignment STUDENT
1  Literature Review Assignment STUDENT 1  Literature Review Assignment STUDENT
1 Literature Review Assignment STUDENT
 

Unmet Basic Needs

  • 1. Unmet basic needs and health intervention effectiveness in low-income populations Matthew W. Kreuter a, ⁎, Amy McQueen b , Sonia Boyum a , Qiang Fu c a Washington University, School of Social Work, Campus Box 1196, 1 Brookings Dr., St. Louis, MO 63130, United States b Washington University, School of Medicine, Campus Box 8005, 4523 Clayton Ave., St. Louis, MO 63110, United States c Saint Louis University, College for Public Health and Social Justice, Salus Center Room 480, 3545 Lafayette Ave., St. Louis, MO 63104, United States a b s t r a c ta r t i c l e i n f o Article history: Received 13 November 2015 Received in revised form 20 April 2016 Accepted 2 August 2016 Available online 03 August 2016 In the face of unmet basic needs, low SES adults are less likely to obtain needed preventive health services. The study objective was to understand how these hardships may cluster and how the effectiveness of different health-focused interventions might vary across vulnerable population sub-groups with different basic needs pro- files. From June 2010–2012, a random sample of low-income adult callers to Missouri 2-1-1 completed a cancer risk assessment and received up to 3 health referrals for needed services (mammography, pap testing, colonos- copy, HPV vaccination, smoking cessation and smoke-free home policies). Participants received either a verbal referral only (N = 365), verbal referral + tailored print reminder (N = 372), or verbal referral + navigator (N = 353). Participants reported their unmet basic needs at baseline and contacts with health referrals at 1- month post-intervention. We examined latent classes of unmet basic needs using SAS. Logistic regression exam- ined the association between latent classes and contacting a health referral, by intervention condition. A 3 class solution best fit the data. For participants with relatively more unmet needs (C2) and those with money needs (C3), the navigator intervention was more effective than the tailored or verbal referral only conditions in leading to health referrals contacts. For participants with fewer unmet basic needs (C1), the tailored intervention was as effective as the navigator intervention. The distribution and nature of unmet basic needs in this sample of low- income adults was heterogeneous, and those with the greatest needs benefitted most from a more intensive nav- igator intervention in helping them seek needed preventive health services. © 2016 Elsevier Inc. All rights reserved. Keywords: Intervention studies Telephone navigator Tailored print reminder Low-income population Cancer prevention and control Health referrals 1. Introduction Poverty has a negative effect on health outcomes (Fiscella and Williams, 2004; DeFur et al., 2007; Harper and Lynch, 2007; Goldman and Smith, 2002), even after accounting for health risk behaviors that are more prevalent in low SES populations (Lantz et al., 2001). Although poverty is most often measured with monetary indicators like income and income-to-needs ratios (McDonough et al., 2005), multidimension- al measurement approaches that consider deprivation across multiple life domains and cumulative hardship provide a richer, more accurate representation of poverty (DeWilde, 2004). Among these alternative indicators are so-called “basic needs” like adequate housing, food security, personal and neighborhood safety, ability to pay bills and possession of essential material goods. Controlling for income, education, and other demographic characteristics, having greater unmet basic needs is associated with declining physical function- ing, increased depression and mortality, and being “high cost users” of health care services (Blazer et al., 2005; Sachs-Ericsson et al., 2006; Blazer et al., 2007; Fitzpatrick et al., 2015). There are 46.7 million people in poverty in the U.S. (U.S. Census Bureau, 2015), and although there is currently no national surveillance system for basic needs, a similar number (49 million) are classified as food insecure (Feeding America, n.d.) and over half of those in poverty (52%) are classified as having “severe housing cost burden”, defined as spending N50% of their income on housing (Desmond, 2015). There is variability in how unmet basic needs are experienced by vul- nerable populations and the degree to which specific basic needs are as- sociated with income-based indicators of poverty as well as health outcomes. For example, even among those within the same income-to- needs ratio category, the types and patterns of unmet basic needs report- ed differ by family structure and other characteristics (Mayer and Jencks, 1989). And while some basic needs like food security and paying bills are strongly associated with monetary definitions of poverty, other needs like quality housing and neighborhood safety are less strongly associated (Iceland and Bauman, 2007). Food insecurity is also strongly associated with high cost health care utilization (Fitzpatrick et al., 2015). Preventive Medicine 91 (2016) 70–75 ⁎ Corresponding author at: Health Communication Research Lab, Brown School of Social Work, Washington University, Campus Box 1196, 1 Brookings Dr., St. Louis, MO 63130, United States. E-mail addresses: mkreuter@wustl.edu (M.W. Kreuter), amcqueen@dom.wustl.edu (A. McQueen), sboyum@wustl.edu (S. Boyum), qjfu@slu.edu (Q. Fu). http://dx.doi.org/10.1016/j.ypmed.2016.08.006 0091-7435/© 2016 Elsevier Inc. All rights reserved. Contents lists available at ScienceDirect Preventive Medicine journal homepage: www.elsevier.com/locate/ypmed
  • 2. Given the impact of unmet basic needs on health outcomes and the heterogeneity of unmet basic needs experienced by low-income popu- lations, the objective of this study was to understand how these hardships may cluster and how the effectiveness of different health- focused interventions might vary across vulnerable population sub- groups with different basic needs profiles. This secondary analysis of a unique prospective intervention study addresses both questions. 2. Methods The Institutional Review Board at Washington University in St. Louis approved this study. The parent study that provided the data for this secondary analysis is registered in ClinicalTrials.gov (#NCT01027741). 2.1. Study setting The study took place at United Way 2-1-1 Missouri, a telephone in- formation and referral helpline that serves 99 of 114 counties in the state and received 160,000 calls in 2013. 2-1-1 is a federally designated dialing code (like 9-1-1 for emergency services) that links callers to health and social services in their community (Daily, 2012). Callers are predominantly poor and seeking help with basic needs like paying util- ity bills and getting food (Kreuter, 2012; Thompson et al., 2016). Al- though relatively few callers contact 2-1-1 about health services, studies have shown that the health needs of 2-1-1 callers greatly exceed those of the general population (Purnell et al., 2012; Kreuter et al., 2012; Eddens et al., 2011). 2.2. Study sample and recruitment From June 2010 to June 2012, after receiving standard service, a ran- dom sample of callers to 2-1-1 Missouri was selected to participate in a surveillance phase of the project by completing a brief health risk as- sessment. Of these, 10,472 callers (58%) were eligible for the risk assess- ment (age ≥ 18, living in Missouri, English-speaking, calling with a service request for themselves, willing to provide date of birth and gen- der, not currently in extreme crisis). Nearly all of these (95%; n = 9947) were invited to take the risk assessment and 4761 (48%) completed it. Completers with at least one prevention need (n = 3816) were invited to participate in the trial phase of the project, a longitudinal intervention study. Those who agreed, consented and completed a baseline assess- ment (n = 1521; 40%) were then randomized to one of three study groups. Participants who also completed the 1-month follow up (n = 1090; 72%) comprise the analysis sample. Drop-out rates did not differ by study group, nor were drop-outs dif- ferent from completers in experiencing any of the seven unmet basic needs. They were younger (39.7 vs. 43.9 years) and more likely to be poor (62% vs. 55% income b$10K/year), employed (29% vs. 19%) and have a child at home (63% vs. 51%). Additional details of the study de- sign and methods are available in a previous report (Kreuter et al., 2012). 2.3. Risk assessment to identify prevention needs Items from the 2008 Behavioral Risk Factor Surveillance System were used to assess needs for mammography, Pap testing, colonoscopy, HPV vaccination for self and daughter, smoking cessation and smoke free home policies, recommended prevention behaviors that are avail- able for free or low cost to low-income populations in most states. Re- ferrals were offered to women ages 40 and older who had no mammogram in the last year; women ages 18 and older who had no Pap test with the last two years1 ; men and women ages 50 and older who had no colonoscopy in the last 10 years; women ages 18–26 and those with a female child ages 9–17 years old living in their home who had not received the HPV vaccination; current smokers; and those without a total ban on smoking in their household. Prevention re- ferrals were limited to three per caller consistent with standard 2-1-1 procedure. If a caller had more than three needs, a prioritization algorithm de- termined which health referrals he or she received. In descending order, the priorities were: colonoscopy, mammography, HPV vaccine for self or girl in home, Pap test, smoking cessation, and smoke free home policy. This order was set to maximize statistical power for each health outcome based on the expected proportion of the sample (from lowest to highest) that would need the referral, not on the public health importance or the strength of evidence for the recommended cancer control measure. 2.4. Interventions Participants were randomized to one of three intervention groups. Of those who completed the baseline and 1 month follow up, 365 (34%) received verbal referral only, 372 (34%) received verbal referral + tailored print reminder, and 353 (32%) received verbal referral + navigation. 2.4.1. Verbal referral Based on each caller's responses to the risk assessment questions, a computer algorithm identified and prioritized their prevention needs, which were addressed moments later by a 2-1-1 information specialist who delivered a scripted referral (Kreuter et al., 2012). Referrals consisted of three parts: (Fiscella and Williams, 2004) risk assessment feedback (e.g., “You said you've never had a mammogram”); (DeFur et al., 2007) recommended action and importance (e.g., “Once you turn 40, getting a mammogram every 1 to 2 years is the best way to fight breast cancer. Mammograms can find breast cancer when it's easier to treat and cure”); and, (Harper and Lynch, 2007) offer of referral to a free or low-cost service (e.g., “There's a good chance you can get a free mam- mogram through a program called Show Me Healthy Women. Would you like the phone number for that program?”). For each accepted refer- ral, the information specialist identified the closest service provider to the caller's residence and verbally shared the referral phone number and/or address, information about its hours of operation, and documen- tation that may be required to obtain services. 2.4.2. Tailored print reminder Within one working day of receiving the verbal referral, participants in this group were mailed a printed tailored reminder (4-page full color booklet) of the health referral they received. The reminder consisted of: (Fiscella and Williams, 2004) a short personal story tailored to the problem that led the participant to call 2-1-1 and the prevention referral to which the participant has been referred (i.e., modeling (Lemelin et al., 2009)); (DeFur et al., 2007) an accom- panying matched photo personalized to the participant's age, race, and gender; (Harper and Lynch, 2007) action details providing a clear and simple summary of information the caller would need to access the prevention referral(s); and (Goldman and Smith, 2002) motivation and preparation information describing why the preventive health service was important and suggesting questions to ask when contacting the referral. All content adhered to health literacy and health communication best practices, and was written at a Flesch-Kincaid 4th Grade Level. The tailored personal story addressed up to three cancer-control needs. 2.4.3. Navigator/health coach Navigators (called “coaches” to participants) explained each needed preventive health service and its importance, answered callers' questions, elicited and addressed barriers to action with a 1 Recommendations for Pap testing changed during the study period. In the first four months of recruitment, women ages 18–26 were offered referrals if they had not Pap test in the last year. 71M.W. Kreuter et al. / Preventive Medicine 91 (2016) 70–75
  • 3. variety of strategies including arranging transportation, making appointments, and providing verbal reminders to the participant. Two women similar in age to the average 2-1-1 caller were given extensive training by a counseling psychologist and a social worker who had previously worked as a navigator. Training consisted of mastering health content for the six focus areas, problem-solving techniques, counseling concepts and approaches, and research protocol and documentation. Many cycles of rehearsal and feedback preceded the launch of the intervention, after which navigator calls were recorded, monitored and discussed. Participants received their first navigator call within one working day of completing the baseline assessment and receiving the verbal referral. The initial call introduced the navigator, explained the navigation relationship and sought to establish rapport. Then a flyer was mailed to the participant containing the name, picture and contact information for their navigator. The navigator re- contacted the participant soon after to ensure receipt of the flyer and follow up on any issues since their initial conversation. Telephone interactions continued for up to four months with the number, length and frequency of calls determined by participants' needs, interest and willingness. Either navigator or participant could initiate a call. On average, participants engaged in three calls with a navigator (M = 3.1, SD = 1.8), which lasted slightly longer than five minutes each (M = 16.2 min total, SD = 31.5). 3. Measures 3.1. Unmet basic needs The baseline survey assessed participants' perceived likelihood that their safety, housing, food, and financial needs would be met in the next month. These items were adapted from Segal's (Segal et al., 1993) Personal Empowerment scale and another scale developed by Blazer (Blazer et al., 2005). Five questions beginning with: “How likely is it that…” included “…someone will threaten to hurt you physically in the next month?”, “…you will have a place to stay all of next month?”, “…you and others in your home will get enough to eat in the next month?”, “…you will have enough money in the next month for necessities like food, shelter and clothing?”, and “…you will have enough money in the next month to deal with unexpected expenses?” (1 = very unlikely to 4 = very likely). Participants were also asked to rate the safety of their neighborhood (1 = very unsafe to 4 = very safe) and the amount of space in their home given the number of people living there (1 = not enough living space, 2 = about the right amount, 3 = more than enough). From these items, we created seven dichoto- mous variables. If a need was very unlikely or unlikely to be met in the next month, it was considered unmet (0), otherwise it was consid- ered met (Fiscella and Williams, 2004); living in an “unsafe” or “very unsafe” neighborhood and reporting “not enough living space” were also considered unmet (0) basic needs. 3.2. Contacting referrals At 1 month follow-up, participants were asked if they remembered receiving a health referral (yes/no/don't remember). Those who re- membered were asked if they had contacted any of the specific health referral(s) they received (yes/no/don't remember). Those who did not remember receiving a health referral were considered to have not contacted any referrals. 3.3. Covariates Participants' gender, race/ethnicity, education, marital status, in- come, employment status and general health status were obtained at baseline (Table 1). For ease of LCA interpretation, many variables were dichotomized (e.g., self-rated health: very good/excellent vs good/fair/ poor). 3.4. Reasons for calling 2-1-1 For each participant, up to 3 reasons for calling 2-1-1 were recorded. Reasons were collapsed into eight categories: utilities, rent/mortgage, housing, food assistance, employment, home and family, health, and other. 3.5. Data analyses Analyses were conducted March–July 2015. Latent class analysis (LCA) is used to find groups of cases in multivariate categorical data (Lanza and Rhoades, 2013). We used a two-step approach for the anal- ysis. First, we examined whether the sample was heterogeneous with regard to participant's basic needs using a LCA. The LCA was based on the seven dichotomous measures of unmet basic needs. PROC LCA in SAS v9.2 was used to estimate a series of latent class models from 2 to 4 classes to identify distinct subgroups of participants with different basic needs. Akaike Information Criterion (AIC) and the sample-size Table 1 Participant characteristics; 2010–2012 Missouri 2-1-1. Mean age (years; SD) 43.9 (13) Gender (n = 1090) % Female 85.6 Race/ethnicity (n = 1085) African-American 59.2 White 30.1 Other 10.5 Income (n = 1054) b $10,000 47.1 Education (n = 1089) Less than high school 28.7 Employment (n = 1090) Employed 18.9 Marital status (n = 1089) Never married 38.8 Children in home (n = 1090) Child aged b18 years living in home 50.7 Health insurance (n = 1089) None 38.8 Public (Medicare or Medicaid) 36.6 Private 7.7 More than one type 13.4 Self-rated general health (n = 1088) Poor 18.2 Fair 31.8 Good 30.3 Very good 14.3 Excellent 5.4 Service request from 2‐1-1 (n)a Bills (794) 72.8 Home and family (457) 42.1 Employment (95) 8.7 Health (97) 8.9 Housing (59) 5.4 Other (134) 12.3 Needed preventive health service (n)b Colonoscopy (406) 53.5 Mammogram (570) 65.8 HPV for self (119) 76.5 HPV for girl aged b18 years (232) 66.4 Pap test (932) 26.8 Smoking cessation (1090) 62.5 Smokefree home policy (1090) 54.4 Note: Values may not equal 100% due to missing data; “Don't know” and “Refused” responses were excluded from analysis. GED = General Educational Development test; HPV = human papilloma virus. a Percent of total (N = 1090). Total percent is N100 because participants could have more than one service request. b Percent is calculated as percent of eligible. Number eligible is in parentheses. 72 M.W. Kreuter et al. / Preventive Medicine 91 (2016) 70–75
  • 4. adjusted Bayesian Information Criterion (BIC) were calculated. A lower AIC or BIC value suggests a better fitting and more parsimonious model. After determining the optimal number of latent classes based on both fit indices and the conceptual interpretability of each class solution, the fol- lowing covariates were added to the LCA model: gender, income, race, age, education, employment status, having a child in the home, marital status (never married vs. ever married), and self-rated health. Non-sig- nificant covariates were removed from the final model. Similar to a mul- tinomial regression model, the LCA regresses the probability of class membership on each covariate. Beta coefficient tests for predicting la- tent class membership by covariates and odds ratios and 95% confidence intervals were calculated. Second, participants were classified into one of the subgroups resulting from the LCA and we examined descriptive statistics by class. For each latent class separately, chi-square analyses were used to exam- ine the association between calling a referral and study group. Then we estimated a binary logistic regression model predicting the probability of calling any health referral by latent class assignment, intervention group (verbal referral only, verbal referral + tailored reminder, verbal referral + navigation), and the interaction between the two variables. Odds ratios (OR) and 95% confidence intervals (CI) of the interaction are reported. 4. Results 4.1. Participant characteristics Participant characteristics did not significantly differ across the three intervention groups. Participant characteristics are shown in Table 1; most participants were women, African American or White, and report- ed very low income. Participants' mean age was 43.9 years. Most partic- ipants had called 2-1-1 seeking help with bills (73%) and/or home and family needs like food, clothing, and household goods (42%). Rates of unmet cancer prevention needs varied by the percent eligible for each service. Ten percent of the analysis sample had 4 or more needs, but only received three referrals, consistent with 211 procedures. 4.2. Identifying latent classes of unmet basic needs Fit statistics for the 2 to 4 class models are shown in Supplement Table 1, which support a three class solution. The frequency of the seven binary basic needs is shown in Table 2 for each class. Compared to the other latent classes, Class 1 (C1) had relatively few unmet basic needs and comparatively greater financial security. Class 2 (C2) had rel- atively greater unmet needs. Class 3 (C3) had specific unmet needs for money. 4.3. Relationships between covariates and latent classes The final LCA model included race, marital status, income, employ- ment status, having a child in the home, and self-rated health. Odds ra- tios and 95% confidence intervals for covariates of latent class membership are shown in Table 3. Participants in latent class C1 were less likely to be white and earn less than $10,000/year, and were more likely to be employed, have a child in the home, and report better health compared with those in C3 (Table 3). Participants in latent class C2 were significantly more likely to have a child in the home compared with those in C3. Participants in latent class C2 were more likely to have never been married and earn less than $10,000/year, and less likely to be employed or in good health compared with C1 (Table 3). 4.4. Predicting health referral contacts by latent class and intervention group Table 4 shows the results of the logistic regression analysis. Of the participants in C1, those who were assigned to receive the tailored or navigator intervention were more likely to contact a health referral than those who received a verbal referral only. The difference between the tailored and navigation interventions was not statistically signifi- cant (Table 4). Of the participants in C2 and C3, those assigned to receive the navigator intervention were more likely to contact a health referral than those who received a tailored reminder or verbal referral only (Table 4). Table 2 Percent unmet basic needs in full study sample and by latent class; 2010–2012 Missouri 2-1-1. Basic needs items Full sample (n = 1081) C1: Fewer needs (n = 292) C2: Many needs (n = 228) C3: Money needs (n = 561) Unlikely to have enough money for unexpected expenses in the next montha 89.2 65.4 100.0 97.2 Unlikely to have enough money for necessities in the next montha 70.4 2.4 98.3 94.5 Not enough living space in my home 27.0 24.0 97.4 0 Neighborhood is unsafe from crimeb 21.6 23.6 27.9 48.5 Unlikely to get enough to eat in the next montha 15.8 1.7 28.1 18.2 Unlikely to have a place to stay all of next montha 16.0 5.5 26.8 17.1 Likely to be threatened physically in the next monthc 4.8 3.1 10.1 3.6 a Percent “unlikely” + “very unlikely”. b Percent “unsafe” + “very unsafe”. c Percent “very likely” + “somewhat likely”. Table 3 Odds ratios for covariates for latent class membership and p-values of beta parameter tests; 2010–2012 Missouri 2-1-1. Latent class (C1 vs C3) (C2 vs C3) (C2 vs C1) p-Valuea White vs. African American/other 0.45 (0.27–0.75) 0.69 (0.39–1.25) 1.55 (0.83–2.90) 0.0041 Never married vs. ever married 0.74 (0.47–1.15) 1.42 (0.75–2.69) 1.94 (1.11–3.38) 0.0261 b$10,000 vs. ≥$10,000 0.64 (0.42–0.98) 1.06 (0.66–1.69) 1.66 (1.04–2.64) 0.0480 Employed vs. other 1.77 (1.09–2.86) 0.69 (0.35–1.34) 0.39 (0.21–0.72) 0.0028 Child in home vs. none 2.29 (1.36–3.85) 4.16 (1.91–9.03) 1.82 (0.77–4.27) b0.0001 Self-rated health (Very good/excellent vs. good/fair/poor) 1.90 (1.17–3.08) 0.58 (0.29–1.17) 0.31 (0.16–0.58) b0.0001 C1 = Fewer needs; C2 = Many needs; C3 = Money needs. a p-Value from the significance test for the multinomial logistic regression coefficient predicting latent class membership. 73M.W. Kreuter et al. / Preventive Medicine 91 (2016) 70–75
  • 5. 5. Discussion We observed three distinct patterns of unmet basic needs within this low-income population. Common intervention approaches pro- moting preventive health services were differentially effective among participants with different patterns of unmet basic needs. Our findings reinforce those of previous studies that have shown that unmet basic needs are heterogeneous in economically vulnerable populations (DeWilde, 2004; Mayer and Jencks, 1989; Roy and Raver, 2014). In our sample of nearly universally low-income adults, there was wide variability in the experience of unmet basic needs, especially in the areas of financial, housing, and food security. The use of latent class analysis is a strength of the study. In much of the research examin- ing multiple indicators of poverty, investigators have created indices of disadvantage by summing the number of needs or harmful exposures a person experiences. While there is clear evidence that such cumulative disadvantage has harmful and dose-response effects on human health (Bauman et al., 2006; Lemelin et al., 2009; Johnson-Lawrence et al., 2015), a simple additive approach treats different types of needs as in- terchangeable. Latent class analysis provides additional information by identifying underlying subgroups that are mutually exclusive and differ qualitatively on the types and patterns of needs experienced (DeWilde, 2004; Moisio, 2004; Rose et al., 2009). Our study extends previous work by demonstrating for the first time that the effectiveness of different interventions targeted to low SES pop- ulations can vary by basic-needs profiles. The relatively greater effec- tiveness of the navigator intervention among participants with the most unmet basic needs reinforces a foundational aim of navigation: To improve health outcomes by reducing barriers experienced by low- SES and minority individuals (Paskett et al., 2011). Although the naviga- tion intervention tested in this study was not designed to address basic needs (Kreuter et al., 2012), the flexibility and client-centric orientation of this approach likely presents many opportunities for navigators to help in addressing basic needs (Jean-Pierre et al., 2011; Ferrante et al., 2011). The relative ineffectiveness of the tailored intervention among those with multiple unmet basic needs may be due to the fact that these indi- viduals are less likely to pay attention to the materials or even remem- ber receiving them (Capelletti et al., 2015), perhaps because they are focused on more pressing problems, fear that the mailed reminder is a bill, or are living in temporary housing and do not receive mail regularly. For participants with fewer basic needs (C1), mailed tailored reminders were just as effective as a navigator in getting participants to contact a health referral. Given that navigator interventions are generally more intensive, time consuming, and costly (Jandorf et al., 2013), this finding has considerable practical implications. Because intervention outcomes differ by participants' basic needs, finding new ways to quickly and accurately identify subgroups of eco- nomically vulnerable individuals could help in targeting health dispari- ty-reducing strategies in the same way that personalized medicine is revolutionizing treatment protocols for many diseases (Chadwell, 2013). More research is needed to identify a minimal set of basic needs or other indicators of deprivation that can be efficiently and reli- ably measured and that predict a better (or lesser) response to different evidence-based, health promoting interventions. It may also be useful to determine whether the types of health needs vary by basic need profile, since some interventions may be more effective than others in stimulat- ing responses to referrals for certain health behaviors and services (Kreuter et al., 2012). A possible limitation of the study is the relatively small number of basic needs we measured. Our brief assessment included only 1 or 2 items each for housing, food, safety and financial needs. It's possible that additional indicators within these categories (e.g., housing quality) and/or additional categories (e.g., sleep) could alter or enrich the latent classes that emerged from our analyses. Recent studies have tested nav- igation-type interventions that address a similar set of basic needs as in our study, as well as other social needs like child care, education and job opportunities (Haas et al., 2004; Garg et al., 2015). Like our findings, they demonstrate success in improving health or other outcomes in part by linking individuals with existing community resources. It is not clear how such interventions would work in developing countries or low-resource contexts where such help may be less available. Future research should continue to explore a broader set of basic and social needs variables and the effects of hybrid health interventions that ad- dress them. Because participants who were lost to follow-up between the base- line and 1-month assessment differed on several demographic vari- ables, we repeated the latent class analysis with the baseline only sample. Results showed the same number and interpretation of latent classes as the 1-month sample (data not shown). The equivalence across samples suggest stability of the classes. 6. Conclusion There is increasing recognition that unmet basic needs are strongly and independently associated with a range of negative health outcomes in vulnerable populations. Newer still are findings suggesting that al- though unmet basic needs can undermine certain prevention interven- tions (Capelletti et al., 2015), the likelihood of prevention interventions working increases when basic needs are addressed (Thompson et al., 2016). Findings from the current study advance our understanding by comparing effects of multiple interventions among subgroups of low- income adults with different sets of unmet basic needs. Scientific inqui- ry has only scratched the surface in this promising area of health dispar- ities research and practice. If further research confirms and extends the findings reported here, the public health implications would be consid- erable, requiring fundamentally different intervention approaches. Supplementary data to this article can be found online at http://dx. doi.org/10.1016/j.ypmed.2016.08.006. Conflict of interest All authors have no conflicts of interest. Financial disclosures All authors have no financial disclosures. Table 4 Contacted any cancer control referral at 1-month follow-up by latent classes of unmet basic needs assessed at baseline; 2010–2012 Missouri 2-1-1. Latent classes of unmet basic needs % contacted a referral OR (95% CI) All Verbal referral Tailored reminder Navigator χ2 p-value Tailored reminder vs. verbal referral Navigator vs. verbal referral Navigator vs. tailored reminder C1 (n = 292; 26.8%) 22.3% 12.1% 25.2% 30.2% 0.0083 2.45 (1.16–5.15) 3.14 (1.47–6.71) 1.28 (0.68–2.42) C2 (n = 228; 20.9%) 26.3% 18.8% 21.2% 39.2% 0.0088 1.16 (0.52–2.57) 2.78 (1.30–5.95) 2.40 (1.19–5.95) C3 (n = 561; 51.5%) 23.7% 19.3% 20.7% 31.1% 0.0131 1.09 (0.66–1.82) 1.89 (1.18–3.03) 1.73 (1.08–2.78) Note. The number of participants assigned to latent classes does not equal 100% due to missing data. C1 = Fewer needs; C2 = Many needs; C3 = Money needs. 74 M.W. Kreuter et al. / Preventive Medicine 91 (2016) 70–75
  • 6. Acknowledgments This study was supported by funding from the National Cancer Insti- tute (P50-CA095815); however, the funder had no involvement with the design, conduct, analysis or reporting of the study. We thank the 2-1-1 Information Specialists and callers who participated in this study. References Fiscella, K., Williams, D., 2004. Health disparities based on socioeconomic inequities: im- plications for urban health care. Acad. Med. 79 (12), 1139–1147. DeFur, P.L., Evans, G.W., Cohen Hubal, E.A., Kyle, A.D., Morello-Frosch, R.A., Williams, D.R., 2007. Vulnerability as a function of individual and group resources in cumulative risk assessment. Environ. Health Perspect. 115 (5), 817–824. Harper, S., Lynch, J., 2007. Trends in socioeconomic inequalities in adult health behaviors among U.S. states, 1990–2004. Public Health Rep. 122, 177–189 (March–April). Goldman, D.P., Smith, J.P., 2002. Can patient self-management help explain the SES health gradient? Proc. Natl. Acad. Sci. U. S. A. 99 (16), 10929–10934. Lantz, P.M., Lynch, J.W., House JS, et al., 2001. Socioeconomic disparities in health change in a longitudinal study of US adults: the role of health-risk behaviors. Soc. Sci. Med. 2001 (53), 29–40. McDonough, P., Sacker, A., Wiggins, R.D., 2005. Time on my side? Life course trajectories of poverty and health. Soc. Sci. Med. 61, 1795–1808. DeWilde, C., 2004. The multidimentional measurement of poverty in Belgium and Britain: a categorical approach. Soc. Indic. Res. 68, 331–369. Blazer, D., Sachs-Ericsson, N., Hybels, C., February 2005. Perception of unmet basic needs as a predictor of mortality among community-dwelling older adults. Am. J. Public Health 95 (2), 299–304. Sachs-Ericsson, N., Schatschneider, C., Blazer, D., 2006. Perception of unmet basic needs as a predictor of physical functioning among community-dwelling older adults. J. Aging Health. 18 (6), 852–868 December. Blazer, D., Sachs-Ericsson, N., Hybels, C., 2007. Perception of unmet basic needs as a pre- dictor of depressive symptoms among community-dwelling older adults. J Gerontol. Med. Sci. 62 (2), 191–195 February. Fitzpatrick, T., Rosella, L.C., Calzavara, A., et al., 2015. Looking beyond income and educa- tion: socioeconomic status gradients among future high-cost users of health care. Am. J. Prev. Med. 49 (2), 161–171. U.S. Census Bureau, 2015. Current Population Survey. Annual Social and Economic Sup- plement Available at https://www.census.gov/hhes/www/poverty/about/overview/, accessed April 1, 2016 . Feeding America 2016. Food Insecurity in the United States. Available at: http://map. feedingamerica.org/county/2013/overall, accessed April 1, 2016. Desmond, M., 2015. Unaffordable America: Poverty, housing and eviction. Institute for Research on Poverty, Fast Focus No. 22-2015 March . Mayer, S.E., Jencks, C., 1989. Poverty and the distribution of material hardship. J. Hum. Resour. XXIV (1), 88–114. Iceland, J., Bauman, K.J., 2007. Income poverty and material hardship: how strong is the association? J. Socio-Econ. 36, 376–396. Daily, L.S., 2012. Health research and surveillance potential to partner with 2-1-1. Am. J. Prev. Med. 43 (6S5), S422–S424. Kreuter, M.W., 2012. Reach, effectiveness, and connections: the case for partnering with 2-1-1 to eliminate health disparities. Am. J. Prev. Med. 43 (6S5), S420–S421. Thompson, T., Kreuter, M.W., Boyum, S., 2016. Promoting health by addressing basic needs: effect of problem resolution on contacting health referrals. Health Educ. Behav. 43 (2), 201–207. Purnell, J.Q., Kreuter, M.W., Eddens, K.S., et al., 2012. Cancer control needs of 2-1-1 callers in Missouri, North Carolina, Texas, and Washington. J. Health Care Poor Underserved 23, 752–767. Kreuter, M.W., Eddens, K.S., Alcaraz, K.I., et al., 2012. Use of cancer control referrals by 2-1- 1 callers: a randomized trial. Am. J. Prev. Med. 43 (6S5), S425–S434. Eddens, K., Kreuter, M.W., Archer, K., 2011. Proactive screening for health needs in United Way's 2-1-1 information and referral service. J. Soc. Serv. Res. 37 (2), 113–123. Segal, S., Silverman, C., Temkin, T., 1993. Empowerment and self-help agency practice for people with mental disabilities. Soc. Work 38 (6), 705–712 November. Lanza, S.T., Rhoades, B.L., 2013. Latent class analysis: an alternative perspective on sub- group analysis in prevention and treatment. Prev. Sci. 14, 157–168. Roy, A.L., Raver, C.C., 2014. Are all risks equal? Early experiences of poverty-related risk and children's functioning. J. Fam. Psychol. 28 (3), 391–400. Bauman, L.J., Silver, E.J., Stein, R.E.K., 2006. Cumulative social disadvantage and child health. Pediatrics 117 (4), 1321–1328. Lemelin, E.T., Roux, A.V.D., Frankling, T.G., et al., 2009. Life-course socioeconomic positions and subclinical atherosclerosis in the multi-ethnic study of atherosclerosis. Soc. Sci. Med. 68, 444–451. Johnson-Lawrence, V.J., Galea, S., Kaplan, G., 2015. Cumulative socioeconomic disadvan- tage and cardiovasular disease mortality in the Alameda County Study 1965 to 2000. Ann. Epidemiol. 25, 65–70. Moisio, P., 2004. A latent class application to the multidimensional measurement of pov- erty. Qual. Quant. 38, 703–717. Rose, R., Parish, S., Yoo, J., 2009. Measuring material hardship among the US population of women with disabilities using latent class analysis. Soc. Indic. Res. 94, 391–415. Paskett, E., Harrop, J., Wells, K., 2011. Patient navigation: an update on the state of the sci- ence. CA Cancer J. Phys. 61 (4), 237–249. Jean-Pierre, P., Hendren, S., Loader, S., et al., 2011. Understanding processes of patient navigation to reduce disparities in cancer care: perspectives of trained navigators from the field. J. Cancer Educ. 26 (1), 111–120. Ferrante, J.M., Wu, J., Dicicco-Bloom, B., 2011. Strategies used and challenges faced by a breast cancer patient navigator in an urban underserved community. J. Natl. Med. Assoc. 103 (8), 729–734. Capelletti, E., Kreuter, M., Boyum, S., Thompson, T., 2015. Basic needs, stress and the ef- fects of tailored health communication in vulnerable populations. Health Educ. Res. 30 (4), 591–598. Jandorf, L., Stossel, L.M., Cooperman, J.L., et al., 2013. Cost analysis of a patient navigation system to increase screening colonoscopy adherence among urban minorities. Cancer 119, 612–620. Chadwell, K., 2013. Clinical practice on the horizon: personalized medicine. Clin. Nurse Specialist 27 (1), 36–43. Haas, J., Phillips, K., Sonneborn, D., et al., July 2004. Variation in access to health care for different racial/ethnic groups by the race/ethnic composition of an individual's coun- ty of residence. Med. Care 42 (7), 707–714. Garg, A., Toy, S., Tripodis, Y., Silverstein, M., Freeman, E., 2015. Addressing social determi- nants of health at well child care visits: a cluster RCT. Pediatrics 135 (2), e296–e304. 75M.W. Kreuter et al. / Preventive Medicine 91 (2016) 70–75