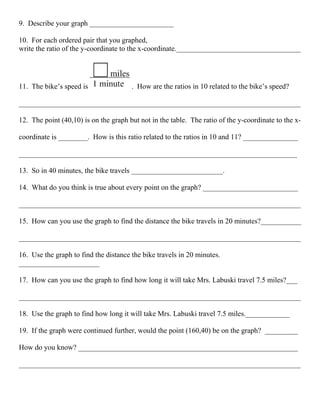
Name __________________________________ Date __________________
Mrs. Labuski / Mrs. Portsmore Period ________ Unit 7 Lesson 4 Ratios, Tables, Graphs
                                              OC 5-2

Mrs. Labuski is training for a triathlon. She rides her bike at a constant speed.
The table shows the distance that she travels on her bike in various amounts of time.
                  Distance (mi)        1        3                   12
                   Time (min)          4                 36                  60
1. Use the numbers in the first column of the table to write a ratio of distance to time.________
2. How far does the bike travel in 1 minute? ______________________________________
3. Use your answer to write another ratio of distance to time.____________________________
4. The ratios in 1 & 3 are ________________________________________________________
5. How can you use your answer to 2 to find the distance the bike travels in a given number of
minutes? _____________________________________________________________________
6. Complete the table. What are the equivalent ratios shown in the table?


7. Write the information in the table as ordered pairs.
Use Time as the x-coordinates and Distance as the y-coordinates. (careful!!!)

                       (1,4) (3,_____) (_____,36) (12,_____) (_____,60)

8. Graph the ordered pairs and connect the points
9. Describe your graph _______________________

10. For each ordered pair that you graphed,
write the ratio of the y-coordinate to the x-coordinate.__________________________________


11. The bike’s speed is                . How are the ratios in 10 related to the bike’s speed?

_____________________________________________________________________________

12. The point (40,10) is on the graph but not in the table. The ratio of the y-coordinate to the x-

coordinate is ________. How is this ratio related to the ratios in 10 and 11? _______________

____________________________________________________________________________

13. So in 40 minutes, the bike travels _________________________.

14. What do you think is true about every point on the graph? __________________________

_____________________________________________________________________________

15. How can you use the graph to find the distance the bike travels in 20 minutes?___________

_____________________________________________________________________________

16. Use the graph to find the distance the bike travels in 20 minutes.
______________________

17. How can you use the graph to find how long it will take Mrs. Labuski travel 7.5 miles?___

_____________________________________________________________________________

18. Use the graph to find how long it will take Mrs. Labuski travel 7.5 miles.____________

19. If the graph were continued further, would the point (160,40) be on the graph? _________

How do you know? ____________________________________________________________

_____________________________________________________________________________

Unit 7 lesson 4 ratios tables and graphs

  • 1.
    Name __________________________________ Date__________________ Mrs. Labuski / Mrs. Portsmore Period ________ Unit 7 Lesson 4 Ratios, Tables, Graphs OC 5-2 Mrs. Labuski is training for a triathlon. She rides her bike at a constant speed. The table shows the distance that she travels on her bike in various amounts of time. Distance (mi) 1 3 12 Time (min) 4 36 60 1. Use the numbers in the first column of the table to write a ratio of distance to time.________ 2. How far does the bike travel in 1 minute? ______________________________________ 3. Use your answer to write another ratio of distance to time.____________________________ 4. The ratios in 1 & 3 are ________________________________________________________ 5. How can you use your answer to 2 to find the distance the bike travels in a given number of minutes? _____________________________________________________________________ 6. Complete the table. What are the equivalent ratios shown in the table? 7. Write the information in the table as ordered pairs. Use Time as the x-coordinates and Distance as the y-coordinates. (careful!!!) (1,4) (3,_____) (_____,36) (12,_____) (_____,60) 8. Graph the ordered pairs and connect the points
  • 2.
    9. Describe yourgraph _______________________ 10. For each ordered pair that you graphed, write the ratio of the y-coordinate to the x-coordinate.__________________________________ 11. The bike’s speed is . How are the ratios in 10 related to the bike’s speed? _____________________________________________________________________________ 12. The point (40,10) is on the graph but not in the table. The ratio of the y-coordinate to the x- coordinate is ________. How is this ratio related to the ratios in 10 and 11? _______________ ____________________________________________________________________________ 13. So in 40 minutes, the bike travels _________________________. 14. What do you think is true about every point on the graph? __________________________ _____________________________________________________________________________ 15. How can you use the graph to find the distance the bike travels in 20 minutes?___________ _____________________________________________________________________________ 16. Use the graph to find the distance the bike travels in 20 minutes. ______________________ 17. How can you use the graph to find how long it will take Mrs. Labuski travel 7.5 miles?___ _____________________________________________________________________________ 18. Use the graph to find how long it will take Mrs. Labuski travel 7.5 miles.____________ 19. If the graph were continued further, would the point (160,40) be on the graph? _________ How do you know? ____________________________________________________________ _____________________________________________________________________________